
A Systemic View of Carbohydrate Metabolism in Rice to Facilitate Productivity
by
 , , , and
Woo-Jong Hong
1,† ,
,
Xu Jiang
1,†,
Seok-Hyun Choi
1,
Yu-Jin Kim
2,
Sun-Tae Kim
3,
Jong-Seong Jeon
1 and
Ki-Hong Jung
1,* 1
Graduate School of Biotechnology and Crop Biotech Institute, Kyung Hee University, Yongin 17104, Korea
2
Department of Life Science and Environmental Biochemistry, Life and Industry Convergence Research Institute, Pusan National University, Miryang 50463, Korea
3
Department of Plant Bioscience, Life and Industry Convergence Research Institute, Pusan National University, Miryang 50463, Korea
*
Author to whom correspondence should be addressed.
†
These authors contributed equally to this work.
Plants 2021, 10(8), 1690; https://doi.org/10.3390/plants10081690
Submission received: 15 July 2021
/
Revised: 9 August 2021
/
Accepted: 13 August 2021
/
Published: 17 August 2021
(This article belongs to the Special Issue 10th Anniversary of Plants—Recent Advances and Perspectives)
Abstract
:Carbohydrate metabolism is an important biochemical process related to developmental growth and yield-related traits. Due to global climate change and rapid population growth, increasing rice yield has become vital. To understand whole carbohydrate metabolism pathways and find related clues for enhancing yield, genes in whole carbohydrate metabolism pathways were systemically dissected using meta-transcriptome data. This study identified 866 carbohydrate genes from the MapMan toolkit and the Kyoto Encyclopedia of Genes and Genomes database split into 11 clusters of different anatomical expression profiles. Analysis of functionally characterized carbohydrate genes revealed that source activity and eating quality are the most well-known functions, and they each have a strong correlation with tissue-preferred clusters. To verify the transcriptomic dissection, three pollen-preferred cluster genes were used and found downregulated in the gori mutant. Finally, we summarized carbohydrate metabolism as a conceptual model in gene clusters associated with morphological traits. This systemic analysis not only provided new insights to improve rice yield but also proposed novel tissue-preferred carbohydrate genes for future research.
1. Introduction
As the world’s population increases and arable land decreases year by year, food security has become one of the most serious problems faced by all countries [1]. Rice (Oryza sativa L.) is not only a model crop plant but also the main staple cereal that supplies nearly half of the world’s calorie consumption. Hence, improving its production is of great strategic significance for ensuring food security and sustainable agricultural development [2]. As a sessile and autophototrophic plant, rice generates carbohydrates by photosynthesis. These photoassimilates undergo a series of ordered metabolic processes and play a pivotal role in different developmental stages, including vegetative, reproductive, and ripening. Additionally, carbohydrate reserves in mature seeds provide the primary energy intake of mankind and contribute energy during its germination [3]. This source-sink coordination that runs through the entire plant life cycle reflects the importance of carbohydrate metabolism in rice productivity improvement.
Extensive research has provided evidence for the generation of more metabolic substrates by manipulating the potential of “source”, resulting in increased rice yield. For instance, OsDWARF4 mutation showed an erect leaf phenotype that may enhance light capture for photosynthesis and finally lead to enhanced grain yield [4,5]. High grain yield was also observed in SNU-SG1 rice with the stay-green phenotype [6]. In addition to these, several attempts have been made to evaluate sugar transporters and key enzymes due to their vital role in carbohydrate metabolic processes. There are two main steps in sucrose translocation: phloem loading and unloading [7]. In the apoplastic loading model, one of the phloem loading steps, sucrose moves to the apoplasmic region and is loaded into phloem via Sucrose Transporters (SUTs) and Sugar Will Eventually be Exported Transporters (SWEETs) [8,9,10]. In post-phloem unloading, many studies have focused on sugar signaling after sucrose conversion into hexose by Hexokinase (HXK) family genes [11]. Moreover, the overexpression of Grain Incomplete Filling 1 (GIF1), which encodes a cell wall invertase under the control of its native promoter, increases grain production [12]. Similarly, in maize, the constitutive expression of Cell Wall Invertase (CWINV) elevates grain yield and starch content [13].
Great progress has been made in this field. However, there has not been any big success until now, such as the green revolution caused by the discovery and application of semi-dwarf rice cultivars [14]. One explanation could be the failure to establish giant “sink” cultivars with rich spikelets due to the grain-filling ability that could not match a large yield capacity [15]. Another explanation is that carbohydrate metabolism has been oversimplified [8]; recently, there have been several reports regarding its complexity. For example, there is considerable heterogeneity in phloem loading and transport even in one species [16], and invertase inhibitors capping invertase exist [17]. An understanding of the systematic perceptions of carbohydrate metabolism for further applications is still very limited.
With the rise of bioinformatics and the establishment of high-throughput gene expression methods such as microarrays or next-generation sequencing technology, new technologies and methods have afforded systemic insights into various biological research fields. Recently, transcriptomic analyses of carbon partitioning during rice grain filling and the relationship between high temperature and grain filling have been carried out [18,19]. Despite the importance of systematic insights on carbohydrate metabolism in tissues related to morphological traits, transcriptome analysis has only been focused on a type of tissue and developmental processes.
To provide systemic insights into carbohydrate metabolism in rice, a transcriptomic dissection of carbohydrate metabolism-related genes retrieved from the Kyoto Encyclopedia of Genes and Genomes (KEGG) database [20] and the MapMan toolkit [21], which cover genome-wide biological pathways, was performed. After clustering genes with meta-expression profiles of anatomical samples, a functional enrichment analysis was performed, and the results were validated by quantitative reverse transcription-polymerase chain reaction (qRT-PCR). Finally, a conceptual model of carbohydrate metabolism to enhance crop yield was constructed. This research can shed light on carbon metabolism and provide candidate genes to enhance crop yield of rice and other species.
2. Materials and Methods
2.1. Integration of Carbohydrate Metabolism Annotation Data
Carbohydrate metabolism-related genes were collected according to the annotation of the MapMan toolkit (version 3.6.0RC1) [21] and KEGG database (retrieved on 10 April 2021 [20]. First, 266 carbon metabolism genes were selected from the KEGG database. Carbohydrate metabolism-related genes with MapMan bincodes from the MapMan toolkit were selected next. In total, 787 genes had MapMan bincodes (1: photosynthesis; 2: major CHO; 3: minor CHO; 4: glycolysis; 6: gluconeogenesis/glyoxylate cycle; 7: OPP; 8: TCA/org.trasnformation; 25: C1-metabolism; 34: transporters related to sugar or sucrose). Finally, 872 genes from the two data sources were selected, and 866 genes annotated by the Rice Genome Annotation Project (RGAP) [22] were chosen for further analysis.
2.2. Collection and Clustering of Microarray Data
Transcriptomic data were downloaded to analyze the anatomical expression patterns of carbohydrate metabolism-related genes. The data source mentioned was used in previous reports [23]. The detailed information is discussed below. For the analysis of anatomical expression profiles, anatomical data were retrieved from the Rice Oligonucleotide Array Database (ROAD) [24]. For heatmap analysis of cluster H genes, data were downloaded from RMEDB [25]. Multiple Experiment Viewer (MeV) is a widely used program for visualizing transcriptome data and performing statistical analysis [26]. MeV (version 4.9.0) was used to visualize the microarray data. For the dissection of transcriptome data, a k-means clustering (KMC) algorithm embedded in MeV was applied using the same method as with the identification of late pollen-preferred genes in rice [27]. Adobe Illustrator CS6 was used to edit the heatmap images.
2.3. Functional Classification via Literature Search
To find the previously characterized functional roles of the 866 carbohydrate metabolism-related genes in anatomical clusters, the Overview of Functionally characterized Genes in Rice Online (OGRO) database (http://qtaro.abr.affrc.go.jp/ogro/table (accessed on 14 April 2021)) was used [28]. Information for 1949 functionally characterized genes is available in this database. As in a previous study [29], information on the 866 genes was parsed, and data were summarized using Excel 365 (version 16.0.14228.20158). Count numbers for the characterized genes were visualized using R Studio (version 1.4.1106) and ggplot2 R package (version 3.3.3) [30]. The detailed, functionally characterized gene information of the 866 carbohydrate metabolism-related genes is listed in Table S1.
2.4. Gene Ontology (GO) Enrichment Analysis
GO enrichment is commonly used to interpret the functional roles of large-scale transcriptomic data [31]. This study used the ROAD to find the GO terminology for each cluster (http://ricephylogenomics-khu.org/road/go_analysis.php, temporary homepage for updating (accessed on 7 May 2021)). To perform the GO enrichment analysis, the following criteria were applied: query number > 2, hyper p < 0.05, and fold enrichment value (query number/query expected number) > 2 [32]. Significant GO terms and integrated cluster information were selected from the transcriptome data analysis with each selected GO term. Finally, these data were visualized via R Studio (version 1.4.1106) and ggplot2 R package (version 3.3.3).
2.5. KEGG Enrichment Analysis
KEGG enrichment analysis was performed using R Studio and the clusterProfiler package [33]. To use the enrichKEGG function in this package, input data consisting of cluster information and Rice Annotation Project Database ID (https://rapdb.dna.affrc.go.jp/ (accessed on 7 May 2021)) [34] were used. In addition, “dosa” was chosen as the organism code, and the results were filtered out by applying an adjusted p-value cutoff < 0.05. For the visualization of the results, the dot-plot function in the package was used, and the figure was modified with the ggplot2 package (version 3.3.3).
2.6. RNA Extraction and qRT-PCR
To isolate RNA, plants were grown in a paddy field condition, as reported previously [35]. Samples were immediately frozen in liquid nitrogen, and total RNA was isolated using a TRIzol reagent (Invitrogen, Waltham, MA, USA) combined with an RNase Plant Mini Kit (Qiagen, Hilton, Germany; http://www.qiagen.com (accessed on 7 May 2021)) and DNase treatment. First-strand cDNA was synthesized using the SuPrimeScript RT Premix (with oligo(dT), 2×; GeNet Bio, Daegu, Korea). A qRT-PCR was performed, as reported previously [36]. For the gori knockout mutant, anthers from a paddy field-grown plant were collected to extract RNA. All primers used in this study are listed in Table S2.
2.7. Construction of the Conceptual Carbohydrate Metabolism Model
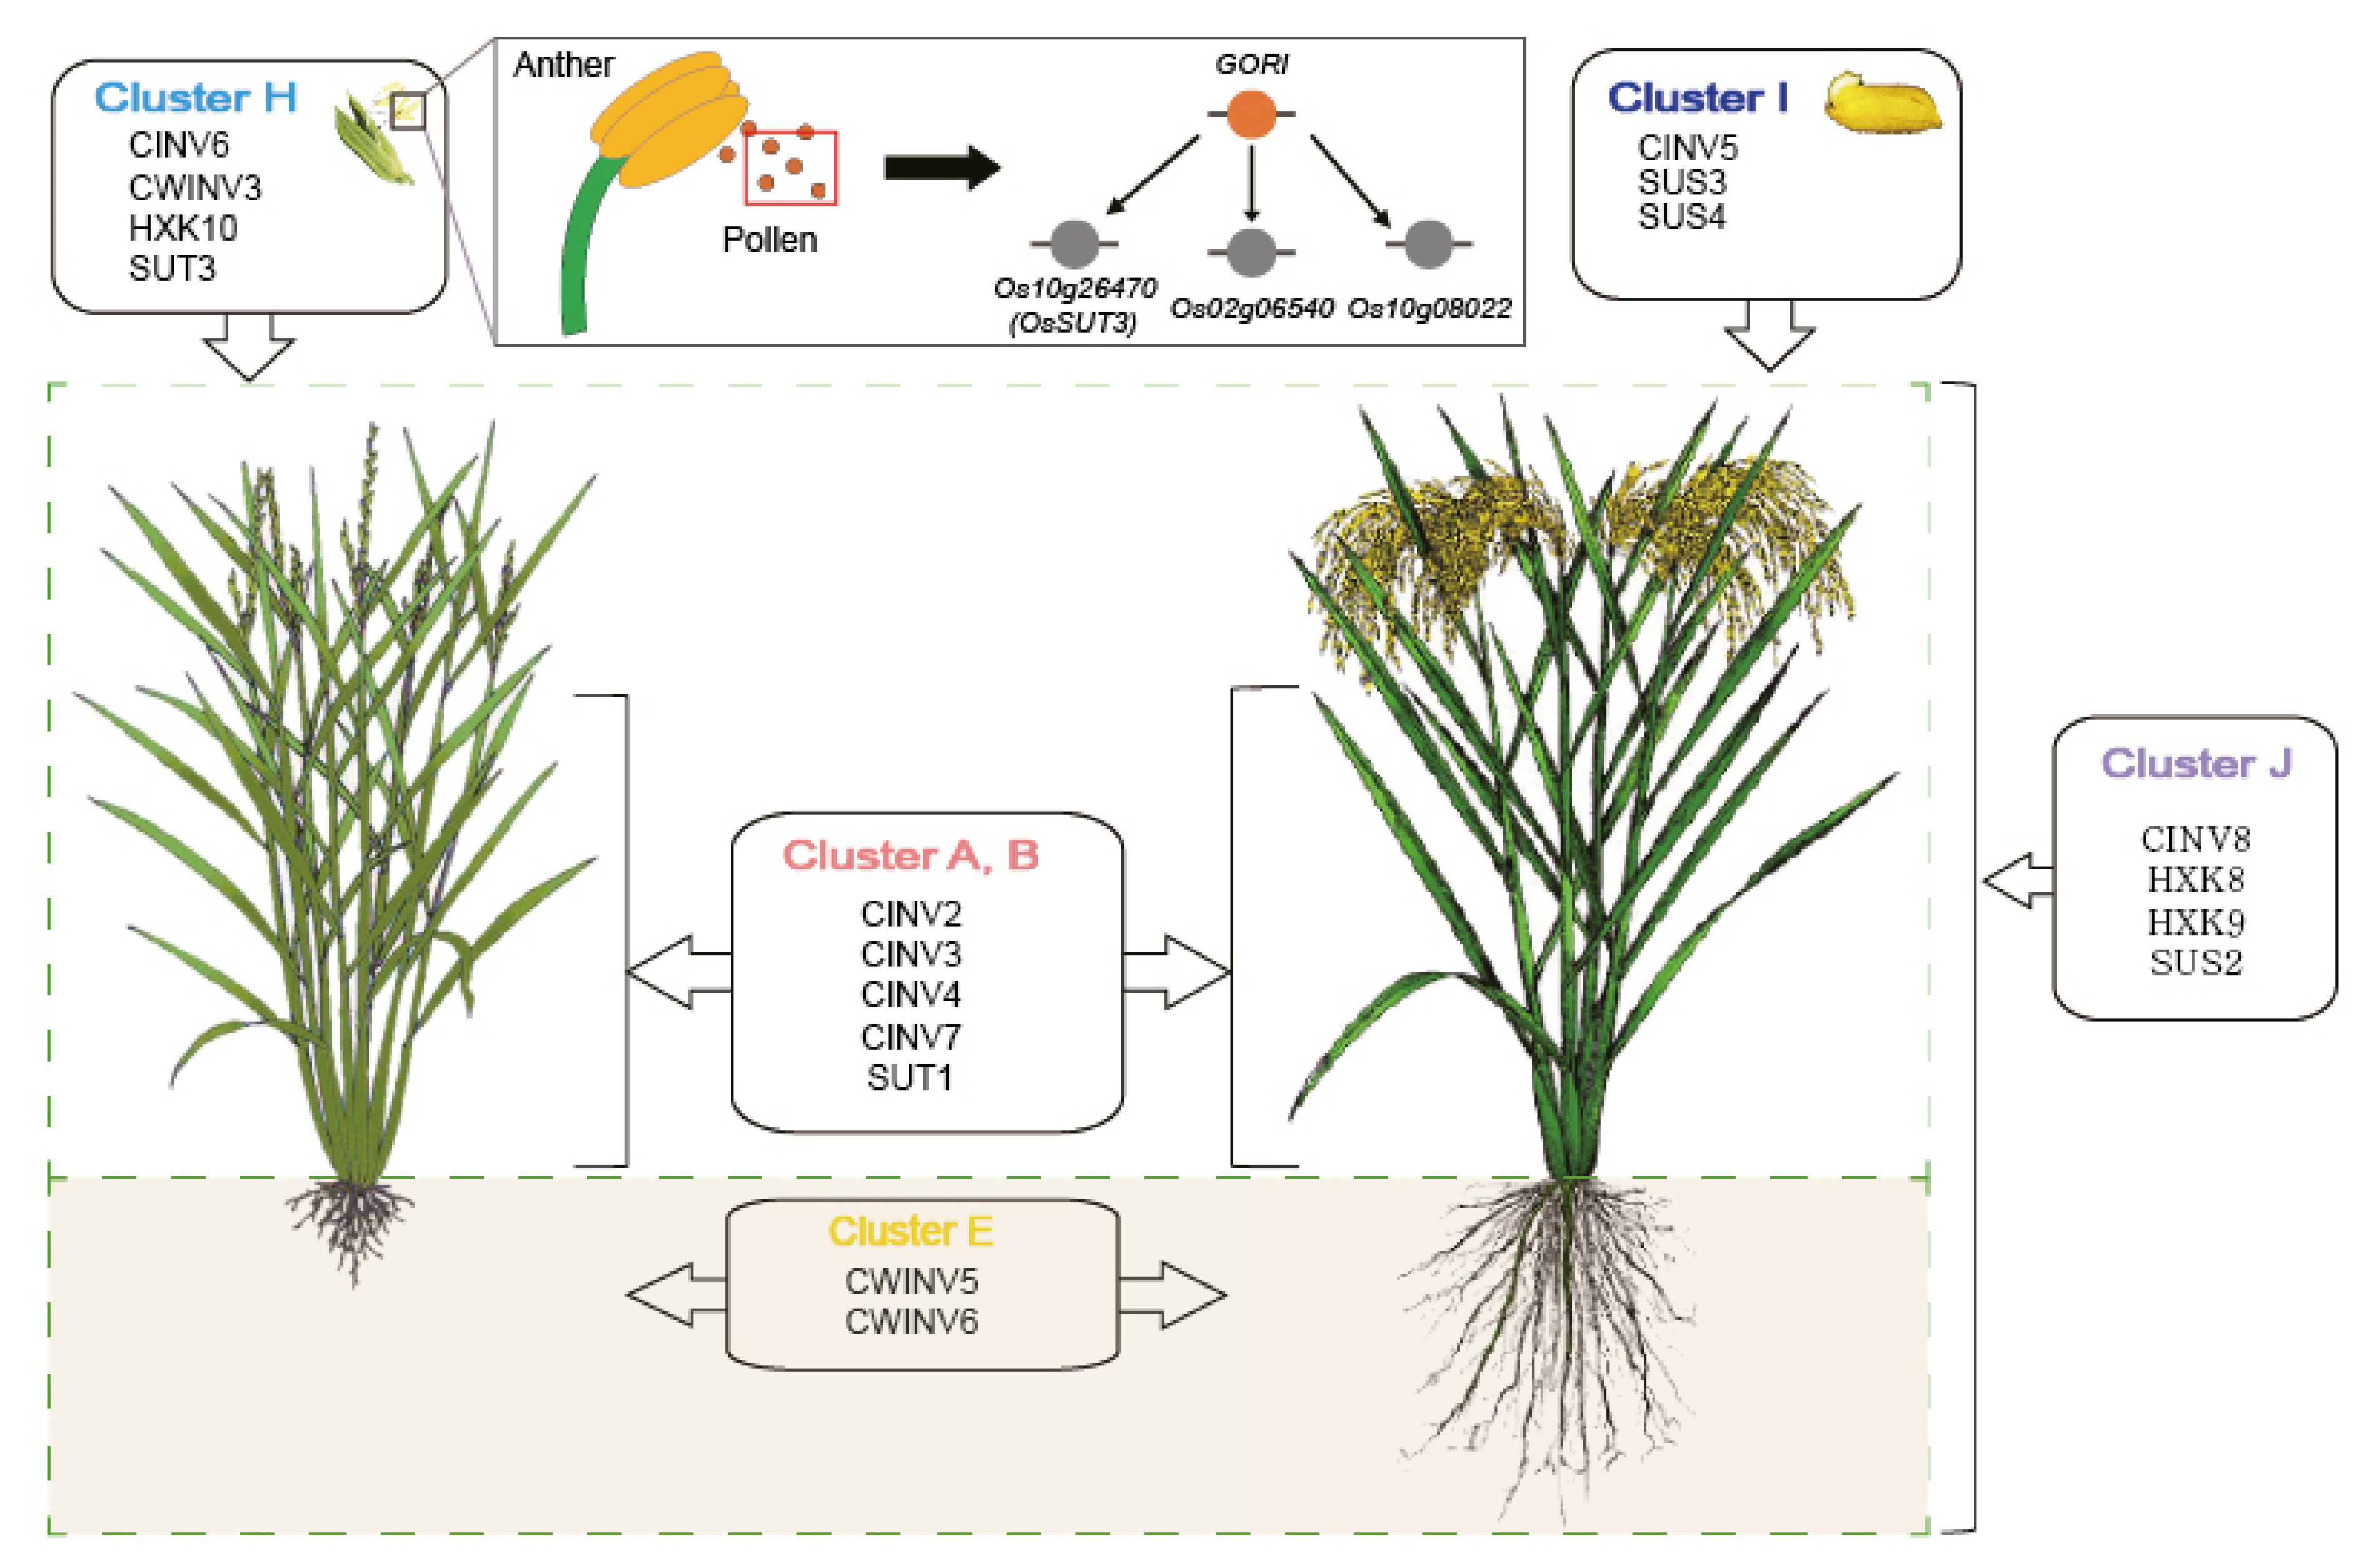
To generate a conceptual model focusing on the source-sink communication pathway, four key enzymes were selected: invertase (INV), sucrose synthesis (SUS), sucrose transporter (SUT), and hexokinase (HXK). Cluster information was then integrated by indicating an organ/tissue-preferred expression pattern: clusters A and B for leaf, cluster E for root, cluster H for pollen, cluster I for grain, and cluster J for ubiquitous expression patterns. Finally, the regulatory network between GORI and three cluster H genes was incorporated after adding qRT-PCR data between the gori knockout mutant and wild type anthers.
Rice plant images were downloaded from the International Rice Research Institute (https://www.flickr.com/photos/ricephotos/albums/72157643341257395) (accessed on 7 May 2021)), and the images were arranged using Adobe Illustrator CS6 (version 16.0.0).
3. Results
3.1. Identification of Genome-Wide Candidate Genes Related to Carbohydrate Metabolism
The MapMan toolkit and the KEGG database are useful information sources for the functional annotation of large-scale genes [20,21]. These two data sources were used to retrieve reliable carbohydrate metabolism-related genes. First, 266 genes involved in carbon metabolism pathways were found in the KEGG database. These genes were also searched in the MapMan toolkit, and genes in bincodes related to carbohydrate metabolism were identified: photosynthesis, major CHO, minor CHO, glycolysis, gluconeogenesis/glyoxylate cycle, OPP, TCA/organic acid transformation, and C1-metabolism. In addition to these bincodes, genes related to sugar or sucrose transport were added. Finally, 872 genes were collected using two public annotation sources. Because most expression data were available with locus IDs from the RGAP website (http://rice.plantbiology.msu.edu/ (accessed on 15 July 2021)), further analysis was performed on 866 candidate genes with RGAP locus IDs (Figure 1; Table S3).
3.2. Functional Analysis of the Characterized Carbohydrate Metabolism-Related Genes
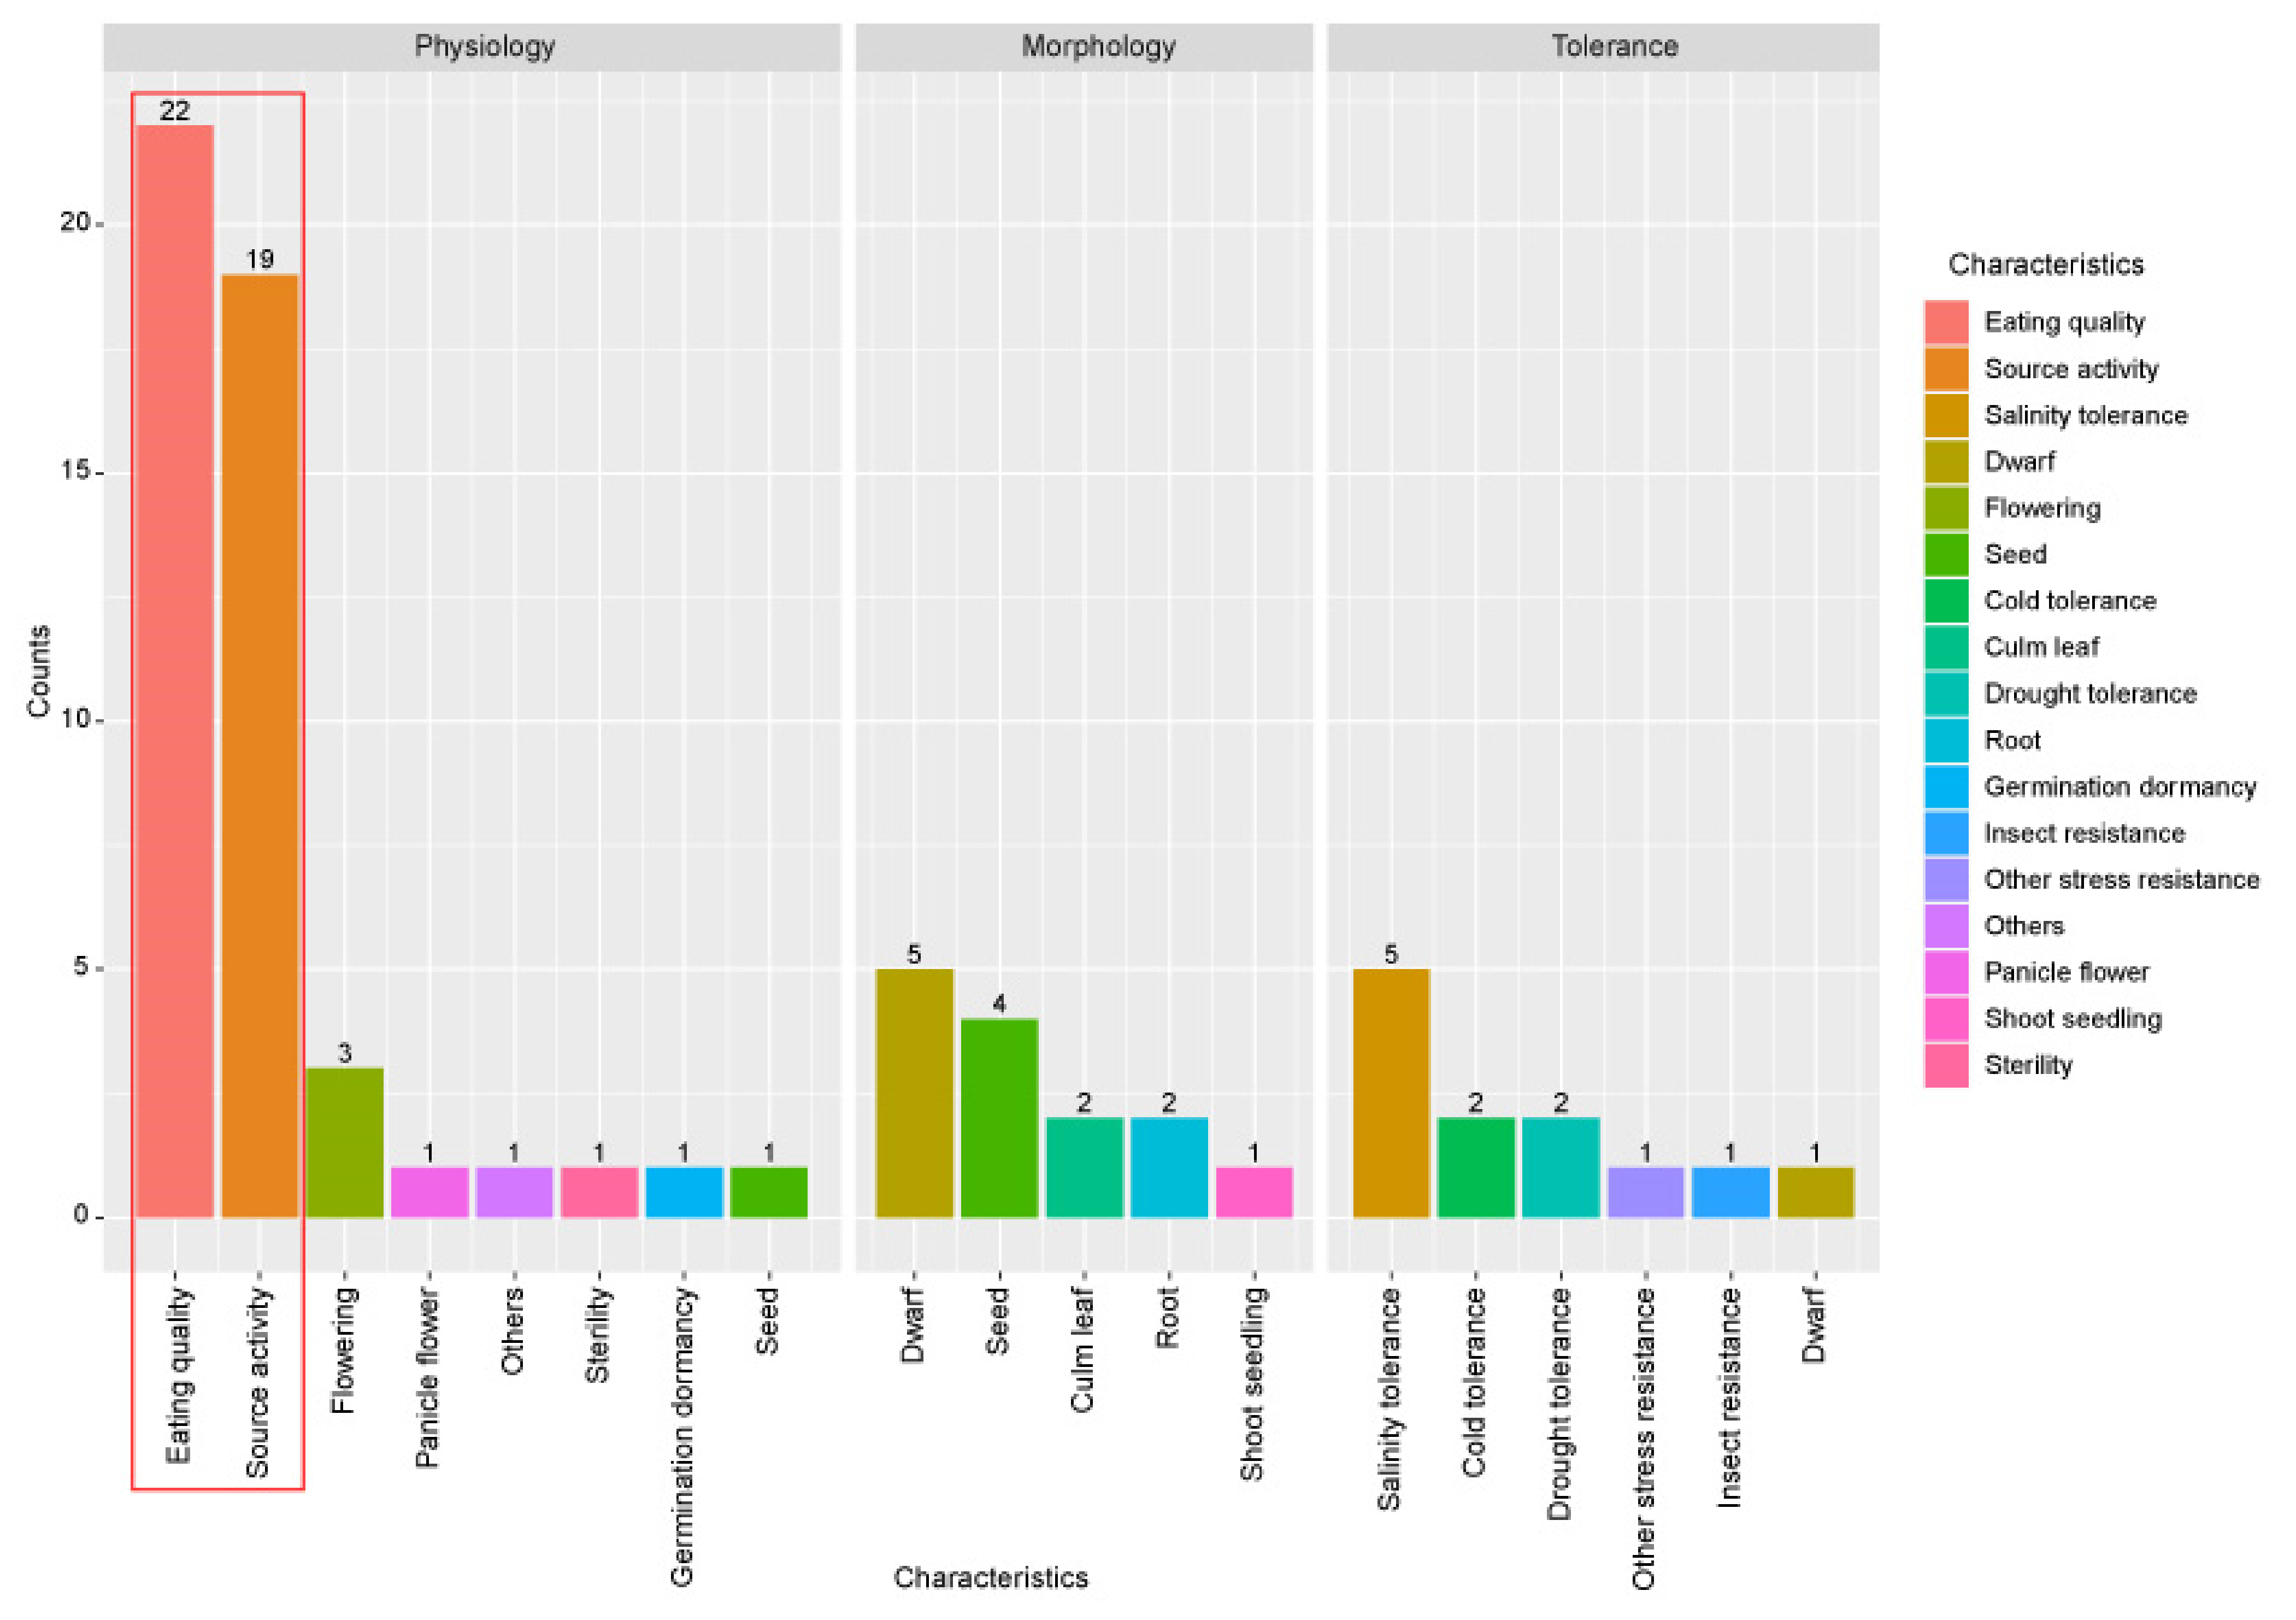
To analyze the functional significance of the 866 carbohydrate metabolism-related genes, functionally characterized genes were searched among them. To do this, the OGRO website was used [28]. Information of 1949 functionally characterized genes was then retrieved and classified according to major functional categories such as physiology, morphology, tolerance, or resistance. The functionally characterized roles for 76 of the 866 genes, including duplicate information about one locus, were identified (Figure 2). In the physiology category, eating quality was related to 22 genes, source activity was related to 19 genes, and flowering was related to three genes. In the morphology category, dwarf was related to five characterized genes, seed was related to four genes, and culm/leaf and root were related to two genes. Finally, regarding tolerance or resistance, salinity tolerance was related to five genes and cold and drought tolerance was related to two genes. As expected, the most frequently characterized functional category associated with carbon metabolism was eating quality in the physiology category, followed by source activity (Table 1). This result indicates that 866 carbohydrate genes might be useful candidates for enhancing the grain yield of rice associated with eating quality and source activity.
3.3. Anatomical Dissection of Carbohydrate Metabolism-Related Genes via Meta-Expression Analysis
To assess the functional roles of the 866 carbohydrate metabolism-related genes, meta-anatomical expression profiles consisting of 983 rice Affymetrix array anatomical sample data were first used [23]. Using the KMC algorithm, 729 genes with probes on the Affymetrix array were grouped into 11 anatomical clusters (Figure 3a; Table S4). This analysis could not be performed for 137 genes without probes on the Affymetrix array. Based on this analysis, carbohydrate metabolism-related genes may be involved in diverse morphological or physiological traits. For example, clusters A and B are closely associated with leaf and shoot development, cluster E is associated with root, clusters G and H are associated with pollen, and cluster I is associated with grain. In addition, cluster J, with ubiquitous expression patterns, might be related to the housekeeping function.
3.4. Functional Comparison and Enrichment Analysis of 11 Anatomical Clusters
The distribution of functionally characterized genes among clusters was searched to identify the relationships between anatomical expression patterns and the 11 clusters. Subsequently, 13 source activity genes were enriched in cluster A, which showed a leaf-preferred expression pattern. Similarly, 15 eating quality genes were in cluster I, which showed a grain-preferred expression pattern. Other clusters did not show a strong correlation between known functions and featured expression patterns (Figure S1).
Enrichment analysis of functional groups was also performed for each of the 11 anatomical clusters. To do this, GO and KEGG enrichment analyses were conducted. As a result, four GO terms associated with photosynthesis were enriched in cluster A: reductive pentose phosphate cycle (GO: 0019253), photosynthesis-light harvesting (GO: 0009765), photosynthesis (GO: 0015979), and electron transport chain (GO: 0022900). In cluster I, there were no photosynthesis-related GO terms. Instead, there were four GO terms related to sugar metabolism or biosynthesis: sucrose metabolic process (GO: 0005985), starch biosynthetic process (GO: 0019252), glucan biosynthetic process (GO: 0009250), and glycogen biosynthetic process (GO: 0005978; Figure 3b).
Consistent with the GO enrichment analysis results, KEGG enrichment also showed that photosynthesis pathways were enriched in cluster A, and starch and sucrose metabolism pathways were enriched in cluster I (Figure 3c). These results suggest that metabolic pathways might be further dissected by diverse developmental processes. Assigning expression patterns to each of the clusters will be useful for further functional analysis.
3.5. In Silico and In Vitro Expression Verification of Tissue-Preferred Genes
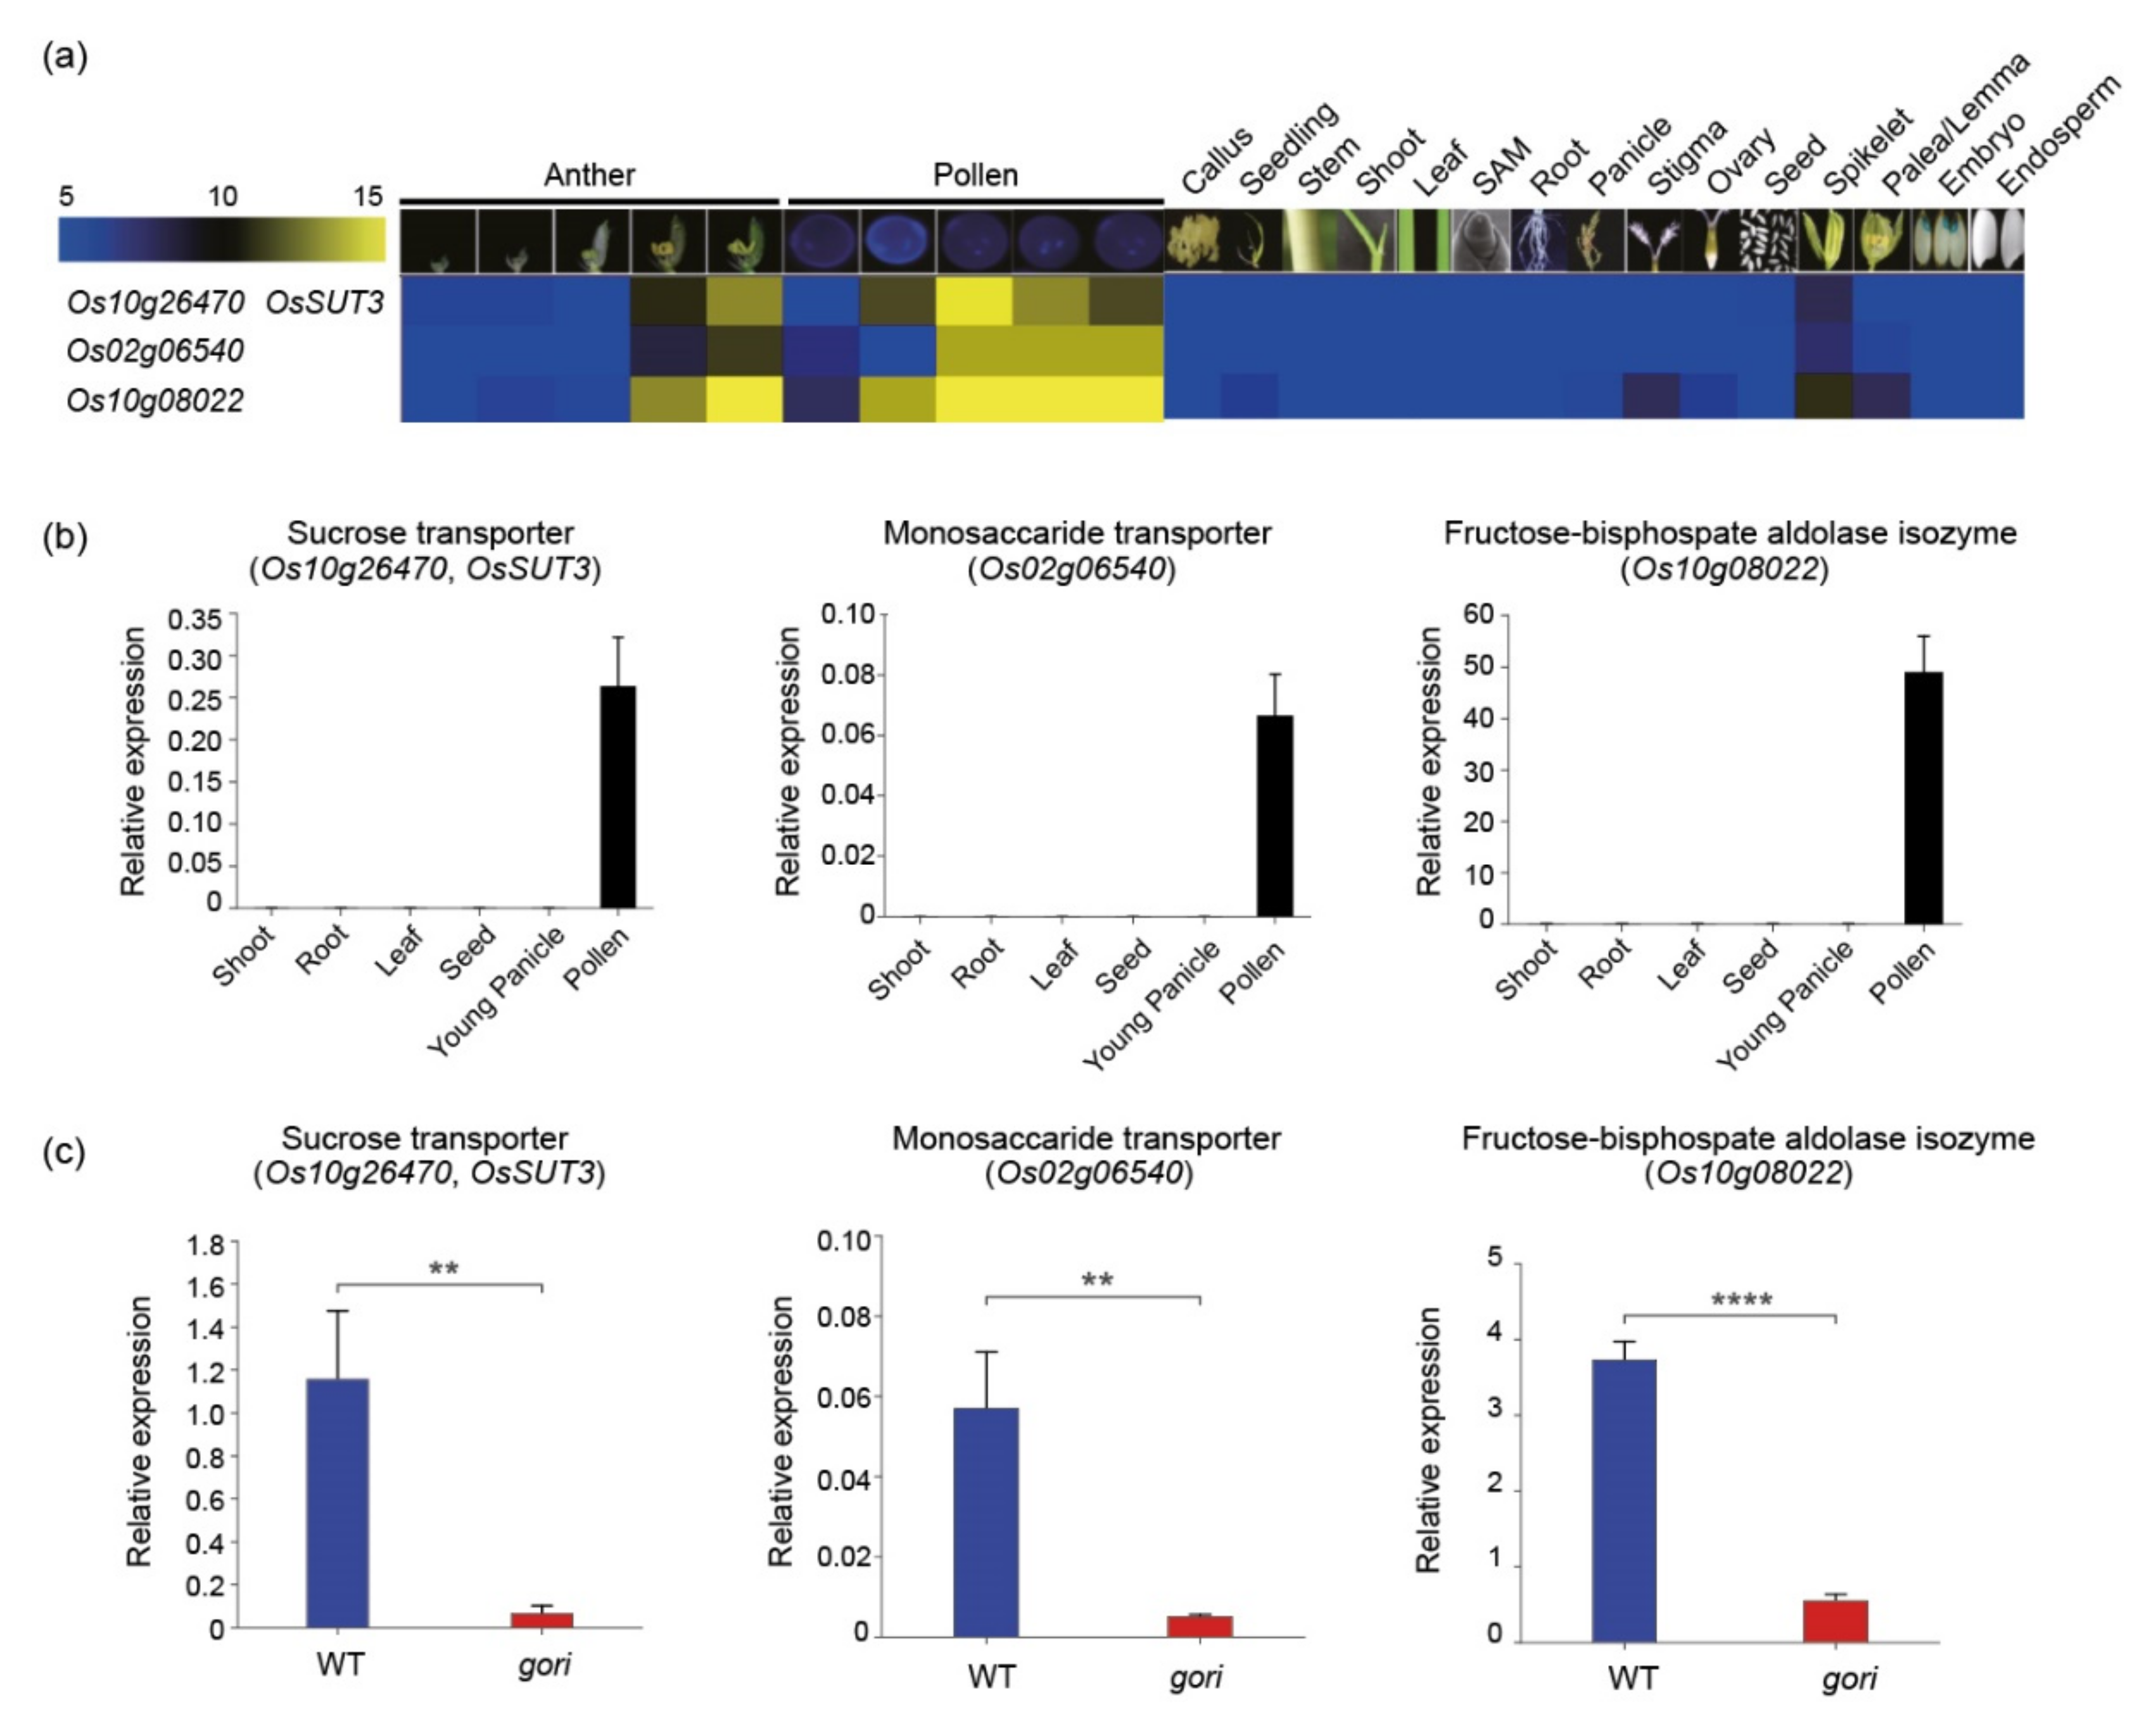
To validate the functional significance of gene clusters according to anatomical expression patterns, three genes (Os10g26740, Os02g06540, and Os10g08022) in cluster H associated with anther and pollen development were selected: sucrose transporter (OsSUT3), monosaccharide transporter, and fructose-bisphosphate aldolase isozyme, respectively. In silico analysis revealed that all these genes showed anther/pollen-preferred expression patterns (Figure 4a). This expression pattern was further confirmed by qRT-PCR, with samples in six tissues/organs (Figure 4b) matching the dissected model. Recently, a defect in the GORI gene changed the distribution of pectin in germinated pollen tubes and eventually led to the male sterile phenotype [35]. Thus, qRT-PCR was performed to analyze their regulatory roles by GORI in the gori mutant. Interestingly, all three genes were significantly downregulated in the gori mutant than in the wild-type (Figure 4c). It was speculated that these transporters and carbon metabolism-related enzymes regulated by GORI might be involved in the pollen tube growth process.
3.6. Construction of a Conceptual Carbohydrate Metabolism Model
In this section, a conceptual carbohydrate metabolism model that will help improve crop yield, as constructed previously for the rice endosperm, is proposed [89] (Figure 5). Notably, several studies fit well with this model. In pollen cluster H, OsHXK10 is involved in anther dehiscent and pollen germination [90]. In addition, CWINV3 mutation caused male sterility [91]. Regarding grain cluster I, SUS3 overexpression increased cell wall polysaccharide deposition, resulting in enhanced biomass saccharification [92].
This model, consistent with several functionally characterized genes, will be useful in providing guidelines for the spatial manipulation of carbohydrate metabolism-related genes in order to enhance crop yield.
4. Discussion
Improvement in crop yield is becoming more urgent due to the need to supply nearly 10 billion people. To maintain food security, many studies on carbohydrate metabolism in rice have been performed. However, these studies mostly focused on the source-sink mechanism and specific temporal samples such as the grain-filling stages. To complement this uneven interpretation of carbohydrate metabolism and provide new insights on rice productivity to enhance research associated with carbon metabolism, 866 carbohydrate metabolism-related genes were systemically dissected into 11 clusters according to meta-anatomical expression data (Figure 3; Table S5).
As mentioned above, a functionally characterized gene search and functional group enrichment analyses indicated that most functionally characterized carbohydrate metabolism-related genes were involved in the source-sink mechanism (Figure 2). Along with the results, this analysis showed some clusters showing root-, pollen-, and seed-preferred expression patterns (clusters E, H, and I). From among these, the expressions of three pollen-preferred carbon metabolism-related genes were confirmed, supporting the reliability of meta-anatomical expression data in this study (Figure 4).
Improving the seed setting rate through carbohydrate metabolism is a means of elevating rice productivity. One study reported that glycolysis could regulate pollen tube polarity in Arabidopsis [93]. Similarly, a recently characterized gene (GORI) involved in late pollen development in rice showed its connectivity to carbohydrate metabolism such as less pectin staining in the gori pollen tube [35]. Interestingly, three genes in cluster H showed significantly reduced expression when GORI was knocked out (Figure 4c). This result suggested that cluster H could be a suitable research candidate for further productivity improvement in the context of carbohydrate metabolism underlying late pollen development in rice.
Grain filling is also an important factor for rice yield increase [12]. In this analysis, the seed-preferred cluster I includes SUS3 and SUS4, characterized as grain filling-related genes [94]. In addition, SWEET and glutamine synthetase, which were excluded in the analysis due to the limitations of the data source for functional categorization, play an important role in the grain-filling process related to sucrose transport and nitrogen metabolism, respectively [95,96,97]. Furthermore, when a hierarchical clustering of the SWEET genes with the 11 anatomical clusters was performed, SWEET11 and SWEET15 were close to cluster I (data not shown). Jointly, carbohydrate genes in cluster I could be useful genetic resources for further investigation of the rice grain-filling process and other metabolic processes.
Moreover, crop productivity can be affected by various factors, including environment, fertilizer, soil conditions, and even rhizobiome composition [2,98,99]. In particular, the interaction between crop root and the rhizobiome is related to root exudates, including amino acids, secondary metabolites, and carbohydrates [100]. Although the investigation of root exudates is understudied until now, the root-preferred cluster E could be an appropriate target for further studies on carbohydrate metabolism for generating exudates in the root.
5. Conclusions
This study aimed to improve the overall understanding of carbohydrate metabolism, which could provide some unknown clues for increasing rice productivity. For this, 866 carbohydrate metabolism-related genes were integrated into meta-anatomical expression data, and the significance of each cluster was shown using the functionally characterized roles in each cluster. Through an integrated analysis, carbohydrate metabolism-related genes were systemically dissected into 11 tissue-preferred clusters. Further functional enrichment analysis showed that two clusters (A and I) were strongly associated with source- and sink-preferred roles, respectively. In addition, the expression patterns of three pollen-specific cluster H genes were provided as examples of the reliability of the analysis. Furthermore, the reduced expression of the three cluster H genes in the gori mutant suggested that the tissue-preferred clusters could be suitable targets for further investigation. Collectively, a conceptual carbohydrate metabolism model summarizing the results was constructed, and it provided holistic insights on carbohydrate metabolism and suggested suitable candidates for improving crop productivity beyond source-sink mechanism-focused research.
Supplementary Materials
The following are available online at https://www.mdpi.com/article/10.3390/plants10081690/s1. Figure S1: Distribution of functionally characterized genes among anatomical clusters. Table S1: Characterized carbohydrate metabolism-related genes retrieved from the OGRO database. Table S2: Summary of the primers used in this study. Table S3: List and summary of the 866 carbohydrate metabolism-related genes in rice. Table S4: Classification of the carbon metabolism-related genes in rice using anatomical meta-expression data and KMC analysis. Table S5: Summarized cluster information of the 866 carbohydrate metabolism-related genes.
Author Contributions
Conceptualization, Y.-J.K., J.-S.J. and K.-H.J.; validation, W.-J.H., X.J. and S.-H.C.; formal analysis, W.-J.H., X.J. and Y.-J.K.; writing—original draft preparation, W.-J.H. and X.J.; writing—review and editing, W.-J.H., X.J. and K.-H.J.; visualization, W.-J.H. and X.J.; supervision, S.-T.K., J.-S.J. and K.-H.J. All authors have read and agreed to the published version of the manuscript.
Funding
This work was supported by grants from the New Breeding Technology Center Program (PJ01492703 to K.-H.J.) and the National Research Foundation, Ministry of Education, Science and Technology (2021R1A2C2010448 to K.-H.J.).
Data Availability Statement
The expression data presented in this study are available in the Supplementary Table S4.
Conflicts of Interest
The authors declare no conflict of interest.
References
- Godfray, H.C.J.; Beddington, J.R.; Crute, I.R.; Haddad, L.; Lawrence, D.; Muir, J.F.; Pretty, J.; Robinson, S.; Thomas, S.M.; Toulmin, C. Food Security: The Challenge of Feeding 9 Billion People. Science 2010, 327, 812. [Google Scholar] [CrossRef] [Green Version]
- Zhao, C.; Liu, B.; Piao, S.; Wang, X.; Lobell, D.B.; Huang, Y.; Huang, M.; Yao, Y.; Bassu, S.; Ciais, P.; et al. Temperature Increase Reduces Global Yields of Major Crops in Four Independent Estimates. Proc. Natl. Acad. Sci. USA 2017, 114, 9326. [Google Scholar] [CrossRef] [Green Version]
- Yu, S.-M.; Lo, S.-F.; Ho, T.-H.D. Source–Sink Communication: Regulated by Hormone, Nutrient, and Stress Cross-Signaling. Trends Plant Sci. 2015, 20, 844–857. [Google Scholar] [CrossRef]
- Sinclair, T.R.; Sheehy, J.E. Erect Leaves and Photosynthesis in Rice. Science 1999, 283, 1455. [Google Scholar] [CrossRef]
- Sakamoto, T.; Morinaka, Y.; Ohnishi, T.; Sunohara, H.; Fujioka, S.; Ueguchi-Tanaka, M.; Mizutani, M.; Sakata, K.; Takatsuto, S.; Yoshida, S.; et al. Erect Leaves Caused by Brassinosteroid Deficiency Increase Biomass Production and Grain Yield in Rice. Nat. Biotechnol. 2006, 24, 105–109. [Google Scholar] [CrossRef]
- Yoo, S.-C.; Cho, S.-H.; Zhang, H.; Paik, H.-C.; Lee, C.-H.; Li, J.; Yoo, J.-H.; Lee, B.-W.; Koh, H.-J.; Seo, H.S.; et al. Quantitative Trait Loci Associated with Functional Stay-Green SNU-SG1 in Rice. Mol. Cells 2007, 24, 83–94. [Google Scholar] [PubMed]
- Lalonde, S.; Tegeder, M.; Throne-Holst, M.; Frommer, W.B.; Patrick, J.W. Phloem Loading and Unloading of Sugars and Amino Acids. Plant Cell Environ. 2003, 26, 37–56. [Google Scholar] [CrossRef] [Green Version]
- Zhang, C.; Turgeon, R. Mechanisms of Phloem Loading. Curr. Opin. Plant Biol. 2018, 43, 71–75. [Google Scholar] [CrossRef]
- Chen, L.-Q.; Qu, X.-Q.; Hou, B.-H.; Sosso, D.; Osorio, S.; Fernie, A.R.; Frommer, W.B. Sucrose Efflux Mediated by SWEET Proteins as a Key Step for Phloem Transport. Science 2012, 335, 207. [Google Scholar] [CrossRef] [PubMed]
- Eom, J.-S.; Chen, L.-Q.; Sosso, D.; Julius, B.T.; Lin, I.; Qu, X.-Q.; Braun, D.M.; Frommer, W.B. SWEETs, Transporters for Intracellular and Intercellular Sugar Translocation. Curr. Opin. Plant Biol. 2015, 25, 53–62. [Google Scholar] [CrossRef] [PubMed] [Green Version]
- Cho, J.-I.; Ryoo, N.; Ko, S.; Lee, S.-K.; Lee, J.; Jung, K.-H.; Lee, Y.-H.; Bhoo, S.H.; Winderickx, J.; An, G.; et al. Structure, Expression, and Functional Analysis of the Hexokinase Gene Family in Rice (Oryza Sativa L.). Planta 2006, 224, 598–611. [Google Scholar] [CrossRef] [PubMed]
- Wang, E.; Wang, J.; Zhu, X.; Hao, W.; Wang, L.; Li, Q.; Zhang, L.; He, W.; Lu, B.; Lin, H.; et al. Control of Rice Grain-Filling and Yield by a Gene with a Potential Signature of Domestication. Nat. Genet. 2008, 40, 1370–1374. [Google Scholar] [CrossRef]
- Li, B.; Liu, H.; Zhang, Y.; Kang, T.; Zhang, L.; Tong, J.; Xiao, L.; Zhang, H. Constitutive Expression of Cell Wall Invertase Genes Increases Grain Yield and Starch Content in Maize. Plant Biotechnol. J. 2013, 11, 1080–1091. [Google Scholar] [CrossRef]
- Jeon, J.-S.; Jung, K.-H.; Kim, H.-B.; Suh, J.-P.; Khush, G.S. Genetic and Molecular Insights into the Enhancement of Rice Yield Potential. J. Plant Biol. 2011, 54, 1–9. [Google Scholar] [CrossRef] [Green Version]
- Yang, J.; Zhang, J. Grain-Filling Problem in ‘Super’ Rice. J. Exp. Bot. 2010, 61, 1–5. [Google Scholar] [CrossRef] [Green Version]
- Slewinski, T.L.; Zhang, C.; Turgeon, R. Structural and Functional Heterogeneity in Phloem Loading and Transport. Front. Plant Sci. 2013, 4, 244. [Google Scholar] [CrossRef] [Green Version]
- Ruan, Y.-L.; Jin, Y.; Huang, J. Capping Invertase Activity by Its Inhibitor: Roles and Implications in Sugar Signaling, Carbon Allocation, Senescence and Evolution. Plant Signal. Behav. 2009, 4, 983–985. [Google Scholar] [CrossRef]
- Zhu, T.; Budworth, P.; Chen, W.; Provart, N.; Chang, H.-S.; Guimil, S.; Su, W.; Estes, B.; Zou, G.; Wang, X. Transcriptional Control of Nutrient Partitioning during Rice Grain Filling. Plant Biotechnol. J. 2003, 1, 59–70. [Google Scholar] [CrossRef] [Green Version]
- Yamakawa, H.; Hirose, T.; Kuroda, M.; Yamaguchi, T. Comprehensive Expression Profiling of Rice Grain Filling-Related Genes under High Temperature Using DNA Microarray. Plant Physiol. 2007, 144, 258–277. [Google Scholar] [CrossRef] [PubMed] [Green Version]
- Kanehisa, M.; Goto, S. KEGG: Kyoto Encyclopedia of Genes and Genomes. Nucleic Acids Res. 2000, 28, 27–30. [Google Scholar] [CrossRef] [PubMed]
- Thimm, O.; Bläsing, O.; Gibon, Y.; Nagel, A.; Meyer, S.; Krüger, P.; Selbig, J.; Müller, L.A.; Rhee, S.Y.; Stitt, M. MAPMAN: A User-Driven Tool to Display Genomics Data Sets onto Diagrams of Metabolic Pathways and Other Biological Processes. Plant J. 2004, 37, 914–939. [Google Scholar] [CrossRef]
- Ouyang, S.; Zhu, W.; Hamilton, J.; Lin, H.; Campbell, M.; Childs, K.; Thibaud-Nissen, F.; Malek, R.L.; Lee, Y.; Zheng, L.; et al. The TIGR Rice Genome Annotation Resource: Improvements and New Features. Nucleic Acids Res. 2007, 35, D883–D887. [Google Scholar] [CrossRef] [Green Version]
- Chandran, A.K.N.; Yoo, Y.-H.; Cao, P.; Sharma, R.; Sharma, M.; Dardick, C.; Ronald, P.C.; Jung, K.-H. Updated Rice Kinase Database RKD 2.0: Enabling Transcriptome and Functional Analysis of Rice Kinase Genes. Rice 2016, 9, 40. [Google Scholar] [CrossRef] [PubMed] [Green Version]
- Cao, P.; Jung, K.-H.; Choi, D.; Hwang, D.; Zhu, J.; Ronald, P.C. The Rice Oligonucleotide Array Database: An Atlas of Rice Gene Expression. Rice 2012, 5, 17. [Google Scholar] [CrossRef] [PubMed] [Green Version]
- Chandran, A.K.N.; Hong, W.-J.; Abhijith, B.; Lee, J.; Kim, Y.-J.; Park, S.K.; Jung, K.-H. Rice Male Gamete Expression Database (RMEDB): A Web Resource for Functional Genomic Studies of Rice Male Organ Development. J. Plant Biol. 2020, 63, 421–430. [Google Scholar] [CrossRef]
- Saeed, A.I.; Sharov, V.; White, J.; Li, J.; Liang, W.; Bhagabati, N.; Braisted, J.; Klapa, M.; Currier, T.; Thiagarajan, M.; et al. TM4: A Free, Open-Source System for Microarray Data Management and Analysis. Biotechniques 2003, 34, 374–378. [Google Scholar] [CrossRef] [Green Version]
- Moon, S.; Oo, M.M.; Kim, B.; Koh, H.-J.; Oh, S.A.; Yi, G.; An, G.; Park, S.K.; Jung, K.-H. Genome-Wide Analyses of Late Pollen-Preferred Genes Conserved in Various Rice Cultivars and Functional Identification of a Gene Involved in the Key Processes of Late Pollen Development. Rice 2018, 11, 28. [Google Scholar] [CrossRef] [Green Version]
- Yamamoto, E.; Yonemaru, J.-I.; Yamamoto, T.; Yano, M. OGRO: The Overview of Functionally Characterized Genes in Rice Online Database. Rice 2012, 5, 26. [Google Scholar] [CrossRef] [Green Version]
- Hong, W.-J.; Jung, K.-H. Comparative Analysis of Flanking Sequence Tags of T-DNA/Transposon Insertional Mutants and Genetic Variations of Fast-Neutron Treated Mutants in Rice. J. Plant Biol. 2018, 61, 80–84. [Google Scholar] [CrossRef]
- Wickham, H. Ggplot2: Elegant Graphics for Data Analysis; Springer: New York, NY, USA, 2016; ISBN 978-3-319-24277-4. [Google Scholar]
- Khatri, P.; Drăghici, S. Ontological Analysis of Gene Expression Data: Current Tools, Limitations, and Open Problems. Bioinformatics 2005, 21, 3587–3595. [Google Scholar] [CrossRef] [Green Version]
- Jung, K.-H.; Dardick, C.; Bartley, L.E.; Cao, P.; Phetsom, J.; Canlas, P.; Seo, Y.-S.; Shultz, M.; Ouyang, S.; Yuan, Q.; et al. Refinement of Light-Responsive Transcript Lists Using Rice Oligonucleotide Arrays: Evaluation of Gene-Redundancy. PLoS ONE 2008, 3, e3337. [Google Scholar] [CrossRef] [PubMed]
- Yu, G.; Wang, L.-G.; Han, Y.; He, Q.-Y. ClusterProfiler: An R Package for Comparing Biological Themes among Gene Clusters. OMICS 2012, 16, 284–287. [Google Scholar] [CrossRef] [PubMed]
- Sakai, H.; Lee, S.S.; Tanaka, T.; Numa, H.; Kim, J.; Kawahara, Y.; Wakimoto, H.; Yang, C.; Iwamoto, M.; Abe, T.; et al. Rice Annotation Project Database (RAP-DB): An Integrative and interactive Database for Rice Genomics. Plant Cell Physiol. 2013, 54, e6. [Google Scholar] [CrossRef] [PubMed]
- Kim, Y.-J.; Kim, M.-H.; Hong, W.-J.; Moon, S.; Kim, E.-J.; Silva, J.; Lee, J.; Lee, S.; Kim, S.T.; Park, S.K.; et al. GORI, Encoding the WD40 Domain Protein, Is Required for Pollen Tube Germination and Elongation in Rice. Plant J. 2021, 105, 1645–1664. [Google Scholar] [CrossRef] [PubMed]
- Hong, W.-J.; Jiang, X.; Ahn, H.R.; Choi, J.; Kim, S.-R.; Jung, K.-H. Systematic Analysis of Cold Stress Response and Diurnal Rhythm Using Transcriptome Data in Rice Reveals the Molecular Networks Related to Various Biological Processes. Int. J. Mol. Sci. 2020, 21, 6872. [Google Scholar] [CrossRef]
- Ge, L.-F.; Chao, D.-Y.; Shi, M.; Zhu, M.-Z.; Gao, J.-P.; Lin, H.-X. Overexpression of the Trehalose-6-Phosphate Phosphatase Gene OsTPP1 Confers Stress Tolerance in Rice and Results in the Activation of Stress Responsive Genes. Planta 2008, 228, 191–201. [Google Scholar] [CrossRef]
- Li, H.-W.; Zang, B.-S.; Deng, X.-W.; Wang, X.-P. Overexpression of the Trehalose-6-Phosphate Synthase Gene OsTPS1 Enhances Abiotic Stress Tolerance in Rice. Planta 2011, 234, 1007–1018. [Google Scholar] [CrossRef]
- Koumoto, T.; Shimada, H.; Kusano, H.; She, K.-C.; Iwamoto, M.; Takano, M. Rice Monoculm Mutation Moc2, Which Inhibits Outgrowth of the Second Tillers, Is Ascribed to Lack of a Fructose-1,6-Bisphosphatase. Plant Biotechnol. 2013, 30, 47–56. [Google Scholar] [CrossRef] [Green Version]
- Eom, J.-S.; Cho, J.-I.; Reinders, A.; Lee, S.-W.; Yoo, Y.; Tuan, P.Q.; Choi, S.-B.; Bang, G.; Park, Y.-I.; Cho, M.-H.; et al. Impaired Function of the Tonoplast-Localized Sucrose Transporter in Rice, OsSUT2, Limits the Transport of Vacuolar Reserve Sucrose and Affects Plant Growth. Plant Physiol. 2011, 157, 109–119. [Google Scholar] [CrossRef] [Green Version]
- Duan, J.; Zhang, M.; Zhang, H.; Xiong, H.; Liu, P.; Ali, J.; Li, J.; Li, Z. OsMIOX, a Myo-Inositol Oxygenase Gene, Improves Drought Tolerance through Scavenging of Reactive Oxygen Species in Rice (Oryza Sativa L.). Plant Sci. 2012, 196, 143–151. [Google Scholar] [CrossRef]
- Ishimaru, K.; Hirose, T.; Aoki, N.; Takahashi, S.; Ono, K.; Yamamoto, S.; Wu, J.; Saji, S.; Baba, T.; Ugaki, M.; et al. Antisense Expression of a Rice Sucrose Transporter OsSUT1 in Rice (Oryza Sativa L.). Plant Cell Physiol. 2001, 42, 1181–1185. [Google Scholar] [CrossRef] [Green Version]
- Sharma, A.; Komatsu, S. Involvement of a Ca(2+)-Dependent Protein Kinase Component Downstream to the Gibberellin-Binding Phosphoprotein, RuBisCO Activase, in Rice. Biochem. Biophys. Res. Commun. 2002, 290, 690–695. [Google Scholar] [CrossRef]
- Lu, Y.; Li, Y.; Yang, Q.; Zhang, Z.; Chen, Y.; Zhang, S.; Peng, X.-X. Suppression of Glycolate Oxidase Causes Glyoxylate Accumulation That Inhibits Photosynthesis through Deactivating Rubisco in Rice. Physiol. Plant 2014, 150, 463–476. [Google Scholar] [CrossRef]
- Zhang, Y.; Xiao, W.; Luo, L.; Pang, J.; Rong, W.; He, C. Downregulation of OsPK1, a Cytosolic Pyruvate Kinase, by T-DNA Insertion Causes Dwarfism and Panicle Enclosure in Rice. Planta 2012, 235, 25–38. [Google Scholar] [CrossRef]
- Zhang, Y.; Feng, F.; He, C. Downregulation of OsPK1 Contributes to Oxidative Stress and the Variations in ABA/GA Balance in Rice. Plant Mol. Biol. Rep. 2012, 30, 1006–1013. [Google Scholar] [CrossRef]
- Lee, S.-K.; Hwang, S.-K.; Han, M.; Eom, J.-S.; Kang, H.-G.; Han, Y.; Choi, S.-B.; Cho, M.-H.; Bhoo, S.H.; An, G.; et al. Identification of the ADP-Glucose Pyrophosphorylase Isoforms Essential for Starch Synthesis in the Leaf and Seed Endosperm of Rice (Oryza Sativa L.). Plant Mol. Biol. 2007, 65, 531–546. [Google Scholar] [CrossRef] [PubMed]
- Zhou, Y.; Cai, H.; Xiao, J.; Li, X.; Zhang, Q.; Lian, X. Over-Expression of Aspartate Aminotransferase Genes in Rice Resulted in Altered Nitrogen Metabolism and Increased Amino Acid Content in Seeds. Theor. Appl. Genet. 2009, 118, 1381–1390. [Google Scholar] [CrossRef] [PubMed]
- Hakata, M.; Kuroda, M.; Miyashita, T.; Yamaguchi, T.; Kojima, M.; Sakakibara, H.; Mitsui, T.; Yamakawa, H. Suppression of α-Amylase Genes Improves Quality of Rice Grain Ripened under High Temperature. Plant Biotechnol. J. 2012, 10, 1110–1117. [Google Scholar] [CrossRef] [Green Version]
- Lin, D.-G.; Chou, S.-Y.; Wang, A.Z.; Wang, Y.-W.; Kuo, S.-M.; Lai, C.-C.; Chen, L.-J.; Wang, C.-S. A Proteomic Study of Rice Cultivar TNG67 and Its High Aroma Mutant SA0420. Plant Sci. 2014, 214, 20–28. [Google Scholar] [CrossRef] [PubMed]
- Kuwano, M.; Takaiwa, F.; Yoshida, K.T. Differential Effects of a Transgene to Confer Low Phytic Acid in Caryopses Located at Different Positions in Rice Panicles. Plant Cell Physiol. 2009, 50, 1387–1392. [Google Scholar] [CrossRef] [Green Version]
- Kuwano, M.; Mimura, T.; Takaiwa, F.; Yoshida, K.T. Generation of Stable ‘Low Phytic Acid’ Transgenic Rice through Antisense Repression of the 1d-Myo-Inositol 3-Phosphate Synthase Gene (RINO1) Using the 18-KDa Oleosin Promoter. Plant Biotechnol. J. 2009, 7, 96–105. [Google Scholar] [CrossRef]
- Kim, S.I.; Andaya, C.B.; Newman, J.W.; Goyal, S.S.; Tai, T.H. Isolation and Characterization of a Low Phytic Acid Rice Mutant Reveals a Mutation in the Rice Orthologue of Maize MIK. Theor. Appl. Genet. 2008, 117, 1291. [Google Scholar] [CrossRef]
- Satoh, H.; Shibahara, K.; Tokunaga, T.; Nishi, A.; Tasaki, M.; Hwang, S.-K.; Okita, T.W.; Kaneko, N.; Fujita, N.; Yoshida, M.; et al. Mutation of the Plastidial α-Glucan Phosphorylase Gene in Rice Affects the Synthesis and Structure of Starch in the Endosperm. Plant Cell 2008, 20, 1833–1849. [Google Scholar] [CrossRef] [PubMed] [Green Version]
- Utsumi, Y.; Utsumi, C.; Sawada, T.; Fujita, N.; Nakamura, Y. Functional Diversity of Isoamylase Oligomers: The ISA1 Homo-Oligomer Is Essential for Amylopectin Biosynthesis in Rice Endosperm. Plant Physiol. 2011, 156, 61–77. [Google Scholar] [CrossRef] [PubMed] [Green Version]
- Kang, H.-G.; Park, S.; Matsuoka, M.; An, G. White-Core Endosperm Floury Endosperm-4 in Rice Is Generated by Knockout Mutations in the C4-Type Pyruvate Orthophosphate Dikinase Gene (OsPPDKB). Plant J. 2005, 42, 901–911. [Google Scholar] [CrossRef] [Green Version]
- Wang, Z.-Y.; Zheng, F.-Q.; Shen, G.-Z.; Gao, J.-P.; Snustad, D.P.; Li, M.-G.; Zhang, J.-L.; Hong, M.-M. The Amylose Content in Rice Endosperm Is Related to the Post-Transcriptional Regulation of the Waxy Gene. Plant J. 1995, 7, 613–622. [Google Scholar] [CrossRef]
- Fujita, N.; Yoshida, M.; Asakura, N.; Ohdan, T.; Miyao, A.; Hirochika, H.; Nakamura, Y. Function and Characterization of Starch Synthase I Using Mutants in Rice. Plant Physiol. 2006, 140, 1070–1084. [Google Scholar] [CrossRef] [Green Version]
- Zhang, G.; Cheng, Z.; Zhang, X.; Guo, X.; Su, N.; Jiang, L.; Mao, L.; Wan, J. Double Repression of Soluble Starch Synthase Genes SSIIa and SSIIIa in Rice (Oryza Sativa L.) Uncovers Interactive Effects on the Physicochemical Properties of Starch. Genome 2011, 54, 448–459. [Google Scholar] [CrossRef]
- Gao, Z.; Zeng, D.; Cheng, F.; Tian, Z.; Guo, L.; Su, Y.; Yan, M.; Jiang, H.; Dong, G.; Huang, Y.; et al. ALK, the Key Gene for Gelatinization Temperature, Is a Modifier Gene for Gel Consistency in RiceF. J. Integr. Plant Biol. 2011, 53, 756–765. [Google Scholar] [PubMed]
- Ryoo, N.; Yu, C.; Park, C.-S.; Baik, M.-Y.; Park, I.M.; Cho, M.-H.; Bhoo, S.H.; An, G.; Hahn, T.-R.; Jeon, J.-S. Knockout of a Starch Synthase Gene OsSSIIIa/Flo5 Causes White-Core Floury Endosperm in Rice (Oryza Sativa L.). Plant Cell Rep. 2007, 26, 1083–1095. [Google Scholar] [CrossRef] [PubMed]
- Fujita, N.; Satoh, R.; Hayashi, A.; Kodama, M.; Itoh, R.; Aihara, S.; Nakamura, Y. Starch Biosynthesis in Rice Endosperm Requires the Presence of Either Starch Synthase I or IIIa. J. Exp. Bot. 2011, 62, 4819–4831. [Google Scholar] [CrossRef] [Green Version]
- Yun, M.-S.; Umemoto, T.; Kawagoe, Y. Rice Debranching Enzyme Isoamylase3 Facilitates Starch Metabolism and Affects Plastid Morphogenesis. Plant Cell Physiol. 2011, 52, 1068–1082. [Google Scholar] [CrossRef] [PubMed] [Green Version]
- Saito, H.; Okumoto, Y.; Yoshitake, Y.; Inoue, H.; Yuan, Q.; Teraishi, M.; Tsukiyama, T.; Nishida, H.; Tanisaka, T. Complete Loss of Photoperiodic Response in the Rice Mutant Line X61 Is Caused by Deficiency of Phytochrome Chromophore Biosynthesis Gene. Theor. Appl. Genet. 2011, 122, 109–118. [Google Scholar] [CrossRef]
- Jia, L.; Zhang, B.; Mao, C.; Li, J.; Wu, Y.; Wu, P.; Wu, Z. OsCYT-INV1 for Alkaline/Neutral Invertase Is Involved in Root Cell Development and Reproductivity in Rice (Oryza Sativa L.). Planta 2008, 228, 51–59. [Google Scholar] [CrossRef] [PubMed]
- Asatsuma, S.; Sawada, C.; Itoh, K.; Okito, M.; Kitajima, A.; Mitsui, T. Involvement of α-Amylase I-1 in Starch Degradation in Rice Chloroplasts. Plant Cell Physiol. 2005, 46, 858–869. [Google Scholar] [CrossRef]
- Ibraheem, O.; Botha, C.E.J.; Bradley, G.; Dealtry, G.; Roux, S. Rice Sucrose Transporter1 (OsSUT1) up-Regulation in Xylem Parenchyma Is Caused by Aphid Feeding on Rice Leaf Blade Vascular Bundles. Plant Biol. 2014, 16, 783–791. [Google Scholar] [CrossRef] [PubMed]
- Feng, L.; Wang, K.; Li, Y.; Tan, Y.; Kong, J.; Li, H.; Li, Y.; Zhu, Y. Overexpression of SBPase Enhances Photosynthesis against High Temperature Stress in Transgenic Rice Plants. Plant Cell Rep. 2007, 26, 1635–1646. [Google Scholar] [CrossRef]
- Ye, N.; Yang, G.; Chen, Y.; Zhang, C.; Zhang, J.; Peng, X. Two Hydroxypyruvate Reductases Encoded by OsHPR1 and OsHPR2 Are Involved in Photorespiratory Metabolism in Rice. J. Integr. Plant Biol. 2014, 56, 170–180. [Google Scholar] [CrossRef]
- Cook, F.R.; Fahy, B.; Trafford, K. A Rice Mutant Lacking a Large Subunit of ADP-Glucose Pyrophosphorylase Has Drastically Reduced Starch Content in the Culm but Normal Plant Morphology and Yield. Funct. Plant Biol. 2012, 39, 1068–1078. [Google Scholar] [CrossRef]
- Hirose, T.; Hashida, Y.; Aoki, N.; Okamura, M.; Yonekura, M.; Ohto, C.; Terao, T.; Ohsugi, R. Analysis of Gene-Disruption Mutants of a Sucrose Phosphate Synthase Gene in Rice, OsSPS1, Shows the Importance of Sucrose Synthesis in Pollen Germination. Plant Sci. 2014, 225, 102–106. [Google Scholar] [CrossRef]
- Cao, H.; Guo, S.; Xu, Y.; Jiang, K.; Jones, A.M.; Chong, K. Reduced Expression of a Gene Encoding a Golgi Localized Monosaccharide Transporter (OsGMST1) Confers Hypersensitivity to Salt in Rice (Oryza sativa). J. Exp. Bot. 2011, 62, 4595–4604. [Google Scholar] [CrossRef] [PubMed] [Green Version]
- Siahpoosh, M.R.; Sanchez, D.H.; Schlereth, A.; Scofield, G.N.; Furbank, R.T.; van Dongen, J.T.; Kopka, J. Modification of OsSUT1 Gene Expression Modulates the Salt Response of Rice Oryza Sativa Cv. Taipei 309. Plant Sci. 2012, 182, 101–111. [Google Scholar] [CrossRef] [PubMed]
- Zhang, X.-H.; Rao, X.-L.; Shi, H.-T.; Li, R.-J.; Lu, Y.-T. Overexpression of a Cytosolic Glyceraldehyde-3-Phosphate Dehydrogenase Gene OsGAPC3 Confers Salt Tolerance in Rice. Plant Cell Tissue Organ Cult. 2011, 107, 1. [Google Scholar] [CrossRef]
- Tuncel, A.; Kawaguchi, J.; Ihara, Y.; Matsusaka, H.; Nishi, A.; Nakamura, T.; Kuhara, S.; Hirakawa, H.; Nakamura, Y.; Cakir, B.; et al. The Rice Endosperm ADP-Glucose Pyrophosphorylase Large Subunit Is Essential for Optimal Catalysis and Allosteric Regulation of the Heterotetrameric Enzyme. Plant Cell Physiol. 2014, 55, 1169–1183. [Google Scholar] [CrossRef] [Green Version]
- Masumoto, C.; Miyazawa, S.-I.; Ohkawa, H.; Fukuda, T.; Taniguchi, Y.; Murayama, S.; Kusano, M.; Saito, K.; Fukayama, H.; Miyao, M. Phosphoenolpyruvate Carboxylase Intrinsically Located in the Chloroplast of Rice Plays a Crucial Role in Ammonium Assimilation. Proc. Natl. Acad. Sci. USA 2010, 107, 5226–5231. [Google Scholar] [CrossRef] [Green Version]
- Lee, S.-K.; Jeon, J.-S.; Bornke, F.; Voll, L.; Cho, J.-I.; Goh, C.-H.; Jeong, S.-W.; Park, Y.-I.; Kim, S.J.; Choi, S.-B.; et al. Loss of Cytosolic Fructose-1,6-Bisphosphatase Limits Photosynthetic Sucrose Synthesis and Causes Severe Growth Retardations in Rice (Oryza sativa). Plant Cell Environ. 2008, 31, 1851–1863. [Google Scholar] [CrossRef]
- Kasajima, I.; Ebana, K.; Yamamoto, T.; Takahara, K.; Yano, M.; Kawai-Yamada, M.; Uchimiya, H. Molecular Distinction in Genetic Regulation of Nonphotochemical Quenching in Rice. Proc. Natl. Acad. Sci. USA 2011, 108, 13835–13840. [Google Scholar] [CrossRef] [Green Version]
- Hubbart, S.; Ajigboye, O.O.; Horton, P.; Murchie, E.H. The Photoprotective Protein PsbS Exerts Control over CO2 Assimilation Rate in Fluctuating Light in Rice. Plant J. 2012, 71, 402–412. [Google Scholar] [CrossRef]
- Abe, N.; Asai, H.; Yago, H.; Oitome, N.F.; Itoh, R.; Crofts, N.; Nakamura, Y.; Fujita, N. Relationships between Starch Synthase I and Branching Enzyme Isozymes Determined Using Double Mutant Rice Lines. BMC Plant Biol. 2014, 14, 80. [Google Scholar] [CrossRef] [PubMed] [Green Version]
- Xu, H.; Zhang, J.; Zeng, J.; Jiang, L.; Liu, E.; Peng, C.; He, Z.; Peng, X. Inducible Antisense Suppression of Glycolate Oxidase Reveals Its Strong Regulation over Photosynthesis in Rice. J. Exp. Bot. 2009, 60, 1799–1809. [Google Scholar] [CrossRef] [Green Version]
- Jin, S.-H.; Hong, J.; Li, X.-Q.; Jiang, D.-A. Antisense Inhibition of Rubisco Activase Increases Rubisco Content and Alters the Proportion of Rubisco Activase in Stroma and Thylakoids in Chloroplasts of Rice Leaves. Ann. Bot. 2006, 97, 739–744. [Google Scholar] [CrossRef] [Green Version]
- Nath, K.; Poudyal, R.S.; Eom, J.-S.; Park, Y.S.; Zulfugarov, I.S.; Mishra, S.R.; Tovuu, A.; Ryoo, N.; Yoon, H.-S.; Nam, H.G.; et al. Loss-of-Function of OsSTN8 Suppresses the Photosystem II Core Protein Phosphorylation and Interferes with the Photosystem II Repair Mechanism in Rice (Oryza sativa). Plant J. 2013, 76, 675–686. [Google Scholar] [CrossRef] [PubMed]
- Nishikawa, Y.; Yamamoto, H.; Okegawa, Y.; Wada, S.; Sato, N.; Taira, Y.; Sugimoto, K.; Makino, A.; Shikanai, T. PGR5-Dependent Cyclic Electron Transport Around PSI Contributes to the Redox Homeostasis in Chloroplasts Rather Than CO2 Fixation and Biomass Production in Rice. Plant Cell Physiol. 2012, 53, 2117–2126. [Google Scholar] [CrossRef] [PubMed] [Green Version]
- Zhou, Q.; Yu, Q.; Wang, Z.; Pan, Y.; Lv, W.; Zhu, L.; Chen, R.; He, G. Knockdown of GDCH Gene Reveals Reactive Oxygen Species-Induced Leaf Senescence in Rice. Plant Cell Environ. 2013, 36, 1476–1489. [Google Scholar] [CrossRef]
- Makino, A.; Shimada, T.; Takumi, S.; Kaneko, K.; Matsuoka, M.; Shimamoto, K.; Nakano, H.; Miyao-Tokutomi, M.; Mae, T.; Yamamoto, N. Does Decrease in Ribulose-1,5-Bisphosphate Carboxylase by Antisense RbcS Lead to a Higher N-Use Efficiency of Photosynthesis under Conditions of Saturating CO2 and Light in Rice Plants? Plant Physiol. 1997, 114, 483–491. [Google Scholar] [CrossRef] [PubMed] [Green Version]
- Ogawa, S.; Suzuki, Y.; Yoshizawa, R.; Kanno, K.; Makino, A. Effect of Individual Suppression of RBCS Multigene Family on Rubisco Contents in Rice Leaves. Plant Cell Environ. 2012, 35, 546–553. [Google Scholar] [CrossRef]
- Makino, A.; Sage, R.F. Temperature Response of Photosynthesis in Transgenic Rice Transformed with ‘Sense’ or ‘Antisense’ RbcS. Plant Cell Physiol. 2007, 48, 1472–1483. [Google Scholar] [CrossRef] [Green Version]
- Hong, W.-J.; Yoo, Y.-H.; Park, S.-A.; Moon, S.; Kim, S.-R.; An, G.; Jung, K.-H. Genome-Wide Identification and Extensive Analysis of Rice-Endosperm Preferred Genes Using Reference Expression Database. J. Plant Biol. 2017, 60, 249–258. [Google Scholar] [CrossRef]
- Xu, F.-Q.; Li, X.-R.; Ruan, Y.-L. RNAi-Mediated Suppression of Hexokinase Gene OsHXK10 in Rice Leads to Non-Dehiscent Anther and Reduction of Pollen Germination. Plant Sci. 2008, 175, 674–684. [Google Scholar] [CrossRef]
- Oliver, S.N.; Van Dongen, J.T.; Alfred, S.C.; Mamun, E.A.; Zhao, X.; Saini, H.S.; Fernandes, S.F.; Blanchard, C.L.; Sutton, B.G.; Geigenberger, P.; et al. Cold-Induced Repression of the Rice Anther-Specific Cell Wall Invertase Gene OSINV4 Is Correlated with Sucrose Accumulation and Pollen Sterility. Plant Cell Environ. 2005, 28, 1534–1551. [Google Scholar] [CrossRef]
- Fan, C.; Wang, G.; Wu, L.; Liu, P.; Huang, J.; Jin, X.; Zhang, G.; He, Y.; Peng, L.; Luo, K.; et al. Distinct Cellulose and Callose Accumulation for Enhanced Bioethanol Production and Biotic Stress Resistance in OsSUS3 Transgenic Rice. Carbohydr. Polym. 2020, 232, 115448. [Google Scholar] [CrossRef]
- Chen, W.; Gong, P.; Guo, J.; Li, H.; Li, R.; Xing, W.; Yang, Z.; Guan, Y. Glycolysis Regulates Pollen Tube Polarity via Rho GTPase Signaling. PLoS Genet. 2018, 14, e1007373. [Google Scholar] [CrossRef] [Green Version]
- You, C.; Zhu, H.; Xu, B.; Huang, W.; Wang, S.; Ding, Y.; Liu, Z.; Li, G.; Chen, L.; Ding, C.; et al. Effect of Removing Superior Spikelets on Grain Filling of Inferior Spikelets in Rice. Front. Plant Sci. 2016, 7, 1161. [Google Scholar] [CrossRef] [Green Version]
- Ma, L.; Zhang, D.; Miao, Q.; Yang, J.; Xuan, Y.; Hu, Y. Essential Role of Sugar Transporter OsSWEET11 During the Early Stage of Rice Grain Filling. Plant Cell Physiol. 2017, 58, 863–873. [Google Scholar] [CrossRef] [PubMed] [Green Version]
- Yang, J.; Luo, D.; Yang, B.; Frommer, W.B.; Eom, J.-S. SWEET11 and 15 as Key Players in Seed Filling in Rice. New Phytol. 2018, 218, 604–615. [Google Scholar] [CrossRef] [PubMed] [Green Version]
- Tabuchi, M.; Sugiyama, K.; Ishiyama, K.; Inoue, E.; Sato, T.; Takahashi, H.; Yamaya, T. Severe Reduction in Growth Rate and Grain Filling of Rice Mutants Lacking OsGS1;1, a Cytosolic Glutamine Synthetase1;1. Plant J. 2005, 42, 641–651. [Google Scholar] [CrossRef]
- Samuel, A.D.; Bungau, S.; Tit, D.M.; Melinte, C.E.; Purza, L.; Badea, G.E. Effects of Long Term Application of Organic and Mineral Fertilizers on Soil Enzymes. Rev. Chim. 2018, 69, 2608–2612. [Google Scholar] [CrossRef]
- Ramakrishna, W.; Yadav, R.; Li, K. Plant Growth Promoting Bacteria in Agriculture: Two Sides of a Coin. Appl. Soil Ecol. 2019, 138, 10–18. [Google Scholar] [CrossRef]
- Preece, C.; Peñuelas, J. A Return to the Wild: Root Exudates and Food Security. Trends Plant Sci. 2020, 25, 14–21. [Google Scholar] [CrossRef] [PubMed]
Figure 1.
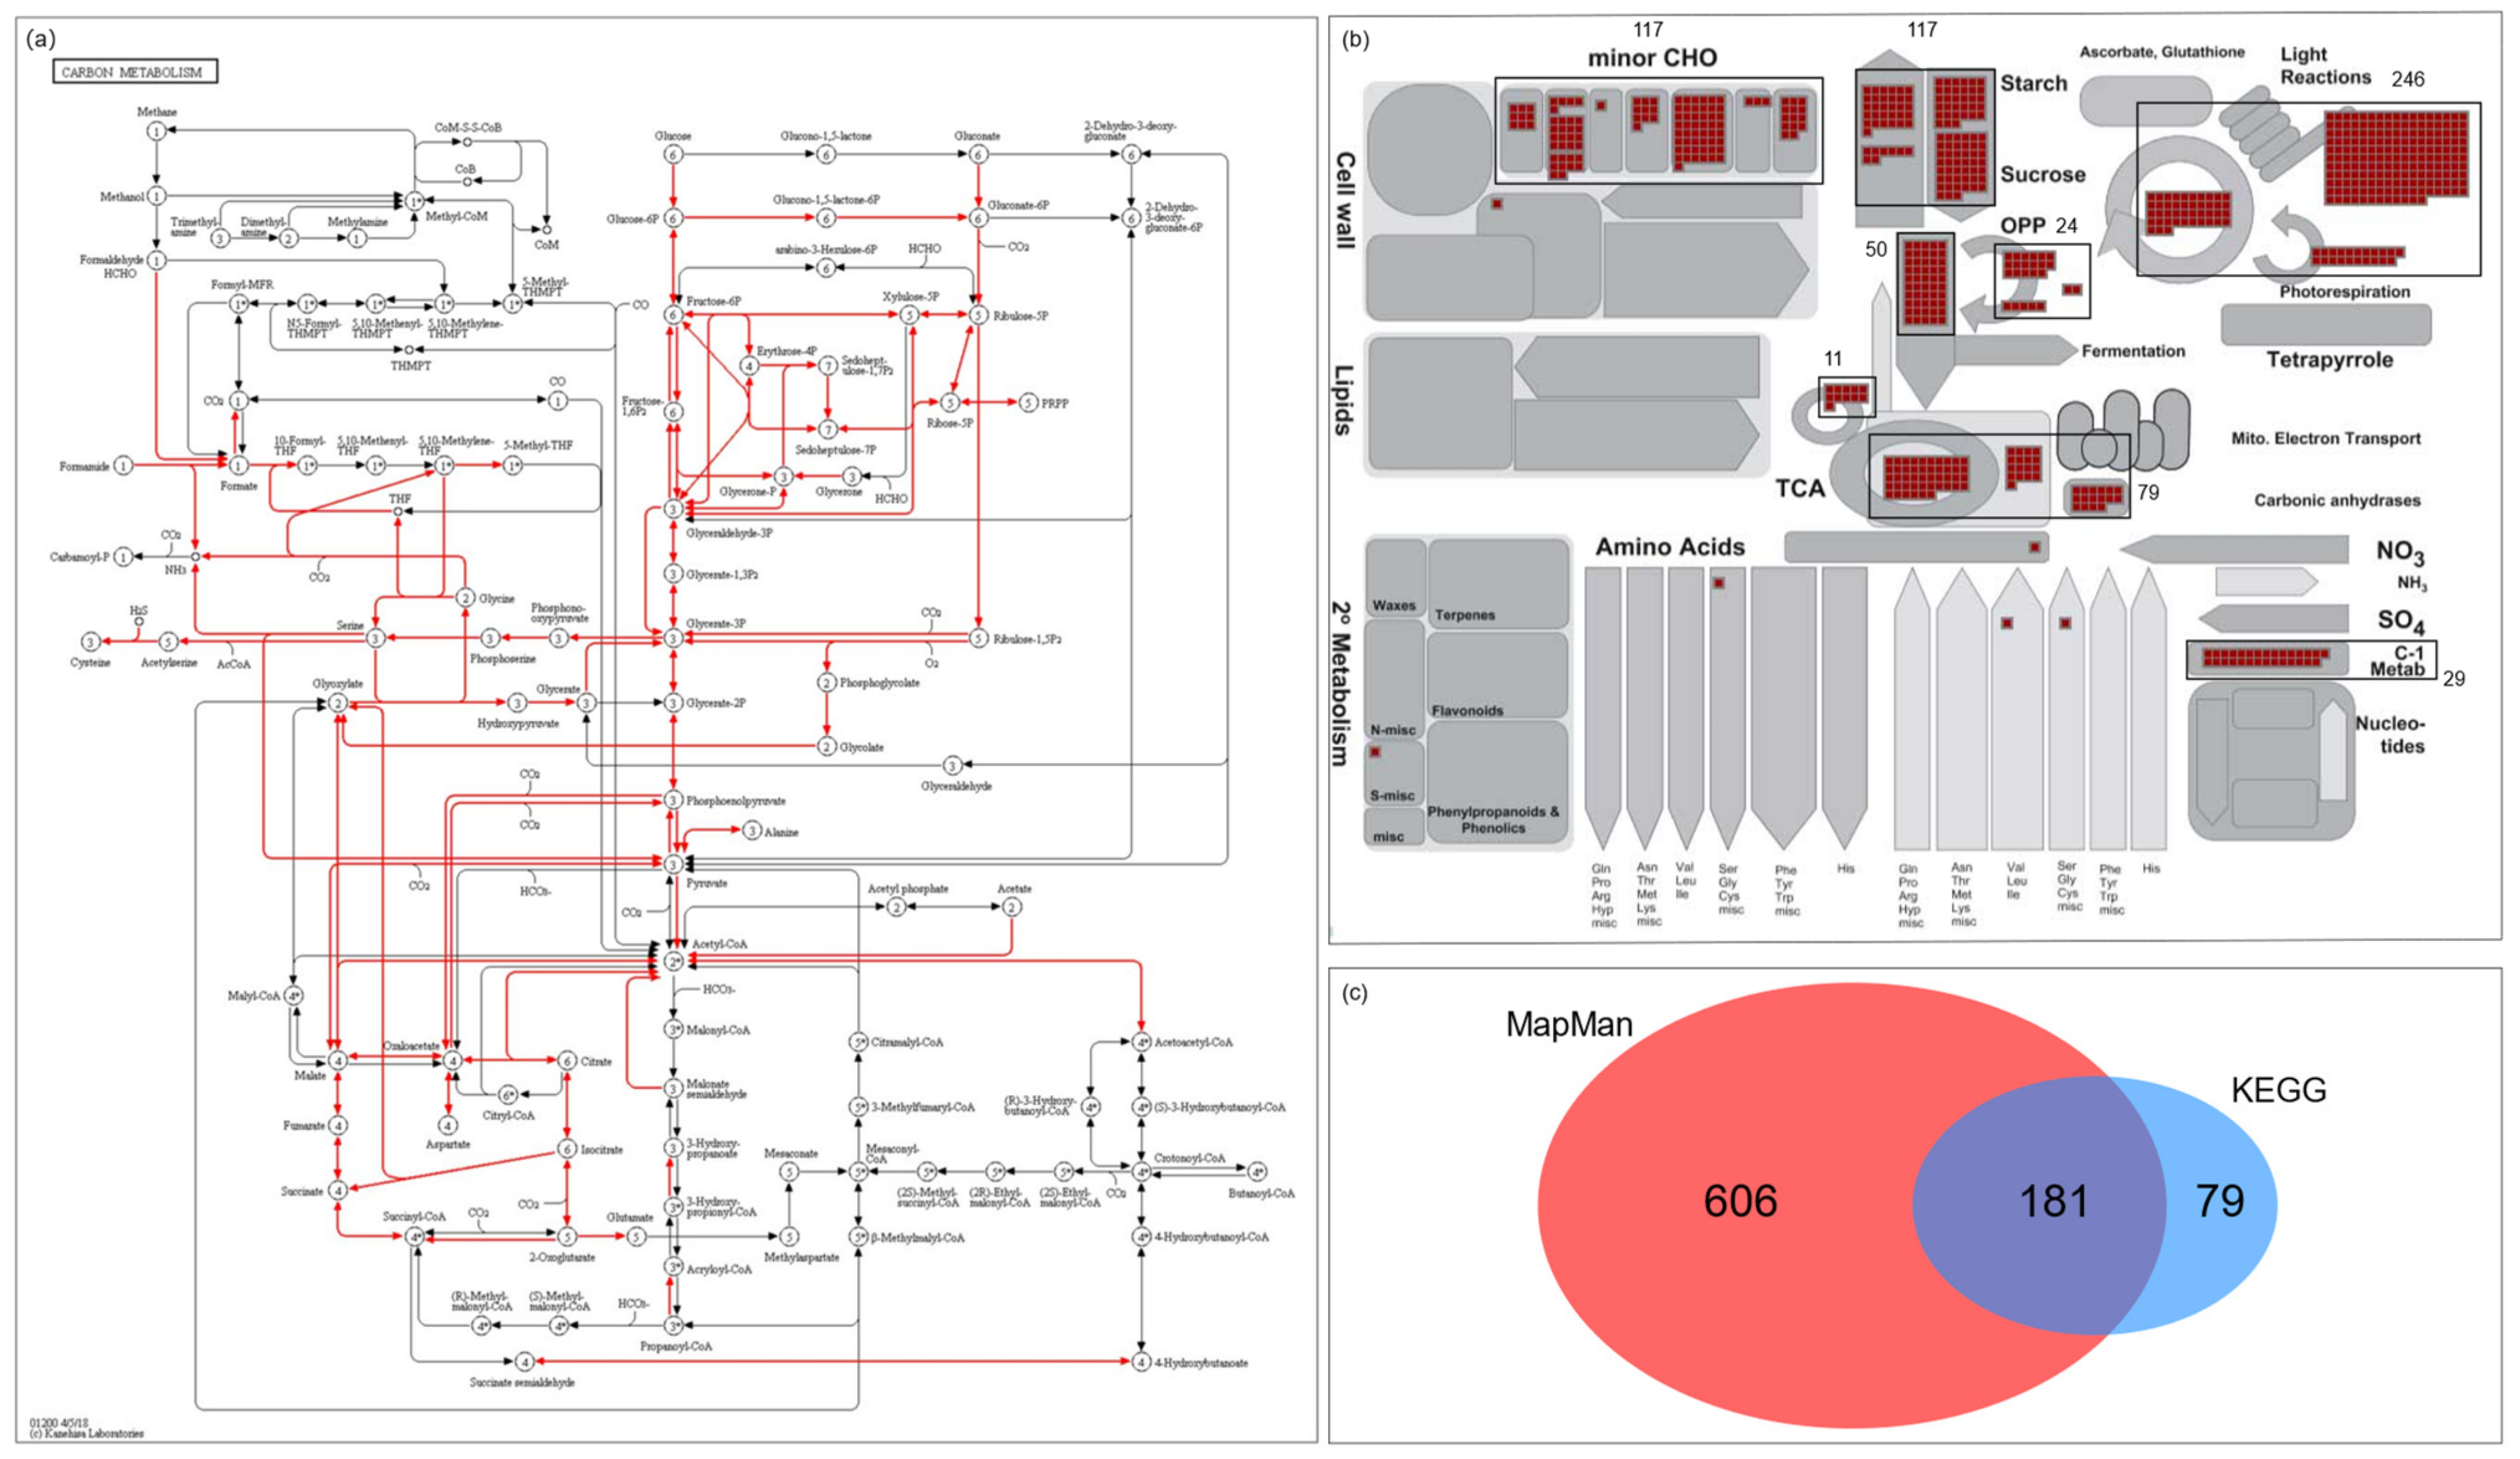
Schematic diagram summarizing 866 carbohydrate metabolism-related genes retrieved from the KEGG database and the MapMan toolkit. In the KEGG database, carbon metabolism pathway genes were selected and applied to the MapMan toolkit to find associated MapMan annotations. (a) There were eight bincodes related to 266 KEGG genes and with multiple members. (b) The bins with a black box and the total number of whole elements in each bin were indicated. Therefore, 681 MapMan genes associated with carbohydrate metabolism were selected. In addition, 106 carbohydrate transporters annotated in MapMan were included. A total of 787 genes from the MapMan toolkit and 266 from the KEGG database were collected. (c) Finally, 872 carbohydrate metabolism-related genes were collected. For further analysis, 866 genes with RGAP locus information were used. The detailed information of the 866 genes, including 181 overlapped genes, is listed in Table S3.
Figure 1.
Schematic diagram summarizing 866 carbohydrate metabolism-related genes retrieved from the KEGG database and the MapMan toolkit. In the KEGG database, carbon metabolism pathway genes were selected and applied to the MapMan toolkit to find associated MapMan annotations. (a) There were eight bincodes related to 266 KEGG genes and with multiple members. (b) The bins with a black box and the total number of whole elements in each bin were indicated. Therefore, 681 MapMan genes associated with carbohydrate metabolism were selected. In addition, 106 carbohydrate transporters annotated in MapMan were included. A total of 787 genes from the MapMan toolkit and 266 from the KEGG database were collected. (c) Finally, 872 carbohydrate metabolism-related genes were collected. For further analysis, 866 genes with RGAP locus information were used. The detailed information of the 866 genes, including 181 overlapped genes, is listed in Table S3.

Figure 2.
Distribution of functionally characterized genes from 866 carbohydrate metabolism-related genes according to phenotype. A literature search was performed to analyze the functional significance of the 866 carbohydrate metabolism-related genes. Functionally characterized gene information was retrieved from the OGRO database. To visualize the results of the 76 functionally characterized genes indicated in Table 1, three categories of major characteristic information from the OGRO database were used: physiology, morphology, and tolerance/resistance. The number of characterized genes was counted according to the minor characteristics within three major categories: physiology, morphology, and tolerance. The red box indicates the most enriched minor characteristics of the functions associated with the 76 functionally characterized genes.

Figure 3.
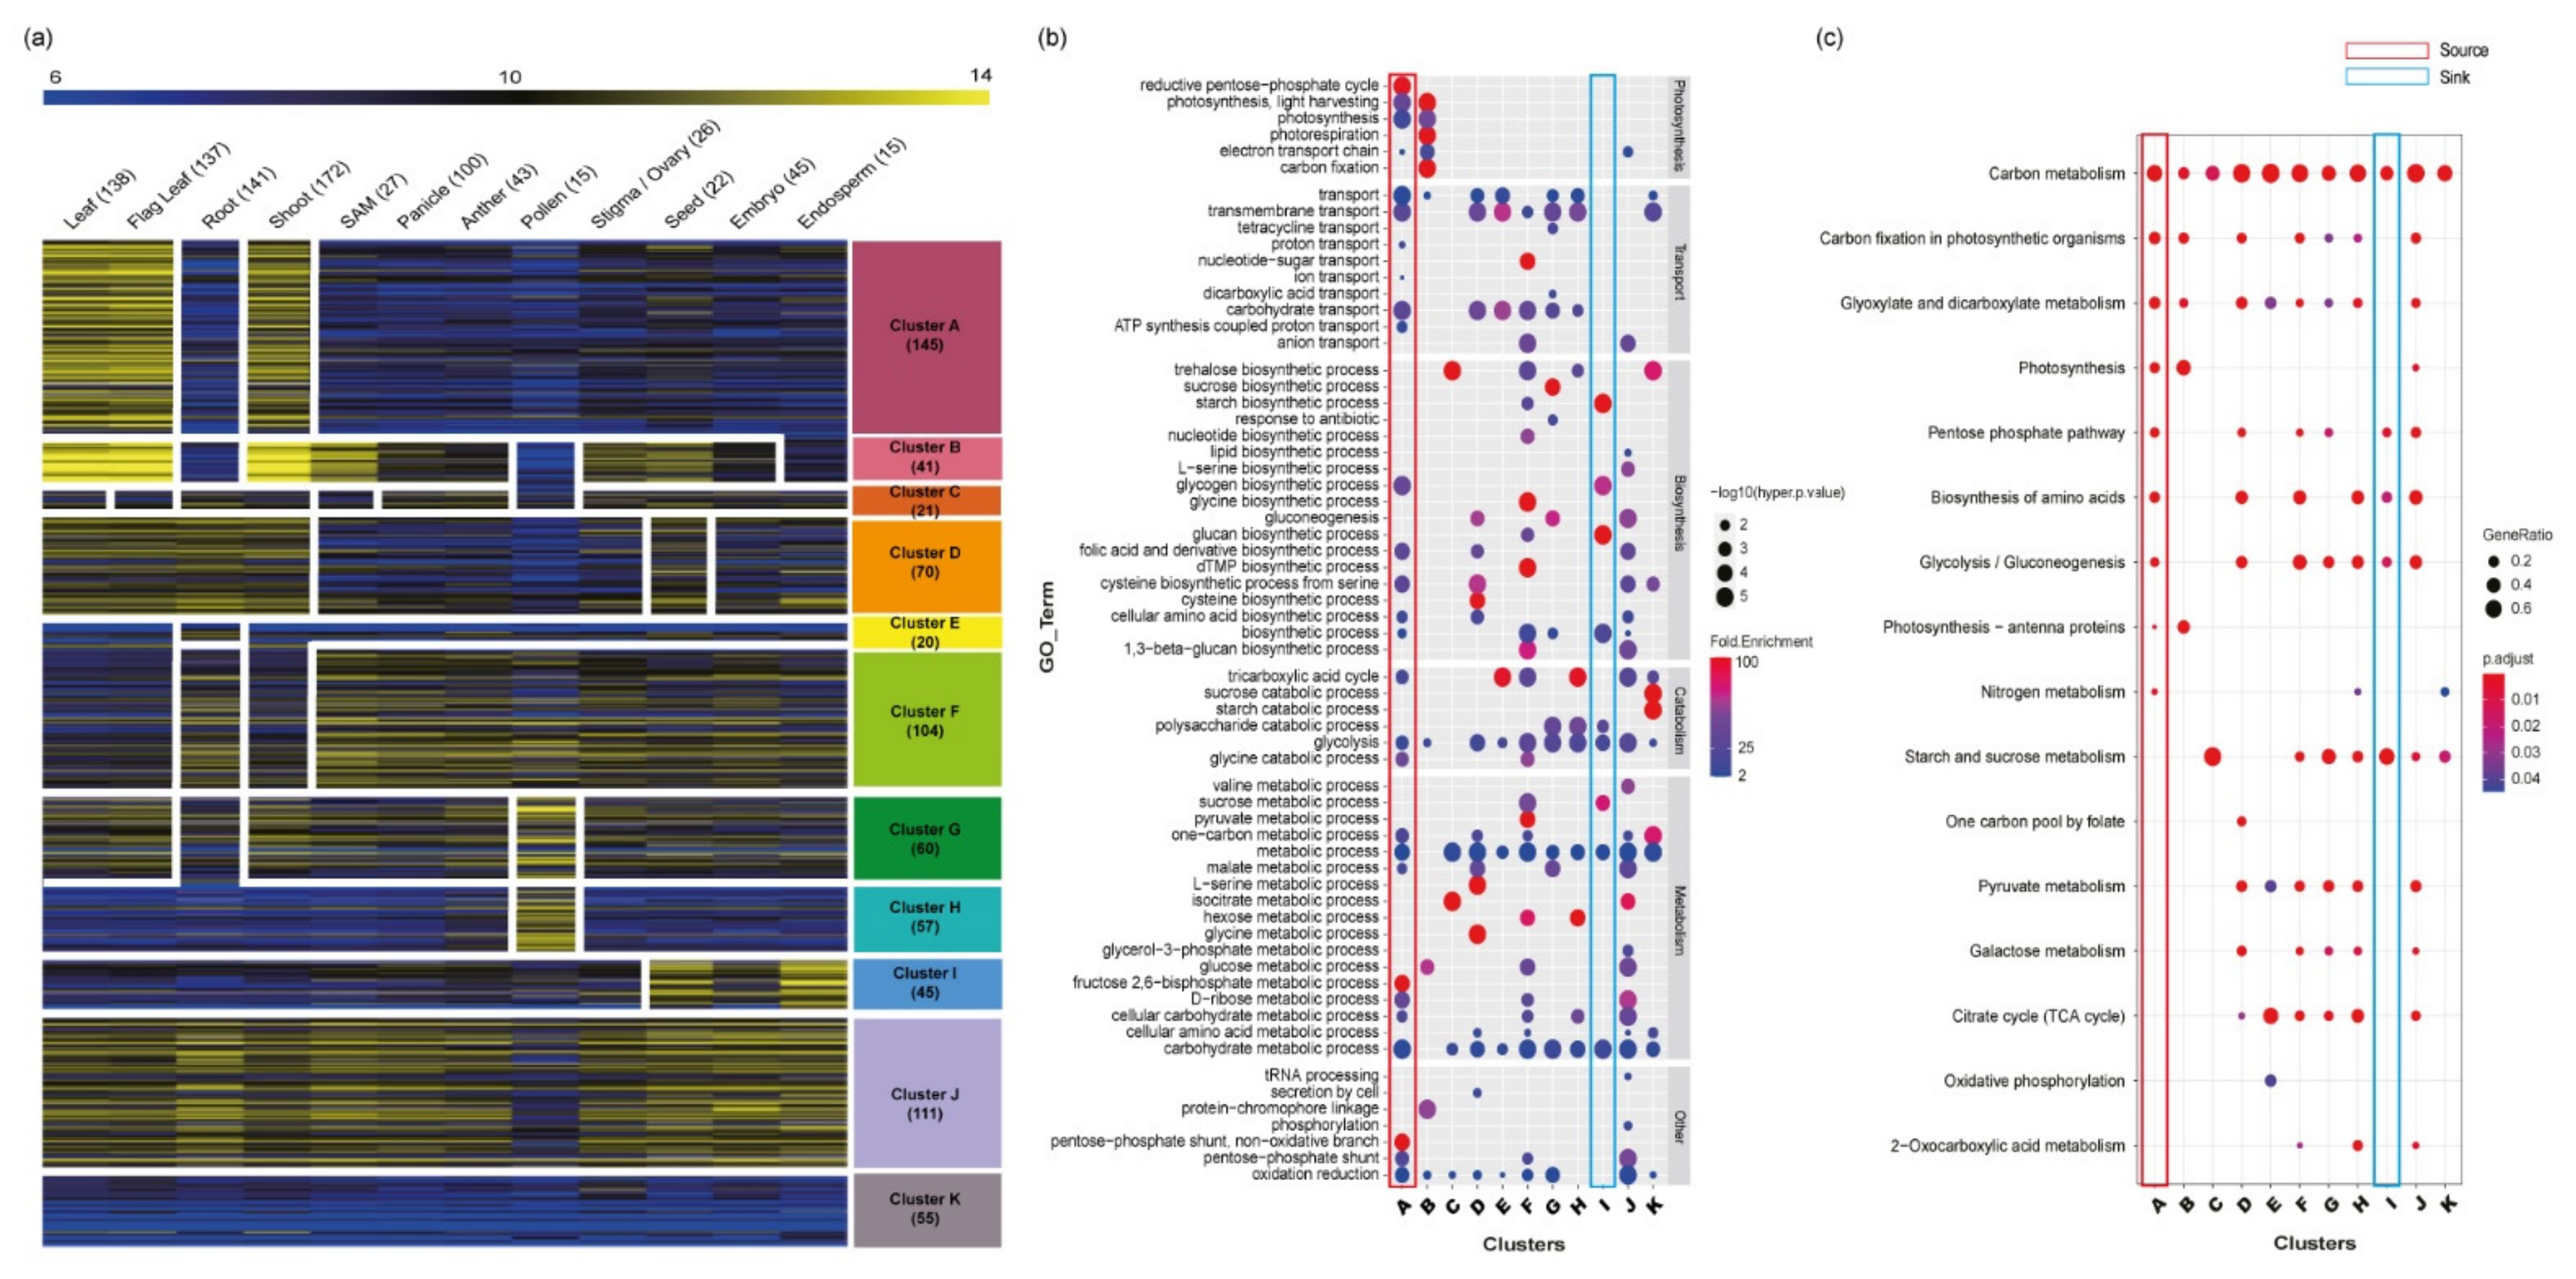
Dissection of the 866 carbohydrate metabolism-related genes using meta-anatomical expression profiles and functional enrichment analysis of 11 anatomical clusters. (a) Using large-scale microarray data, carbohydrate metabolism-related genes were visualized and dissected. The heatmap of the anatomical expression profiles of carbohydrate metabolism-related genes was grouped into 11 clusters via KMC clustering methods. The numbers after the name of each tissue/organ indicate the sample size, and the numbers below each cluster indicate the number of genes in the cluster. (b) GO enrichment analysis of 11 anatomical clusters. The GO enrichment assay revealed the characteristics of each cluster. GO terms were classified according to biological process GO terms. Dot color indicates the fold enrichment value (the blue color is 2, which is the minimum cutoff to select a significant fold enrichment value, and the red color indicates a higher fold enrichment value), and dot size indicates statistical significance (-log10(hyper p-value) is used, and a larger dot size means more significance). (c) KEGG enrichment analysis of 11 anatomical clusters. The enriched KEGG pathway indicated with the dot size represents the ratio of the selected genes to the total genes in the pathway, and the dot color illustrates the adjusted p-value. The numbers below the clusters indicate the number of mapped genes to each pathway. In addition, in GO and KEGG enrichment analyses, the source- and sink-related clusters are highlighted as red and blue boxes, respectively.
Figure 3.
Dissection of the 866 carbohydrate metabolism-related genes using meta-anatomical expression profiles and functional enrichment analysis of 11 anatomical clusters. (a) Using large-scale microarray data, carbohydrate metabolism-related genes were visualized and dissected. The heatmap of the anatomical expression profiles of carbohydrate metabolism-related genes was grouped into 11 clusters via KMC clustering methods. The numbers after the name of each tissue/organ indicate the sample size, and the numbers below each cluster indicate the number of genes in the cluster. (b) GO enrichment analysis of 11 anatomical clusters. The GO enrichment assay revealed the characteristics of each cluster. GO terms were classified according to biological process GO terms. Dot color indicates the fold enrichment value (the blue color is 2, which is the minimum cutoff to select a significant fold enrichment value, and the red color indicates a higher fold enrichment value), and dot size indicates statistical significance (-log10(hyper p-value) is used, and a larger dot size means more significance). (c) KEGG enrichment analysis of 11 anatomical clusters. The enriched KEGG pathway indicated with the dot size represents the ratio of the selected genes to the total genes in the pathway, and the dot color illustrates the adjusted p-value. The numbers below the clusters indicate the number of mapped genes to each pathway. In addition, in GO and KEGG enrichment analyses, the source- and sink-related clusters are highlighted as red and blue boxes, respectively.

Figure 4.
Validation of the dissected model and expression analysis of three carbohydrate metabolism-related genes in cluster H. (a) Heatmap analysis of three cluster H genes (Os10g26740, Os02g06540, and Os10g08022). Numeric values indicate an average of the normalized log2 intensity values. (b) Expression profiles of the three pollen-preferred genes based on qRT-PCR in various rice tissues: shoot, root, leaf, seed, young panicle, and pollen. (c) The expression of three pollen-preferred carbohydrate genes was significantly downregulated in the gori mutant compared to the wild-type plants. OsUbi5 (Os01g22490) was used as an internal control. There were three biological replicates from the performed t-test on independent samples, with Bonferroni correction. ** 0.001 < p ≤ 0.01; **** p ≤ 0.0001.

Figure 5.
Conceptual carbohydrate model integrated with cluster information. A conceptual model was constructed by summarizing dissected carbohydrate metabolism-related genes according to the anatomical expression pattern. This model indicates the clusters associated with key enzymes (INVs, SUTs, SUSs, and HXKs) for source-sink communication. Clusters A and B are associated with leaf and flag leaf, cluster E is associated with root, cluster H is associated with anther and pollen, cluster I is associated with grain, and cluster J is associated with the whole rice plant based on ubiquitous expression patterns. The GORI regulatory model for pollen tissue was also combined.


Table 1.
Summary of functionally characterized genes from the 866 carbohydrate metabolism-related genes.
Table 1.
Summary of functionally characterized genes from the 866 carbohydrate metabolism-related genes.
| LOC_id | Symbol | Character_major 1 | Character_minor | Method 2 | Detailed Functions | Reference |
|---|---|---|---|---|---|---|
| Os02g44230 | OsTPP1 | R or T | Cold tolerance | OX | Cold and salinity tolerance | [37] |
| Os05g44210 | OsTPS1 | R or T | Cold tolerance | OX | Cold, drought, and salinity tolerance | [38] |
| Os01g64660 | moc2 | MT | Culm leaf | KO | Tiller bud outgrowth; tillering | [39] |
| Os12g44380 | ossut2 | MT | Culm leaf | KO | Sugar export; growth retardation | [40] |
| Os05g44210 | OsTPS1 | R or T | Drought tolerance | OX | Cold, drought, and salinity tolerance | [38] |
| Os06g36560 | OsMIOX | R or T | Drought tolerance | OX | Drought tolerance | [41] |
| Os03g07480 | OsSUT1 | MT | Dwarf | KD | Dwarfism; flowering time | [42] |
| Os04g56320 | OsrcaA2 | MT | Dwarf | KD/OX | Dwarfism | [43] |
| Os07g05820 | OsGLO4 | R or T | Dwarf | KD | Growth inhibition | [44] |
| Os11g05110 | OsPK1 | MT | Dwarf | KO | Elongation of uppermost internode; dwarfism | [45] |
| Os11g05110 | ospk1 | MT | Dwarf | KO | Dwarfism; seed color; internode color; regulation of gibberellin and ABA biosynthesis | [46] |
| Os12g44380 | ossut2 | MT | Dwarf | KO | Sugar export; growth retardation | [40] |
| Os01g44220 | osagpl2 | PT | Eating quality | KO | Starch biosynthesis | [47] |
| Os01g55540 | OsAAT2 | PT | Eating quality | OX | Seed amino acid and protein content | [48] |
| Os02g52710 | Amy1A | PT | Eating quality | KD | Seed starch content; high temperature-triggered grain chalkiness | [49] |
| Os03g03720 | OsGAPDHB | PT | Eating quality | KD | Fragrance rice | [50] |
| Os03g09250 | RINO1 | PT | Eating quality | KD | Seed phytic acid content | [51] |
| Os03g09250 | RINO1 | PT | Eating quality | KD | Seed phytic acid content | [52] |
| Os03g52760 | lpaN15-186 | PT | Eating quality | KO | Seed phytic acid content | [53] |
| Os03g55090 | pho1 | PT | Eating quality | KO | Seed starch content; grain maturation | [54] |
| Os05g32710 | OsISA2 | PT | Eating quality | OX | Seed starch content | [55] |
| Os05g33570 | flo4 | PT | Eating quality | KO | Seed protein and lipid content | [56] |
| Os06g04200 | wx | PT | Eating quality | NV | Seed amylose content | [57] |
| Os06g06560 | OsSSI | PT | Eating quality | KO | Seed amylopectin content | [58] |
| Os06g12450 | SSIIa | PT | Eating quality | KD | Chalky kernel; amylose content | [59] |
| Os06g12450 | ALK | PT | Eating quality | NV | Gelatinization temperature; gel consistency | [60] |
| Os08g09230 | SSIIIa | PT | Eating quality | KD | Chalky kernel; amylose content | [59] |
| Os08g09230 | flo5 | PT | Eating quality | KO | Seed starch content | [61] |
| Os08g09230 | ss3a | PT | Eating quality | KO | Seed starch content | [62] |
| Os08g25734 | osagps2 | PT | Eating quality | KO | Seed starch content | [47] |
| Os08g40930 | OsISA1 | PT | Eating quality | OX | Seed starch content | [55] |
| Os09g28400 | Amy3A | PT | Eating quality | KD | Seed starch content; high temperature-triggered grain chalkiness | [49] |
| Os09g28420 | Amy3B | PT | Eating quality | KD | Seed starch content; high temperature-triggered grain chalkiness | [49] |
| Os09g29404 | isa3 | PT | Eating quality | KO | Seed starch content | [63] |
| Os01g72090 | se13 | PT | Flowering | KO | Photoperiodic response | [64] |
| Os02g34560 | Oscyt-inv1 | PT | Flowering | KO | Root cell development; flowering time; fertility | [65] |
| Os03g07480 | OsSUT1 | PT | Flowering | KD | Dwarfism; flowering time | [42] |
| Os02g52710 | AmyI-1 | PT | Germination dormancy | KD/OX | Starch degradation; seed germination; seedling growth | [66] |
| Os03g07480 | OsSUT1 | R or T | Insect resistance | Others | Upregulation by aphid feeding; transfer sucrose | [67] |
| Os02g47020 | SBPase | R or T | Other stress resistance | OX | Photosynthetic ability under high-temperature condition | [68] |
| Os02g01150 | OsHPR1 | PT | Others | KD/OX | Photorespiratory pathway | [69] |
| Os05g50380 | LSU3 | Others | Others | KO | Culm starch content | [70] |
| Os01g69030 | OsSPS1 | PT | Panicle flower | KO | Pollen germination through sucrose synthesis | [71] |
| Os02g34560 | Oscyt-inv1 | MT | Root | KO | Root cell development; flowering time; fertility | [65] |
| Os12g44380 | ossut2 | MT | Root | KO | Sugar export; growth retardation | [40] |
| Os02g17500 | OsGMST1 | R or T | Salinity tolerance | KD | Salinity tolerance | [72] |
| Os02g44230 | OsTPP1 | R or T | Salinity tolerance | OX | Cold and salinity tolerance | [37] |
| Os03g07480 | OsSUT1 | R or T | Salinity tolerance | KD | Salinity tolerance | [73] |
| Os05g44210 | OsTPS1 | R or T | Salinity tolerance | OX | Cold, drought, and salinity tolerance | [38] |
| Os08g03290 | OsGAPC3 | R or T | Salinity tolerance | OX | Salinity tolerance | [74] |
| Os01g44220 | OsAGPL2 | MT | Seed | KO | Glassy/vitreous, shrunken grain | [75] |
| Os03g55090 | pho1 | MT | Seed | KO | Seed starch content; grain maturation | [54] |
| Os04g33740 | GIF1 | MT | Seed | NV | Grain filling; grain size | [12] |
| Os08g25734 | OsAGPS2b | PT | Seed | KO | Seed weight; starch content; AGPase activities from developing endosperms of the seed | [75] |
| Os11g05110 | ospk1 | MT | Seed | KO | Dwarfism; seed color; internode color; Regulation of gibberellin and ABA biosynthesis | [46] |
| Os02g52710 | AmyI-1 | MT | Shoot seedling | KD/OX | Starch degradation; seed germination; seedling growth | [66] |
| Os01g11054 | Osppc4 | PT | Source activity | KD | Ammonium assimilation in leaves | [76] |
| Os01g64660 | oscfbp1 | PT | Source activity | KO | Photosynthetic sucrose biosynthesis; growth retardation | [77] |
| Os01g64960 | qNPQ1-2 | PT | Source activity | NV | Nonphotochemical quenching capacity; protection from photoinhibition | [78] |
| Os01g64960 | PsbS | PT | Source activity | KD/OX | Nonphotochemical quenching capacity; photosynthetic rate in fluctuating light conditions | [79] |
| Os02g32660 | BE2b | PT | Source activity | Others | Starch biosynthesis in endosperm; amylopectin biosynthesis; branch formation | [80] |
| Os03g57220 | OsGLO1 | PT | Source activity | KD | Photorespiration | [81] |
| Os04g56320 | rca | PT | Source activity | KD | Rubisco activity | [82] |
| Os05g40180 | OsSTN8 | PT | Source activity | KO | Photosystem II repair during high light illumination | [83] |
| Os06g06560 | SS1 | PT | Source activity | Others | Starch biosynthesis in endosperm; chain elongation | [80] |
| Os06g51084 | BE1 | PT | Source activity | Others | Starch granule binding; amylopectin structure | [80] |
| Os07g05820 | OsGLO4 | PT | Source activity | KD | Rubisco activation; photosynthesis rate | [44] |
| Os08g45190 | PGR5 | PT | Source activity | KD | Photosynthetic capacity | [84] |
| Os10g37180 | OsGDCH | PT | Source activity | KD | Leaf senescence induced by reactive oxygen species | [85] |
| Os12g17600 | rbcS | PT | Source activity | KD | Rubisco content; photosynthetic capacity | [86] |
| Os12g17600 | OsRBCS2 | PT | Source activity | KD | Rubisco content | [87] |
| Os12g17600 | rbcS | PT | Source activity | KD/OX | Rubisco content; photosynthetic capacity | [88] |
| Os12g19381 | OsRBCS5 | PT | Source activity | KD | Rubisco content | [87] |
| Os12g19470 | OsRBCS4 | PT | Source activity | KD | Rubisco content | [87] |
| Os12g44380 | ossut2 | PT | Source activity | KO | Sugar export; growth retardation | [40] |
| Os02g34560 | Oscyt-inv1 | PT | Sterility | KO | Root cell development; flowering time; fertility | [65] |
1 Major functional categories: R or T, resistance or tolerance; MT, morphological trait; PT, physiological trait. 2 Methods used to study: OX, overexpression; KO, knockout; KD, knockdown; NV, natural variation.
Publisher’s Note: MDPI stays neutral with regard to jurisdictional claims in published maps and institutional affiliations. |
© 2021 by the authors. Licensee MDPI, Basel, Switzerland. This article is an open access article distributed under the terms and conditions of the Creative Commons Attribution (CC BY) license (https://creativecommons.org/licenses/by/4.0/).
Share and Cite
MDPI and ACS Style
Hong, W.-J.; Jiang, X.; Choi, S.-H.; Kim, Y.-J.; Kim, S.-T.; Jeon, J.-S.; Jung, K.-H. A Systemic View of Carbohydrate Metabolism in Rice to Facilitate Productivity. Plants 2021, 10, 1690. https://doi.org/10.3390/plants10081690
AMA Style
Hong W-J, Jiang X, Choi S-H, Kim Y-J, Kim S-T, Jeon J-S, Jung K-H. A Systemic View of Carbohydrate Metabolism in Rice to Facilitate Productivity. Plants. 2021; 10(8):1690. https://doi.org/10.3390/plants10081690
Chicago/Turabian StyleHong, Woo-Jong, Xu Jiang, Seok-Hyun Choi, Yu-Jin Kim, Sun-Tae Kim, Jong-Seong Jeon, and Ki-Hong Jung. 2021. "A Systemic View of Carbohydrate Metabolism in Rice to Facilitate Productivity" Plants 10, no. 8: 1690. https://doi.org/10.3390/plants10081690
Note that from the first issue of 2016, this journal uses article numbers instead of page numbers. See further details here.