Article

Absolute Absorption Cross-Section of the Ã←X˜ Electronic Transition of the Ethyl Peroxy Radical and Rate Constant of Its Cross Reaction with HO2

1
Université Lille, CNRS, UMR 8522-PC2A-Physicochimie des Processus de Combustion et de l’Atmosphère, F-59000 Lille, France
2
Laboratory of Atmospheric Physico-Chemistry, Anhui Institute of Optics and Fine Mechanics, HFIPS, Chinese Academy of Sciences, Hefei 230031, China
3
Science Island Branch, Graduate School, University of Science and Technology of China, Hefei 230026, China
*
Author to whom correspondence should be addressed.
Photonics 2021, 8(8), 296; https://doi.org/10.3390/photonics8080296
Submission received: 24 June 2021 / Revised: 20 July 2021 / Accepted: 21 July 2021 / Published: 24 July 2021
(This article belongs to the Special Issue Modern Spectroscopic Techniques for Trace Detection)

Abstract

:
The absolute absorption cross-section of the ethyl peroxy radical C2H5O2 in the Ã← X ˜ electronic transition with the peak wavelength at 7596 cm−1 has been determined by the method of dual wavelengths time resolved continuous wave cavity ring down spectroscopy. C2H5O2 radicals were generated from pulsed 351 nm photolysis of C2H6/Cl2 mixture in presence of 100 Torr O2 at T = 295 K. C2H5O2 radicals were detected on one of the CRDS paths. Two methods have been applied for the determination of the C2H5O2 absorption cross-section: (i) based on Cl-atoms being converted alternatively to either C2H5O2 by adding C2H6 or to hydro peroxy radicals, HO2, by adding CH3OH to the mixture, whereby HO2 was reliably quantified on the second CRDS path in the 2ν1 vibrational overtone at 6638.2 cm−1 (ii) based on the reaction of C2H5O2 with HO2, measured under either excess HO2 or under excess C2H5O2 concentration. Both methods lead to the same peak absorption cross-section for C2H5O2 at 7596 cm−1 of σ = (1.0 ± 0.2) × 10−20 cm2. The rate constant for the cross reaction between of C2H5O2 and HO2 has been measured to be (6.2 ± 1.5) × 10−12 cm3 molecule−1 s−1.

1. Introduction

The oxidation of volatile organic compounds (VOCs) in the troposphere is mainly driven by hydroxyl radicals (OH) and leads, after addition of O2, to the formation of organic peroxy radicals (RO2). The fate of these RO2 radicals depends on the chemical composition of the environment. In a polluted atmosphere they react mainly with nitric oxide (NO) to form alkoxy radicals or react with nitrogen dioxide (NO2) to form peroxynitrates (RO2NO2). Subsequent to the reaction with NO, alkoxy radicals react with O2 to form hydro peroxy radicals (HO2). HO2 further oxidises NO into NO2 and thus regenerates OH, closing the quasi-catalytic cycle. The photolysis of produced NO2 is the only relevant chemical source of tropospheric ozone. In clean environments with low NOx (NOx = NO + NO2) concentrations, the dominant loss of RO2 is due to its reaction with HO2 forming hydroperoxides ROOH and terminating the radical reaction chain. In addition, RO2 radicals can react either with themselves as self-reaction (RO2 + RO2) or with other R’O2 as cross-reaction (RO2 + R’O2) or with OH radicals (RO2 + OH) [1,2,3,4,5].
Ethane is one of the most abundant non-methane hydrocarbons in the atmosphere, and its atmospheric oxidation leads to the formation of the ethyl peroxy radical, C2H5O2. A reliable detection of this radical is therefore highly desirable for studying its reactivity and thus understanding its embedded chemistry. Previous studies of peroxy chemistry have mostly been carried out by UV absorption spectroscopy in the B ˜ X ˜ electronic transition: this method gives a good sensitivity for peroxy radicals due to large absorption cross-sections, but the selectivity is poor because the absorption spectra are unstructured and the spectra of many different species are overlapping.
The Ã← X ˜ electronic transition of peroxy radicals is located in the near IR region. At room temperature, these transitions form rotationally unresolved envelopes with typical features about 1 cm−1 or more wide and allow a more selective detection of peroxy radicals, compared to UV absorption. The shape of such unresolved absorption features is typically only very little influenced by temperature or pressure, in contrast to the resolved spectra of small species like OH or HO2: sharp lines are observed for transitions between different rotational or vibration states, where pressure is broadening the lines and temperature can change the relative populations of the different states and thus the cross-sections of the lines. However, due to small absorption cross-sections of the Ã← X ˜ electronic transition of peroxy radicals (~10−20–10−21 cm2), these transitions have not attracted much attention after they had been located for the first time by Hunziker and Wendt in 1976 [6,7]. Interest has been revived many years later when the highly sensitive absorption technique of cavity ring down spectroscopy (CRDS) has been developed [8,9], which can make up for the small absorption cross-sections. The first report on using this technique for the detection of peroxy radicals was in 2000 [10]: T. Miller and coworkers obtained pulsed near IR radiation by stimulated Raman shifting of the output of a pulsed dye laser in molecular hydrogen. The output of such a laser source has a typical bandwidth of about 0.03 cm−1 and is thus much narrower than the Ã← X ˜ electronic transition of peroxy radicals. They measured the absorption spectra of the methyl and ethyl peroxy radicals, but determined only the absorption cross-section for the methyl peroxy radical. The peak of the Ã← X ˜ transition for C2H5O2 was found around 7596 cm−1.
A few years later, Atkinson and Spillman [11] measured again the spectra of both radicals, now using a continuous external cavity diode laser to perform cw-CRDS with a much narrower bandwidth (~3 × 10⁻⁵ cm−1). They confirmed the overall shape of the absorption spectrum, and measured for the first time the absorption cross-section for C2H5O2 using the kinetic method [12,13,14,15]. This method can be applied, if the rate constant of a radical-radical reaction is known, because the initial concentration and thus the absorption cross-section can in principle be determined from the shape of the kinetic decay. The self-reaction can be described as follows.
A + A → B
d [ A ] d t = 2 k [ A ] 2
Integration of Equation (1) leads to
1 [ A ] = 1 [ A ] 0 + 2 k t
Hence, plotting 1/[A] as a function of time leads to a straight line with the slope being 2k. In the case where the rate constant is known, but not the absolute concentration of A, the absorption coefficient α = σ × [A] can be used in Equation (2) instead of [A], leading to
1 σ × [ A ] = 1 σ × [ A ] 0 + 2 k σ t
Plotting 1/σ × [A] leads to a straight line with the slope being m = 2k/σ while the intercept I = 1/σ × [A]0. However, different complications can arise from this method: radicals can be lost through other processes too, for example through diffusion out of the photolysed volume or through unidentified secondary reactions in which case the decays are faster than expected from pure self-reaction only, and the retrieved absorption cross-section would be too small. In the case of peroxy radicals, this method has another complication: the self-reaction of peroxy radicals (R1) has several product pathways, and one of them leads to the formation of HO2 radicals:
2 C2H5O2 → 2 C2H5O + O2
→ C2H5OH + CH3CHO + O2
followed, in presence of O2, by (R2):
C2H5O + O2→ CH3CHO + HO2
The HO2 radicals react with C2H5O2
C2H5O2 + HO2→ C2H5OOH + O2
with (R3) having a rate constant faster than (R1). As a result, the C2H5O2 decays are accelerated by the formation of HO2, and therefore when using Equation (3) for (R1), the obtained rate constant k1 is called k1,obs and the acceleration has to be taken into account to retrieve the “real” rate constant k1 from C2H5O2 decays. Using the recommended value of k1,obs in the kinetic method, Atkinson and Spillman [11] obtained an absorption cross-section for C2H5O2 at 7596 cm−1 of σ = (3.0 ± 1.5) × 10−21 cm2.
Another work on the ethyl peroxy spectrum from the Miller group [16] scanned the Ã← X ˜ electronic transition over a large wavelength range and identified the transitions for the two different isomers. Indeed, ethyl peroxy radicals exist in an equilibrium between two stable conformers with the dihedral angles between the O-O-C and O-C-C planes being 0° for the T (trans) and 120° for the G (gauche) conformer. The peak absorptions for both conformers were located well separated at 7362 cm−1 for the T- and 7592 cm−1 for the G-conformer. In this work, they used a different method to estimate the absorption cross-section: peroxy radicals were generated by the reaction of Cl-atoms with C2H6, with the Cl-atoms being generated by 193 nm photolysis of oxalylchloride, (COCl)2. To obtain the concentration of C2H5O2, they measured the photolysis laser energy with and without precursor, and calculated the Cl-atom concentration from the difference. Supposing that each Cl-atom generated one C2H5O2 radical, they obtained σ = 4.4 × 10⁻²¹ cm2 for C2H5O2 at 7596 cm−1.
The next work on the ethyl peroxy spectrum from the Miller group [17] used a different method to obtain the absorption cross-section: in a dual-path CRDS set-up, the concentration of HCl (generated from the reaction of Cl-atoms with C2H6) was measured on one path while the absorption of C2H5O2 was measured simultaneously on the other path. Again supposing that each HCl-molecule had generated one C2H5O2 radical, they obtained σ = (5.29 ± 0.20) × 10−21 cm2 for C2H5O2 at 7596 cm−1.
In the most recent work from the Miller group [18], the above absorption cross-section was validated indirectly through the kinetic method: the C2H5O2 absorption profiles were converted to C2H5O2 concentration-time profiles using the above absorption cross-section, and the rate constant k1,obs for the self-reaction was extracted. Good agreement with other literature data was found, which was taken as an indication that the absorption cross-section is valid. A summary of previous results as well as the results obtained in this work is presented in Table 1.
In this work we present a new determination of the absorption cross-section, based on two different approaches. The first one is comparable to one of the Miller methods [17] and will be called back-to-back method: in our dual-path CRDS set-up we generate Cl-atoms and transform them to HO2 through reaction with CH3OH, with HO2 being quantified on one path at 6638.2 cm−1. Directly after, the Cl-atoms were transformed to C2H5O2 by adding C2H6 instead of CH3OH to the reaction mixture and the C2H5O2 absorption was measured on the second path. Supposing that the Cl concentration stays the same between both experiments and that in both cases all Cl-atoms are converted to either HO2 (which can be quantified reliably) or to C2H5O2, the absorption cross-section of C2H5O2 is determined relative to the one of HO2. The second approach is a variation of the kinetic method such as used by Atkinson and Spillman [11] and Melnik et al. [18], but not based on the self-reaction of C2H5O2, but on the cross reaction between HO2 and C2H5O2. This reaction has been measured in a wide range of concentrations under either excess of HO2 or excess of C2H5O2. In the first case, the rate constant is retrieved by adjusting the C2H5O2 decays with the absolute concentration of HO2 being fixed, while in the second case the rate constant is fixed to the value determined just before, and now the best fit of the HO2 decay is achieved by adjusting the absolute concentration of C2H5O2, i.e., the absorption cross-section.

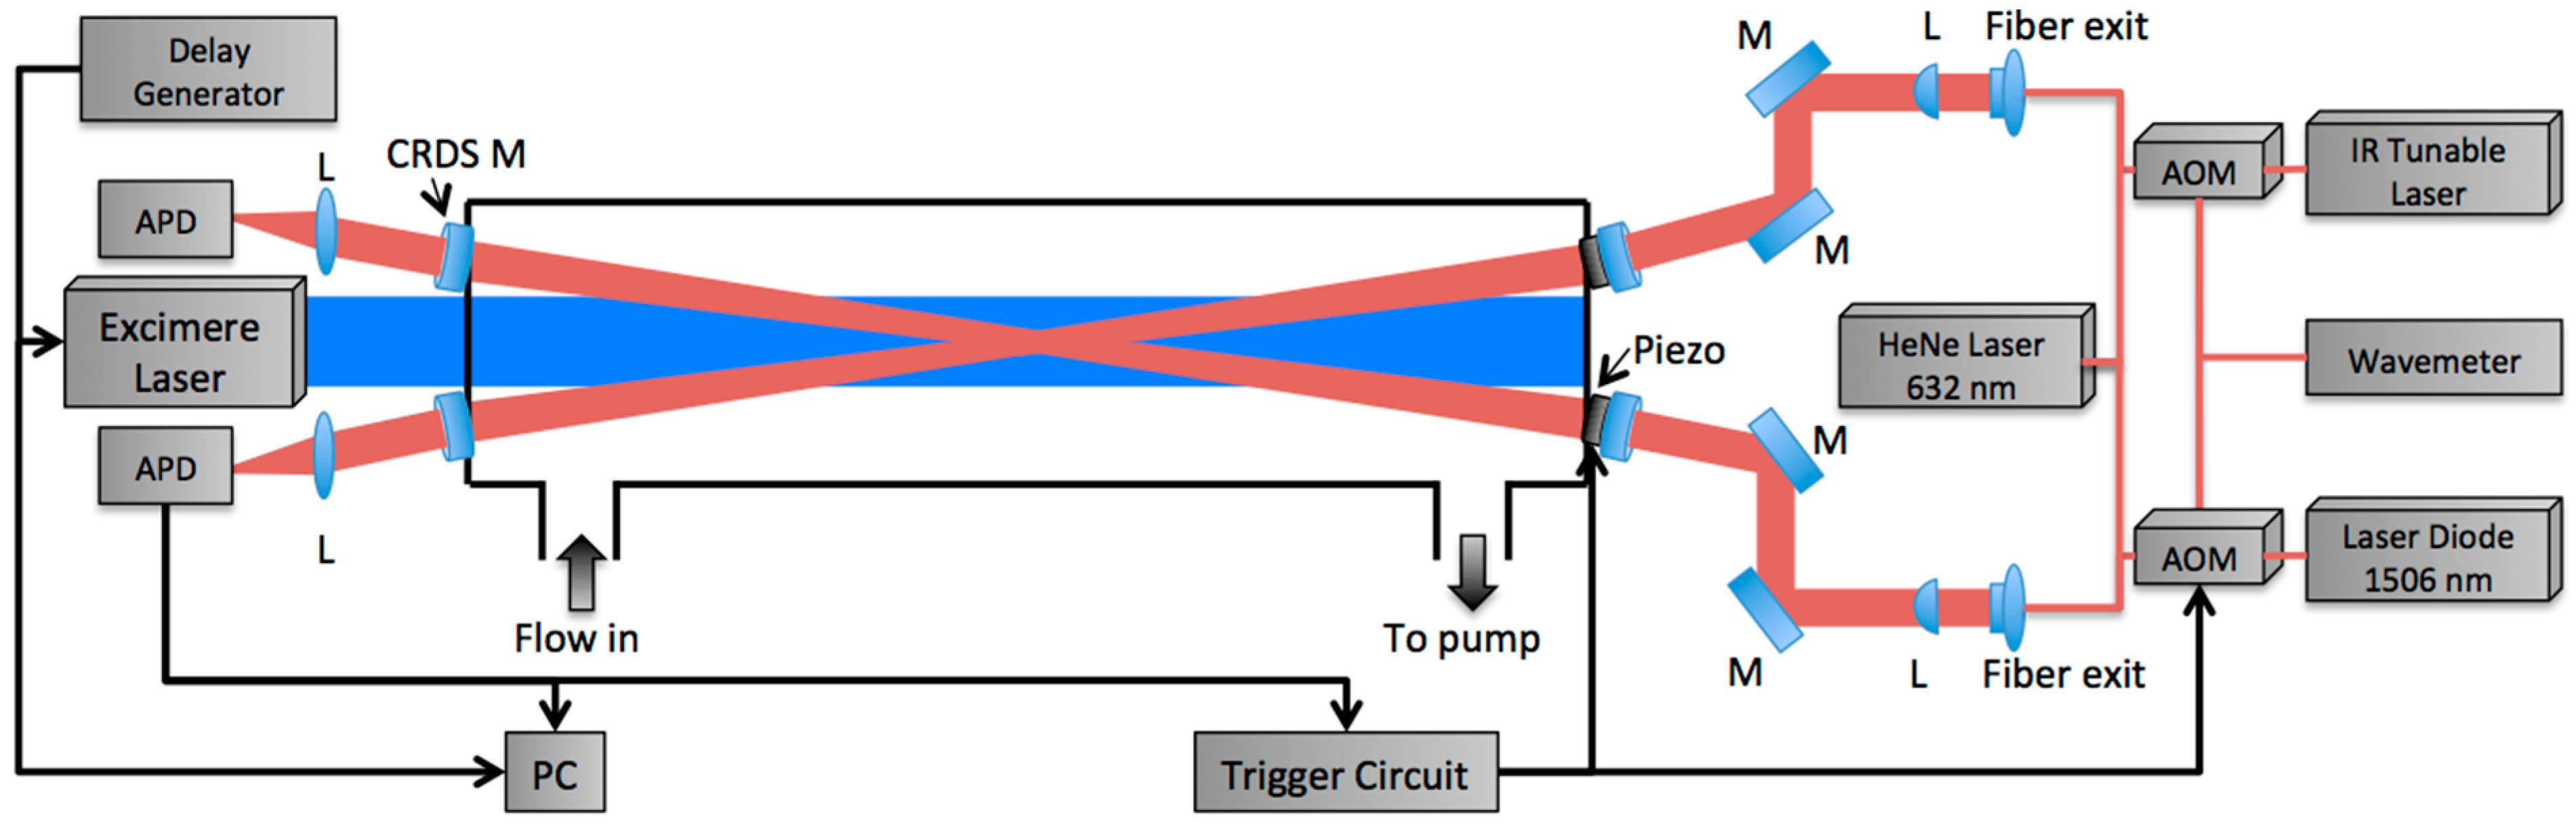
2. Materials and Methods

The setup has been described in detail before [19,20,21,22,23] and is only briefly discussed here (Figure 1).
The setup consisted of a 0.79 m long flow reactor made of stainless steel. The photolysis laser (Lambda Physik LPX 202i, XeF at 351 nm) width is delimited to 2 cm and passes through the reactor longitudinally. The flow reactor contains two identical continuous wave cavity ring-down spectroscopy (cw-CRDS) absorption paths, which were installed in a small angle with respect to the photolysis path. An overlap of the absorption path with the photolysis beam of 0.288 m is achieved. Both beam paths were tested for a uniform overlap with the photolysis beam before experiments were done. For this purpose, both cw-CRDS instruments were operated to simultaneously measure HO2 concentrations. Deviations between HO2 concentrations were less than 5%, demonstrating that the photolysis laser was very well aligned, i.e., both light paths probed a very similar photolysed volume in the reactor. A small helium purge flow prevented the mirrors from being contaminated. Two different DFB lasers are used for the detection of the two species and each one is coupled into one of the cavities by systems of lenses and mirrors. Each probe beam passed an acousto-optic modulator (AOM, AAoptoelectronic) to rapidly turn off the 1st order beam once a user-set threshold for light intensity in the cavity was reached, in order to measure the ring-down event. A home-made tracking system is used to increase the number of ring-down events [21]. Then, the decay of light intensity is recorded and an exponential fit is applied to retrieve the ring-down time. The absorption coefficient α is derived from Equation (4).
α = [ A ]   ×   σ A = R L c ( 1 τ 1 τ 0 )
where τ is the ring-down time with an absorber present; τ0 is the ring-down time with no absorber present; σA is the absorption cross-section of the absorbing species A; RL is the ratio between cavity length (79 cm) and effective absorption path (28.8 cm); c is the speed of light.
Ethyl peroxy radicals were generated by pulsed 351 nm photolysis of C2H6/Cl2/O2 mixtures initiating the reaction sequence (R4), (R5) and (R6):
Cl2 + hν351 nm → 2 Cl
C2H6 + Cl → C2H5 + HCl
C2H5 + O2 + M → C2H5O2 + M
C2H5 + O2 → C2H4 + HO2
For studying the cross reaction with HO2, methanol, CH3OH, has been added in varying concentrations to the mixture.
CH3OH + Cl → CH2OH + HCl
CH2OH + O2 → CH2O + HO2
In order to rapidly convert C2H5O into HO2 through (R2), all experiments have been carried out in 100 Torr O2 (Air Liquide, Alphagaz 2). The Cl2 concentration was typically around 1 × 1016 cm−3, leading with a photolysis energy of 20 mJ/cm2 to initial Cl-atom concentrations of around 1 × 1014 cm−3.
A small flow of pure ethane was added directly from the cylinder (Mitry-Mory, N35) to the mixture through a calibrated flow meter (Bronkhorst, Tylan). Methanol (Sigma-Aldrich) was added to the mixture by flowing a small fraction of the main flow through a bubbler containing liquid methanol, kept in ice or in a thermostated water bath. All experiments were carried out at 298 K.

3. Results

In the following, the two different methods applied in this work for the determination of the absorption cross-section of C2H5O2 at its peak wavelength 7596 cm−1 are described.

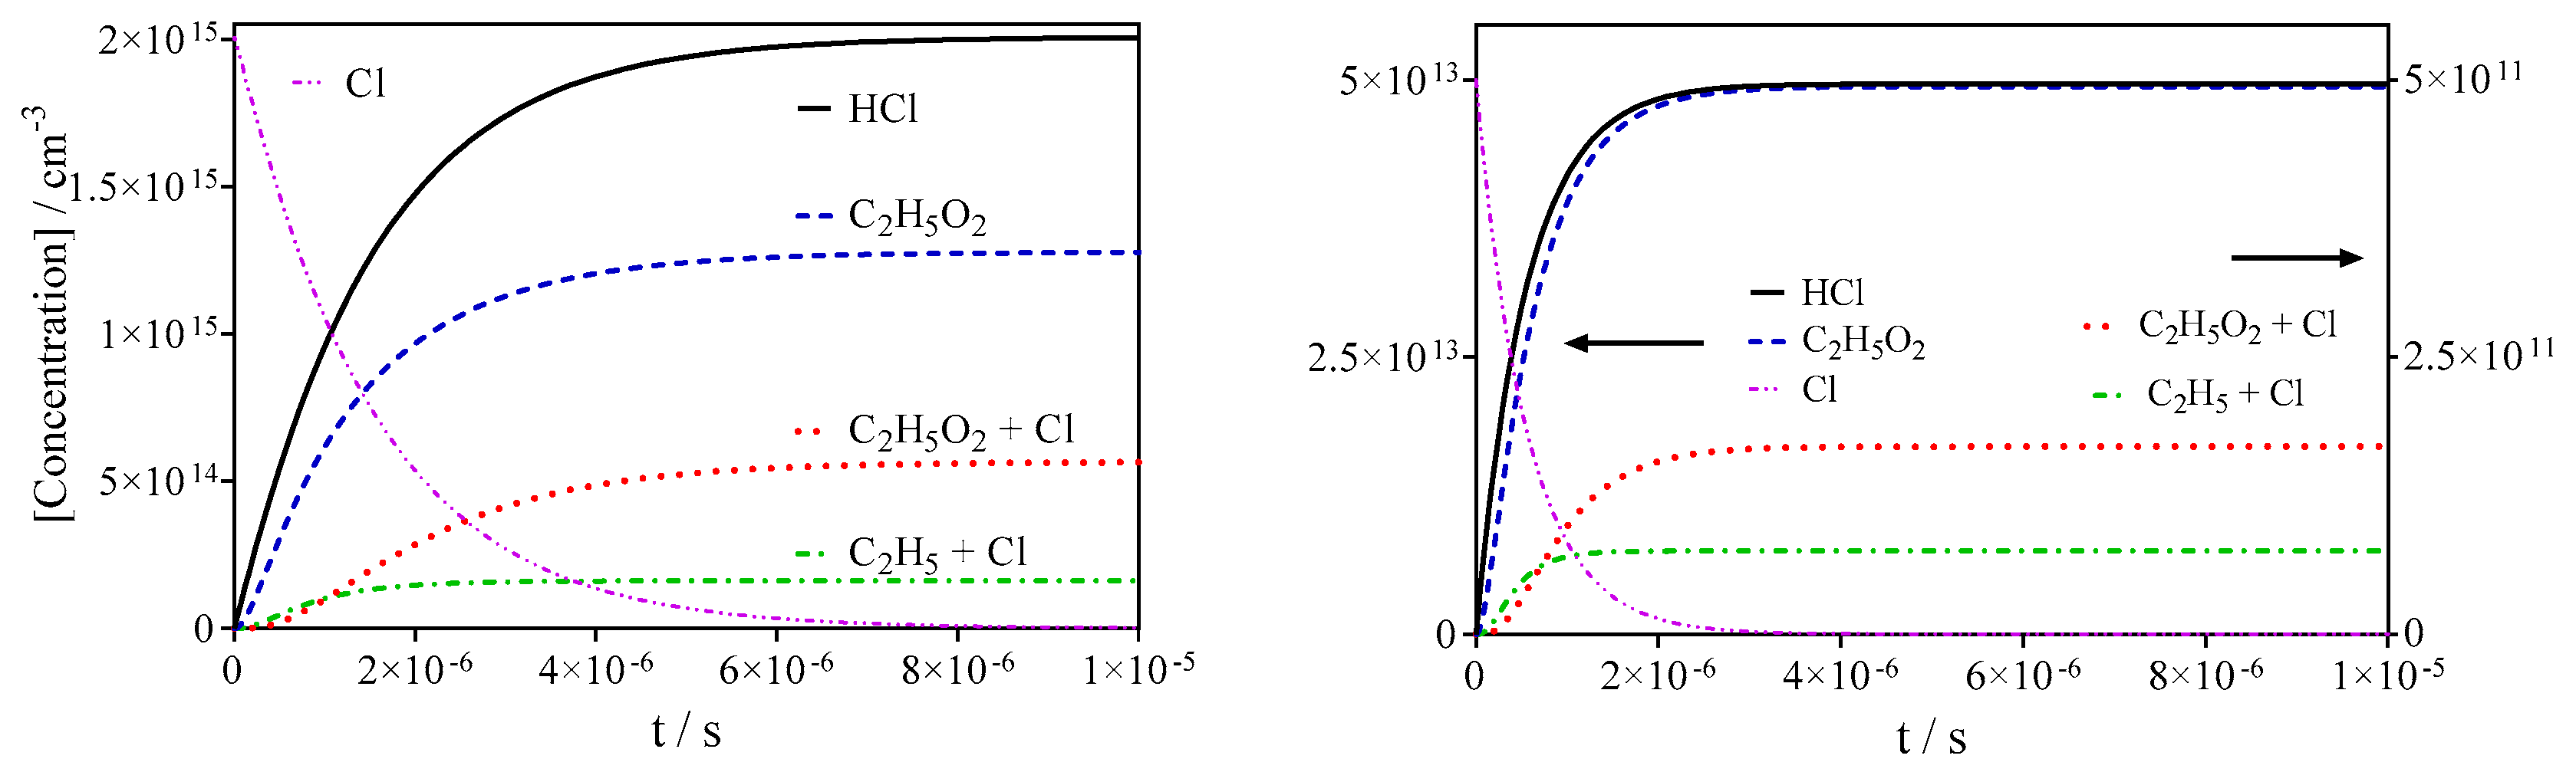
3.1. Quantification of C2H5O2 in Back-to-Back Experiments

In the first method, the absorption cross-section of C2H5O2 is measured in a rather direct way in back-to-back experiments relative to the absorption cross-section of HO2. Therefore, the reliability of the measurement depends on the reliability of the absorption cross-section of HO2. The absorption spectrum and cross-sections of HO2 in the near IR have been measured several times [15,22,24,25] and pressure broadening of selected lines has also been carried out [26,27,28]. In this work, HO2 was quantified on two different absorption lines with the cross-section varying about a factor of 9 between both lines: for most experiments, HO2 has been detected on the strongest line of the 2ν1 band at 6638.2 cm−1, but for experiments with high initial radical concentrations a small line at 6638.58 cm−1 has been used to avoid saturation. The absorption cross-section of the strongest line in helium (σ50 Torr he = 2.72 × 10⁻¹⁹ cm2) [15,24] and in synthetic air [26,27,28] (σ100 Torr air = 1.44 × 10⁻¹⁹ cm2) has been measured several times, the cross-section of the small line has only been measured once in 50 and 100 Torr helium (2.8 and 2.1 × 10⁻²⁰ cm2, respectively) [27,29], but no measurements in pure O2 have been carried out. Therefore, we have determined both cross-sections in 100 Torr O2 in the frame of this work, using the kinetic method.
Figure 2 shows a typical example: HO2 decays have been measured for 3 different initial Cl-atom concentrations and the raw signals are presented in graph (a). The decays have then been plotted following Equation (3) and the result is shown in graph (b). The slope of a linear regression of this plot can in principle be converted to the absorption cross-section using the known rate constant of the HO2 self-reaction. However, as has been mentioned above, radicals can be lost also through other processes, and in the case of laser photolysis experiments one possible loss is diffusion out of the photolysis volume. The relative impact of this loss process decreases with increasing initial HO2 concentration and in order to correct this influence, an extrapolation to infinite [HO2]0 is used, shown in graph (c): the slope m from graph (b) is plotted as a function of the intercept I (=1/α0). Extrapolating the m-values to I = 0 therefore removes the influence of the diffusion on the slope m. In the example of Figure 2, using the slope m obtained from extrapolation instead of using the directly determined slope m leads to an increase in the absorption cross-section of 6% for the highest initial concentration and 13% for the lowest initial concentration. Error bars in graph (c) correspond to 95% confidence interval of the linear regression from the graph (b): the error bars on the x-values are too small to be seen within the symbols. Several such series have been measured for both absorption lines, and the following absorption cross-sections in 100 Torr O2 have been deduced for HO2 for the two lines:
6638.2 cm−1:σ = (2.0 ± 0.3) × 10−19 cm2.
6638.58 cm−1:σ = (2.1 ± 0.3) × 10−20 cm2.
The uncertainty on σ reflect the uncertainty of ±15% on the rate constant of the HO2 self-reaction, such as estimated by the IUPAC committee [30].
These absorption cross-sections are now used to obtain the absorption cross-section of C2H5O2 in back-to-back experiments. Figure 3 shows the principle of these measurements: Cl2 is first photolysed in the presence of excess CH3OH, leading to quantitative formation of HO2 radicals: typical absorption-time profiles for 4 different Cl2 concentrations are shown in the upper right graph (b) of Figure 3. In the next step, CH3OH is removed from the gas flow, and excess C2H6 is added instead, all other conditions are kept constant. The corresponding C2H5O2 absorption time profiles are shown in the upper left graph (a). It can be seen that the HO2 profiles decay much faster than the corresponding C2H5O2 profiles: this is in line with the rate constant of the HO2 self-reaction being around 10 times faster than the rate constant of the C2H5O2 self-reaction. In order to get a reliable extrapolation of αt=0 ms, a plot of 1/α = f(t) is generated for both species (graph (c) and (d) for C2H5O2 and HO2, respectively) and a linear regression allows retrieving αt=0 ms from the intercept, as shown in Equation (3). For HO2, the αt=0 ms values can now be converted to absolute concentrations ([HO2]t=0 ms) using the above determined absorption cross-section. Supposing that each Cl-atom is converted into either one HO2 radical or into one C2H5O2 radical, i.e., [HO2]t=0 ms = [C2HO5]t=0 ms, a plot of α(C2H5O2)t=0 ms = f([HO2]t=0 ms) leads to a linear relationship with the slope equal to the absolute absorption cross-section of C2H5O2. The lower graph (e) in Figure 3 summarizes the results, obtained on four different days using either the big HO2 line at 6638.2 cm−1 (open circles and open diamonds) or the small line at 6635.58 cm−1 (all other symbols, with the coloured symbols representing the results from the experiment in Figure 3).
From these experiments, an absorption cross-section for C2H5O2 at 7596 cm−1 of σ = (1.0 ± 0.2) × 10−20 cm2 is obtained. The error bar is mostly due to the uncertainty in the rate constant of the HO2 self-reaction, to which the absorption cross-section of C2H5O2 is directly linked.
In imitation of the kinetic method such as used by Melnik et al. [18], the above experiments can also be used to validate the absorption cross-section obtained using the back-to-back method by determining k3,obs and comparing it with data from the literature. Indeed, the C2H5O2 data from Figure 3c can be treated with the same method as shown for the HO2 data in Figure 2, and the obtained intercept is then equal to 2 × kobs/σ. Figure 4 shows this type of plot for the data from Figure 3c.
Now, using the above retrieved absorption cross-section for C2H5O2 at 7596 cm−1 of σ = (1.0 ± 0.2) × 10−20 cm2, we can obtain from the intercept of the linear regression in Figure 4 a value for k1,obs = (1.3 ± 0.3) × 10−13 cm3molecule−1 s−1, in good agreement with the currently recommended literature value (1.24 × 10⁻¹³ cm3molecule−1 s−1) [31].

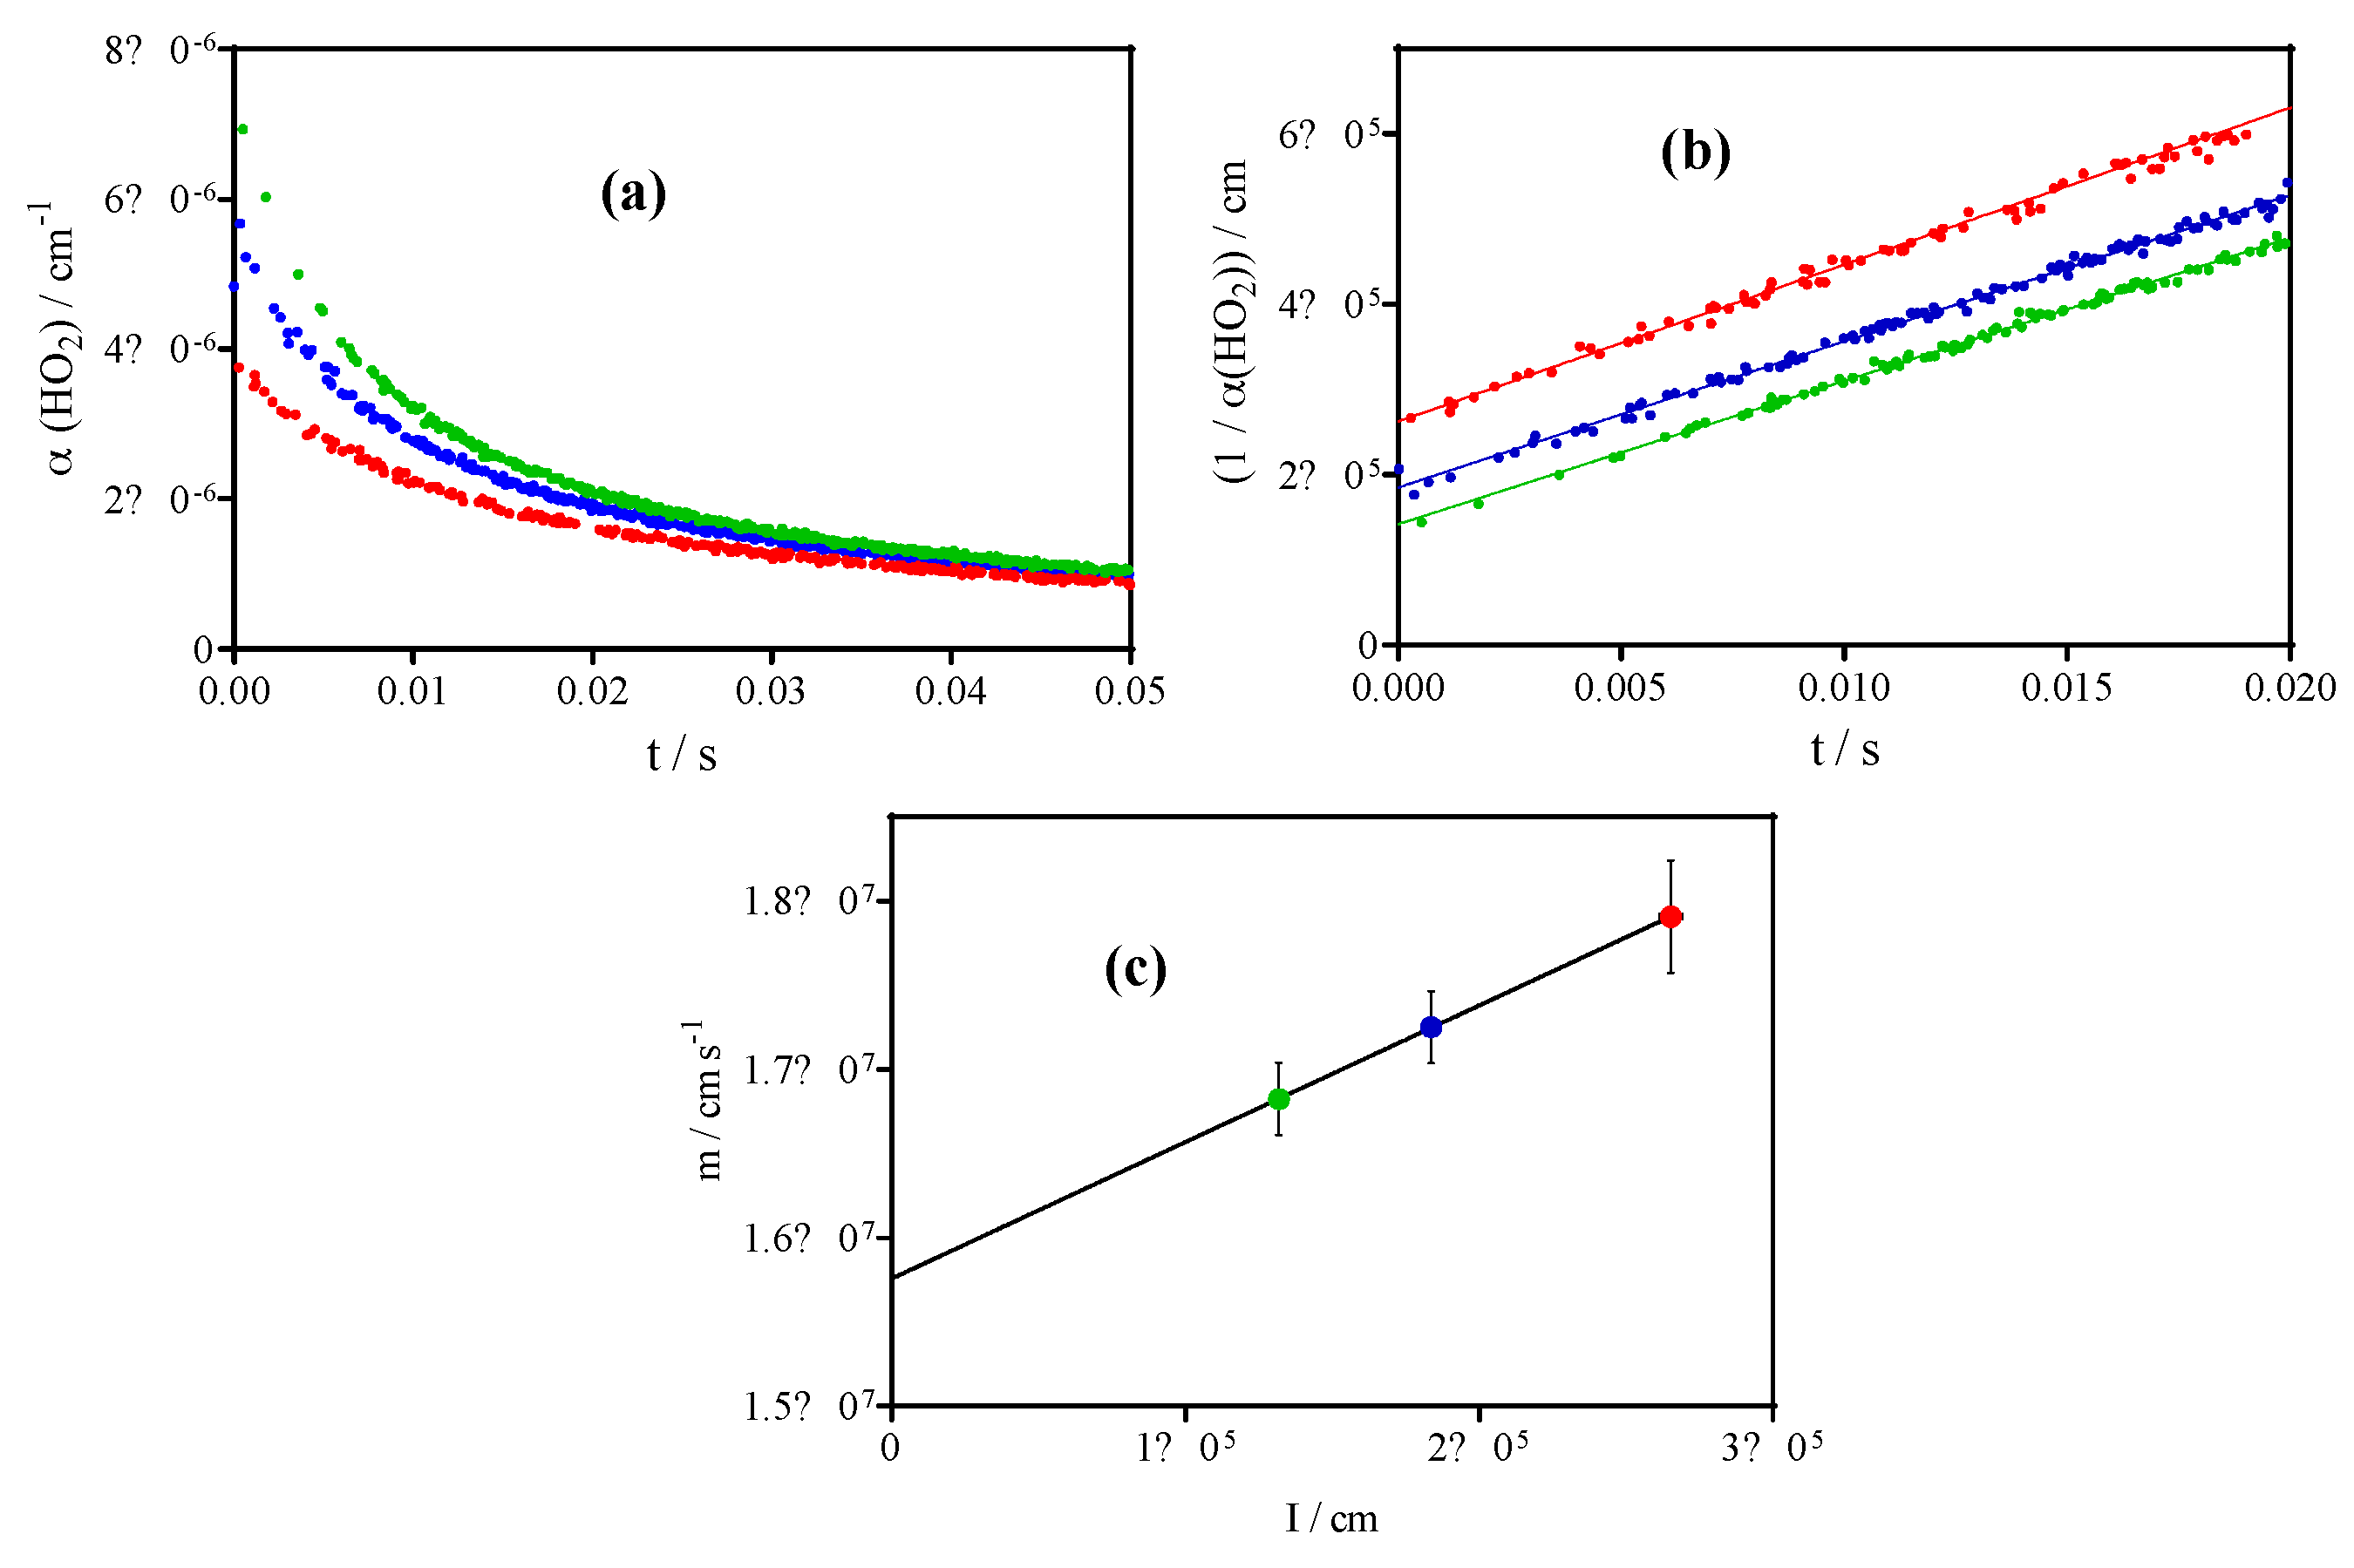
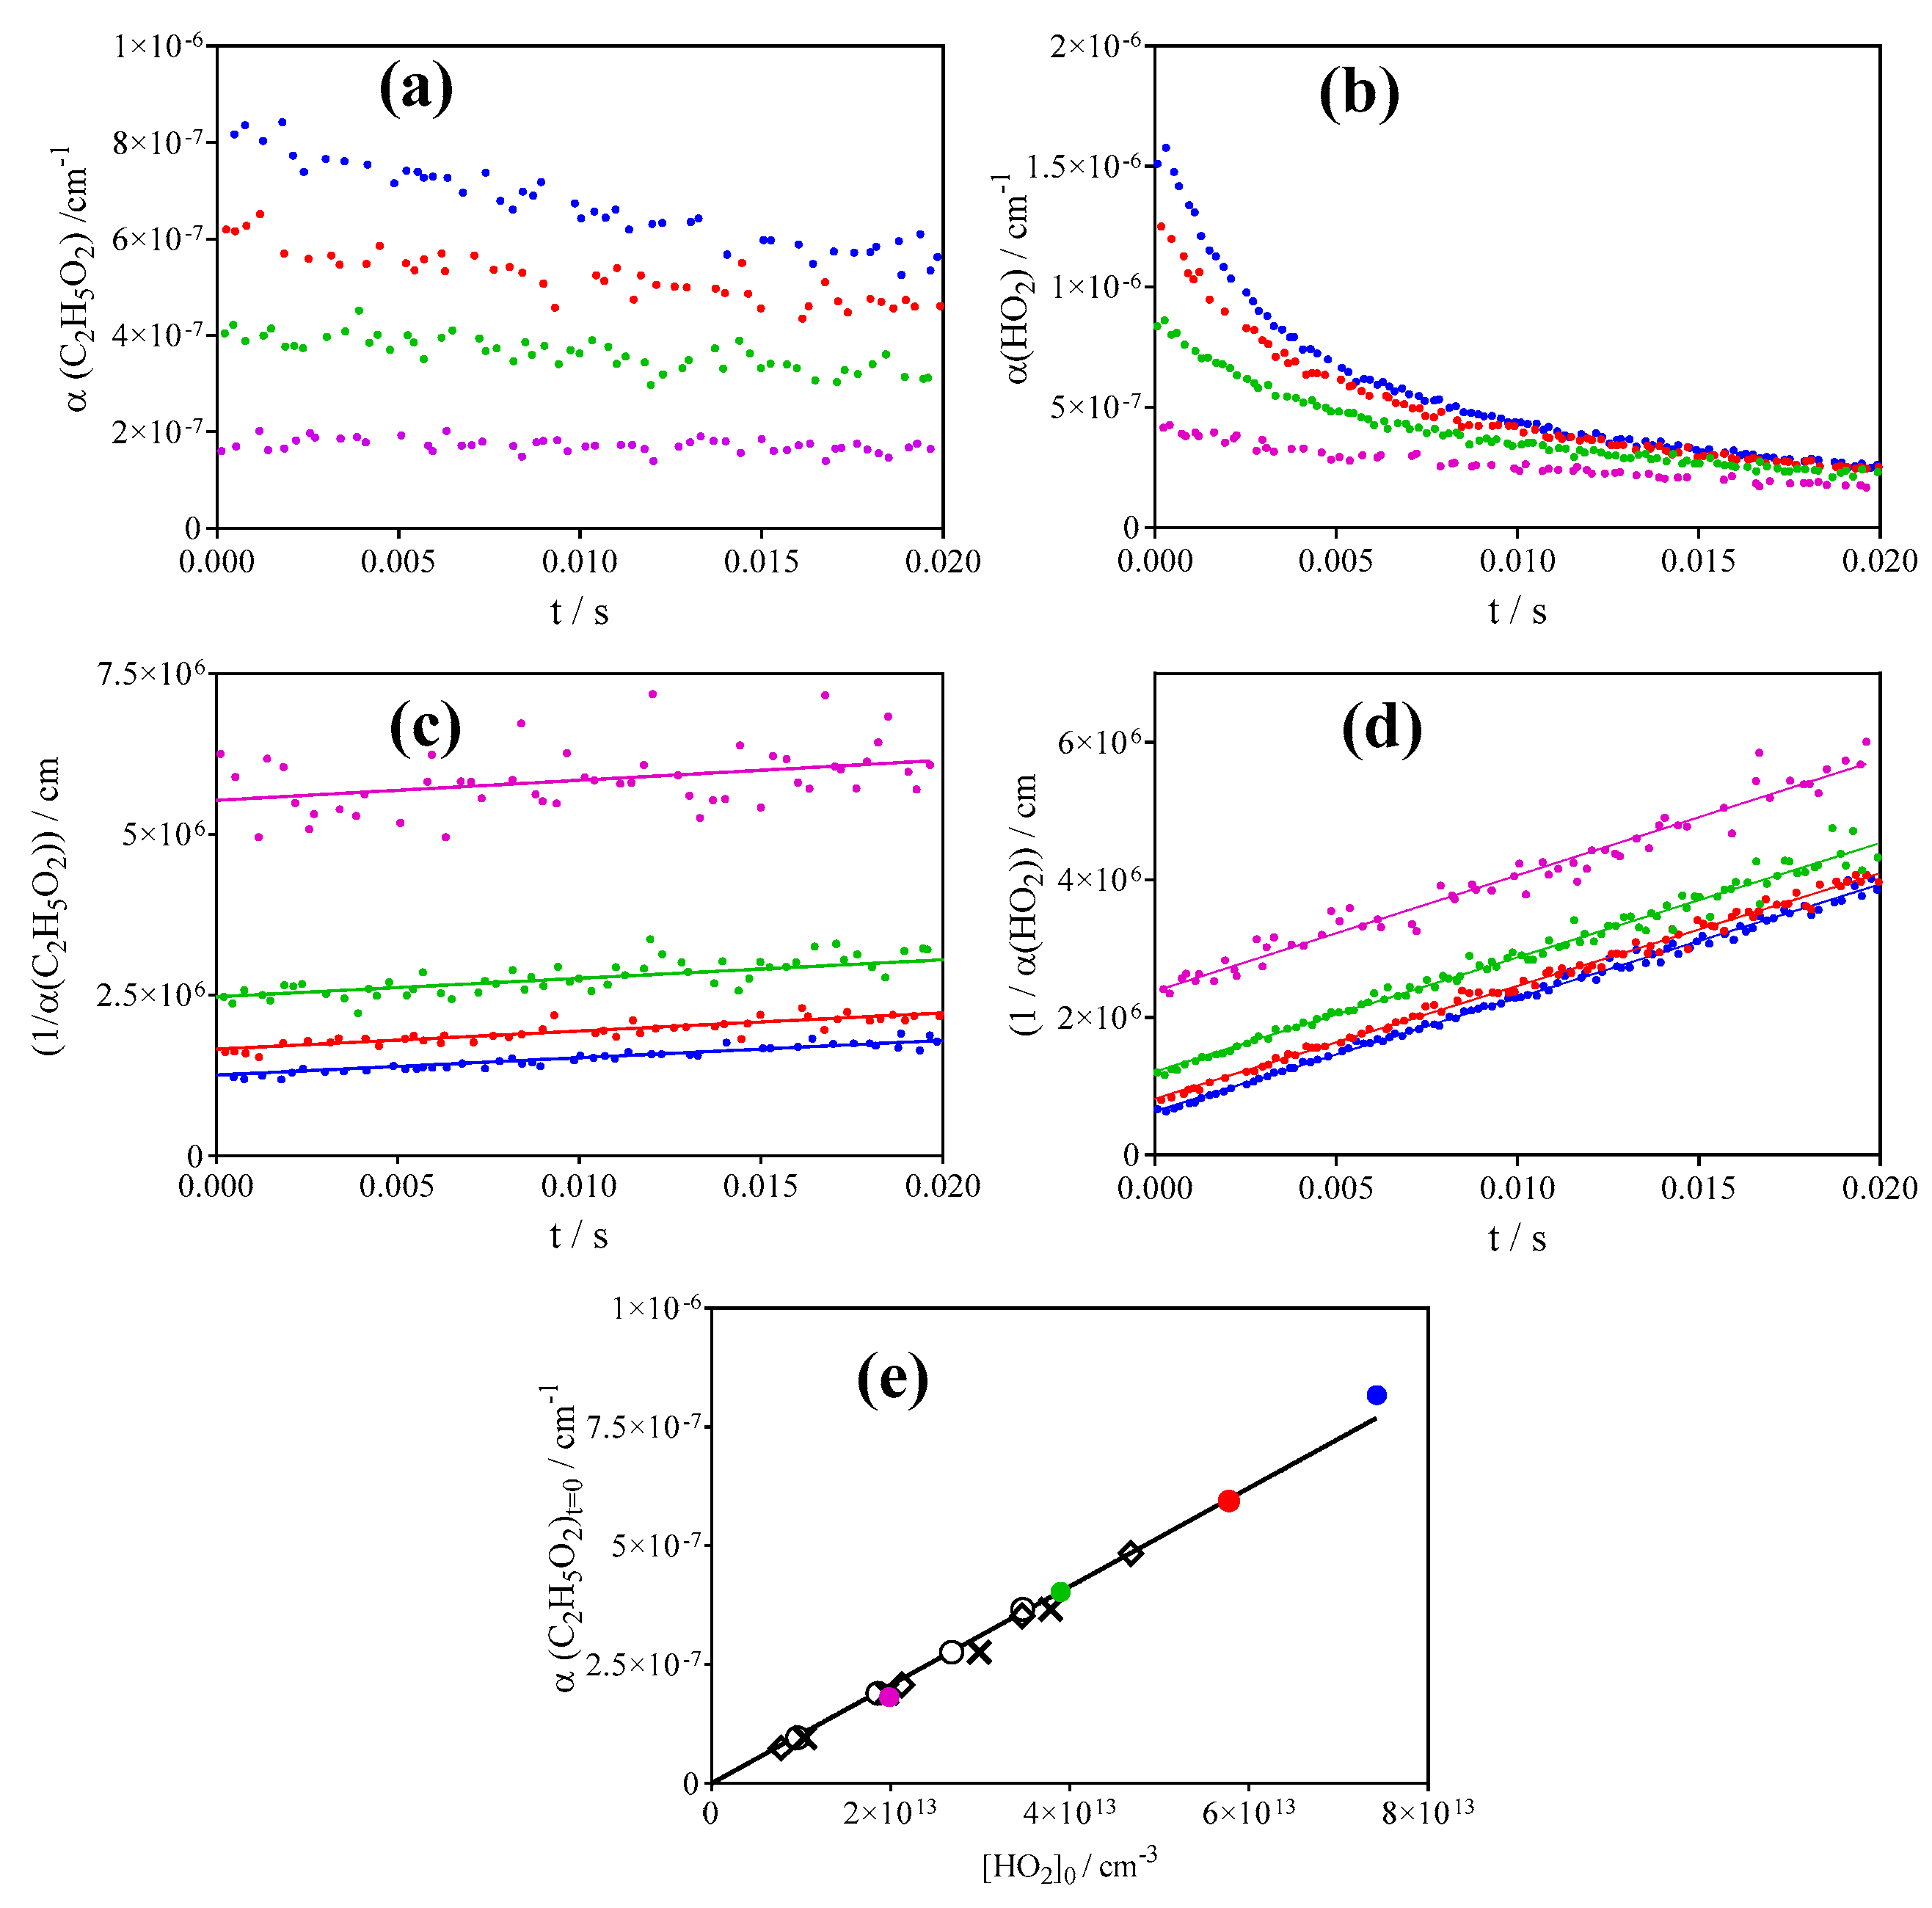
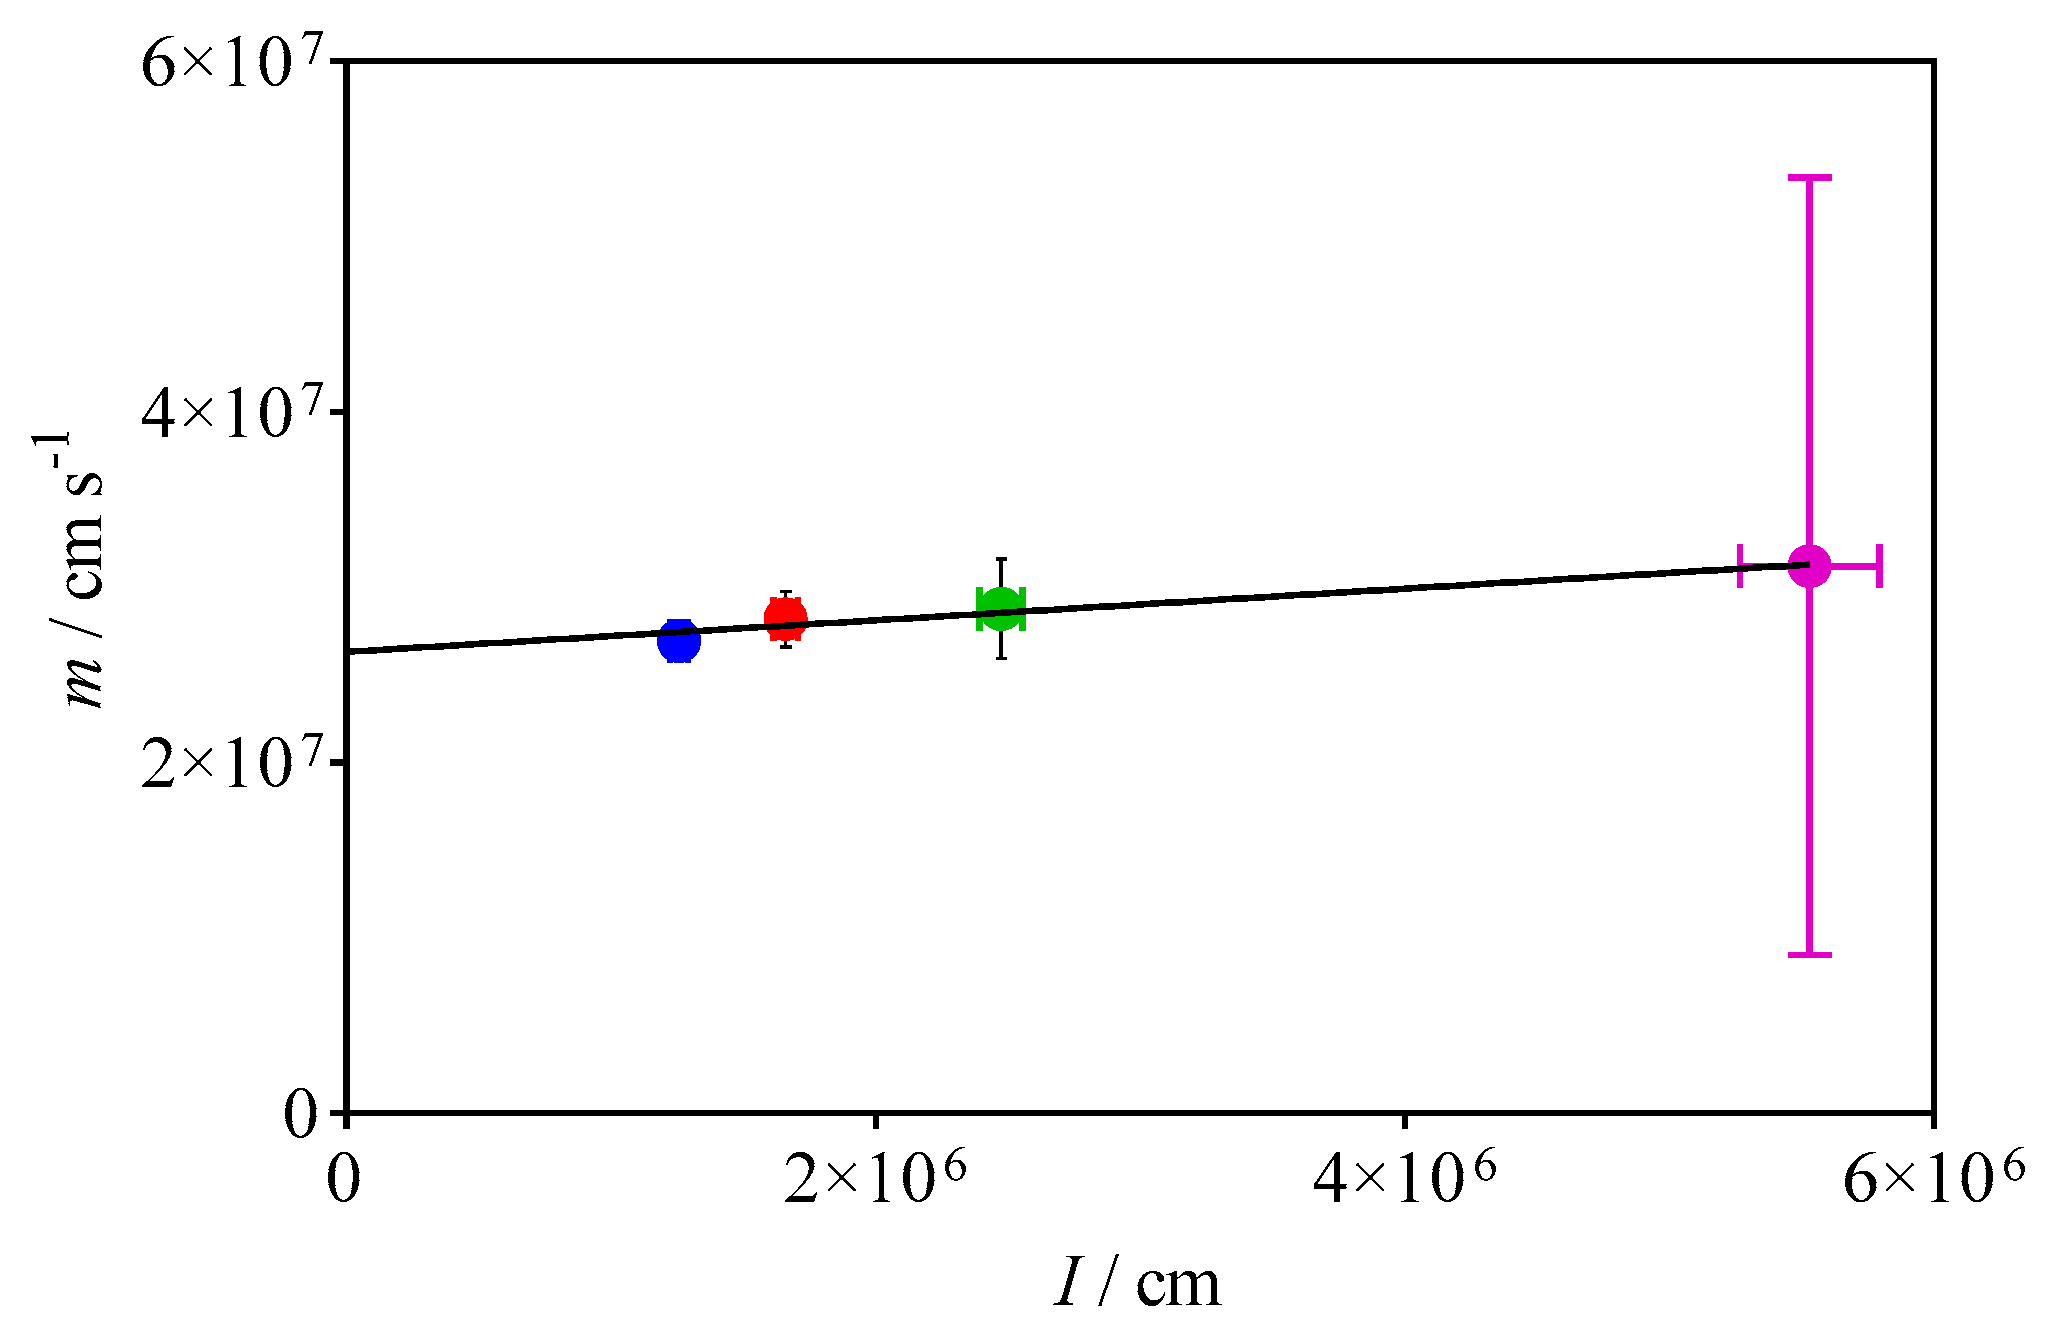
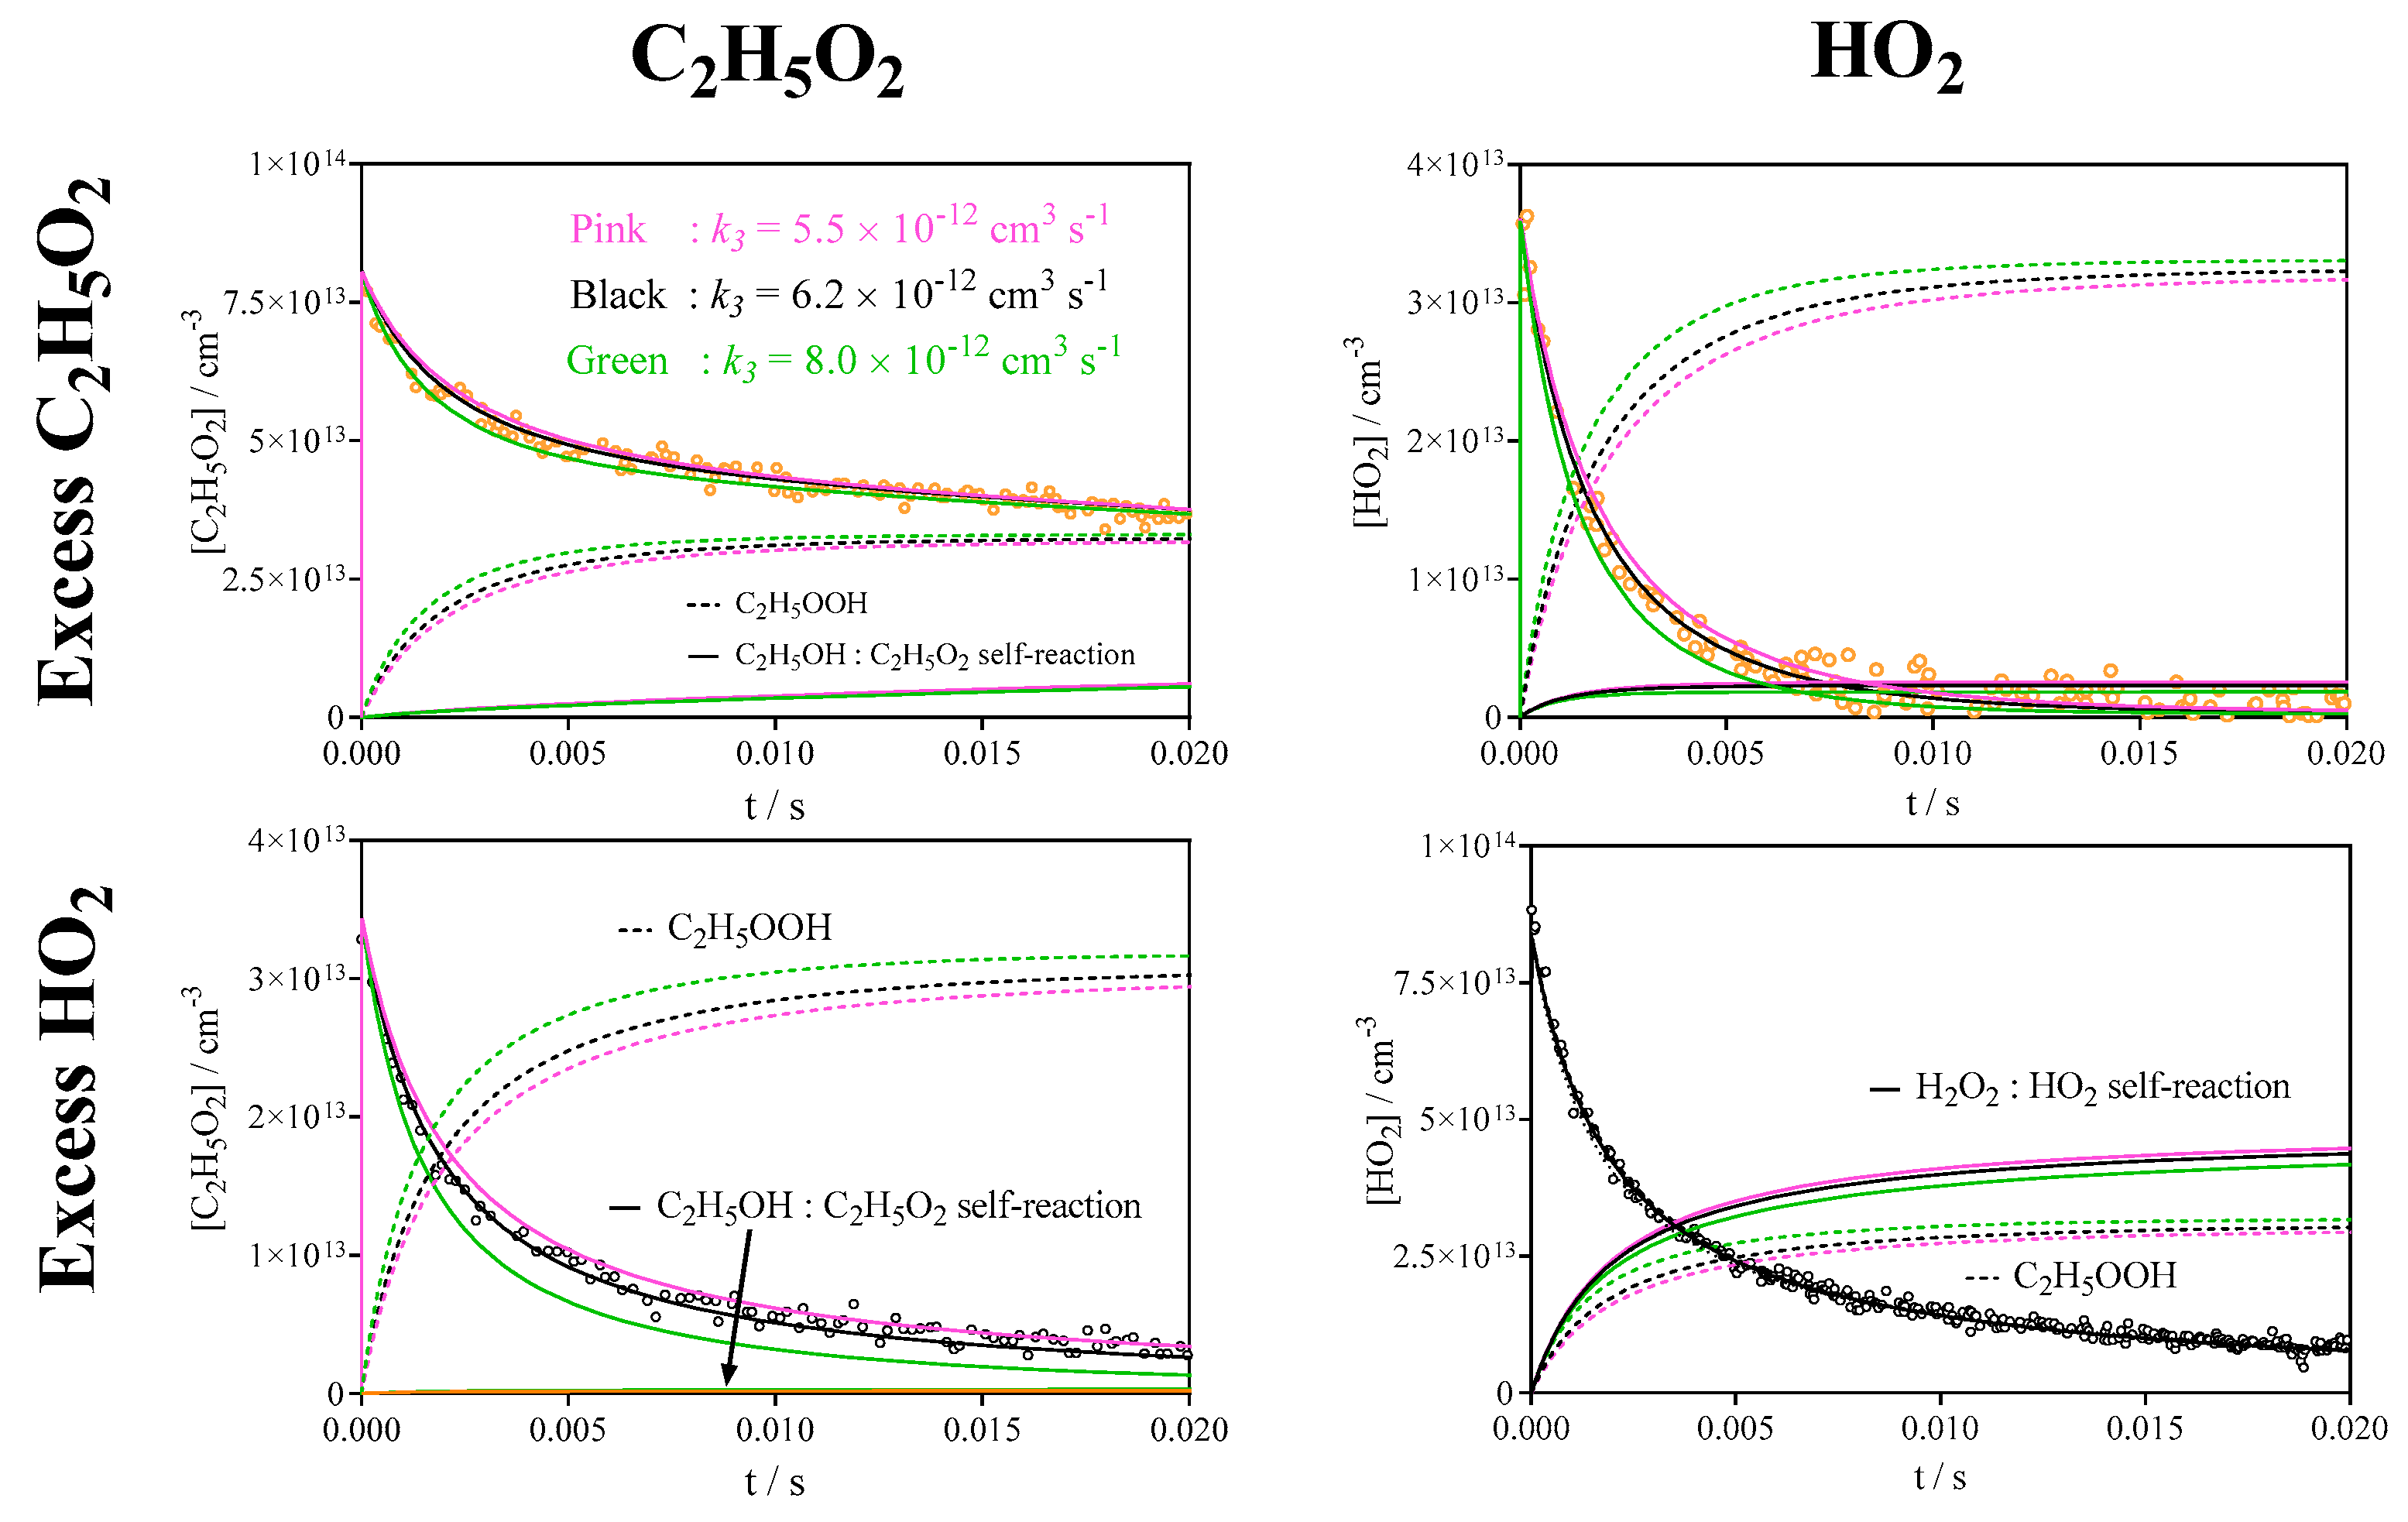
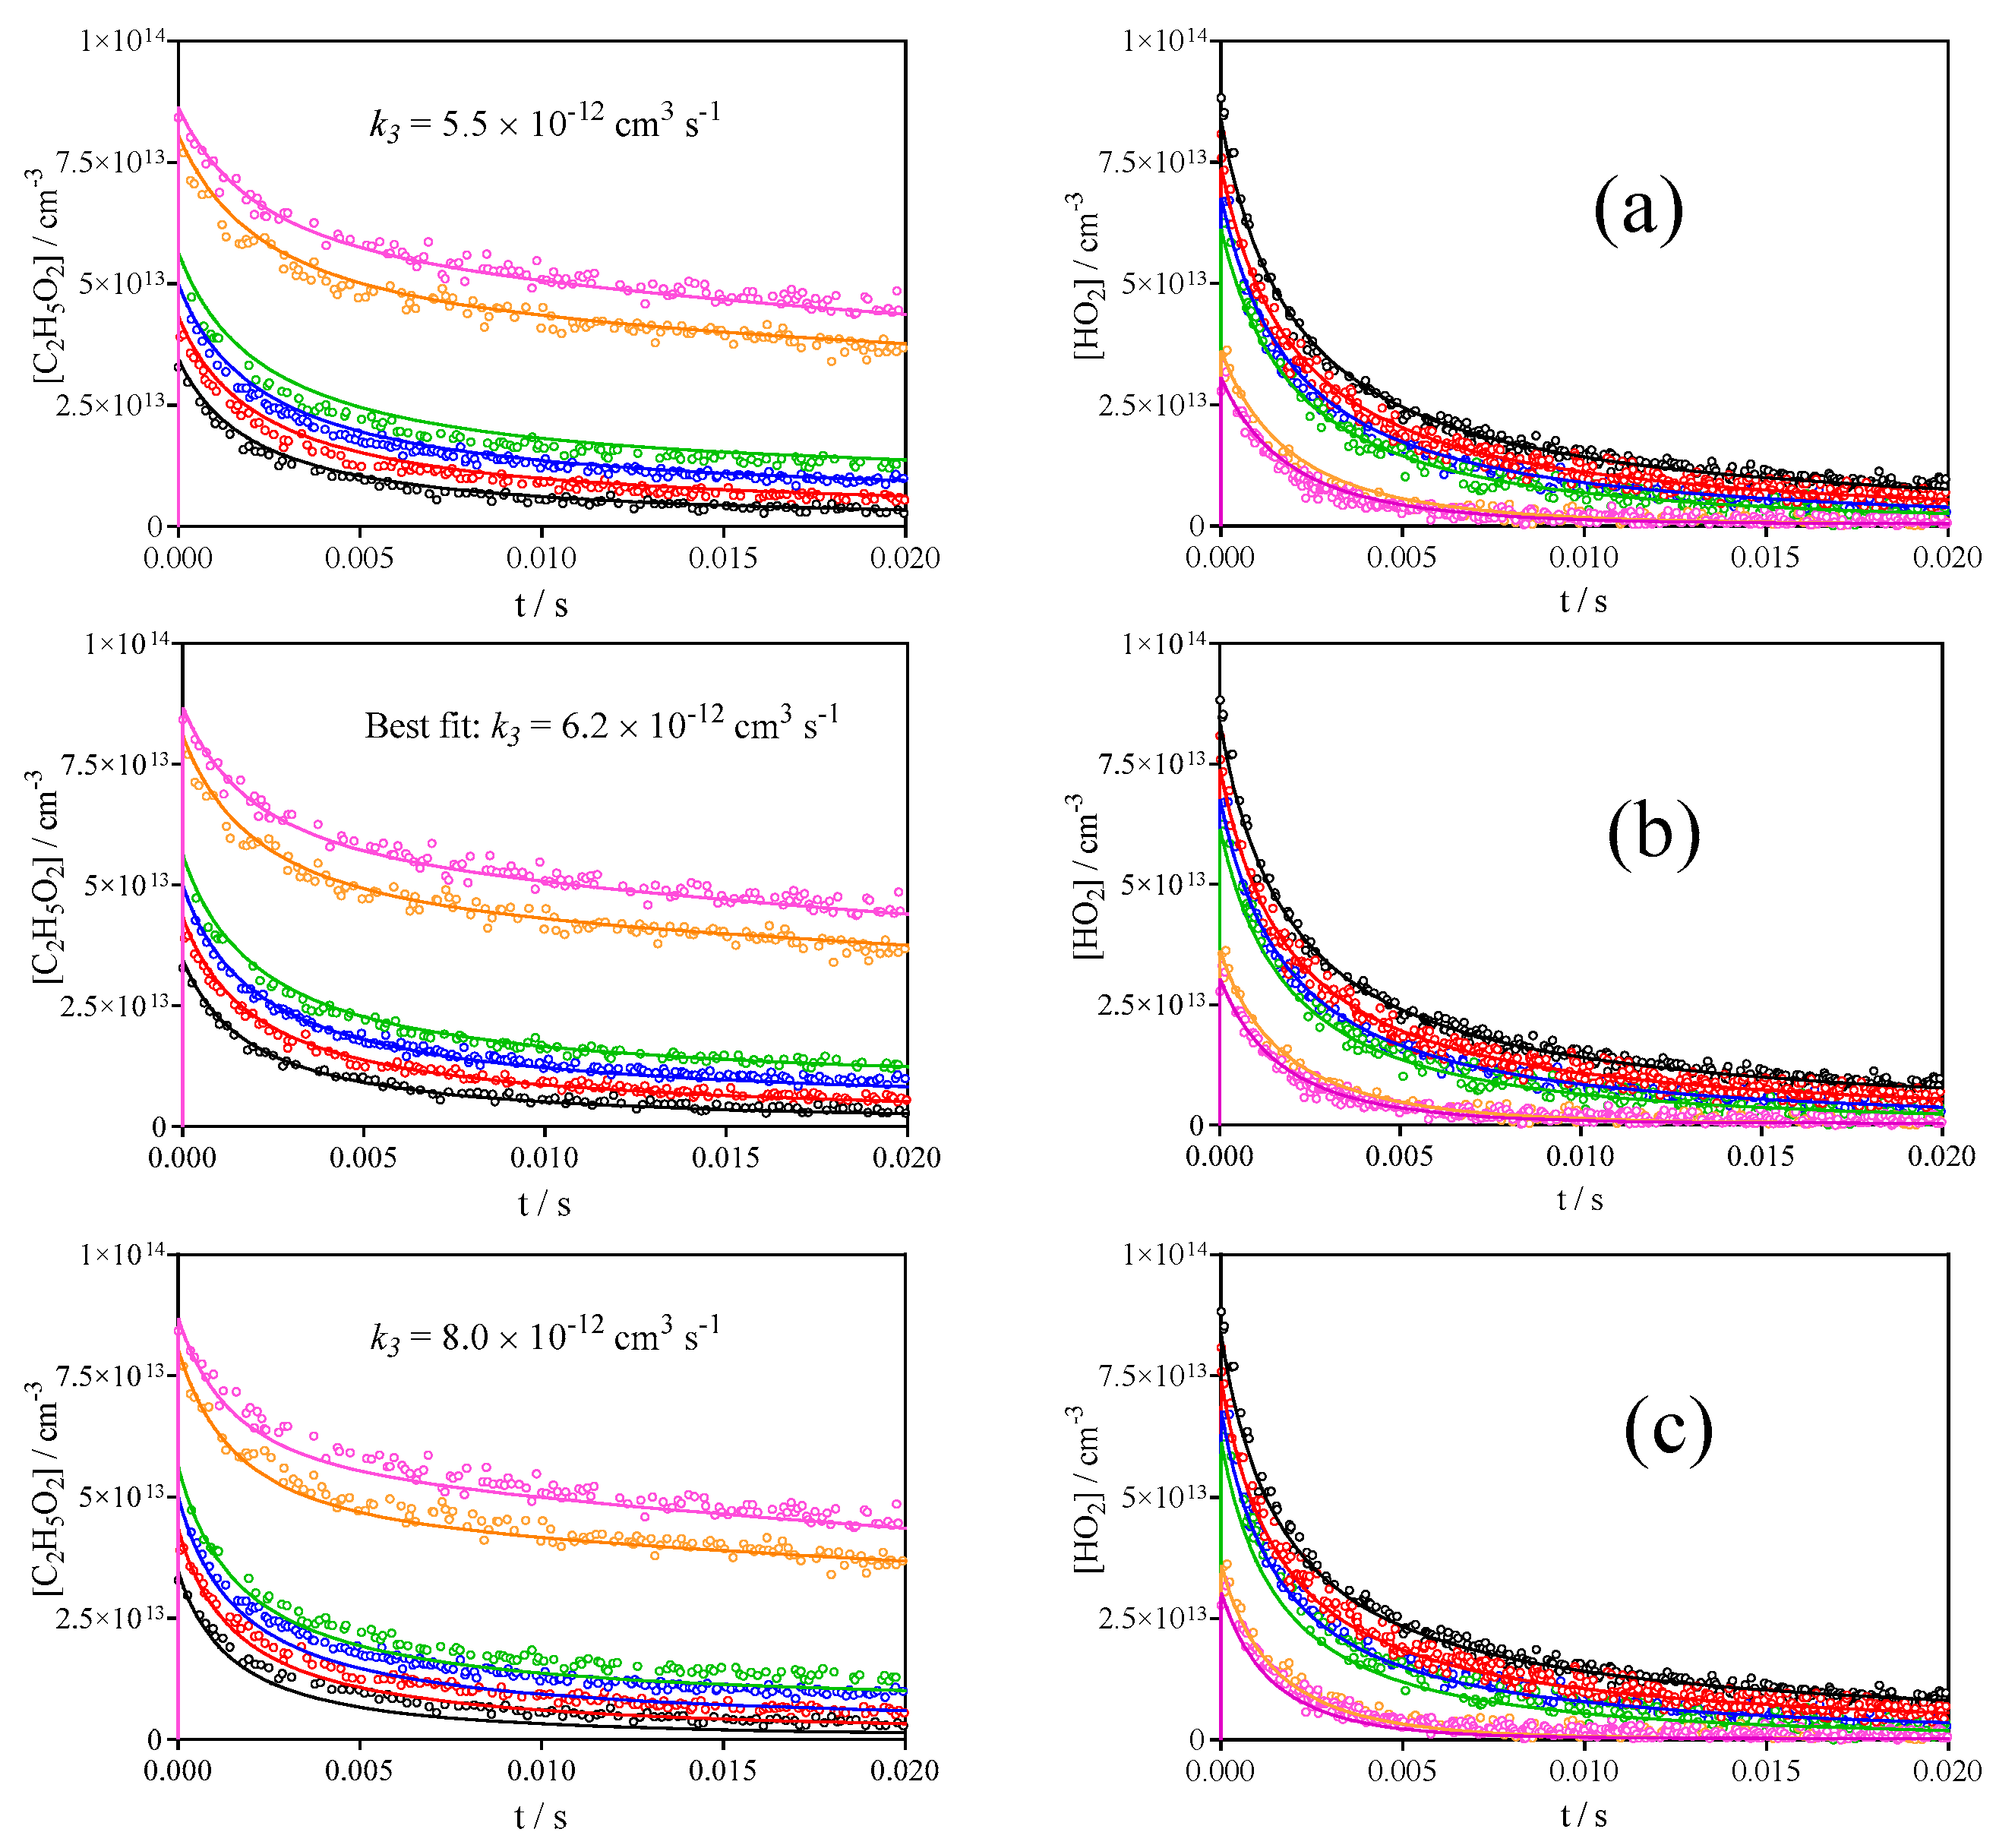
3.2. Quantification of C2H5O2 by Measuring the Rate Constant of C2H5O2 + HO2

Another way to determine the absorption cross-section of C2H5O2 has been applied by determining the rate constant of the cross reaction between C2H5O2 and HO2. Indeed, the rate constant can be determined under different conditions: using an excess of HO2 over C2H5O2 leads to C2H5O2 decays that are sensitive to the absolute concentration of HO2, while in the reverse case the HO2 decay will be sensitive to the absolute C2H5O2 concentration, and thus to its absorption cross-section. Therefore, measuring simultaneously the decays of both species over a large range of concentration ratio allows determining the rate constant (from excess HO2 experiments) and the absorption cross-section of C2H5O2 (from excess C2H5O2 experiments). Figure 5 illustrates this using two examples from Figure 6.
Both species show different behaviour: C2H5O2 always decreases rapidly over the first few ms, given by the loss through (R3) (C2H5OOH concentration time profile given as dashed lines). Then the decays slow down at longer reaction times, when HO2 concentration gets low, because the self-reaction becomes the major loss process, and this reaction is slow for C2H5O2 radicals (C2H5OH concentration time profile given as full lines). This behaviour is especially visible when C2H5O2 is the excess species (upper graph in Figure 5 and pink and orange circles in Figure 6: [C2H5O2] ≈ 3 × [HO2]). HO2 on the other hand approaches low concentrations at longer reaction times under all conditions, even when it is the excess species (lower graph in Figure 5 and black circles in Figure 6: [HO2] ≈ 3 × [C2H5O2]): its self-reaction (H2O2 concentration time profile given as full lines) is around 20 times faster than the self-reaction of C2H5O2 and is a major loss process under all conditions and all reaction times, the reaction with C2H5O2 (dashed lines) plays a major role only under excess C2H5O2 conditions. Under excess HO2 concentrations, the HO2 profile is barely influenced by (R3): an increased loss through an increase in k3 is counterbalanced by a decreased loss through self-reaction.
The profiles of all condition shown in Figure 6 have simultaneously been fitted to a simple mechanism, with the experimental conditions given in Table 2 and the mechanism given in Table 3. The initial Cl-atom concentration was fixed to 1.2 × 1014 cm−3 for all experiments, obtained in initial experiments from measuring pure HO2 decays (no C2H6 added). [C2H6] has been varied between 1.9–7.5 × 1015 cm−3 and [CH3OH] has been varied between 2.8–5.0 × 1015 cm−3. Using these conditions, the ratio of [HO2]/[C2H5O2] has been varied between 0.3 (pink circles) and 2.5 (black circles).
For all graphs in Figure 6, the above determined absorption cross-section (σ = 1.0 × 10⁻²⁰ cm2) has been used to convert the C2H5O2 absorption coefficients into absolute concentrations.
The profiles for both species could be well reproduced over the entire concentration range using a rate constant of k3 = 6.2 × 10⁻¹² cm3 molecule−1 s−1, shown in the centre graph (b). In a next step, different rate constants for the cross reaction have been tested: indeed, despite several measurements of this rate constant over the last decades [32,33,34,35,36,37,38], there is no good agreement for this rate constant. An excellent summary on previous measurements of this rate constant can be found in Noell et al. [32] and will not be repeated here. The two recent determinations from Noell et al. [32] and Boyd et al. [33] are considered by the IUPAC committee as being carried out by the most reliable methods, however they vary by about a factor of 1.5 (8.14 × 10⁻¹² cm3 molecule−1 s−1 for Boyd et al. [33] from UV absorption and 5.57 × 10⁻¹² cm3 molecule−1 s−1 for Noell et al. [32] from UV/near IR absorption). We have tested these two limits by trying to adjust both profiles over the entire concentration range. In the upper graphs (a), the rate constant k3 has been set to the lower limit such as obtained by Noell et al. [32] (5.5 × 10⁻¹² cm3molecule−1 s−1), leading to C2H5O2 and (less pronounced) HO2 decays that are too slow. Increasing the initial C2H5O2 concentration by about 10% (corresponding to a decreased absorption cross-section for C2H5O2: σ = 0.9 × 10⁻²⁰ cm2) can lead again to less good, but still acceptable HO2 and C2H5O2 decays (which would also imply a slight deviation of the overall initial radical concentration from 1.2 × 1014 cm−3). In the lower graphs (c), the upper limit has been tested by setting k3 = 8 × 10⁻¹² cm3molecule−1 s−1: decays of both species are too fast and a decrease in concentration does not lead to an acceptable adjustment of both species.
Table 3. Reaction mechanism used to fit all experiments in this work.
Reactionk/cm3molecule−1s−1Reference
1a2 C2H5O2 → 2 C2H5O + O22.6 × 10−14Ref [32] *
1b2 C2H5O2 → C2H5OH + CH3CHO + O26.7 × 10−14Ref [32] *
2C2H5O + O2 → CH3CHO + HO28 × 10−15Ref [39]
3C2H5O2 + HO2 → C2H5OOH + O26.2 × 10−12This work
5Cl + C2H6 → C2H5 + HCl5.9 × 10−11Ref [31]
6aC2H5 + O2 + M → C2H5O2 + M4.8 × 10−12Ref [40]
6bC2H5 + O2 → C2H4 + HO2 3-4× 10⁻¹⁴This work **
7Cl + CH3OH → CH2OH + HCl5.5 × 10−11Ref [31]
8CH2OH + O2 → CH2O + HO29.6 × 10−12Ref [31]
92 HO2 → H2O2 + O21.7 × 10−12Ref [30]
10C2H5O2 + Cl → products1.5 × 10−10Ref [41]
11C2H5O2 → diffusion2 s−1This work
12HO2 → diffusion3 s−1This work
* The branching ratio for (R1) is currently contradictory, IUPAC currently recommends the radical path (R1a) as the major path. However, we have chosen here to use the most recent determination: (a) the self-reaction is very minor in our system (see Figure 5) and thus a change in branching ratio has a negligible impact on the retrieved profiles and (b) we have confirmed in separate experiments (to be published) the low branching ratio for the radical path. ** This reaction is likely due to excited C2H5 radicals and the branching ratio between (R6a) and (R6b) depends on pressure and also on the mode of generation of the C2H5 radicals.
In conclusion, using the absorption cross-section for C2H5O2 obtained in back-to-back experiments leads in these kinetic experiments to the best fit for both species over the entire concentration range. However, it should of course be noted, that in the end both methods rely on the absorption cross-section of HO2 and therefore both approaches cannot be considered as independent methods: the initial Cl-atom concentration used as input parameter in the model and being vital for retrieving the rate constant k3 and with this the absorption cross-section for C2H5O2 depend entirely on the rate constant for the HO2 self-reaction. The absorption cross-section of HO2 varies through pressure broadening (which is taken into account), but it might also vary during the experiment through small and unnoted shifts in the wavelength of the DFB laser emission (the linewidth of the HO2 absorption lines are on the order of 0.02 cm−1 FWHM at 50 Torr he). However, in our experiments the absorption cross-section of HO2 is under most conditions constantly being “measured”: a major HO2 loss in most experiments is the self-reaction, and thus the HO2 decays are sensitive to the absolute HO2 concentration, i.e., to the absorption cross-section that has been used to convert the absorption time profiles to concentration time profiles. Therefore, it can be said that both methods have determined the C2H5O2 absorption cross-section relative to the rate constant of the HO2 self-reaction. The IUPAC committee [30] estimates the uncertainty of this rate constant to ± 15%, which we use as a basis to estimate the uncertainty of our rate constant, with an additional 10% for uncertainties in the fitting of the rate constant: k3 = (6.2 ± 1.5) × 10−12 cm3molecule−1 s−1.

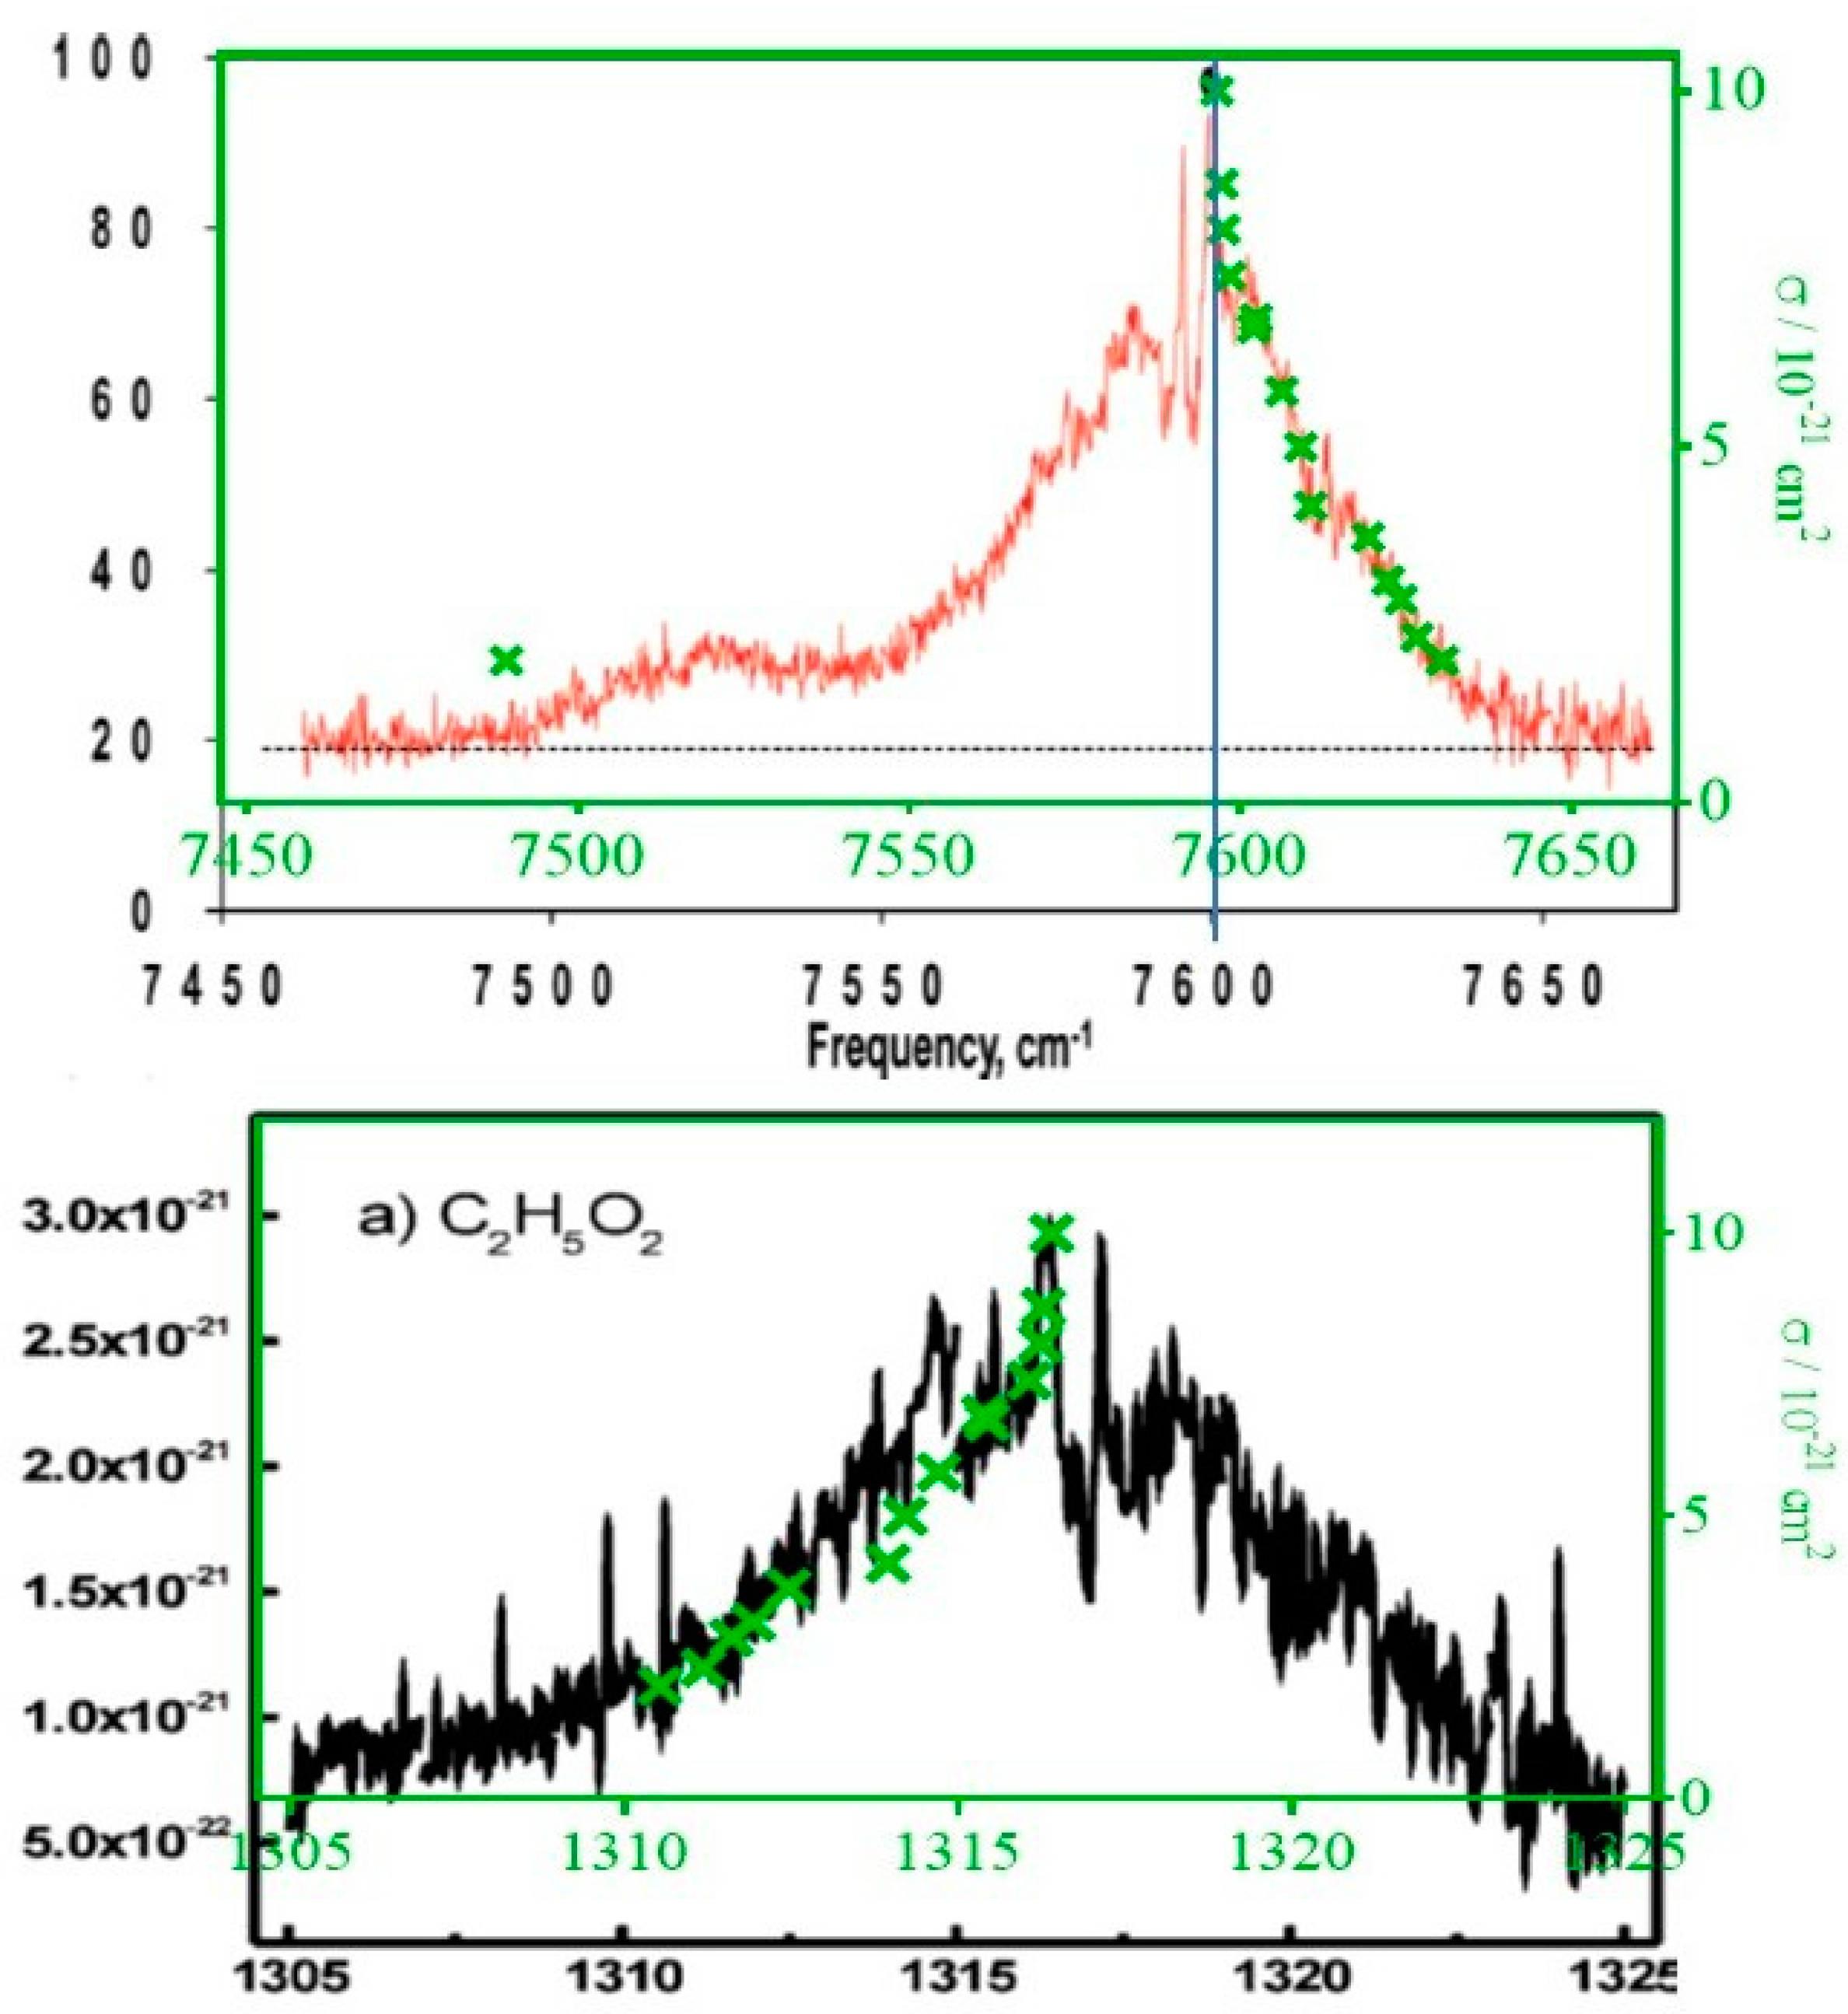
3.3. Measuring the Relative Absorption Spectrum

In order to obtain the shape of the C2H5O2 absorption spectrum, kinetic decays have been measured under identical conditions at 15 different wavelengths in the range accessible with our DFB laser (7596–7630 cm−1). The relative absorption coefficients are put on an absolute scale by comparison with the absorption cross-section at 7596.47 cm−1. Table 4 summarizes the obtained results, and Figure 7 compares the present data with two literature results.
The upper graph shows that our spectrum (green symbols and green axis apply) agrees well with the results of Melnik et al. [17] if our data are shifted by 4 cm−1. Possibly, there is a mistake in the Melnik figure (T. Miller, private communication), because the peak absorption is given in the text at 7596 cm−1, just as in our case, however in the figure the peak is located at 7600 cm−1, indicated by a blue vertical line. In the lower graph, our data (again in green) are overlaid to the spectrum of Atkinson and Spillman [11]. A good agreement of the shape in both comparisons can be obtained, when our data are scaled on the y-axis, i.e., when we suppose a shift in the baseline of both literature spectra (around 23% of the peak absorption for Atkinson and Spillman and 15% for Melnik et al.). Melnik et al. discussed in their paper such baseline shift (dashed line in their figure) and attributed it to a broadband absorber, generated simultaneously during the photolysis. Indeed, they obtained their baseline by measuring ring-down events with the photolysis laser blocked. In this case, a broadband absorber generated simultaneously to the C2H5O2 radical would induce a baseline shift. To take into account this shift (horizontal dashed line in the upper graph of Figure 7), they have calculated the absorption cross-section above this plateau. No explanation for a possible baseline shift in the work of Atkinson and Spillman can be given.

4. Discussion

Comparison of the Absorption Cross-Section with Literature Data

The absorption cross-section of C2H5O2 was first determined by Atkinson and Spillman [11] using 193 nm photolysis of 3-pentanone as precursor. Using the kinetic method, they determined at the peak σ = (3 ± 1.5) × 10−21 cm2, which is 3 times smaller than the present value. A higher absorption cross-section had also been measured previously by our group for the CH3O2 radical [12]. One possible reason might be that the determination from Atkinson and Spillman is based on the kinetic method using low initial radical concentrations, hence the C2H5O2 concentration has to be measured over long reaction times in order to observe a sizeable decay, but the possible loss due to diffusion out of the photolysis volume or due to wall loss, possibly non-negligible over such long reaction times, has not been considered in the data evaluation. This can induce an overestimation of the radical concentration and therefore an underestimation of the absorption cross-section (see Figure 2c and Figure 4). Another reason might be the precursor: the reaction of C2H5 + O2 can also lead to small amounts of HO2 through (R6b), around 1% of the initial Cl-atom concentration led to formation of HO2 in the experiments of this work. Atkinson and Spillman used 193 nm photolysis of 3-pentanone, which leaves considerably higher amounts of excess energy in the fragments than our method, based on H-atom abstraction. Therefore, the fraction of C2H5 radicals that react through (R6b) might be considerably higher than in our case. This could induce a non-negligible initial HO2 concentration which participates in the removal of C2H5O2 and would thus induce a systematic error when using the kinetic method. This is also in line with the observation of Atkinson and Spillman, that in their experiments the apparent rate constant of the C2H5O2 self-reaction was inversely pressure dependent: the rate constant decreased with increasing pressure (D. Atkinson, private communication). An increased cooling of the hot C2H5 radical with increasing pressure would lead to a decreasing HO2 concentration and thus to a slow-down of the C2H5O2 decay.
Rupper et al. [16] estimated the absolute absorption cross-section to σ = 4.4 × 10⁻²¹ cm−2 from calculating the initial Cl-atom concentration by measuring the decrease of photolysis energy in absence and presence of the Cl-atom precursor, assuming that all generated Cl-atoms lead to formation of one C2H5O2. In a more recent work from the same group, Melnik et al. [18] have determined the absorption cross-section by dual-CRDS method: on one absorption path they measured the absorption of C2H5O2 while on the other path the concentration of HCl was quantified thanks to its known absorption cross-section. Assuming again that one C2H5O2 has been generated for each molecule of HCl, they found an absorption cross-section of σ = 5.29 × 10⁻²¹ cm−2. This is nearly 2 times lower than the value obtained in this work. It is unlikely that the difference in the bandwidth of the excitation laser sources (0.01 cm−1 for Melnik and <1 × 10⁻⁴ cm−1 for this work) can explain the difference, because the absorption band is unstructured and much larger than the bandwidth of both laser sources. Also, the overall shape is, after consideration of a baseline shift, in excellent agreement between both works (see Figure 7).
A possible explanation might be that Melnik et al. and Rupper et al. both consider the complete conversion of Cl-atoms into C2H5O2 radicals: a simple model is presented by Melnik et al. [17] showing the complete conversion of Cl-atoms into C2H5O2. However, the very fast reactions of Cl-atoms with C2H5O2 (k10 = 1.5 × 10⁻¹⁰ cm3molecule−1 s−1) [41] and C2H5 (k = 3 × 10⁻¹⁰ cm3molecule−1 s−1) [42] are omitted in this model, even though these reactions are non-negligible under their conditions of very high initial Cl-atom concentrations, well above 1015 cm−3, combined with relatively low C2H6 concentrations (1 × 1016 cm−3). These reactions result in a C2H5O2 concentration that might be well below the initial Cl-atom concentration, depending on the overall radical concentration as well as on the C2H6 concentration. Figure 8 shows a simulation using the model from Melnik et al., but completed by the two fast reactions. The left graph shows the result using initial concentrations such as given by Melnik et al. ([Cl]0 = 2 × 1015 cm−3 and [C2H6]0 = 1 × 1016 cm−3), the right graph shows the model result with typical conditions such as used in this work for the determination of the absorption cross-section ([Cl]0 = 5 × 1013 cm−3and [C2H6]0 = 3 × 1016 cm−3). Under the high Cl/low C2H6 conditions of Melnik et al., only 63% of the Cl-atoms have been converted to C2H5O2, while 28% of the Cl-atoms have reacted with C2H5O2 and 8% have reacted with C2H5. Under the low Cl/high C2H6 conditions (right graph), virtually all Cl-atoms have been converted to C2H5O2, less than 1% of the Cl-atoms have reacted with either C2H5O2 or C2H5. From this model one can suspect that the absorption cross-sections of Melnik et al. [17] and Rupper et al. [16] are strongly underestimated, and a correction of the Melnik et al. value, based on the more complete model presented here, would lead to σ = 8.8 × 10⁻²¹ cm−2, which gets into good agreement with the value found in this work.

5. Conclusions

We have presented in this work a new determination of the absorption cross-section of the Ã← X ˜ electronic transition of the C2H5O2 radical. The cross-section at the peak wavelength 7596.4 cm−1 has in a first approach been determined by direct comparison with the well-known HO2 absorption cross-section in back-to-back experiments to be (1.0 ± 0.2) × 10−20 cm2. In further experiments, the absorption cross-section has been validated by measuring the rate constant of C2H5O2 with HO2 in a wide range of concentration: the ratio of [HO2]/[C2H5O2] has been varied between 0.3 and 2.5 and the concentration time profiles could be reproduced very well using the same absorption cross-section for all C2H5O2 profiles, which returned a rate constant for the cross reaction of 6.2 × 10⁻¹² cm3 molecule−1 s−1. Sensitivity analysis in the upper and lower range of previous literature values did not allow for good reproduction of the concentration-time profiles for both species over the entire concentration range and confirm the reliability of our results. Smaller absorption cross-sections such as obtained in previous works can convincingly be explained by unidentified secondary reaction, not having been taken into account in the data evaluations.

Author Contributions

Conceptualization, C.F.; methodology, C.F., C.Z., M.S., M.A.; validation, C.F., L.P., C.S.; formal analysis, C.Z., M.S.; investigation, C.Z., M.S., M.A.; resources, C.F., M.A.; data curation, C.F.; writing—original draft preparation, C.F.; writing—review and editing, all authors; visualization, C.Z., M.S., C.F.; supervision, C.F., L.P., X.T., W.Z.; project administration, C.F.; funding acquisition, C.F., L.P., C.S., X.T., W.Z. All authors have read and agreed to the published version of the manuscript.

Funding

This project was supported by the French ANR agency under contract No. ANR-11-Labx-0005-01 CaPPA (Chemical and Physical Properties of the Atmosphere), the Région Hauts-de-France, the Ministère de l’Enseignement Supérieur et de la Recherche (CPER Climibio) and the European Fund for Regional Economic Development. C.F. is grateful to the Chinese Academy of Sciences President’s International Fellowship Initiative (No. 2018VMA0055). C.Z. thanks the Chinese Scholarship Council for financial support (No. 202006340125).

Institutional Review Board Statement

Not applicable.

Informed Consent Statement

Not applicable.

Data Availability Statement

Raw data are available on request.

Conflicts of Interest

The authors declare no conflict of interest.

References

  1. Orlando, J.J.; Tyndall, G.S. Laboratory studies of organic peroxy radical chemistry: An overview with emphasis on recent issues of atmospheric significance. Chem. Soc. Rev. 2012, 41, 6294–6317. [Google Scholar] [CrossRef] [PubMed] [Green Version]
  2. Fittschen, C. The reaction of peroxy radicals with OH radicals. Chem. Phys. Lett. 2019, 725, 102–108. [Google Scholar] [CrossRef]
  3. Assaf, E.; Song, B.; Tomas, A.; Schoemaecker, C.; Fittschen, C. Rate Constant of the Reaction between CH3O2 Radicals and OH Radicals revisited. J. Phys. Chem. A 2016, 120, 8923–8932. [Google Scholar] [CrossRef]
  4. Hasson, A.S.; Tyndall, G.S.; Orlando, J.J. A Product Yield Study of the Reaction of HO2 Radicals with Ethyl Peroxy (C2H5O2), Acetyl Peroxy (CH3C(O)O2), and Acetonyl Peroxy (CH3C(O)CH2O2) Radicals. J. Phys. Chem. A 2004, 108, 5979–5989. [Google Scholar] [CrossRef]
  5. Tyndall, G.S.; Cox, R.A.; Granier, C.; Lesclaux, R.; Moortgat, G.K.; Pilling, M.J.; Ravishankara, A.R.; Wallington, T.J. Atmospheric Chemistry of Small Organic Peroxy Radicals. J. Geophys. Res. 2001, 106, 12157–12182. [Google Scholar] [CrossRef]
  6. Hunziker, H.E.; Wendt, H.R. Electronic Absorption Spectra of Organic Peroxyl Radicals in the Near Infrared. J. Chem. Phys. 1976, 64, 3488–3490. [Google Scholar] [CrossRef]
  7. Hunziker, H.E.; Wendt, H.R. Near infrared absorption spectrum of HO2. J. Chem. Phys. 1974, 60, 4622–4623. [Google Scholar] [CrossRef]
  8. O’Keefe, A.; Deacon, D.A.G. Cavity ring-down optical spectrometer for absorption measurements using pulsed laser sources. Rev. Sci. Instrum. 1988, 59, 2544–2551. [Google Scholar] [CrossRef] [Green Version]
  9. Romanini, D.; Kachanov, A.A.; Sadeghi, N.; Stoeckel, F. CW cavity ring down spectroscopy. Chem. Phys. Lett. 1997, 264, 316–322. [Google Scholar] [CrossRef]
  10. Pushkarsky, M.B.; Zalyubovsky, S.J.; Miller, T.A. Detection and Characterization of Alkyl Peroxy Radicals using Cavity Ringdown Spectroscopy. J. Chem. Phys. 2000, 112., 10695–10698. [Google Scholar] [CrossRef] [Green Version]
  11. Atkinson, D.B.; Spillman, J.L. Alkyl Peroxy Radical Kinetics Measured Using Near-infrared CW-Cavity Ring-down Spectroscopy. J. Phys. Chem. A 2002, 106, 8891–8902. [Google Scholar] [CrossRef]
  12. Faragó, E.P.; Viskolcz, B.; Schoemaecker, C.; Fittschen, C. Absorption Spectrum and Absolute Absorption Cross Sections of CH3O2 Radicals and CH3I Molecules in the Wavelength Range 7473–7497 cm–1. J. Phys. Chem. A 2013, 117, 12802–12811. [Google Scholar] [CrossRef] [PubMed]
  13. Wen, Z.; Tang, X.; Fittschen, C.; Zhang, C.; Wang, T.; Wang, C.; Gu, X.; Zhang, W. Online analysis of gas-phase radical reactions using vacuum ultraviolet lamp photoionization and time-of-flight mass spectrometry. Rev. Sci. Instrum. 2020, 91. [Google Scholar] [CrossRef] [Green Version]
  14. Wen, Z.; Tang, X.; Wang, C.; Fittschen, C.; Wang, T.; Zhang, C.; Yang, J.; Pan, Y.; Liu, F.; Zhang, W. A vacuum ultraviolet photoionization time-of-flight mass spectrometer with high sensitivity for study of gas-phase radical reaction in a flow tube. Int. J. Chem. Kinet. 2019, 51, 178–188. [Google Scholar] [CrossRef]
  15. Thiebaud, J.; Crunaire, S.; Fittschen, C. Measurement of Line Strengths in the 2ν1 Band of the HO2 Radical using Laser Photolysis / Continous wave Cavity Ring Down Spectroscopy (cw-CRDS). J. Phys. Chem. A 2007, 111, 6959–6966. [Google Scholar] [CrossRef]
  16. Rupper, P.; Sharp, E.N.; Tarczay, G.; Miller, T.A. Investigation of Ethyl Peroxy Radical Conformers via Cavity Ringdown Spectroscopy of the Ã- X Electronic Transition. J. Phys. Chem. A 2007, 111, 832–840. [Google Scholar] [CrossRef] [PubMed]
  17. Melnik, D.; Chhantyal-Pun, R.; Miller, T.A. Measurements of the Absolute Absorption Cross Sections of the A-X Transition in Organic Peroxy Radicals by Dual-Wavelength Cavity Ring-Down Spectroscopy. J. Phys. Chem. A 2010, 114, 11583–11594. [Google Scholar] [CrossRef] [PubMed]
  18. Melnik, D.; Miller, T.A. Kinetic measurements of the C2H5O2 radical using time-resolved cavity ring-down spectroscopy with a continuous source. J. Chem. Phys. 2013, 139, 094201. [Google Scholar] [CrossRef]
  19. Thiebaud, J.; Fittschen, C. Near Infrared cw-CRDS Coupled to Laser Photolysis: Spectroscopy and Kinetics of the HO2 Radical. Appl. Phys. B 2006, 85, 383–389. [Google Scholar] [CrossRef]
  20. Parker, A.E.; Jain, C.; Schoemaecker, C.; Szriftgiser, P.; Votava, O.; Fittschen, C. Simultaneous, time-resolved measurements of OH and HO2 radicals by coupling of high repetition rate LIF and cw-CRDS techniques to a laser photolysis reactor and its application to the photolysis of H2O2. Appl. Phys. B. 2011, 103, 725–733. [Google Scholar] [CrossRef]
  21. Votava, O.; Mašát, M.; Parker, A.E.; Jain, C.; Fittschen, C. Microcontroller based resonance tracking unit for time resolved continuous wave cavity-ringdown spectroscopy measurements. Rev. Sci. Instrum. 2012, 83, 043110. [Google Scholar] [CrossRef]
  22. Assaf, E.; Asvany, O.; Votava, O.; Batut, S.; Schoemaecker, C.; Fittschen, C. Measurement of line strengths in the à 2A’ ← X 2A” transition of HO2 and DO2. J. Quant. Spectrosc. Radiat. Transfer 2017, 201, 161–170. [Google Scholar] [CrossRef]
  23. Thiebaud, J.; Aluculesei, A.; Fittschen, C. Formation of HO2 Radicals from the Photodissociation of H2O2 at 248 nm. J. Chem. Phys. 2007, 126, 186101. [Google Scholar] [CrossRef] [PubMed]
  24. Tang, Y.; Tyndall, G.S.; Orlando, J.J. Spectroscopic and Kinetic Properties of HO2 Radicals and the Enhancement of the HO2 Self Reaction by CH3OH and H2O. J. Phys. Chem. A 2010, 114, 369–378. [Google Scholar] [CrossRef]
  25. DeSain, J.D.; Ho, A.D.; Taatjes, C.A. High-resolution diode laser absorption spectroscopy of the O–H stretch overtone band (2,0,0)(0,0,0) of the HO2 radical. J. Mol. Spectrosc. 2003, 219, 163–169. [Google Scholar] [CrossRef]
  26. Ibrahim, N.; Thiebaud, J.; Orphal, J.; Fittschen, C. Air-Broadening Coefficients of the HO2 Radical in the 2v1 Band Measured Using cw-CRDS. J. Mol. Spectrosc. 2007, 242, 64–69. [Google Scholar] [CrossRef]
  27. Onel, L.; Brennan, A.; Gianella, M.; Ronnie, G.; Lawry Aguila, A.; Hancock, G.; Whalley, L.; Seakins, P.W.; Ritchie, G.A.D.; Heard, D.E. An intercomparison of HO2 measurements by Fluorescence Assay by Gas Expansion and Cavity Ring–Down Spectroscopy within HIRAC (Highly Instrumented Reactor for Atmospheric Chemistry). Atmos. Meas. Tech. Discuss. 2017, 10, 4877–4894. [Google Scholar] [CrossRef] [Green Version]
  28. Assaf, E.; Liu, L.; Schoemaecker, C.; Fittschen, C. Absorption spectrum and absorption cross sections of the 2v1 band of HO2 between 20 and 760 Torr air in the range 6636 and 6639 cm-1. J. Quantitat. Spectrosc. Radiat. Transf. 2018, 211, 107–114. [Google Scholar] [CrossRef]
  29. Assali, M.; Rakovsky, J.; Votava, O.; Fittschen, C. Experimental Determination of the Rate Constants of the Reactions of HO2 + DO2 and DO2 + DO2. Int. J. Chem. Kinet. 2019, Submitted. [Google Scholar]
  30. Atkinson, R.; Baulch, D.L.; Cox, R.A.; Crowley, J.N.; Hampson, R.F.; Hynes, R.G.; Jenkin, M.E.; Rossi, M.J.; Troe, J. Evaluated Kinetic and Photochemical Data for Atmospheric Chemistry: Volume 1 – Gas Phase Reactions of Ox, HOx, NOx, and SOx, Species. Atmos. Chem. Phys. 2004, 4, 1461–1738. [Google Scholar] [CrossRef] [Green Version]
  31. Atkinson, R.; Baulch, D.L.; Cox, R.A.; Crowley, J.N.; Hampson, R.F.; Hynes, R.G.; Jenkin, M.E.; Rossi, M.J.; Troe, J. Evaluated Kinetic and Photochemical Data for Atmospheric Chemistry: Volume II - Gas Phase Reactions of Organic Species. Atmos. Chem. Phys. 2006, 6, 3625–4055. [Google Scholar] [CrossRef] [Green Version]
  32. Noell, A.C.; Alconcel, L.S.; Robichaud, D.J.; Okumura, M.; Sander, S.P. Near-Infrared Kinetic Spectroscopy of the HO2 and C2H5O2 Self-Reactions and Cross Reactions. J. Phys. Chem. A 2010, 114, 6983–6995. [Google Scholar] [CrossRef]
  33. Boyd, A.A.; Flaud, P.-M.; Daugey, N.; Lesclaux, R. Rate Constants for RO2 + HO2 Reactions Measured under a Large Excess of HO2. J. Phys. Chem. A 2003, 107, 818–821. [Google Scholar] [CrossRef]
  34. Raventós-Duran, M.T.; Percival, C.J.; McGillen, M.R.; Hamer, P.D.; Shallcross, D.E. Kinetics and branching ratio studies of the reaction of C2H5O2 + HO2 using chemical ionisation mass spectrometry. Phys. Chem. Chem. Phys. 2007, 9, 4338–4348. [Google Scholar] [CrossRef]
  35. Maricq, M.M.; Szente, J.J. A Kinetic Study of the Reaction between Ethylperoxy Radicals and HO2. J. Phys. Chem. 1994, 98, 2078–2082. [Google Scholar] [CrossRef]
  36. Fenter, F.F.; Catoire, V.; Lesclaux, R.; Lightfoot, P.D. The ethylperoxy radical: Its ultraviolet spectrum, self-reaction, and reaction with hydroperoxy, each studied as a function of temperature. J. Phys. Chem. 1993, 97, 3530–3538. [Google Scholar] [CrossRef]
  37. Dagaut, P.; Wallington, T.J.; Kurylo, M.J. Flash photolysis kinetic absorption spectroscopy study of the gasphase reaction HO2 + C2H5O2 over the temperature range 228 - 380K. J. Phys. Chem. 1988, 92, 3836–3839. [Google Scholar] [CrossRef]
  38. Cattell, F.C.; Cavanagh, J.; Cox, R.A.; Jenkin, M.E. A kinetic study of reactions of HO2 and C2H5O2 using diode-laser absorption spectroscopy. J. Chem. Soc.-Faraday Trans. Ii 1986, 82, 1999–2018. [Google Scholar] [CrossRef]
  39. Fittschen, C.; Frenzel, A.; Imrik, K.; Devolder, P. Rate Constants for the Reactions of C2H5O, i-C3H7O, and n-C3H7O with NO and O2 as a Function of Temperature. Int. J. Chem. Kinet. 1999, 31, 860–866. [Google Scholar] [CrossRef]
  40. Fernandes, R.X.; Luther, K.; Marowsky, G.; Rissanen, M.P.; Timonen, R.; Troe, J. Experimental and Modeling Study of the Temperature and Pressure Dependence of the Reaction C2H5 + O2 (+ M) → C2H5O2 (+ M). J. Phys. Chem. A 2015, 119, 7263–7269. [Google Scholar] [CrossRef] [PubMed]
  41. Maricq, M.M.; Szente, J.J.; Kaiser, E.W.; Shi, J. Reaction of Chlorine Atoms with Methylperoxy and Ethylperoxy Radicals. J. Phys. Chem. 1994, 98, 2083–2089. [Google Scholar] [CrossRef]
  42. Seakins, P.W.; Woodbridge, E.L.; Leone, S.R. A laser flash photolysis, time-resolved Fourrier Transform Infrared Emission study of the reaction Cl + C2H5 --> HCl + C2H4. J. Phys. Chem. 1993, 97, 5633–5642. [Google Scholar] [CrossRef]
Figure 1. Schematic view of the used experimental setup: AOM, Acousto-Optic Modulator; APD, Avalanche Photo Diode; M, Mirror; L, Lens. Both cw-CRDS systems are equipped with identical trigger circuits and data acquisition systems.
Photonics 08 00296 g001
Figure 2. Example of measurement of HO2 absorption cross-section using the kinetic method: graph (a) shows kinetic decays for 3 different Cl-atom concentrations, graph (b) shows the same signals plotted following Equation (3) with the linear regression over the first 20 ms, graph (c) shows the plot of slope m as a function of I, obtained in graph (b) for the 3 experiments.
Photonics 08 00296 g002
Figure 3. Example of measurement of the C2H5O2 absorption cross-section relative to the HO2 absorption cross-section. Upper graphs: C2H5O2 (a) and HO2 (b) absorption time profiles. Graphs (c) and (d): same profiles, converted to 1/α (see Equation (3)) and linear regression over the first 20 ms following the photolysis pulse. Lower graph (e) shows plot of α (C2H5O2)t=0 ms = f ([HO2]t=0 ms): open circles and open diamonds are obtained using HO2 measurements at 6638.2 cm−1, coloured points (from above graphs) and crosses are obtained using HO2 measurements at 6638.58 cm−1. [O2] = 2.8 × 1018 cm−3, [C2H6] = 3.7 × 1016 cm−3 for all experiments.
Photonics 08 00296 g003
Figure 4. Plot of slope m as a function of I from the linear regressions obtained in Figure 3c.
Photonics 08 00296 g004
Figure 5. Experimental profiles taken under excess C2H5O2 conditions (upper graphs) and under excess HO2 conditions (lower graph). The dashed lines represent modelled profiles of C2H5OOH, the product from (R3), while the full lines represent the product of the corresponding self-reaction (C2H5OH for C2H5O2 and H2O2 for HO2). Different colours represent the result from a model with different k3.
Photonics 08 00296 g005
Figure 6. C2H5O2 (left graphs) and HO2 (right graphs) concentration time profiles for a total radical concentration of 1.2 × 1014 cm−3. C2H5O2 absorption time profiles have been converted using σ = 1.0 × 10⁻²⁰ cm2. Centre graphs (b): best fit with k3 = 6.2 × 10⁻¹² cm3molecule−1 s−1, upper graphs (a): model with of k3 = 5.5 × 10⁻¹² cm3molecule−1 s−1, lower graphs (c): model with k3 = 8.0 × 10⁻¹² cm3 molecule−1 s−1.
Photonics 08 00296 g006
Figure 7. C2H5O2 absorption coefficients at different wavelengths obtained in this work (green crosses and green axis), overlaid onto the spectrum obtained by Melnik et al. [17] (upper graph, Reprinted with permission from [17], Copyright 2010 American Chemical Society) and Atkinson and Spillman [11] (lower graph, Reprinted with permission from [11], Copyright 2002 American Chemical Society). In the upper graph the data have been shifted by 4 cm−1, and in both graphs our data have been scaled on the y-axis, i.e., apparently there is a baseline shift in both comparisons.
Photonics 08 00296 g007
Figure 8. Simulation of conversion of Cl-atoms (violet dashed dot) into HCl (black) and C2H5O2 (blue dashed): model taken from Melnik et al., completed with the reactions of Cl with C2H5O2 (k = 1.5 × 10⁻¹⁰ cm3s−1) [41] (red dotted) and C2H5 (k = 3 × 10⁻¹⁰ cm3s−1) [42] (green dashed dotted): left graph conditions such as used in Melnik et al. [17], right graph conditions such as used in this work. The products from the reaction of Cl with C2H5O2 (red) and with C2H5 (green) are zoomed in the right graph by a factor of 100 (right y-axis applies).
Photonics 08 00296 g008
Table 1. Summary of the C2H5O2 absorption cross-section at 7596 cm−1.
σ/10−21 cm2MethodReference
3.0 ± 1.5Kinetic method, no other radical losses consideredAtkinson and Spillman [11]
4.4Depletion of photolysis energy through precursor with [Cl] = [C2H5O2], i.e., no secondary reactions consideredRupper et al. [16]
5.29 ± 0.20Measurement of HCl in dual path CRDS with [Cl] = [C2H5O2], i.e., no secondary reactions consideredMelnik et al. [17]
5.29Kinetic method used for validation of Ref. [17]Melnik et al. [18]
10 ± 2Measurement of HO2/C2H5O2 in dual path CRDS with [Cl] = [HO2] = [C2H5O2] This work
10 ± 2Kinetic method from C2H5O2 + HO2This work
Table 2. Conditions for experiments shown in Figure 6. Initial Cl-atom concentration was for all experiments 1.2 × 1014 cm−3, total pressure was 100 Torr O2, T = 295 K. [C2H5O2] and [HO2] concentration taken from the model. Total radical concentrations are slightly below initial Cl-concentration due to (R10).
[C2H6]/1015 cm−3[CH3OH]/1015 cm−3[C2H5O2]max/1013 cm−3[HO2]max/1013 cm−3
1.945.03.48.3
2.745.04.37.4
3.455.05.06.7
4.305.05.66.1
5.912.88.13.6
7.502.88.63.0
Table 4. C2H5O2 Absorption cross-sections at different wavelengths.
Wavenumber/cm−1σ/10−20 cm2
7596.4710.0
7597.208.7
7597.448.1
7598.407.4
7602.026.7
7602.386.8
7606.255.8
7609.165.0
7610.664.2
7619.283.7
7622.363.1
7624.282.9
7626.722.3
7630.502.0
7489.162.0
Publisher’s Note: MDPI stays neutral with regard to jurisdictional claims in published maps and institutional affiliations.

