Article

Comparative Modeling of Infrared Fiber Lasers

1
Telecommunications and Teleinformatics Department, Wroclaw University of Science and Technology, Wyb. Wyspianskiego 27, 50-370 Wroclaw, Poland
2
Mid-Infrared Photonics Group, George Green Institute for Electromagnetics Research, Faculty of Engineering, The University of Nottingham, University Park, Nottingham NG7 2RD, UK
3
Politecnico di Bari, Bari, Via Edoardo Orabona, 4, 70125 Bari, Italy
4
National Institute of Telecommunication, Szachowa 1, 04-894 Warsaw, Poland
5
Fiber Optics Communication Laboratory, National Polytechnic University of Armenia, Teryan Str. 105, Yerevan 0009, Armenia
6
Institute of Photonics and Electronics, Czech Academy of Sciences, Chaberska 57, 18251 Prague, Czech Republic
7
Laser Group, College of Engineering, Bay Campus, Swansea SA1 8EN, UK
*
Author to whom correspondence should be addressed.
Photonics 2018, 5(4), 48; https://doi.org/10.3390/photonics5040048
Submission received: 23 October 2018 / Revised: 6 November 2018 / Accepted: 7 November 2018 / Published: 12 November 2018

Abstract

:
The modeling and design of fiber lasers facilitate the process of their practical realization. Of particular interest during the last few years is the development of lanthanide ion-doped fiber lasers that operate at wavelengths exceeding 2000 nm. There are two main host glass materials considered for this purpose, namely fluoride and chalcogenide glasses. Therefore, this study concerned comparative modeling of fiber lasers operating within the infrared wavelength region beyond 2000 nm. In particular, the convergence properties of selected algorithms, implemented within various software environments, were studied with a specific focus on the central processing unit (CPU) time and calculation residual. Two representative fiber laser cavities were considered: One was based on a chalcogenide–selenide glass step-index fiber doped with trivalent dysprosium ions, whereas the other was a fluoride step-index fiber doped with trivalent erbium ions. The practical calculation accuracy was also assessed by comparing directly the results obtained from the different models.

1. Introduction

Due to many potential applications in medicine, biology, environmental monitoring, and defense, a large research effort has been devoted to the development of fiber lasers operating at wavelengths exceeding 2000 nm. Currently available light sources for these wavelengths include gas lasers, quantum cascade lasers, interband cascade lasers, supercontinuum fiber sources, Raman fiber lasers, light emitting diodes, optical parametric oscillators, Globar©-type black-body sources, and lanthanide ion-doped fiber lasers. A particular advantage of lanthanide ion-doped fiber lasers is their high output beam quality and compact structure: So far, such fiber lasers have only been demonstrated at wavelengths <4000 nm [1,2]. Very recently, a room temperature fiber laser operation up to 3920 nm has been demonstrated [3]. For operating wavelengths of up to 2000 nm, silica glass fiber-based lasers can be used [4]. Fiber lasers operating at wavelengths from 2000 nm to 4000 nm are based on fluoride glass fibers. Lanthanide ions that have been so far applied for doping fluoride glass fibers include erbium (III), holmium (III), and dysprosium (III) [5,6,7,8,9,10,11,12]. For the development of lanthanide ion-doped fiber lasers operating at wavelengths exceeding 4000 nm, the introduction of lower phonon energy glasses is required. Particularly good candidates for this purpose are chalcogenide glasses. Chalcogenide glasses have been shown to have sufficiently good mechanical properties, chemical stability toward water and oxygen, low loss at the relevant wavelengths, good solubility for lanthanide ions, and they can be drawn into fibers [13,14,15,16,17,18,19,20,21,22,23,24,25,26,27,28,29,30,31,32,33,34,35,36]. Thus, both chalcogenide and fluoride glasses have been intensely studied, both experimentally and theoretically, for applications in fiber lasers [20,36,37,38,39,40,41].
A vital element in the development process of fiber lasers reaching long operating wavelengths is their design. Design tools are needed for the optimization of laser parameters so that a lasing action under optimal conditions can be successfully achieved. Therefore, the properties of various numerical algorithms applicable to the design and modeling of fiber lasers operating at wavelengths exceeding 2000 nm were compared in this contribution. In particular, the optical characteristics of a dysprosium ion-doped chalcogenide glass fiber laser and an erbium ion-doped fluoride glass fiber laser were numerically studied. For this purpose, several algorithms developed within various software environments were compared. The dependence of the central processing unit (CPU) time and calculation residual on the iteration number was used to assess the convergence properties of individual algorithms.

2. Materials and Methods

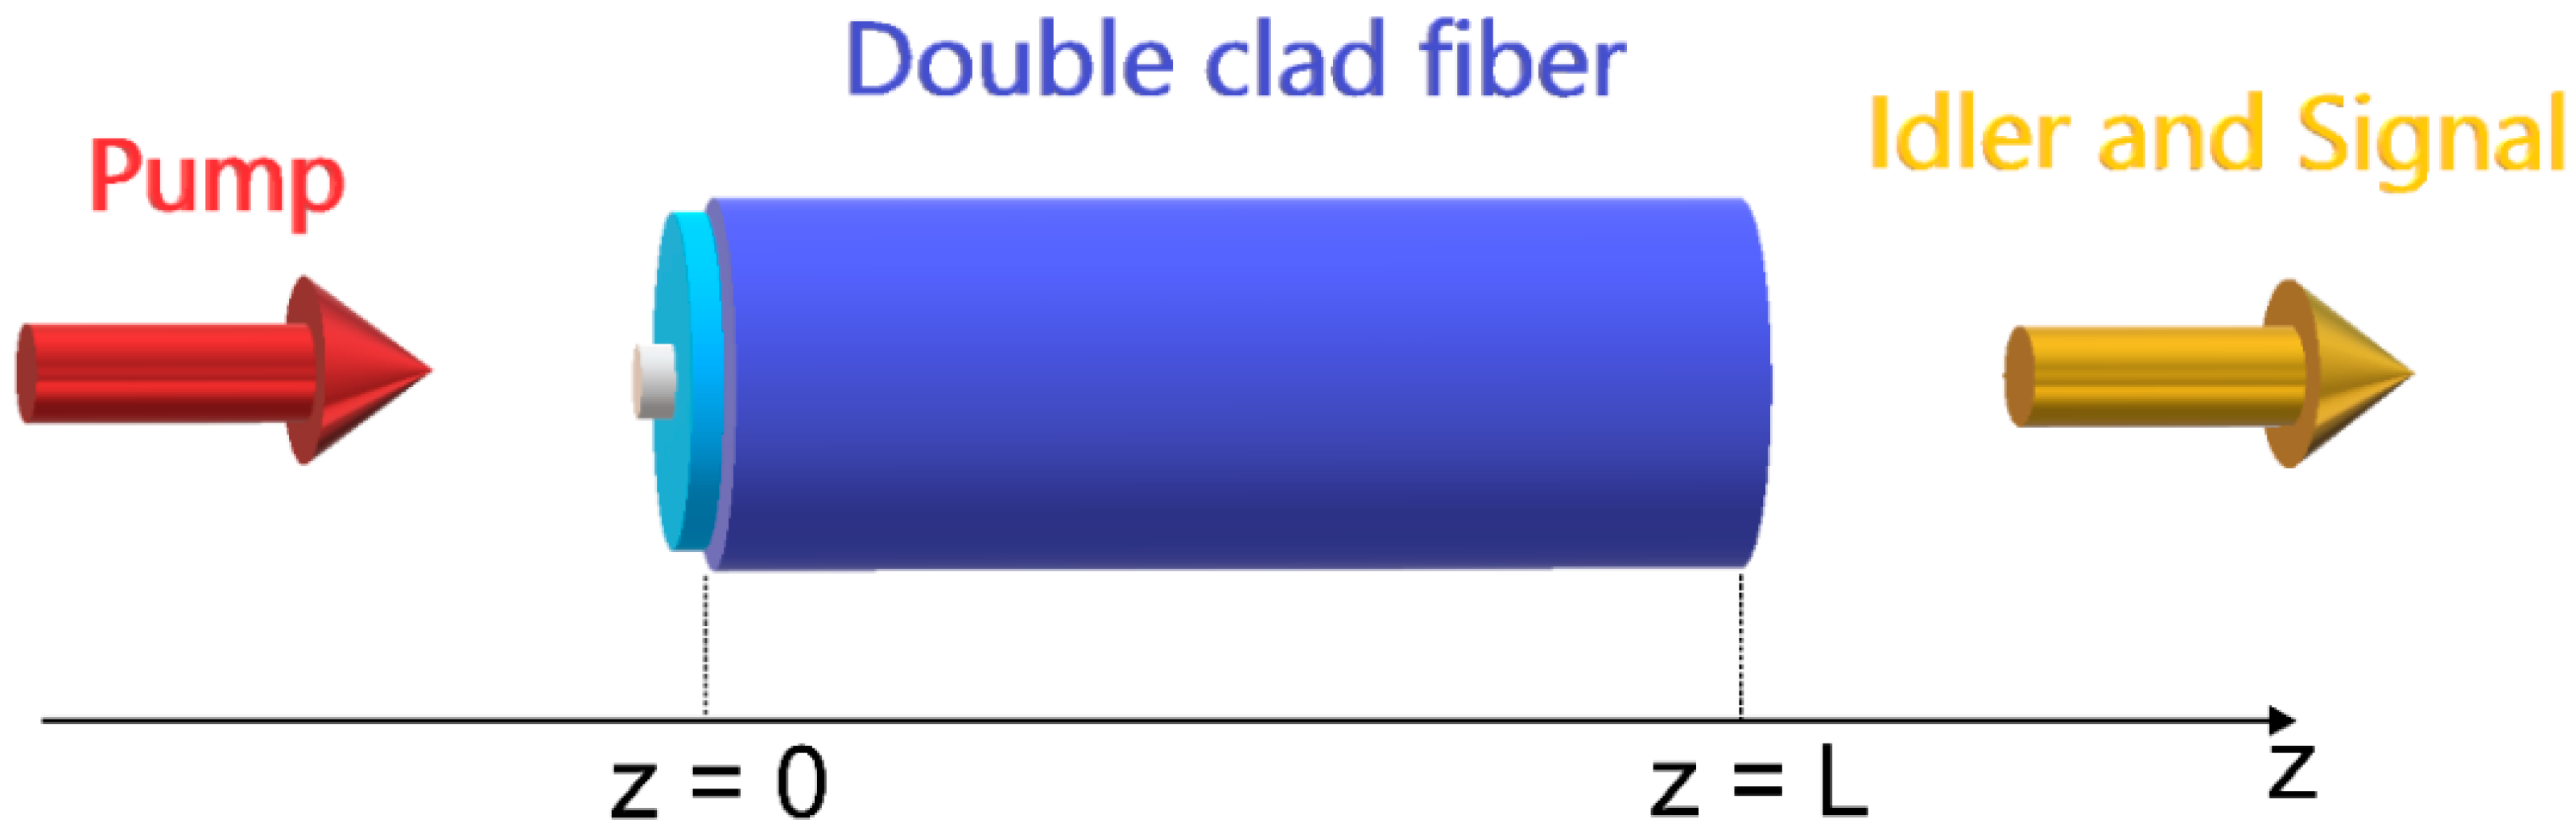
Figure 1 shows the configuration of the fiber laser cavity considered. The pump light was applied at one end of the fiber, whereas the signal and idler waves were collected at the other end of the fiber.
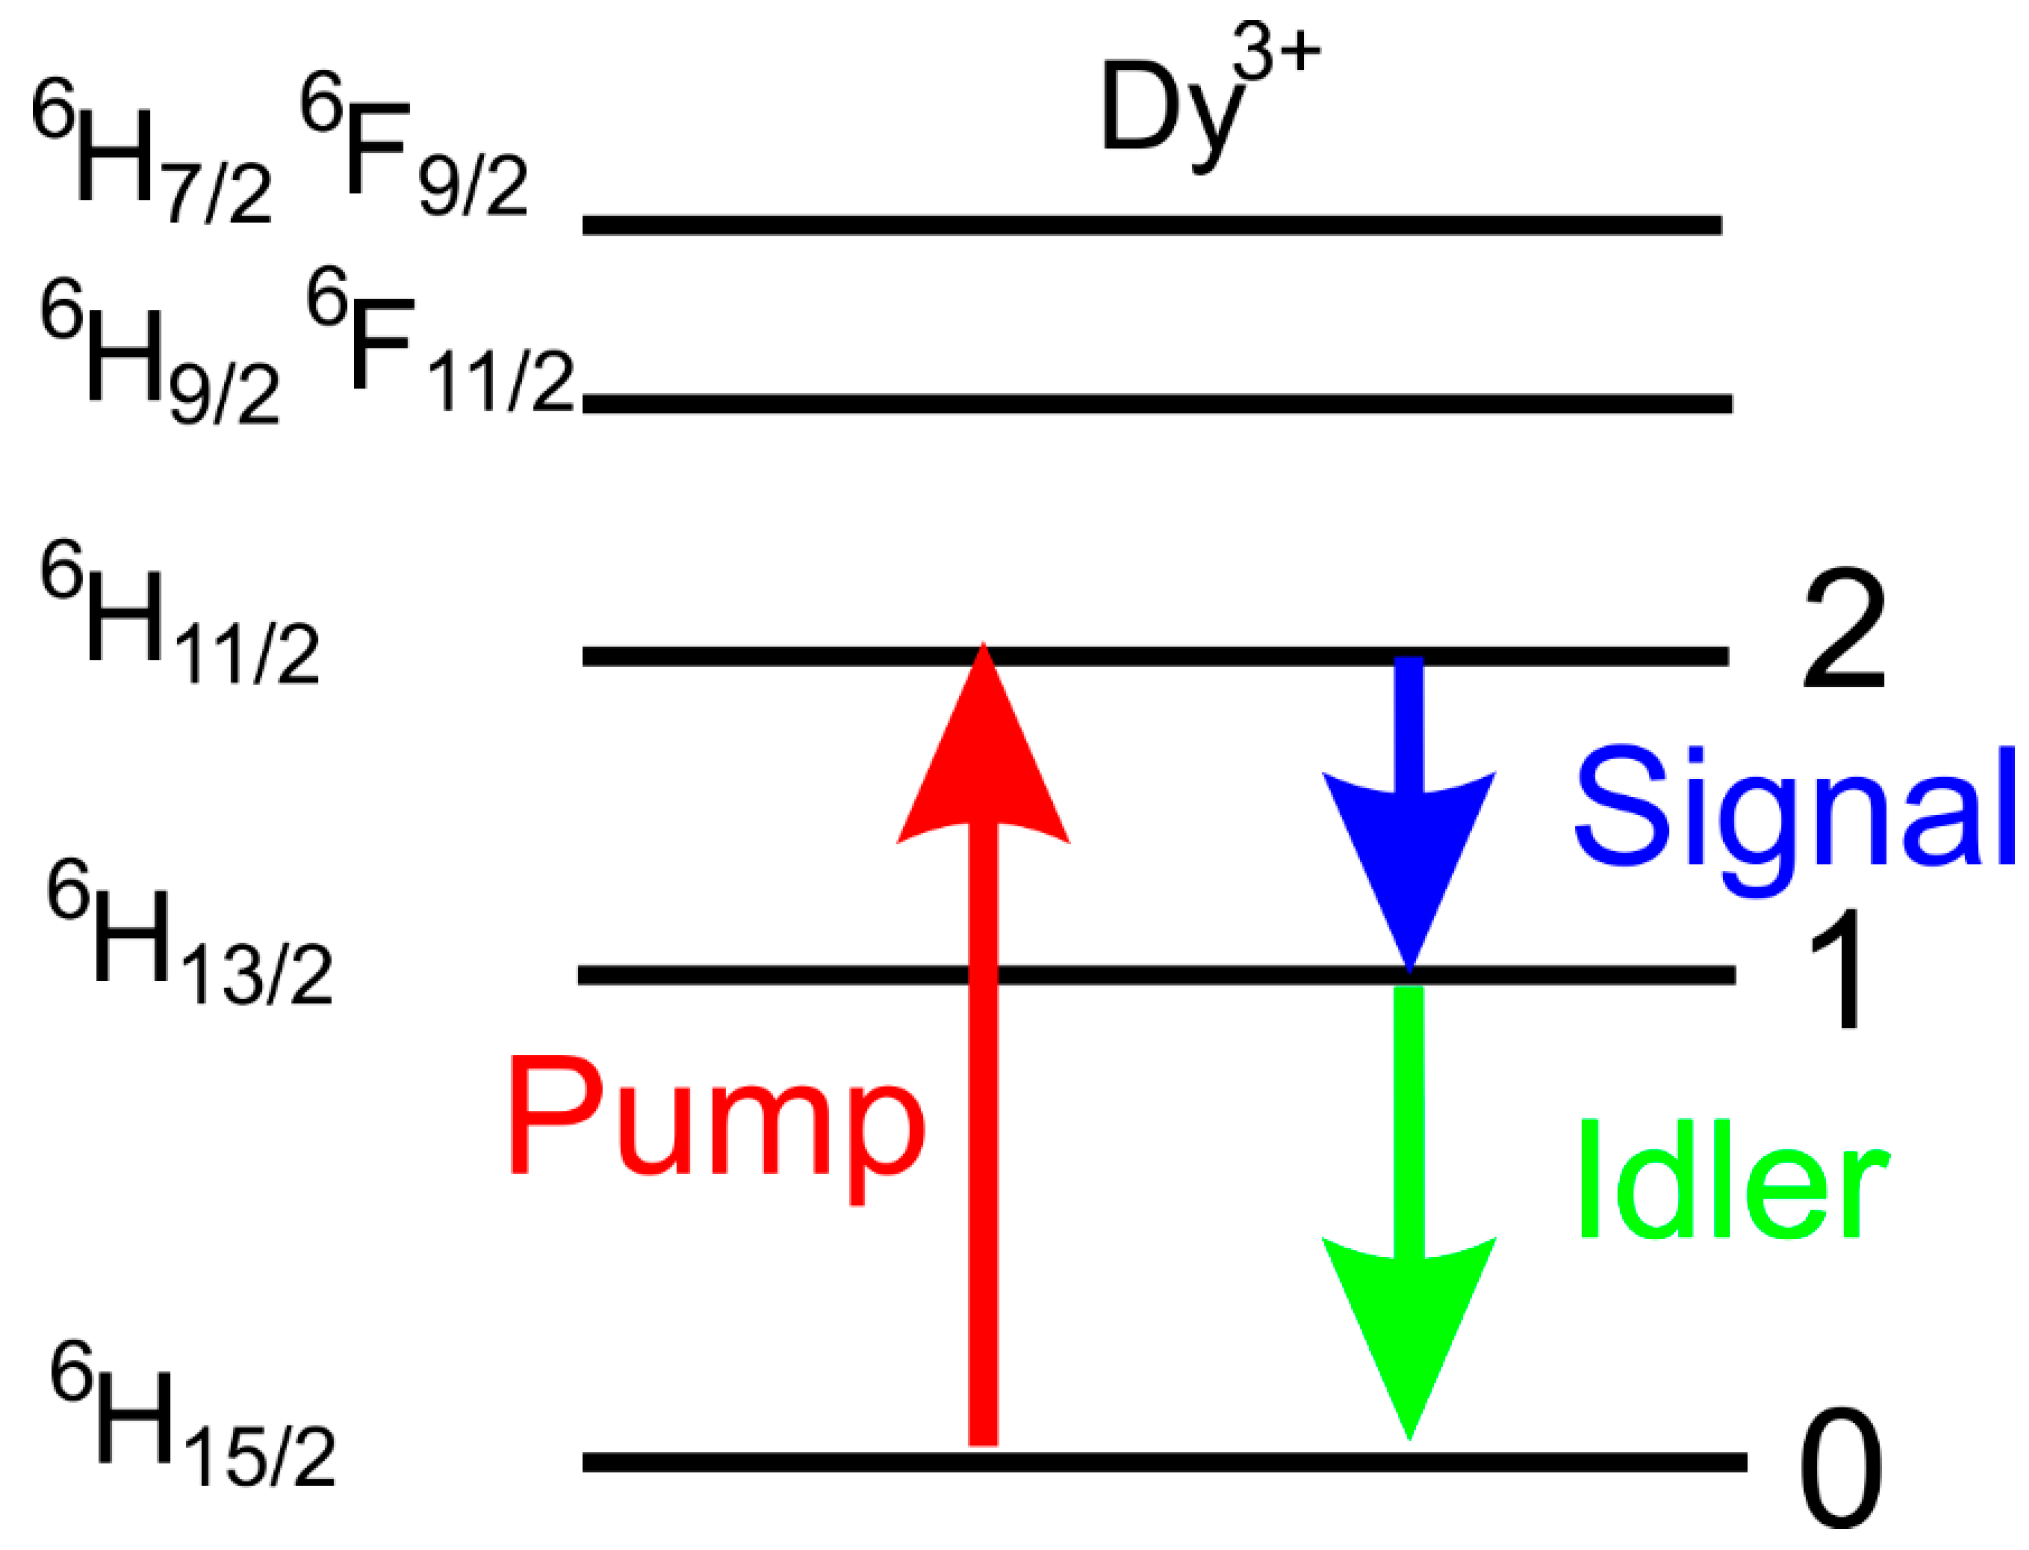
Two types of fibers were considered. The first one was a chalcogenide glass fiber core doped with trivalent dysprosium ions, whereas the other one was a fluoride fiber core doped with trivalent erbium ions. The energy level diagram for dysprosium ions, doped here into a chalcogenide–selenide glass, is shown in Figure 2. The pump laser, operating at 1710 nm, populated level 2. It was assumed simplistically that neither significant upconversion nor excited state absorption would take place, so that only the three lowest-lying energy levels needed to be included in the model. From energy level 2, a transition could take place to level 1 through either the process of spontaneous or stimulated emission, thus generating signal photons. Analogous transitions could take place between energy levels 1 and 0, accompanied by emission of idler photons. Due to the relatively long lifetime of energy level 1, measured experimentally [27], the inclusion of an idler was essential in obtaining efficient laser action. Note that the idler wave was trapped within the cavity with the help of high reflectivity mirrors, and was used to depopulate level 1. Using the energy level diagram shown in Figure 2 and the rate equation approach, one could write the following set of coupled algebraic equations that allowed for the calculation of the energy level populations of dysprosium ions:
[ a 11 a 12 a 13 a 21 a 22 a 23 1 1 1 ] × [ N 0 N 1 N 2 ] = [ 0 0 N D y ] ,
where the sum of level populations N0, N1, and N2 is equal to the total doping concentration NDy, and the coefficients amn are given by
a 11 = σ p a ϕ p ;   a 12 = σ s a ϕ s ;   a 13 = σ p e ϕ p σ s e ϕ s 1 τ 2 a 21 = σ i a ϕ i ;   a 22 = σ i e ϕ i σ s a ϕ s 1 τ 1 ;   a 23 = σ s e ϕ s + β 21 τ 2 .
In Equation (2), σxa is the absorption cross section for signal s, idler i, and pump p, whereas σxe gives the respective values for the emission cross section. The photon flux is ϕx for signal s, idler i, and pump p. The branching ratio is β21 for the 2-1 transition (Figure 2), and τ1 and τ2 are the radiative lifetimes for levels 1 and 2, respectively (Figure 2). The rate Equation (1) is complemented by the set of six ordinary differential equations that describe the spatial evolution of the pump, idler, and signal powers for both the forward- and backward-propagating waves along the z axis:
d P p ± d z = Γ p [ σ p a N 0 σ p e N 2 ] P p ± α P p ± d P s ± d z = Γ s [ σ s a N 1 σ s e N 2 ] P s ± α P s ± d P i ± d z = Γ i [ σ i a N 0 σ i e N 1 ] P i ± α P i ± ,
where Γx is the confinement factor for signal s, idler i, and pump p; α gives the loss coefficient; and Pp, Ps, and Pi are the values of the power of the pump, signal, and idler, respectively. The numeric values of the parameters are given in Table 1. A more rigorous approach, which does not use the confinement factor approximation, involves the exact calculation of the overlapping integrals between the ion populations and the electromagnetic field by taking into account the spatial distribution of the optical propagation modes:
d P p ± d z = P p ± A d [ σ p a N 0 σ p e N 2 ] i p d A α P p ± d P s ± d z = P s ± A d [ σ s a N 1 σ s e N 2 ] i s d A α P s ± d P i ± d z = P i ± A d [ σ i a N 0 σ i e N 1 ] i i d A α P i ± ,
where Ad is the rare earth-doped region and ip, is, and ii are the normalized intensities of the pump, signal, and idler optical modes, respectively.
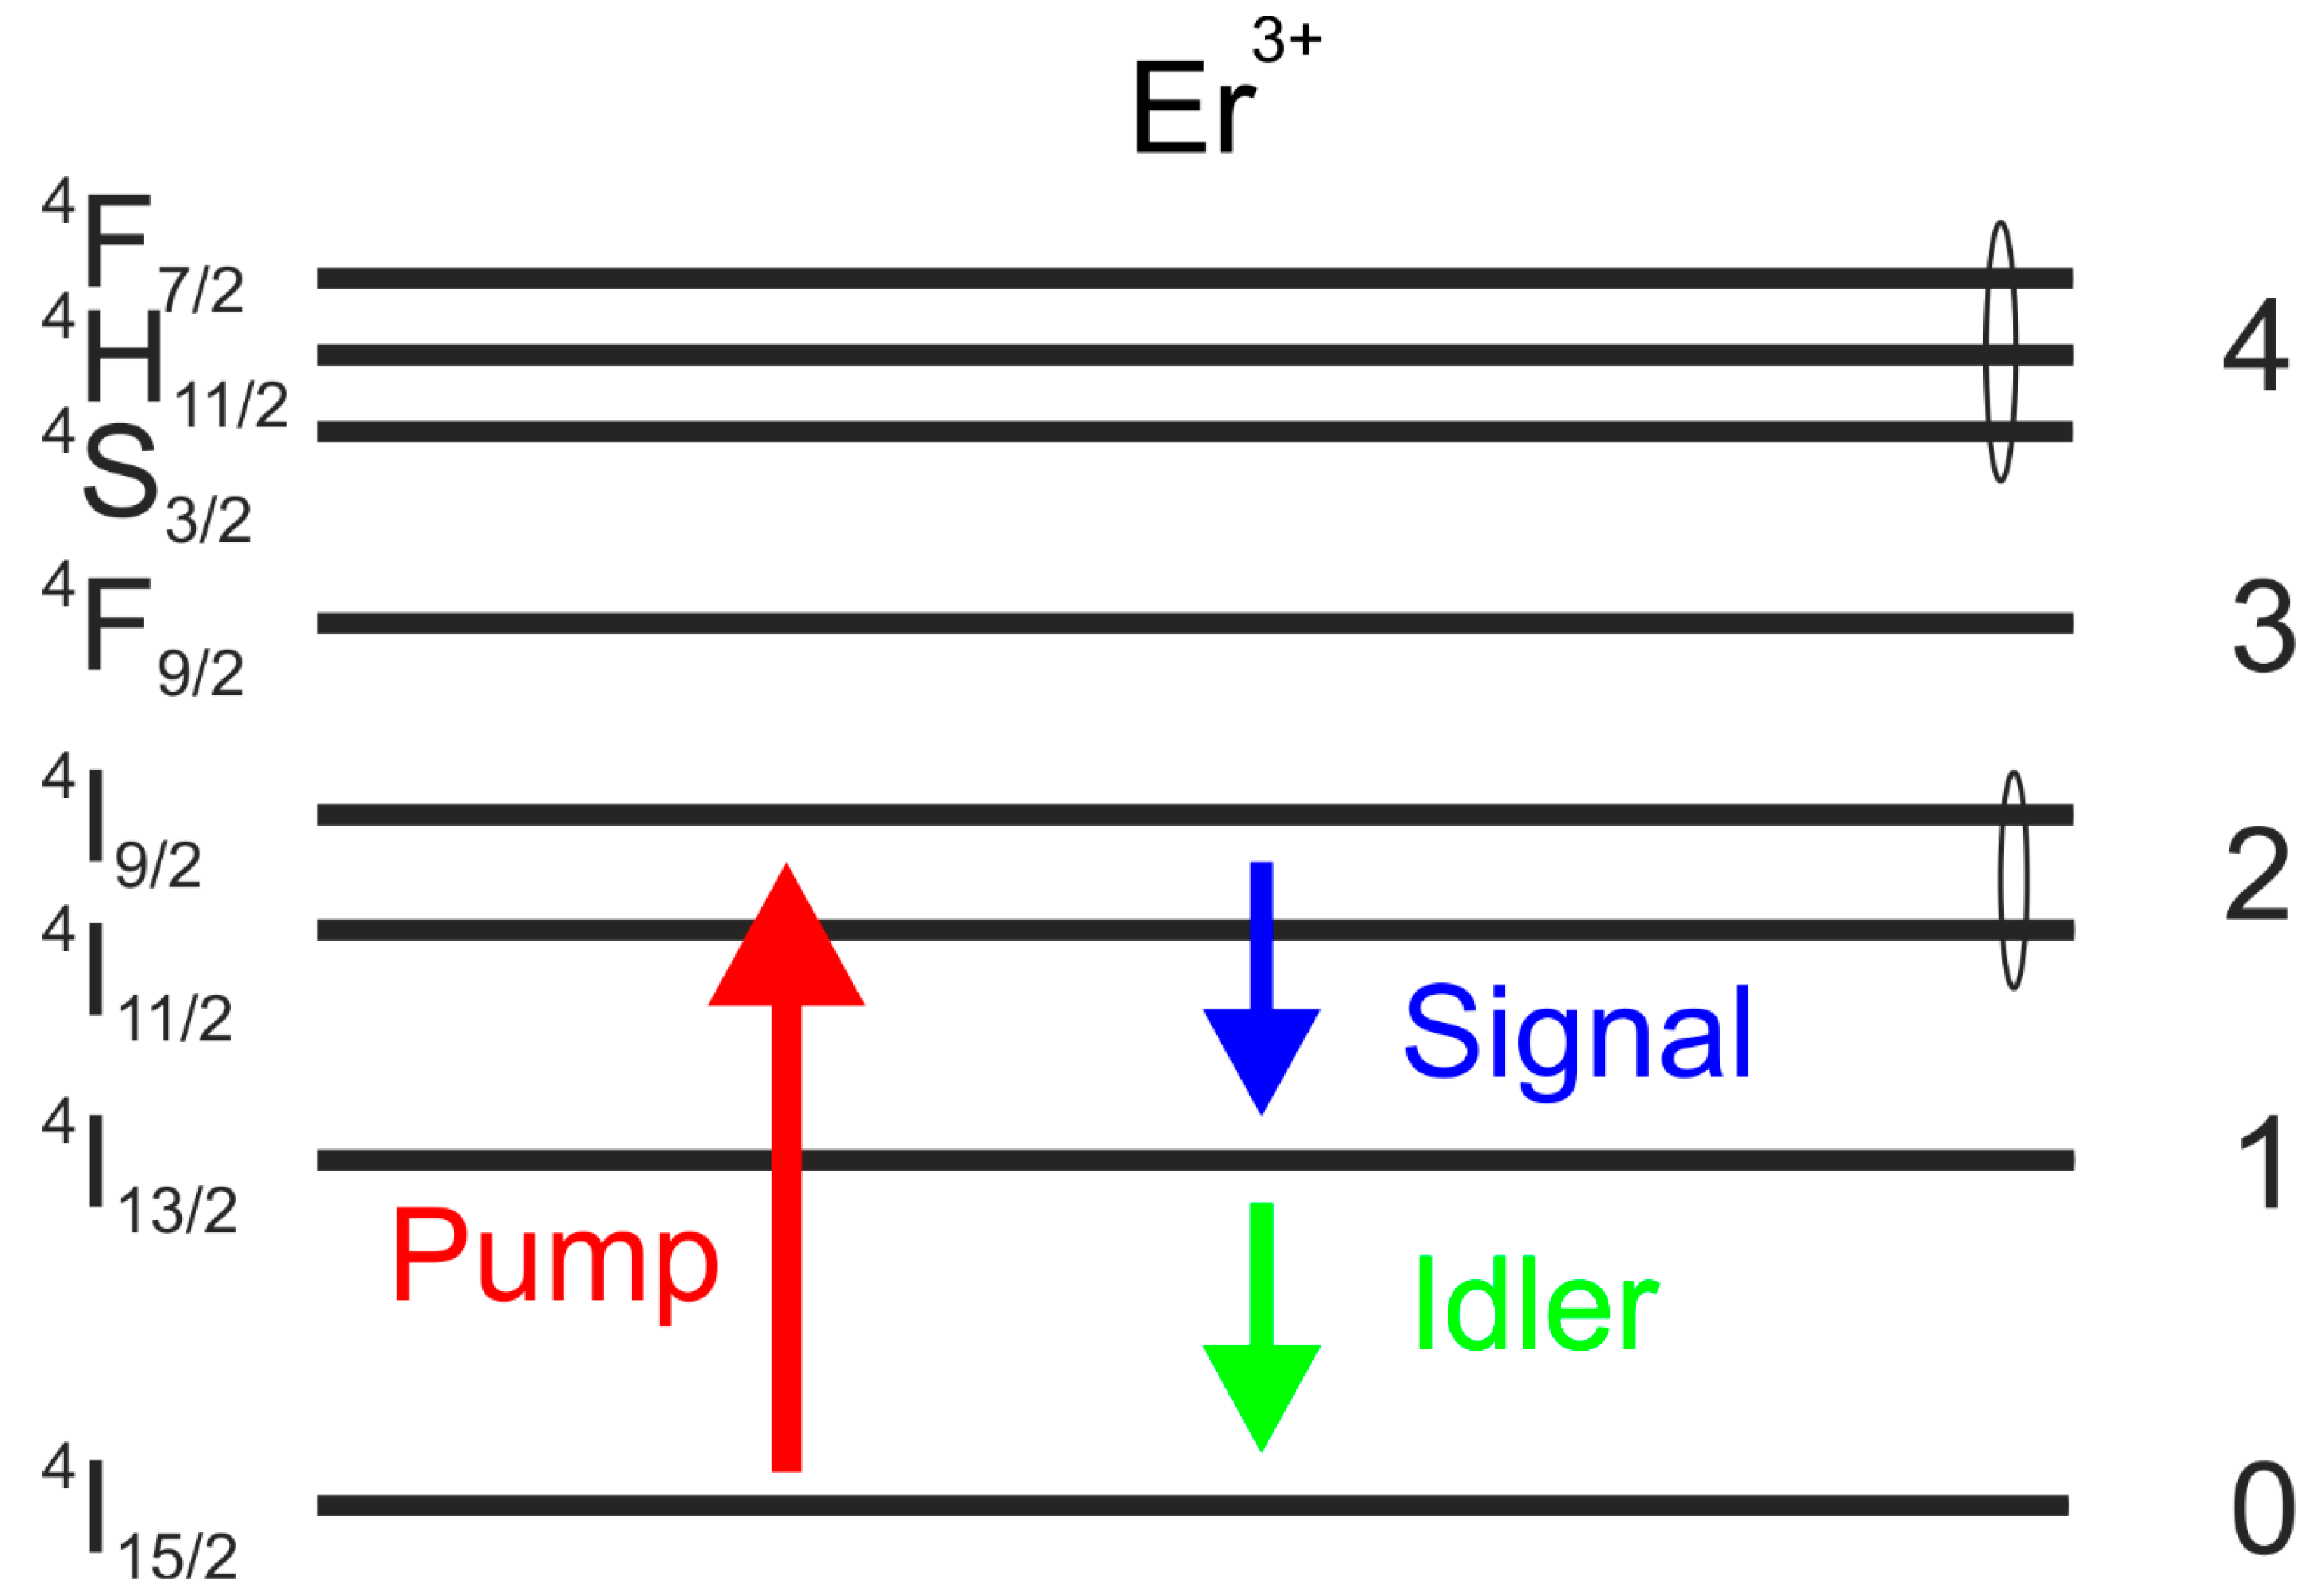
Figure 3 shows the energy level diagram of erbium trivalent ions doped into fluoride glass. The pump operating at 980 nm promoted ions from the ground state to energy level 2. Also, via excited state absorption and cooperative upconversion, the ions were promoted to energy level 3. The signal operated at 2800 nm wavelength and was amplified through interaction with energy levels 1 and 2. The idler signal may have operated at approximately 1550 nm and interacted with energy levels 0 and 1. In this model, however, it was assumed that the idler signal did not build up due to the cavity loss encountered. It is noted that in the fluoride fiber laser cavity considered, the inclusion of an idler was not needed for efficient laser action. From the Er3+ energy level diagram in Figure 3, using the rate equations approach, one obtained consistently the following set of algebraic equations that enabled calculation of the populations of the energy levels:
W 22 N 2 2 N 4 τ 4 + R E S A = 0 β 43 N 4 τ 4 N 3 τ 3 = 0 R G S A R S E R E S A + i = 3 4 β i 2 N i τ i N 2 τ 2 2 W 22 N 2 2 + W 11 N 1 2 = 0 R S E + i = 2 4 β i 1 N i τ i N 1 τ 1 2 W 11 N 1 2 = 0 R G S A + i = 1 4 β i 0 N i τ i + W 22 N 2 2 + W 11 N 1 2 = 0 ,
where the sum of level populations N0, N1, N2, N3, and N4 (Figure 3) is equal to the total doping concentration NEr. Note that τ1, τ2, τ3, and τ4 are the lifetimes of levels 1, 2, 3, and 4, respectively, whereas βxy gives the branching ratios from level x to y. W11 and W22 are the cooperative upconversion coefficients for levels 1 and 2, respectively. RGSA gives the ground state absorption rate, RSE gives the rate of stimulated emission between levels 1 and 2, and RESA gives the rate of the excited state absorption from level 2 to level 4:
R G S A = λ p Γ p σ G S A h c A e f f N 0 ( P p + + P p ) ,
R S E = λ s Γ s σ s e h c A e f f ( b 2 N 2 g 2 g 1 b 1 N 1 ) ( P s + + P s ) ,
R E S A = λ p Γ p σ E S A h c A e f f N 2 ( P p + + P p ) .
Equation (5) is complemented by a set of four ordinary differential equations that describe the evolution of the pump and signal waves. The degeneracy parameters are g2 = g1 = 2. The values of the relevant cross sections σse, σESA, and σGSA, confinement factors Γx, wavelengths λx, effective cross section Aeff, and Boltzmann factors bx are given in Table 2. Aligning the fiber with the z axis of the coordinate system enabled the following four differential equations to be written in the following form:
d d z P p + = Γ p ( σ G S A N 0 + σ E S A N 2 ) P p + α p P p + d d z P p = Γ p ( σ G S A N 0 + σ E S A N 2 ) P p α p P p d d z P s + = Γ s σ S E ( b 2 N 2 ( g 2 / g 1 ) b 1 N 1 ) P s + α s P s + d d z P s = Γ s σ S E ( b 2 N 2 ( g 2 / g 1 ) b 1 N 1 ) P s α s P s ,
where Ps and Pp are the powers of the signal and pump, respectively, and the superscripts + and − denote the forward- and backward-propagating waves, respectively. In Equation (9), αx gives the value of loss.
The pump, signal, and idler powers at the terminating end-fiber faces of the laser cavity were subjected to the following boundary conditions:
P p + ( z = 0 ) = r p ( z = 0 ) P p ( z = 0 ) + [ 1 r p ( z = 0 ) ] P p u m p P p ( z = L ) = r p ( z = L ) P p + ( z = L ) P + ( λ = λ 1 , z = 0 ) = r λ 1 ( z = 0 ) P ( λ = λ 1 , z = 0 ) P ( λ = λ 1 , z = L ) = r λ 1 ( z = L ) P + ( λ = λ 1 , z = L ) P + ( λ = λ 2 , z = 0 ) = r λ 2 ( z = 0 ) P ( λ = λ 2 , z = 0 ) P ( λ = λ 2 , z = L ) = r λ 2 ( z = L ) P + ( λ = λ 2 , z = L ) .
It should be noted that the boundary conditions in Equation (10) dictated the incident pump power, but not the value of the pump power after it crossed the air-fiber end interface.
Three algorithms, developed by different research groups in different computational environments, were compared here. The main characteristics considered were the CPU time and the dependence of the calculation residual on the iteration number. The calculation residual was defined as the sum of the squared differences between values from the current and previous iterations for signal, idler, and pump, calculated at z = 0. The CPU time was calculated using system functions. All three algorithms employed the relaxation method for solving the two-point boundary value problem, as follows:
  • The fiber laser model developed at the Institute of Photonics and Electronics of the Czech Academy of Sciences (UFE) was implemented in C programming language (gcc 4.9.2) within the Windows 7 operating system, 64 bit Intel core i7-3930K CPU at 3.2 GHz. The UFE model is currently being developed for the study of longitudinal-mode instabilities and associated buildup of dynamic fiber Bragg gratings [40].
  • The fiber laser model developed at the Politecnico di Bari (PB) was implemented in MATLAB within the Windows 10 operating system, 64-bit Intel Core i7-4790 CPU at 3.6 GHz. The numerical integration was carried out using a 4-5 Runge–Kutta algorithm, and the more rigorous overlap integrals approach was employed.
  • The fiber laser model developed at the University of Nottingham and Wroclaw University of Science and Technology (NU–PWr) was implemented in MATLAB within the Windows 10 operating system, 64 bit Intel Core i5 7th Generation, CPU at 2.5 GHz. The numerical integration was carried out using a 4-5 Runge–Kutta algorithm.

3. Results

The modeling parameters for the dysprosium trivalent ion-doped chalcogenide–selenide glass fiber laser are summarized in Table 1, whereas in Table 2 the modeling parameters for the erbium trivalent ion-doped fluoride glass fiber laser are given.
It is noted that the value of 1 dB/m for chalcogenide fiber loss at 4600 nm was challenging in practical realization. However, a low value of the fiber loss is necessary for the realization of an efficient fiber laser and is thus widely used in fiber laser modeling-related literature [17,25,42,43,44].
The parameters summarized in Table 2 were extracted from experiments and verified by J.F. Li and S.D. Jackson by comparing measured and numerical results [11]. Further effort has been undertaken to verify the reliability of the numerical codes through comparing the numerical results to experimental measurements [45].
In the simulations, the value of Planck’s constant of 6.62607004 × 10⁻³⁴ J·s and the value of the speed of light in free space of 2.99792458 × 10⁸ m/s were used.
Table 3 shows the values of the relevant lifetimes and branching ratios for erbium trivalent ions doped into a fluoride glass.
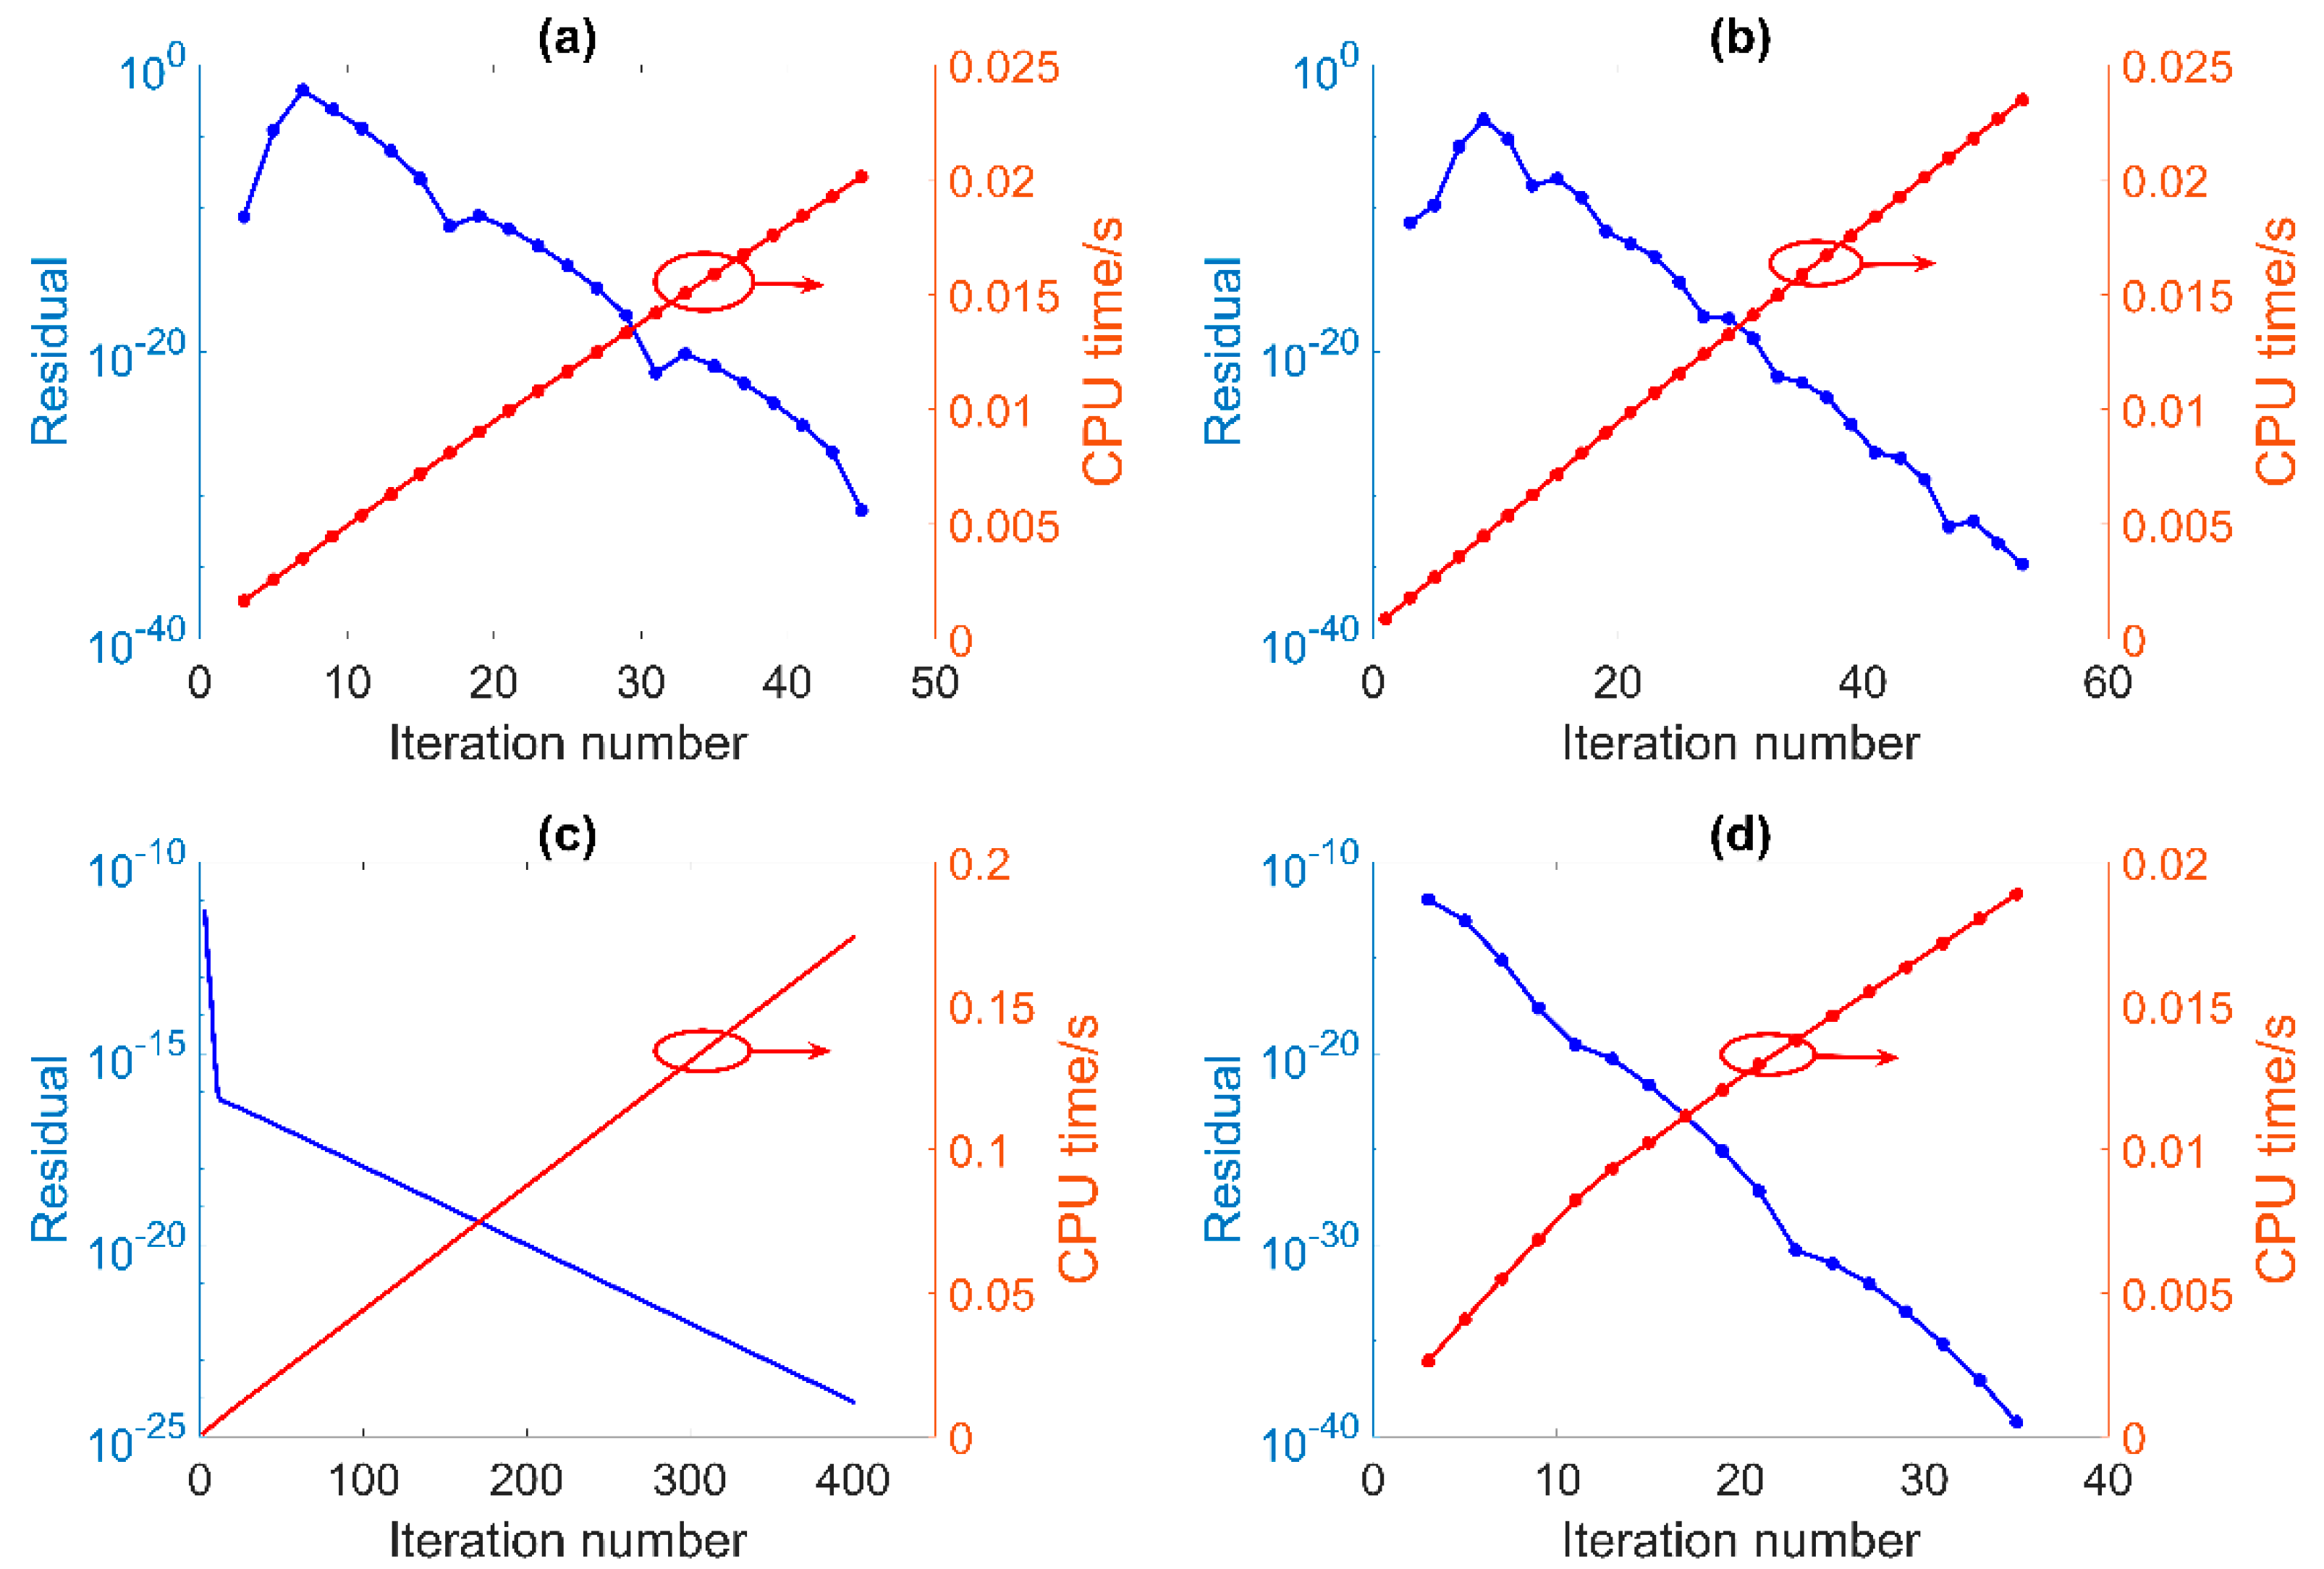
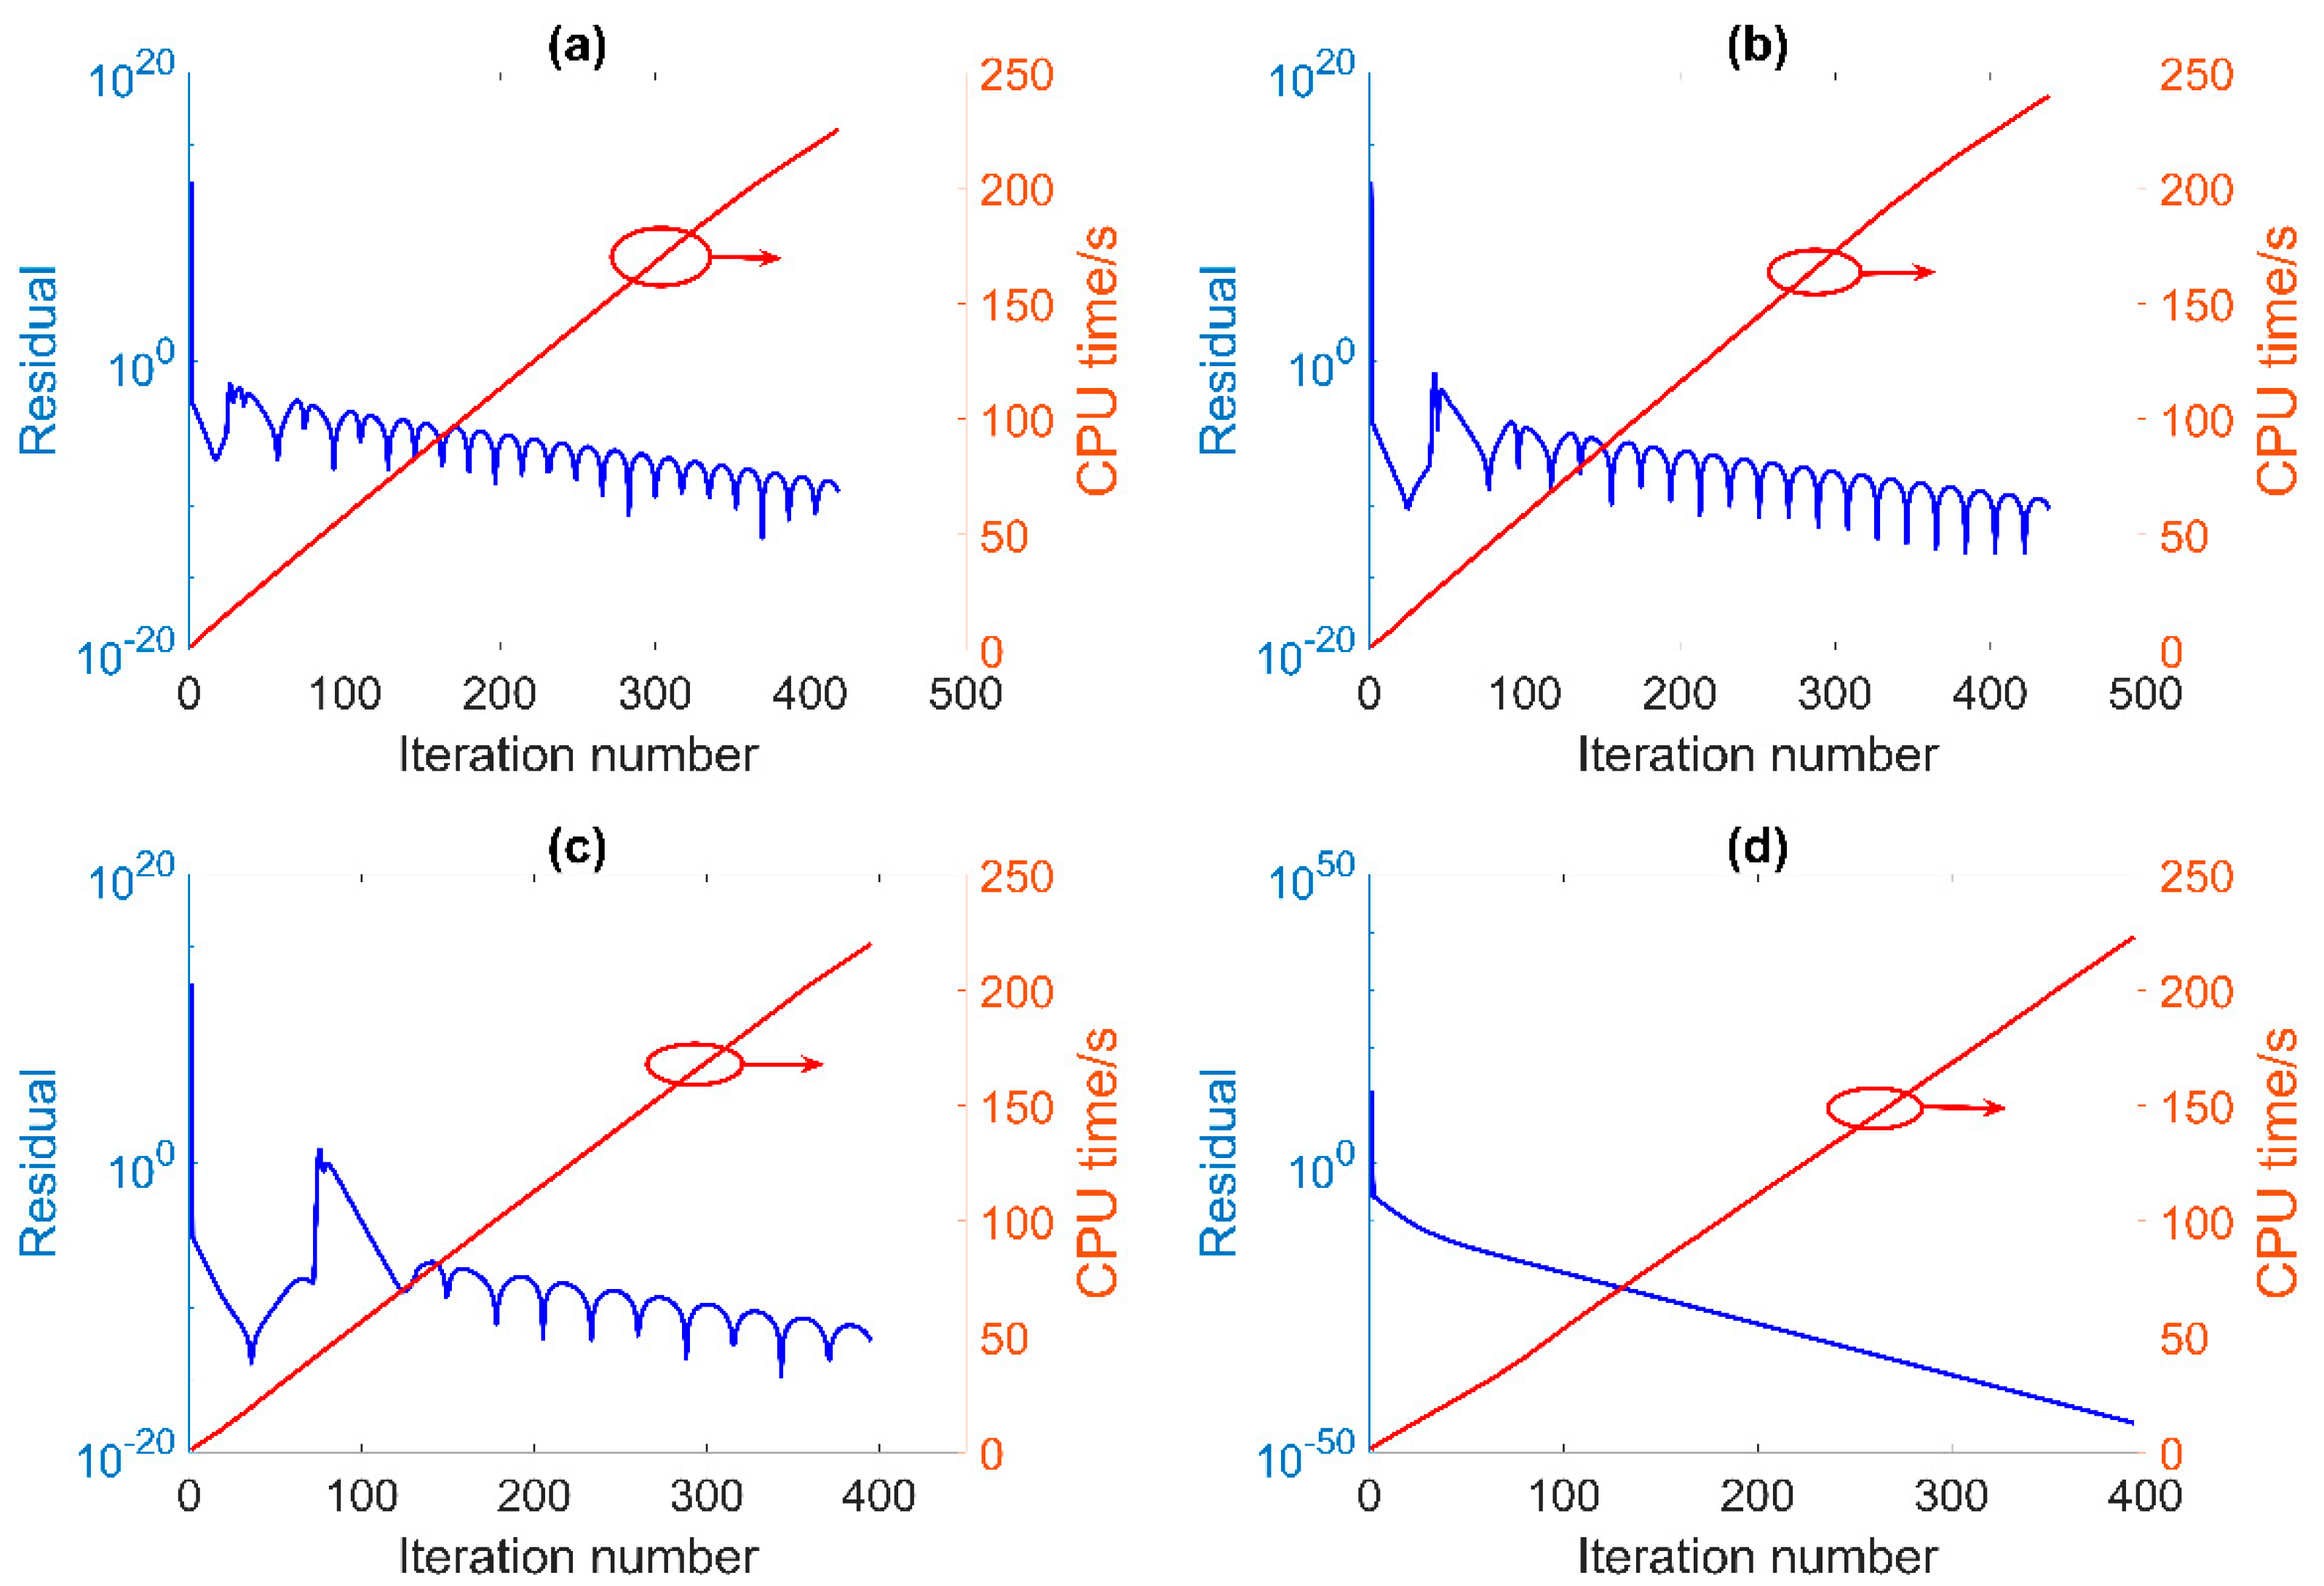
Figure 4 shows the dependence of the residual and the CPU time in the UFE model. The values of the CPU time showed a step-wise behavior due to the quantization implemented within the C function clock that was used in the simulations. In the UFE model, the rate of residual reduction was smaller at low values of the output power. In particular, at an output power of 200 mW, one can observe that the residual decreased significantly more slowly than did the other three values of the output power.
An overall lower rate of the residual reduction in the case of the PB model, when compared to the UFE model, was observed in the results shown in Figure 5. The simulation time was also at least three orders of magnitude larger despite the application of a faster processor at PB, which shows the advantage of direct C programming. Interestingly, the PB model showed a larger rate of residual decrease for low output powers. 
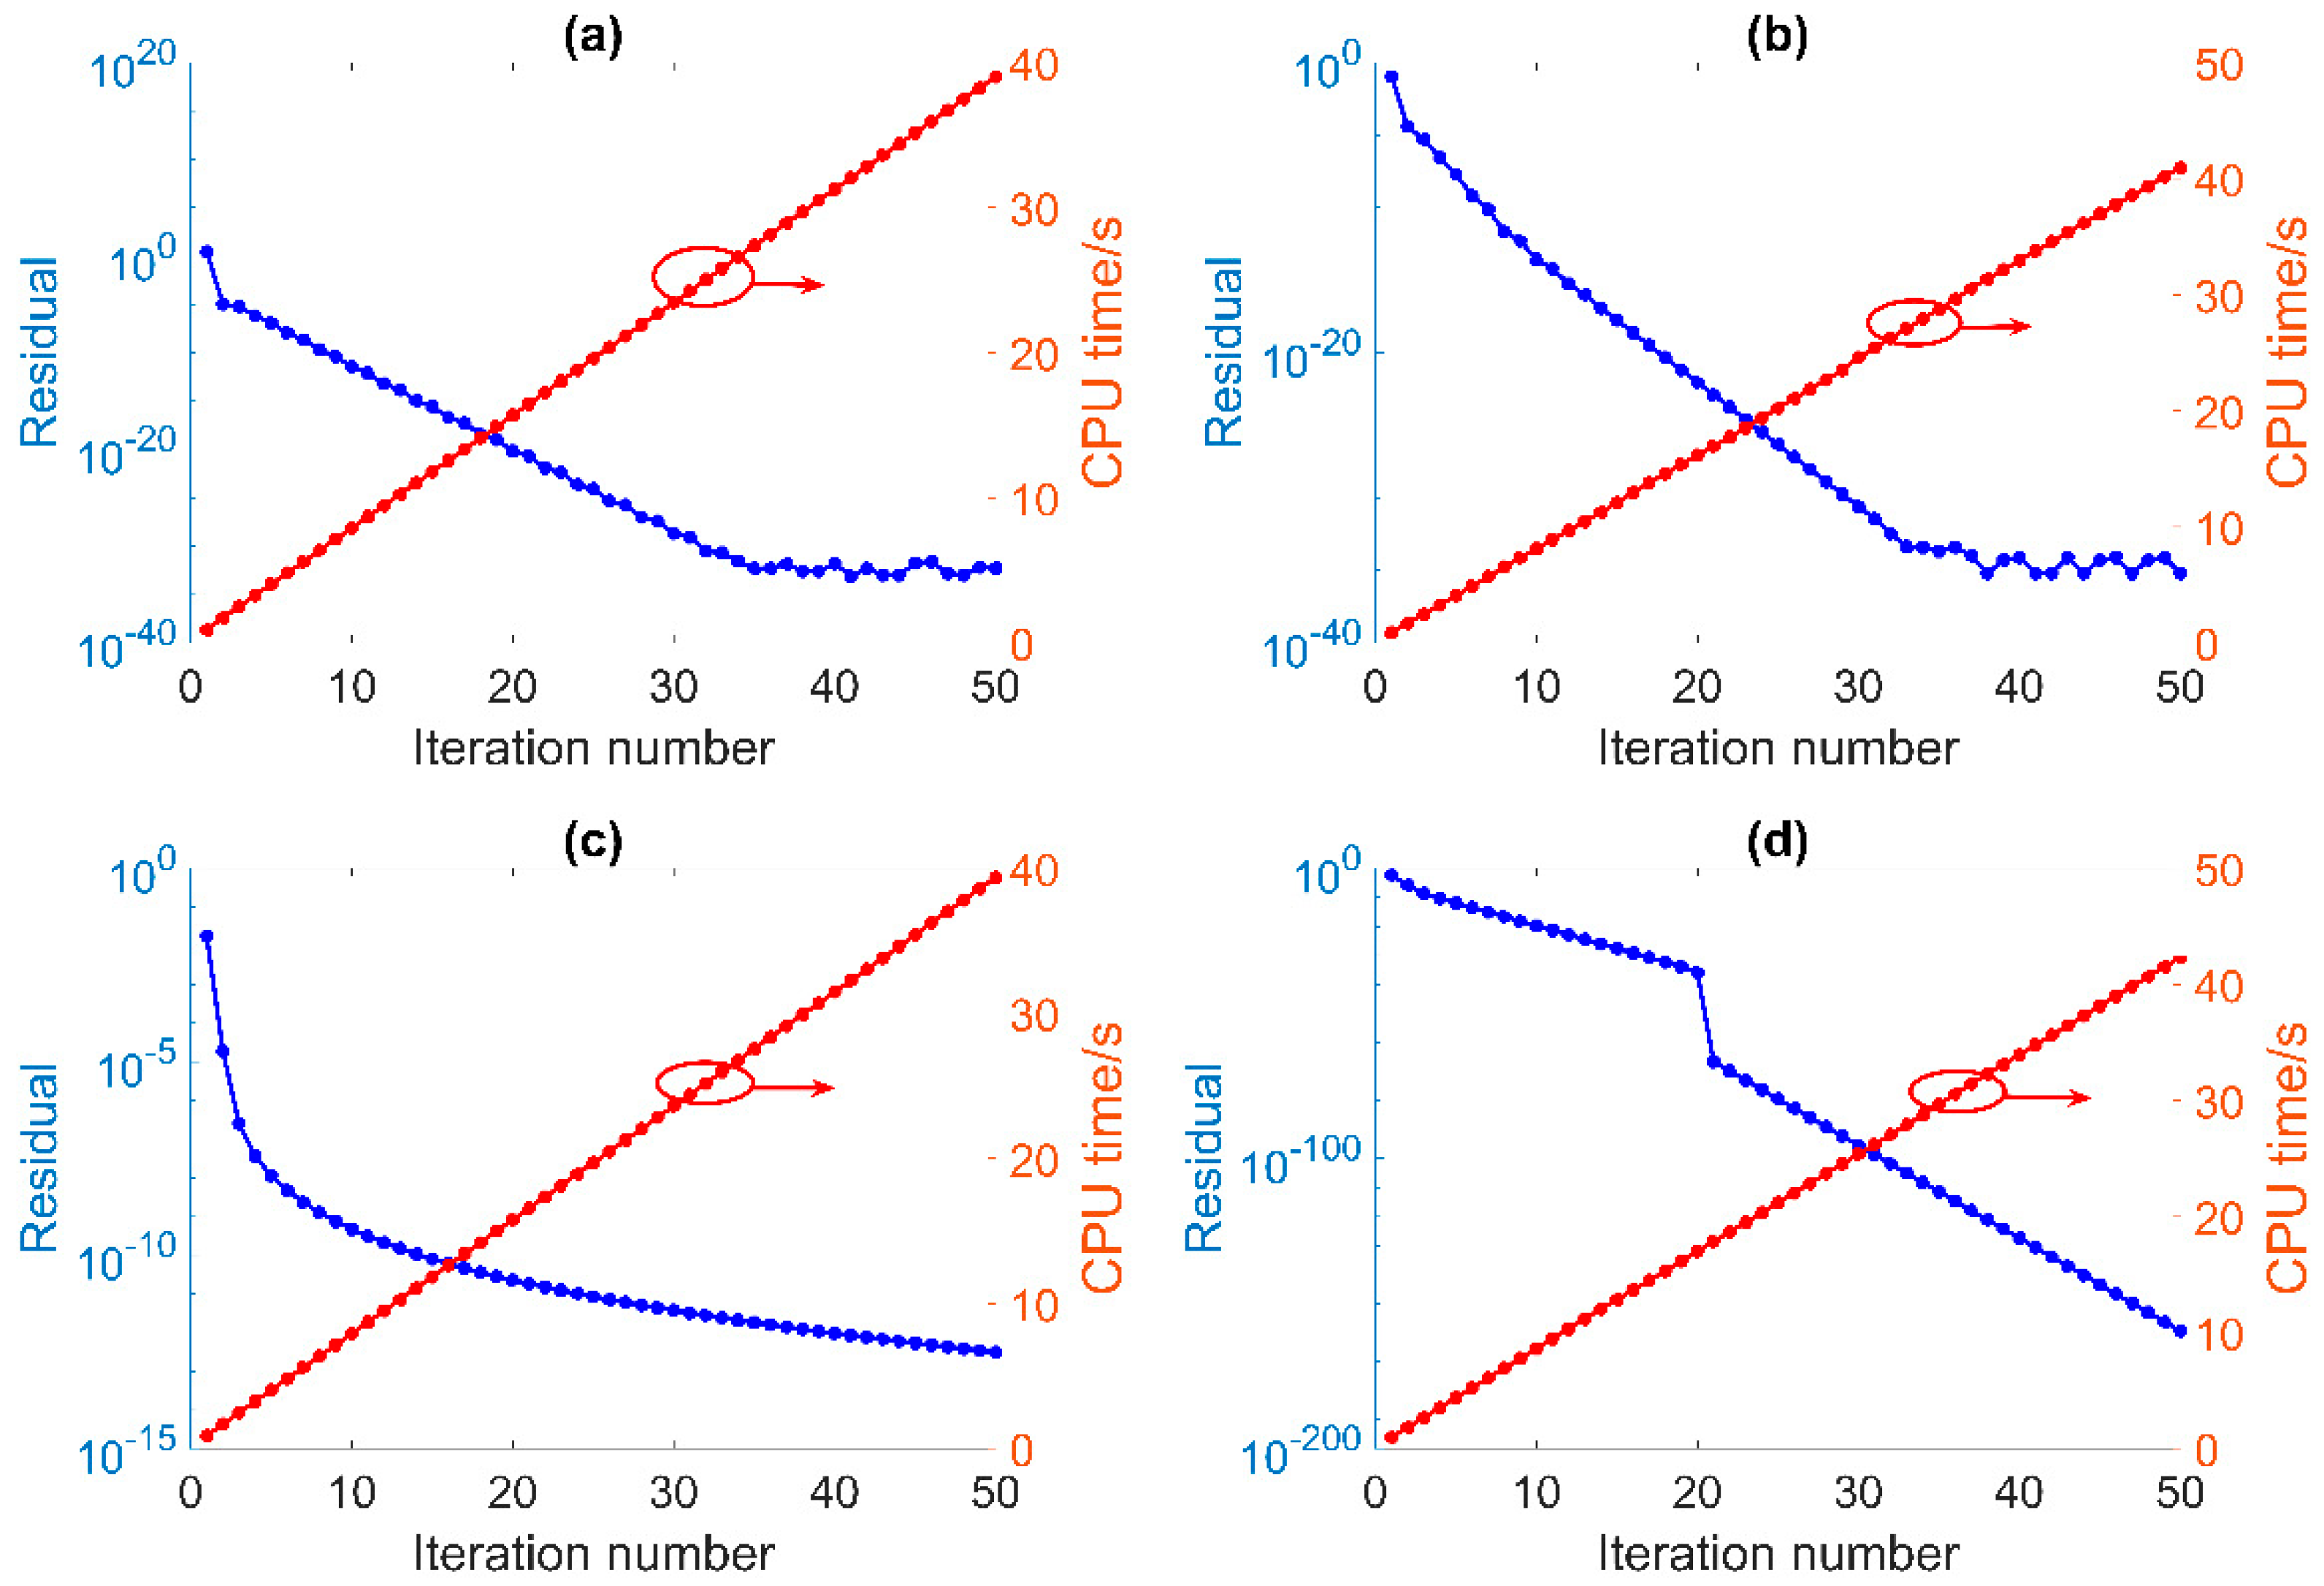
Figure 6 shows the results obtained with the NU–PWr model. When compared to the results obtained with the PB model, one observes a much larger rate of residual reduction in the NU–PWr model. However, the CPU time in the PB model, when measured per iteration, was less. The overall calculation time for the PB model had to reach a particular value of the residual, and this took a significantly longer time than the NU–PWr model. It is noted that for the PB model, the overlap integrals between the ion populations and the optical modes of pump, signal, and idler were calculated over the rare earth-doped region according to Equation (4). These integrals were updated along the fiber length, taking into account the ion population distributions. This caused a higher calculation time, but allowed higher solution accuracy.
Finally, in Table 4, Table 5 and Table 6, the results for the output power and the idler power, calculated using the UFE and NU–PWr models, are compared for both the dysprosium trivalent ion-doped chalcogenide glass fiber laser and the erbium trivalent ion-doped fluoride glass fiber laser. For the Dy3+-doped chalcogenide–selenide glass fiber laser, for the results calculated using the UFE and NU–PWr models, the relative difference, defined as the ratio between the absolute value of the difference and half of the sum of the results, was then less than 0.2% for the signal and below 0.22% for the idler wave at pump powers of 1 W and 5 W, respectively. In the case of the idler wave, the small values of the idler wave power for pump powers of 0.4 W and 0.2 W made it difficult to achieve small values of the relative difference. Nonetheless, these results consistently indicated that the idler was below the lasing threshold. In the case of the Er3+-doped fluoride glass fiber laser, both the NU–PWr and UFE models calculated results that agreed on all four digits. It is noted that the results shown in Table 4, Table 5 and Table 6 were rounded to the nearest decimal.

4. Conclusions

In this paper, software packages developed within various environments for the modeling and design of Mid infrared MIR fiber lasers were compared. The analysis was focused on the comparison of the CPU time and the values of the computational residual. The simulation results showed an advantage to using direct encoding of the algorithm in terms of the simulation time. Also, a comparison was carried out between the results obtained by different models. Both in the case of the Dy3+-doped chalcogenide–selenide step-index glass fiber and in the case of the Er3+-doped fluoride glass fiber lasers, a very good agreement was achieved between the results calculated using the UFE and NU–PWr models.

Author Contributions

Conceptualization, S.S., F.P., and P.P.; methodology, S.S., F.P., and P.P.; software, S.S., F.P., H.B., M.C.F., and P.P.; results calculation, L.S., S.S., F.P., M.C.F., and P.P.; formal analysis and validation, S.S., F.P., and P.P.; writing—original draft preparation, S.S., F.P., M.M., A.B.S., T.M.B., E.B., S.T., and P.P.; writing—review and editing, S.S., F.P., M.M., A.B.S., T.M.B., E.B., S.T., and P.P.

Funding

Pavel Peterka also acknowledges support from the Czech Science Foundation, project No. 16-13306S.

Acknowledgments

The authors wish to thank COST Action MP1401 Advanced fiber laser and coherent source as tools for society, manufacturing, and life science, and Wrocław University of Science and Technology (statutory activity) for financial support.

Conflicts of Interest

The authors declare no conflicts of interest.

References

  1. Schneider, J.; Carbonnier, C.; Unrau, U.B. Characterization of a Ho3+-doped fluoride fiber laser with a 3.9-mm emission wavelength. Appl. Opt. 1997, 36, 8595–8600. [Google Scholar] [CrossRef] [PubMed]
  2. Majewski, M.R.; Woodward, R.I.; Carreé, J.-Y.; Poulain, S.; Poulain, M.; Jackson, S.D. Emission beyond 4 μm and mid-infrared lasing in a dysprosium-doped indium fluoride InF3 fiber. Opt. Lett. 2018, 43, 1926–1929. [Google Scholar] [CrossRef] [PubMed]
  3. Maes, F.; Fortin, V.; Poulain, S.; Poulain, M.; Carrée, J.-Y.; Bernier, M.; Vallée, R. Room temperature fiber laser at 3.92 mm. arXiv 2018, arXiv:1804.08610. [Google Scholar]
  4. Písařík, M.; Peterka, P.; Aubrecht, J.; Cajzl, J.; Benda, A.; Mareš, D.; Todorov, F.; Podrazký, O.; Honzátko, P.; Kašík, I. Thulium-doped fibre broadband source for spectral region near 2 micrometers. Opto-Electron. Rev. 2016, 24, 223–231. [Google Scholar] [CrossRef]
  5. Tokita, S.; Murakami, M.; Shimizu, S.; Hashida, M.; Sakabe, S. Liquid-cooled 24 W mid-infrared Er:ZBLAN fiber laser. Opt. Lett. 2009, 34, 3062–3064. [Google Scholar] [CrossRef] [PubMed]
  6. Henderson-Sapir, O.; Jackson, S.D.; Ottaway, D.J. Versatile and widely tunable mid-infrared erbium doped ZBLAN fiber laser. Opt. Lett. 2016, 41, 1676–1679. [Google Scholar] [CrossRef] [PubMed]
  7. Henderson-Sapir, O.; Malouf, A.; Bawden, N.; Munch, J.; Jackson, S.D.; Ottaway, D.J. Recent Advances in 3.5 mm Erbium-Doped Mid-Infrared Fiber Lasers. IEEE J. Sel. Top. Quantum Electron. 2017, 23, 6–14. [Google Scholar] [CrossRef]
  8. Henderson-Sapir, O.; Munch, J.; Ottaway, D.J. New energy-transfer upconversion process in Er3+: ZBLAN mid-infrared fiber lasers. Opt. Express 2016, 24, 6869–6883. [Google Scholar] [CrossRef] [PubMed]
  9. Malouf, A.; Henderson-Sapir, O.; Gorjan, M.; Ottaway, D.J. Numerical Modeling of 3.5 mm Dual-Wavelength Pumped Erbium-Doped Mid-Infrared Fiber Lasers. IEEE J. Quantum Electron. 2016, 52, 1600412. [Google Scholar] [CrossRef]
  10. Lamrini, S.; Scholle, K.; Schäfer, M.; Fuhrberg, P.; Ward, J.; Francis, M.; Sujecki, S.; Oladeji, A.; Napier, B.; Seddon, A.B.; et al. High-Energy Q-switched Er:ZBLAN Fibre Laser at 2.79 mm. In Proceedings of the CLEO/Europe-EQEC OSA, Munich, Germany, 21–25 June 2015. [Google Scholar]
  11. Li, J.F.; Jackson, S.D. Numerical Modeling and Optimization of Diode Pumped Heavily-Erbium-Doped Fluoride Fiber Lasers. IEEE J. Quantum Electron. 2012, 48, 454–464. [Google Scholar] [CrossRef]
  12. Majewski, M.R.; Jackson, S.D. Highly efficient mid-infrared dysprosium fiber laser. Opt. Lett. 2016, 41, 2173–2176. [Google Scholar] [CrossRef] [PubMed]
  13. Sakr, H.; Furniss, D.; Tang, Z.; Sojka, L.; Moneim, N.A.; Barney, E.; Sujecki, S.; Benson, T.M.; Seddon, A.B. Superior photoluminescence (PL) of Pr3+-In, compared to Pr3+-Ga, selenide-chalcogenide bulk glasses and PL of optically-clad fiber. Opt. Express 2014, 22, 21236–21252. [Google Scholar] [CrossRef] [PubMed]
  14. Sakr, H.; Tang, Z.Q.; Furniss, D.; Sojka, L.; Sujecki, S.; Benson, T.M.; Seddon, A.B. Promising emission behavior in Pr3+/In selenide-chalcogenide-glass small-core step index fiber (SIF). Opt. Mater. 2017, 67, 98–107. [Google Scholar] [CrossRef]
  15. Seddon, A.B.; Furniss, D.; Tang, Z.Q.; Sojka, L.; Benson, T.M.; Caspary, R.; Sujecki, S. True Mid-Infrared Pr3+ Absorption Cross-Section in a Selenide-Chalcogenide Host-Glass. In Proceedings of the 2016 18th International Conference on Transparent Optical Networks, Trento, Italy, 10–14 July 2016. [Google Scholar]
  16. Seddon, A.B.; Tang, Z.; Furniss, D.; Sujecki, S.; Benson, T.M. Progress in rare-earth-doped mid-infrared fiber lasers. Opt. Express 2010, 18, 26704–26719. [Google Scholar] [CrossRef] [PubMed]
  17. Sojka, L.; Tang, Z.; Furniss, D.; Sakr, H.; Beres-Pawlik, E.; Seddon, A.B.; Benson, T.M.; Sujecki, S. Numerical and experimental investigation of mid-infrared laser action in resonantly pumped Pr3+ doped chalcogenide fibre. Opt. Quantum Electron. 2017, 49, 21. [Google Scholar] [CrossRef]
  18. Sojka, L.; Tang, Z.; Furniss, D.; Sakr, H.; Fang, Y.; Beres-Pawlik, E.; Benson, T.M.; Seddon, A.B.; Sujecki, S. Mid-infrared emission in Tb3+-doped selenide glass fiber. J. Opt. Soc. Am. B Opt. Phys. 2017, 34, A70–A79. [Google Scholar] [CrossRef]
  19. Sojka, L.; Tang, Z.; Furniss, D.; Sakr, H.; Oladeji, A.; Beres-Pawlik, E.; Dantanarayana, H.; Faber, E.; Seddon, A.B.; Benson, T.M.; et al. Broadband, mid-infrared emission from Pr3+ doped GeAsGaSe chalcogenide fiber, optically clad. Opt. Mater. 2014, 36, 1076–1082. [Google Scholar] [CrossRef]
  20. Sojka, L.; Tang, Z.; Zhu, H.; Beres-Pawlik, E.; Furniss, D.; Seddon, A.B.; Benson, T.M.; Sujecki, S. Study of mid-infrared laser action in chalcogenide rare earth doped glass with Dy3+, Pr3+ and Tb3+. Opt. Mater. Express 2012, 2, 1632–1640. [Google Scholar] [CrossRef]
  21. Tang, Z.; Furniss, D.; Fay, M.; Sakr, H.; Sojka, L.; Neate, N.; Weston, N.; Sujecki, S.; Benson, T.M.; Seddon, A.B. Mid-infrared photoluminescence in small-core fiber of praseodymium-ion doped selenide-based chalcogenide glass. Opt. Mater. Express 2015, 5, 870–886. [Google Scholar] [CrossRef]
  22. Tang, Z.; Neate, N.C.; Furniss, D.; Sujecki, S.; Benson, T.M.; Seddon, A.B. Crystallization behavior of Dy3+-doped selenide glasses. J. Non-Cryst. Solids 2011, 357, 2453–2462. [Google Scholar] [CrossRef]
  23. Tang, Z.Q.; Shiryaev, V.S.; Furniss, D.; Sojka, L.; Sujecki, S.; Benson, T.M.; Seddon, A.B.; Churbanov, M.F. Low loss Ge-As-Se chalcogenide glass fiber, fabricated using extruded preform, for mid-infrared photonics. Opt. Mater. Express 2015, 5, 1722–1737. [Google Scholar] [CrossRef]
  24. Churbanov, M.F.; Scripachev, I.V.; Shiryaev, V.S.; Plotnichenko, V.G.; Smetanin, S.V.; Kryukova, E.B.; Pyrkov, Y.N.; Galagan, B.I. Chalcogenide glasses doped with Tb, Dy and Pr ions. J. Non-Cryst. Solids 2003, 326, 301–305. [Google Scholar] [CrossRef]
  25. Karaksina, E.V.; Shiryaev, V.S.; Churbanov, M.F.; Anashkina, E.A.; Kotereva, T.V.; Snopatin, G.E. Core-clad Pr3+-doped Ga(In)-Ge-As-Se-(I) glass fibers: Preparation, investigation, simulation of laser characteristics. Opt. Mater. 2017, 72, 654–660. [Google Scholar] [CrossRef]
  26. Karaksina, E.V.; Shiryaev, V.S.; Kotereva, T.V.; Churbanov, M.F. Preparation of high-purity Pr3+ doped Ge-Ga-Sb-Se glasses with intensive middle infrared luminescence. J. Lumin. 2016, 170, 37–41. [Google Scholar] [CrossRef]
  27. Shiryaev, V.S.; Karaksina, E.V.; Kotereva, T.V.; Churbanov, M.F.; Velmuzhov, A.P.; Sukhanov, M.V.; Ketkova, L.A.; Zernova, N.S.; Plotnichenko, V.G.; Koltashev, V.V. Preparation and investigation of Pr3+-doped Ge-Sb-Se-In-I glasses as promising material for active mid-infrared optics. J. Lumin. 2017, 183, 129–134. [Google Scholar] [CrossRef]
  28. Quimby, R.S.; Shaw, L.B.; Sanghera, J.S.; Aggarwal, I.D. Modeling of cascade lasing in Dy: Chalcogenide glass fiber laser with efficient output at 4.5 mm. IEEE Photonics Technol. Lett. 2008, 20, 123–125. [Google Scholar] [CrossRef]
  29. Sanghera, J.S.; Shaw, L.B.; Aggarwal, I.D. Chalcogenide Glass-Fiber-Based Mid-IR Sources and Applications. IEEE J. Sel. Top. Quantum Electron. 2009, 15, 114–119. [Google Scholar] [CrossRef]
  30. Shaw, L.B.; Cole, B.; Thielen, P.A.; Sanghera, J.S.; Aggarwal, I.D. Mid-wave IR and long-wave IR laser potential of rare-earth doped chalcogenide glass fiber. IEEE J. Quantum Electron. 2001, 37, 1127–1137. [Google Scholar] [CrossRef]
  31. Falconi, M.C.; Palma, G.; Starecki, F.; Nazabal, V.; Troles, J.; Adam, J.L.; Taccheo, S.; Ferrari, M.; Prudenzano, F. Dysprosium-Doped Chalcogenide Master Oscillator Power Amplifier (MOPA) for Mid-IR Emission. J. Light. Technol. 2017, 35, 265–273. [Google Scholar] [CrossRef] [Green Version]
  32. Falconi, M.C.; Palma, G.; Starecki, F.; Nazabal, V.; Troles, J.; Taccheo, S.; Ferrari, M.; Prudenzano, F. Design of an Efficient Pumping Scheme for Mid-IR Dy3+:Ga5Ge20Sb10S65 PCF Fiber Laser. IEEE Photonics Technol. Lett. 2016, 28, 1984–1987. [Google Scholar] [CrossRef]
  33. Moizan, V.; Nazabal, V.; Troles, J.; Houizot, P.; Adam, J.-L.; Doualan, J.-L.; Moncorge, R.; Smektala, F.; Gadret, G.; Pitois, S.; et al. Er3+-doped GeGaSbS glasses for mid-IR fibre laser application: Synthesis and rare earth spectroscopy. Opt. Mater. 2008, 31, 39–46. [Google Scholar] [CrossRef]
  34. Pele, A.L.; Braud, A.; Doualan, J.L.; Starecki, F.; Nazabal, V.; Chahal, R.; Boussard-Pledel, C.; Bureau, B.; Moncorge, R.; Camy, P. Dy3+ doped GeGaSbS fluorescent fiber at 4.4 mm for optical gas sensing: Comparison of simulation and experiment. Opt. Mater. 2016, 61, 37–44. [Google Scholar] [CrossRef]
  35. Starecki, F.; Morais, S.; Chahal, R.; Boussard-Pledel, C.; Bureau, B.; Palencia, F.; Lecoutre, C.; Garrabos, Y.; Marre, S.; Nazabal, V. IR emitting Dy3+ doped chalcogenide fibers for in situ CO2 monitoring in high pressure microsystems. Int. J. Greenh. Gas Control 2016, 55, 36–41. [Google Scholar] [CrossRef]
  36. Sujecki, S. An Efficient Algorithm for Steady State Analysis of Fibre Lasers Operating under Cascade Pumping Scheme. Int. J. Electron. Telecommun. 2014, 60, 143–149. [Google Scholar] [CrossRef]
  37. Sujecki, S. Numerical Analysis of Q-Switched Erbium Ion Doped Fluoride Glass Fiber Laser Operation Including Spontaneous Emission. Appl. Sci. 2018, 8, 803. [Google Scholar] [CrossRef]
  38. Sujecki, S.; Sojka, L.; Beres-Pawlik, E.; Tang, Z.; Furniss, D.; Seddon, A.B.; Benson, T.M. Modelling of a simple Dy3+ doped chalcogenide glass fibre laser for mid-infrared light generation. Opt. Quantum Electron. 2010, 42, 69–79. [Google Scholar] [CrossRef]
  39. Falconi, M.C.; Palma, G.; Starecki, F.; Nazabal, V.; Troles, J.; Adam, J.L.; Taccheo, S.; Ferrari, M.; Prudenzano, F. Novel Pumping Schemes of Mid-IR Photonic Crystal Fiber Lasers for Aerospace Applications. In Proceedings of the 2016 18th International Conference on Transparent Optical Networks, Trento, Italy, 10–14 July 2016. [Google Scholar]
  40. Peterka, P.; Koška, P.; Čtyroký, J. Reflectivity of superimposed Bragg gratings induced by longitudinal mode instabilities in fiber lasers. IEEE J. Sel. Top. Quantum Electron. 2018, 24, 1–8. [Google Scholar] [CrossRef]
  41. Falconi, M.C.; Palma, G.; Starecki, F.; Nazabal, V.; Troles, J.; Adam, J.L.; Taccheo, S.; Ferrari, M.; Prudenzano, F. Recent Advances on Pumping Schemes for Mid-IR PCF Lasers. In Optical Components and Materials XIV; Jiang, S., Digonnet, M.J.F., Eds.; SPIE: Bellingham, WA, USA, 2017; Volume 10100. [Google Scholar]
  42. Khamis, M.A.; Sevilla, R.; Ennser, K. Large Mode Area Pr3+-Doped Chalcogenide PCF Design for High Efficiency Mid-IR Laser. IEEE Photonics Technol. Lett. 2018, 30, 825–828. [Google Scholar] [CrossRef]
  43. Hu, J.; Menyuk, C.R.; Wei, C.L.; Shaw, L.B.; Sanghera, J.S.; Aggarwal, I.D. Highly efficient cascaded amplification using Pr3+-doped mid-infrared chalcogenide fiber amplifiers. Opt. Lett. 2015, 40, 3687–3690. [Google Scholar] [CrossRef] [PubMed]
  44. Anashkina, E.A. Design and Numerical Modeling of Broadband Mid-IR Rare-Earth-Doped Chalcogenide Fiber Amplifiers. IEEE Photonics Technol. Lett. 2018, 30, 1190–1193. [Google Scholar] [CrossRef]
  45. Falconi, M.C.; Bozzetti, M.; Fernandez, T.; Galzerano, G.; Prudenzano, F. Design of an Efficient Pulsed Dy3+: ZBLAN Fiber Laser Operating in Gain Switching Regime. J. Light. Technol. 2018, 36, 5327–5331. [Google Scholar] [CrossRef]
Figure 1. Schematic diagram of the fiber laser cavity.
Photonics 05 00048 g001
Figure 2. Energy level diagram of trivalent dysprosium ions.
Photonics 05 00048 g002
Figure 3. Energy level diagram of trivalent erbium ions.
Photonics 05 00048 g003
Figure 4. Dependence of the residual calculated using the Institute of Photonics and Electronics of the Czech Academy of Sciences (UFE) model at z = 0, and the central processing unit (CPU) time of the iteration number at a pump power of: (a) 5 W, (b) 1 W, (c) 0.4 W, and (d) 0.2 W.
Photonics 05 00048 g004
Figure 5. Dependence of the residual calculated using the Politecnico di Bari (PB) model at z = 0, and CPU time of the iteration number at a pump power of (a) 5 W, (b) 1 W, (c) 0.4 W, and (d) 0.2 W.
Photonics 05 00048 g005
Figure 6. Dependence of the residual, calculated using the University of Nottingham and Wroclaw University of Science and Technology (NU–PWr) model at z = 0, and CPU time on the iteration number at a pump power of (a) 5 W, (b) 1 W, (c) 0.4 W, and (d) 0.2 W.
Photonics 05 00048 g006
Table 1. Numerical modeling parameters used in simulations, Dy3+-doped chalcogenide glass fiber laser.
QuantityUnitValue
Dy3+ ion concentration NDycm−37 × 1019
Aeffm295 × 10−12
Fiber length Lm2.1
Fiber loss at all wavelengths αdB/m1
Lifetime of level 2 (Figure 2)ms2
Lifetime of level 1 (Figure 2)ms5.2
Branching ratio for 2-1 transitions 0.15
Reflectivity for idler, signal, and pump at z = 0 0.2
Reflectivity for idler, signal, and pump at z = L 0.2
Confinement factor for signal 0.8
Confinement factor for idler 0.9
Confinement factor for pump 0.034
Pump wavelengthμm1.71
Signal wavelength (λ1)μm4.6
Idler wavelength (λ2)μm3.35
Pump emission cross sectionm20.318 × 10−24
Pump absorption cross sectionm20.501 × 10−24
Signal emission cross sectionm20.912 × 10−24
Signal absorption cross sectionm20.485 × 10−24
Idler emission cross sectionm20.097 × 10−24
Idler absorption cross sectionm20.016 × 10−24
Table 2. Numerical modeling parameters used in simulations, Er3+-doped fluoride fiber laser.
QuantityUnitValue
b1/b2 0.1/0.16
W11m3/s1 × 10−24
W22m3/s0.3 × 10−24
σGSAm22.1 × 10−25
σSEm24.5 × 10−25
σESAm21.1 × 10−25
Γp 0.009
Γs 1.0
Er3+ ion concentration NErm−39.6 × 1026
Pump wavelength λpNm976
Pump wavelength λsNm2800
Fiber length Lm2.5
Aeffm2314 × 10−12
αp1/m3 × 10−3
αs1/m23 × 10−3
Rp (z = 0) 0
Rp (z = L) 0.04
Rs (z = 0) 0.96
Rs (z = L) 0.04
Table 3. Branching ratios and level lifetimes for erbium trivalent ions doped into a fluoride glass.
QuantityUnitValue
τ1ms9
τ2ms6.9
τ3ms0.12
τ4ms0.57
β21, β20 0.37, 0.63
β32, β31, β30 0.856, 0.004, 0.14
β43, β42, β41, β40 0.34, 0.04, 0.18, 0.44
Table 4. Calculated values of signal output power values for the Dy3+-doped chalcogenide–selenide glass fiber laser.
Pump Power/WSignal Power (NU–PWr)/WSignal Power (UFE)/WRelative Difference
0.24.733 × 10−34.731 × 10−30.422 × 10−3
0.48.744 × 10−38.736 × 10−30.915 × 10−3
149.13 × 10−349.04 × 10−31.833 × 10−3
5319.1 × 10−3318.6 × 10−31.568 × 10⁻³
Table 5. Calculated values of the idler output power values for the Dy3+-doped chalcogenide–selenide glass fiber laser.
Pump Power/WIdler Power (NU–PWr)/WIdler Power (UFE)/WRelative Difference
0.2 W0 W4.140 × 10−6NA
0.4 W0 W9.591 × 10−4NA
1 W55.38 × 10−3 W55.26 × 10−32.169 × 10⁻³
5 W426.0 × 10−3 W425.4 × 10−31.409 × 10⁻³
Table 6. Calculated values of signal output power values for the Er3+ ion-doped fluoride glass fiber laser.
Pump PowerSignal Power (NU–PWr)/WSignal Power (UFE)/WRelative Difference
5 W1.4321.4320
10 W3.1713.1710
15 W4.8684.8680
20 W6.4586.4580

