
Fabrication and Characterization of Tedizolid Phosphate Nanocrystals for Topical Ocular Application: Improved Solubilization and In Vitro Drug Release

 , ,
, ,  ,
, 
Abstract
:1. Introduction
2. Materials and Methods
2.1. Materials
2.2. Methods
2.2.1. Chromatographic Analysis of TZP
2.2.2. Preparation of Nanocrystals
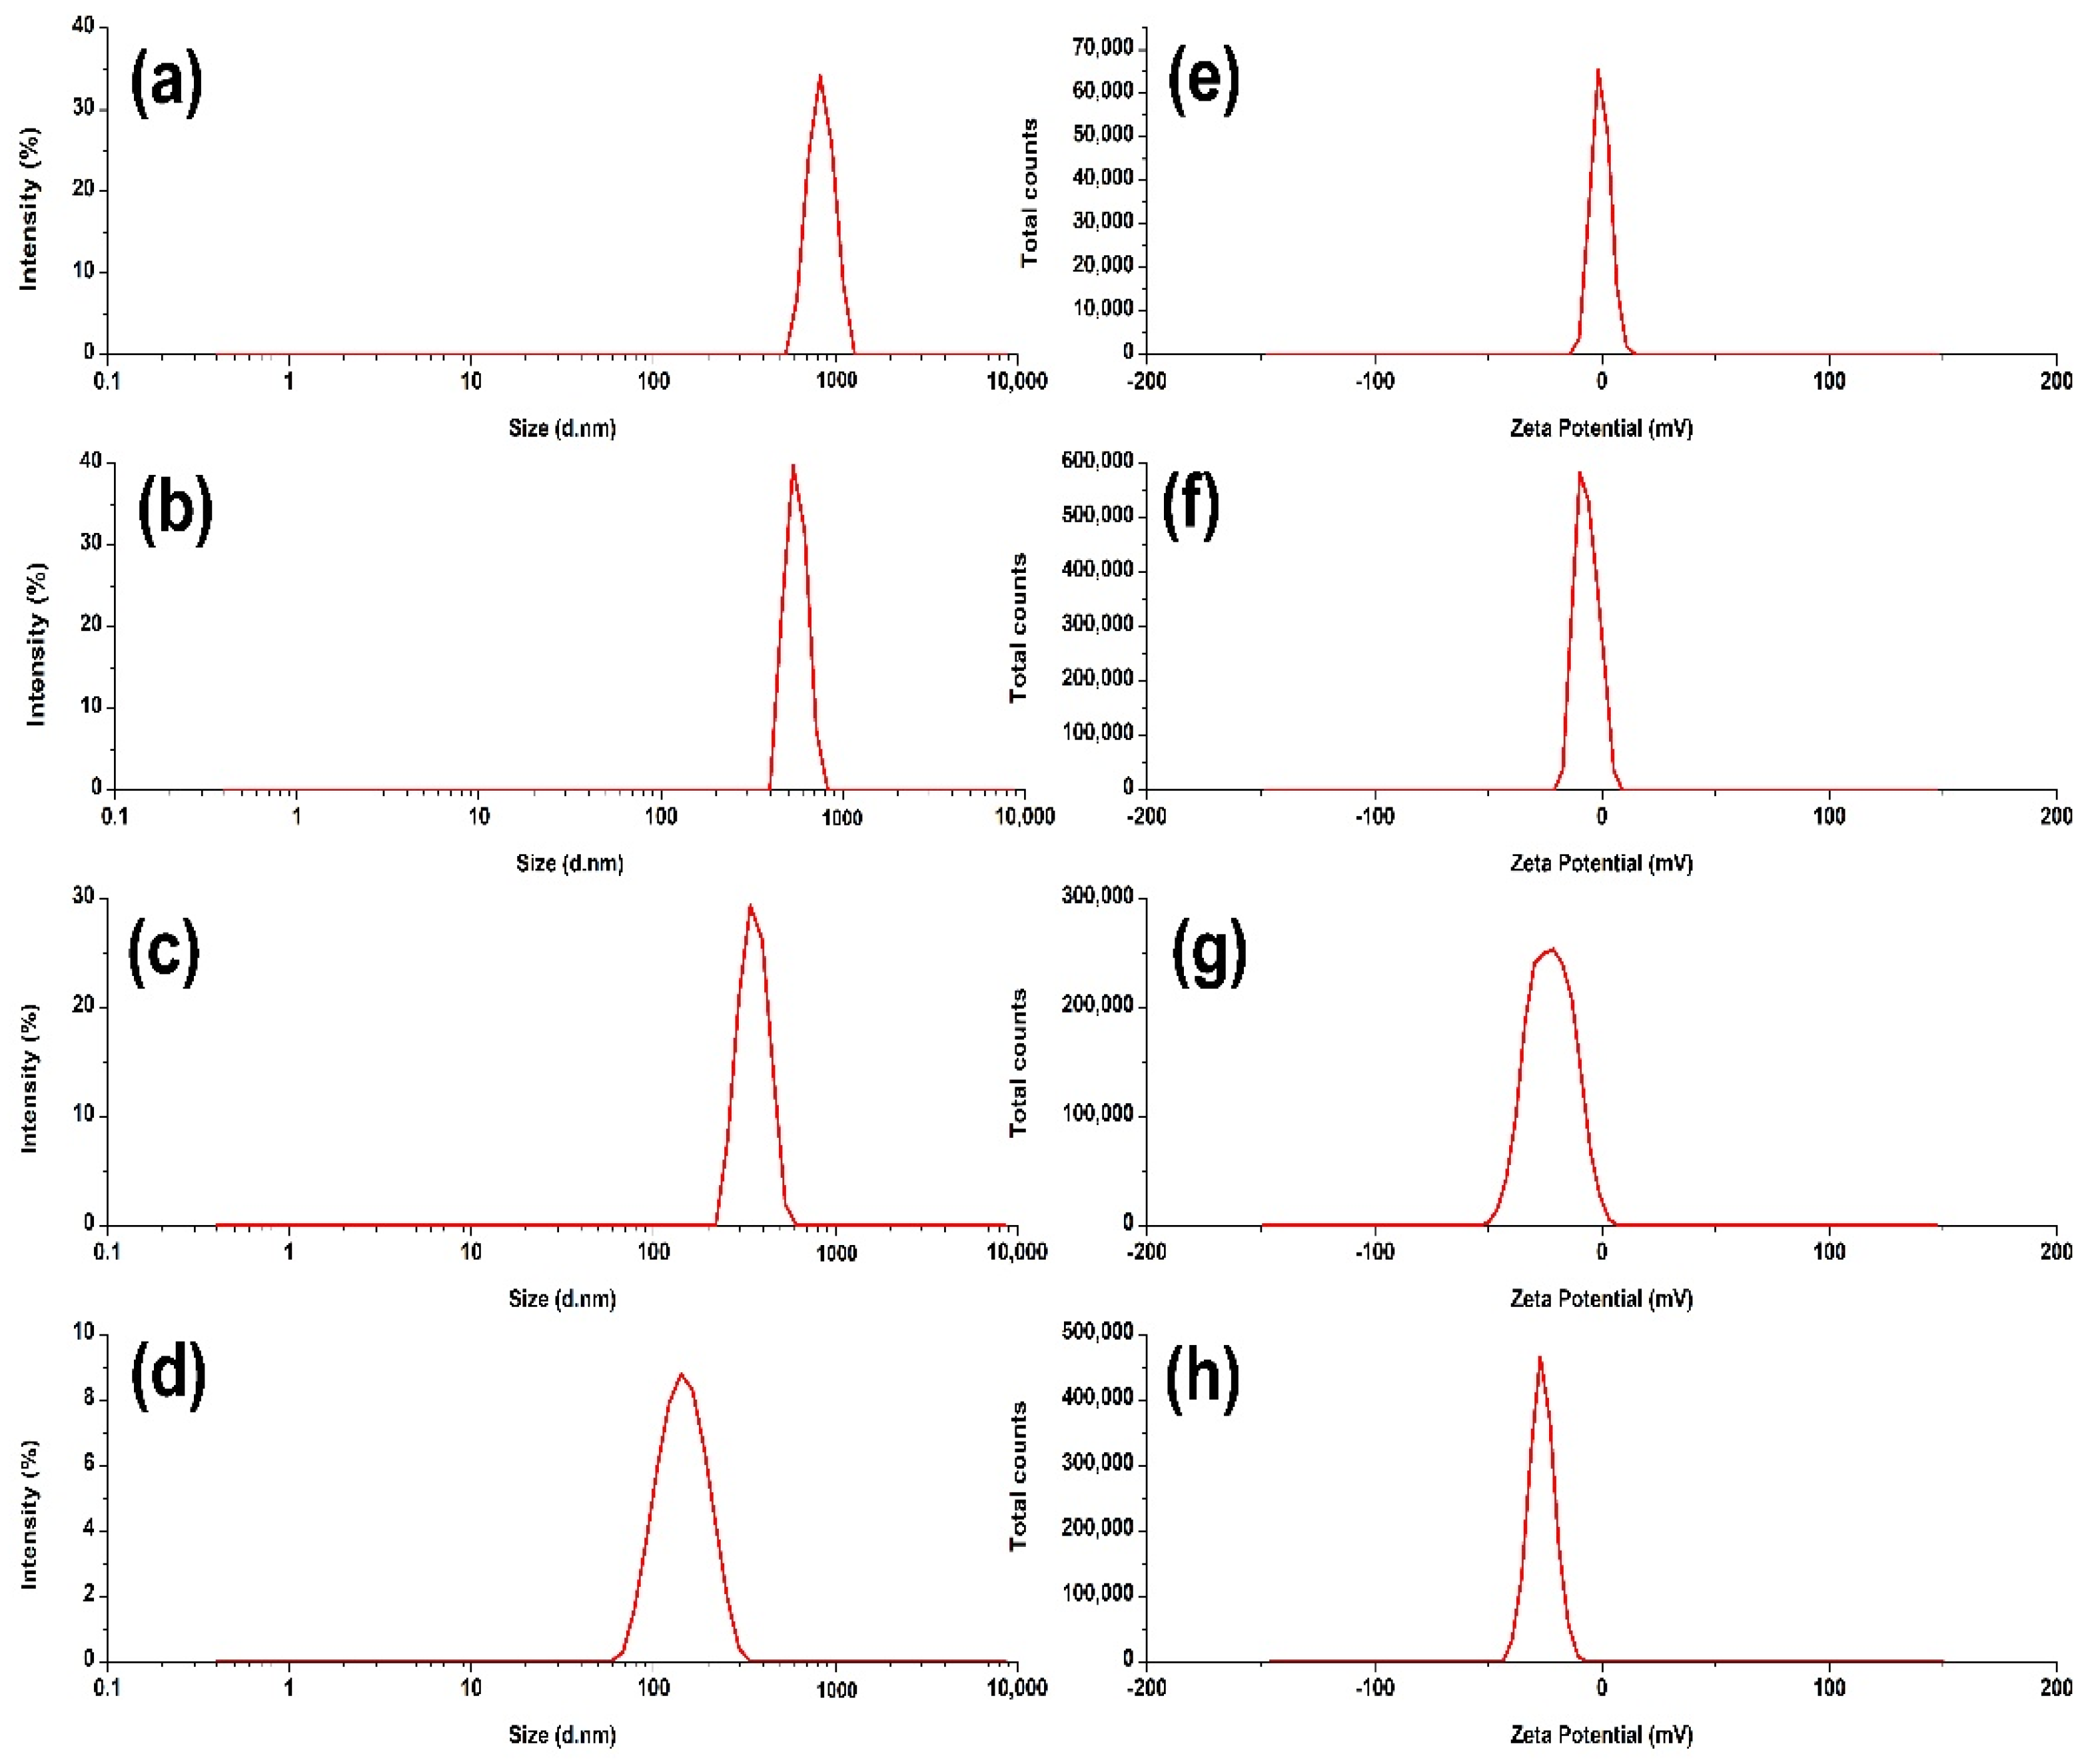
2.2.3. Measurement of Average Size, Polydispersity-Index and Zeta-Potential
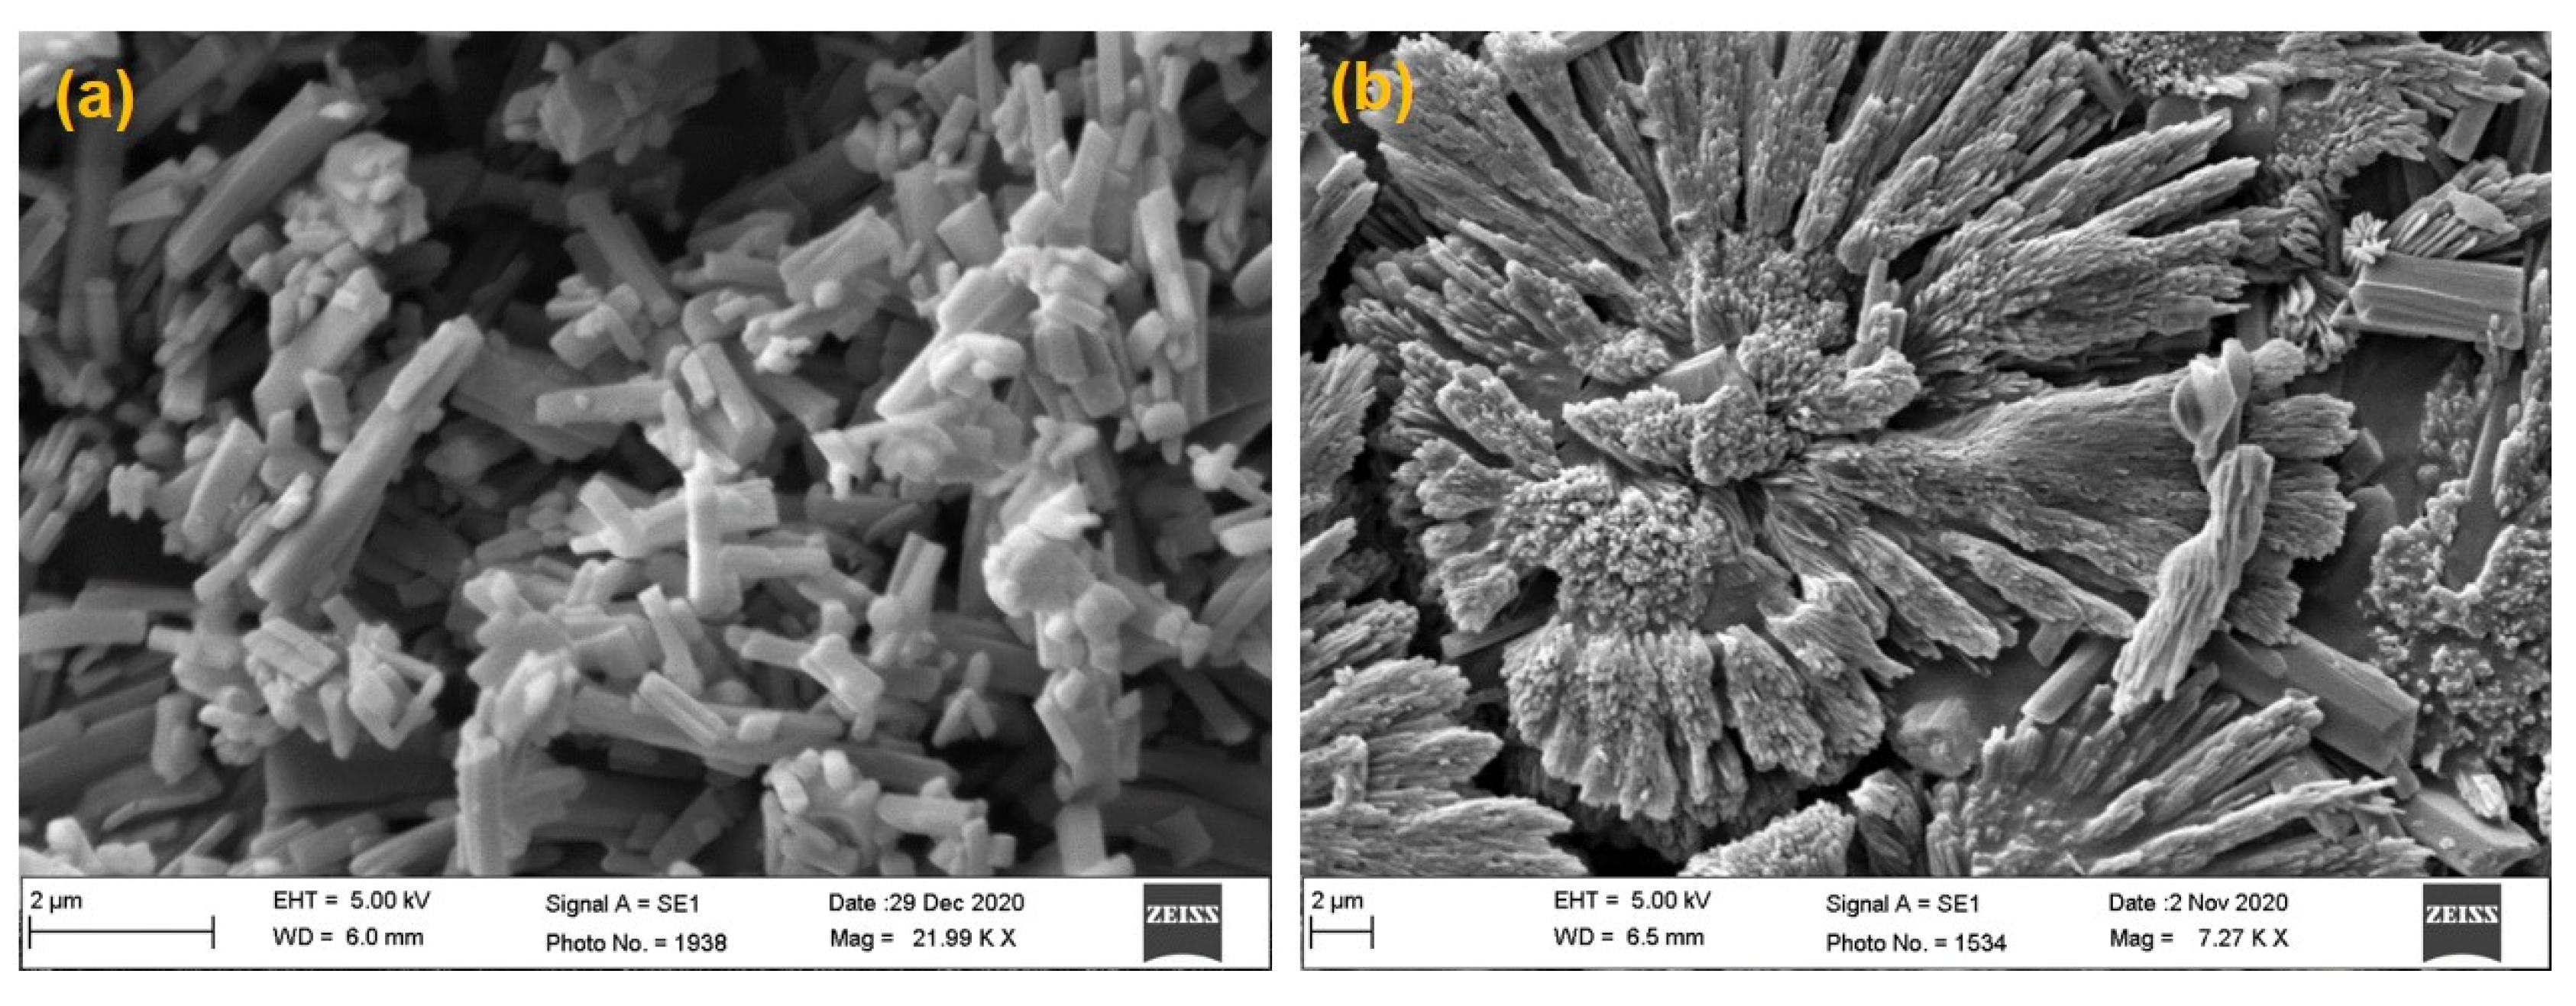
2.2.4. Scanning Electron Microscopy (SEM)
2.3. Differential Scanning Calorimetry (DSC)
2.4. Fourier Transform Infrared Spectroscopy (FTIR)
2.5. Powdered X-ray Diffraction (PXRD)
2.6. Physicochemical Characterization of Suspension of NCs
2.7. Solubility of Tedizolid Phosphate (TZP)
2.8. In Vitro Release Study
2.9. Stability Study
2.10. Statistical Analysis
3. Results and Discussion
3.1. Formulation Development and Characterization
3.2. Size, Polydispersity-Index (PDI) and Zeta Potential (ZP)
3.3. Effect of Homogenization and Probe Sonication Time Duration on Size and PDI
3.4. Effect of Mannitol Concentrations on Size, ZP and PDI
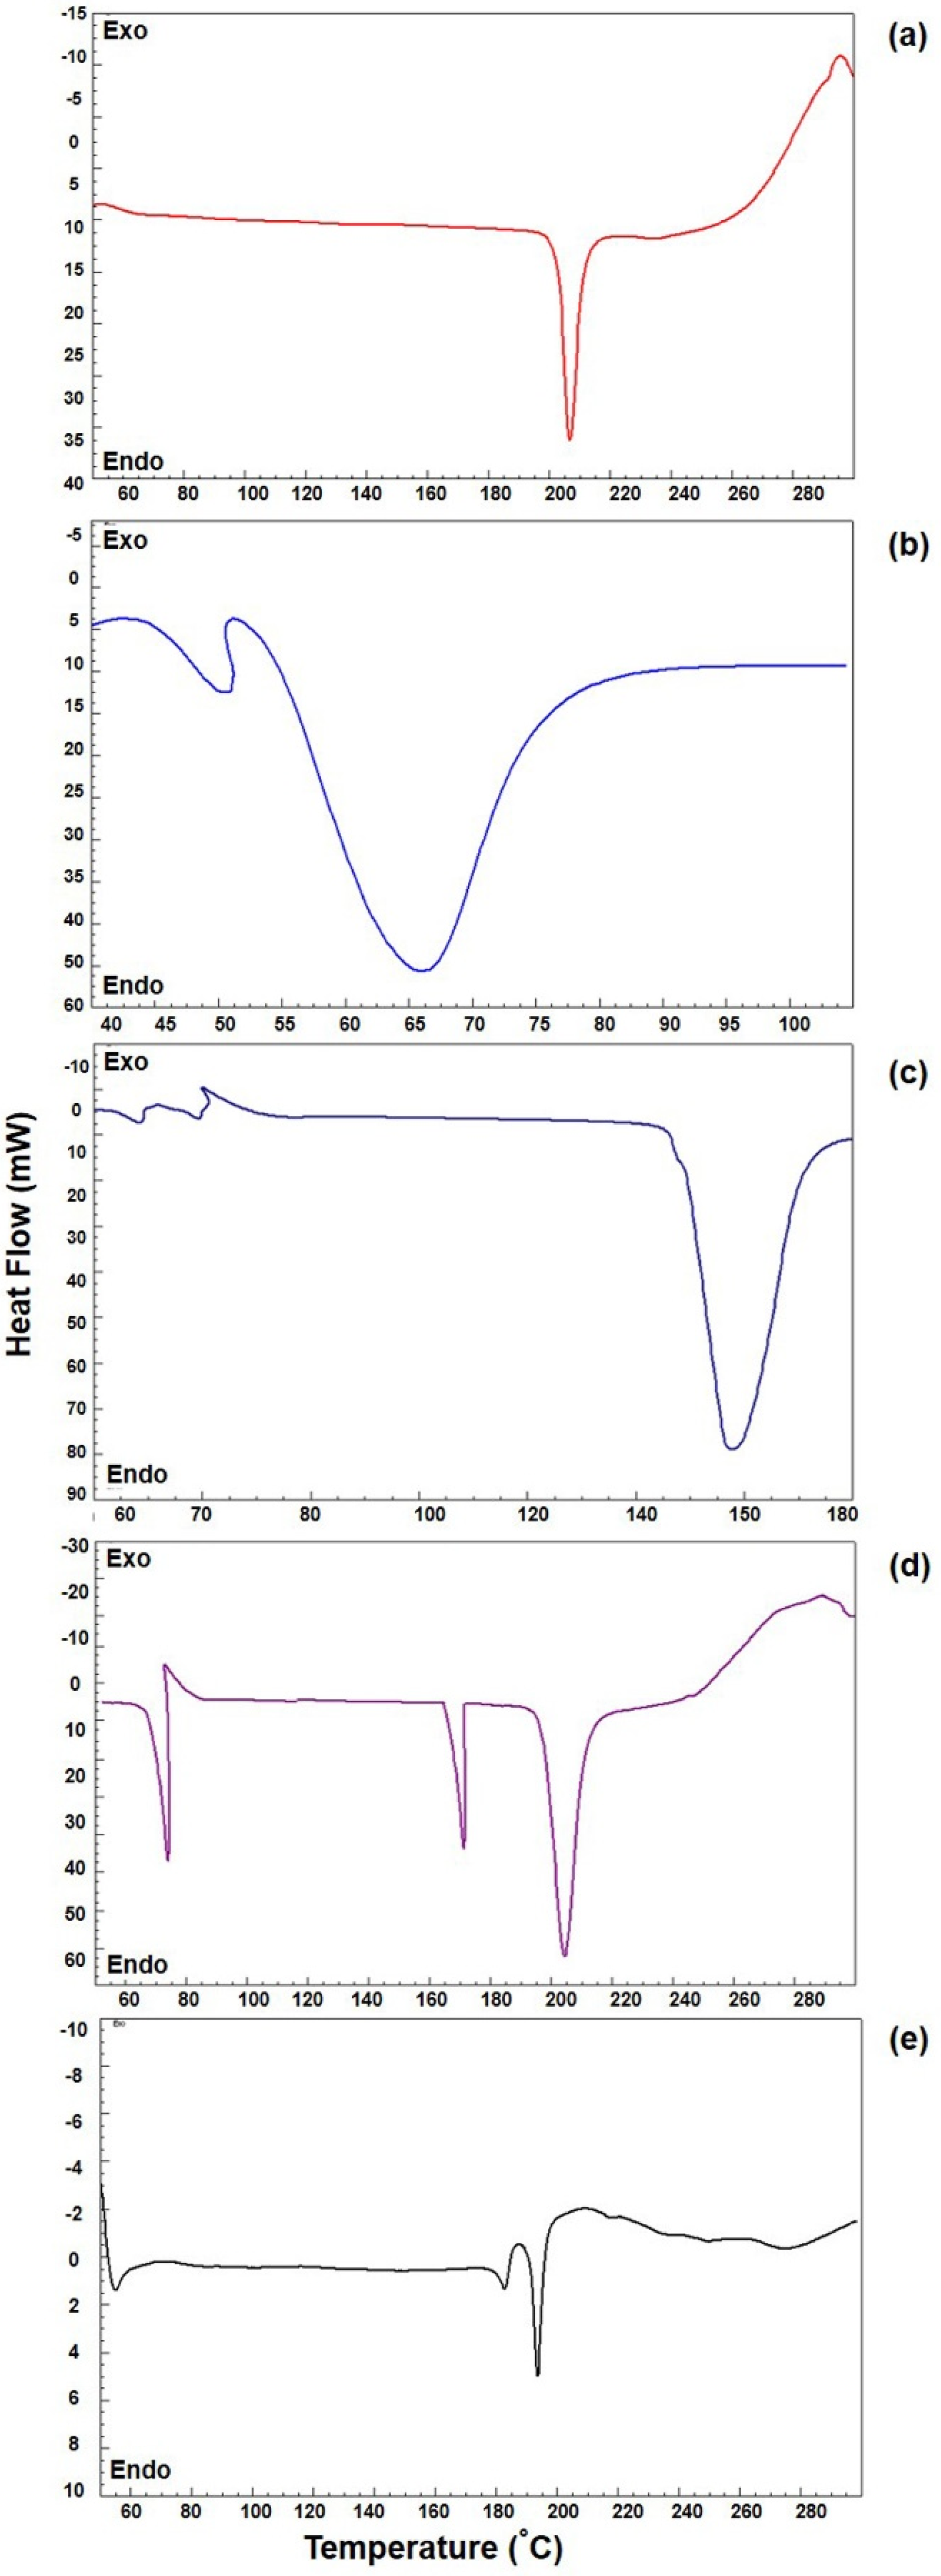
3.5. DSC Analysis
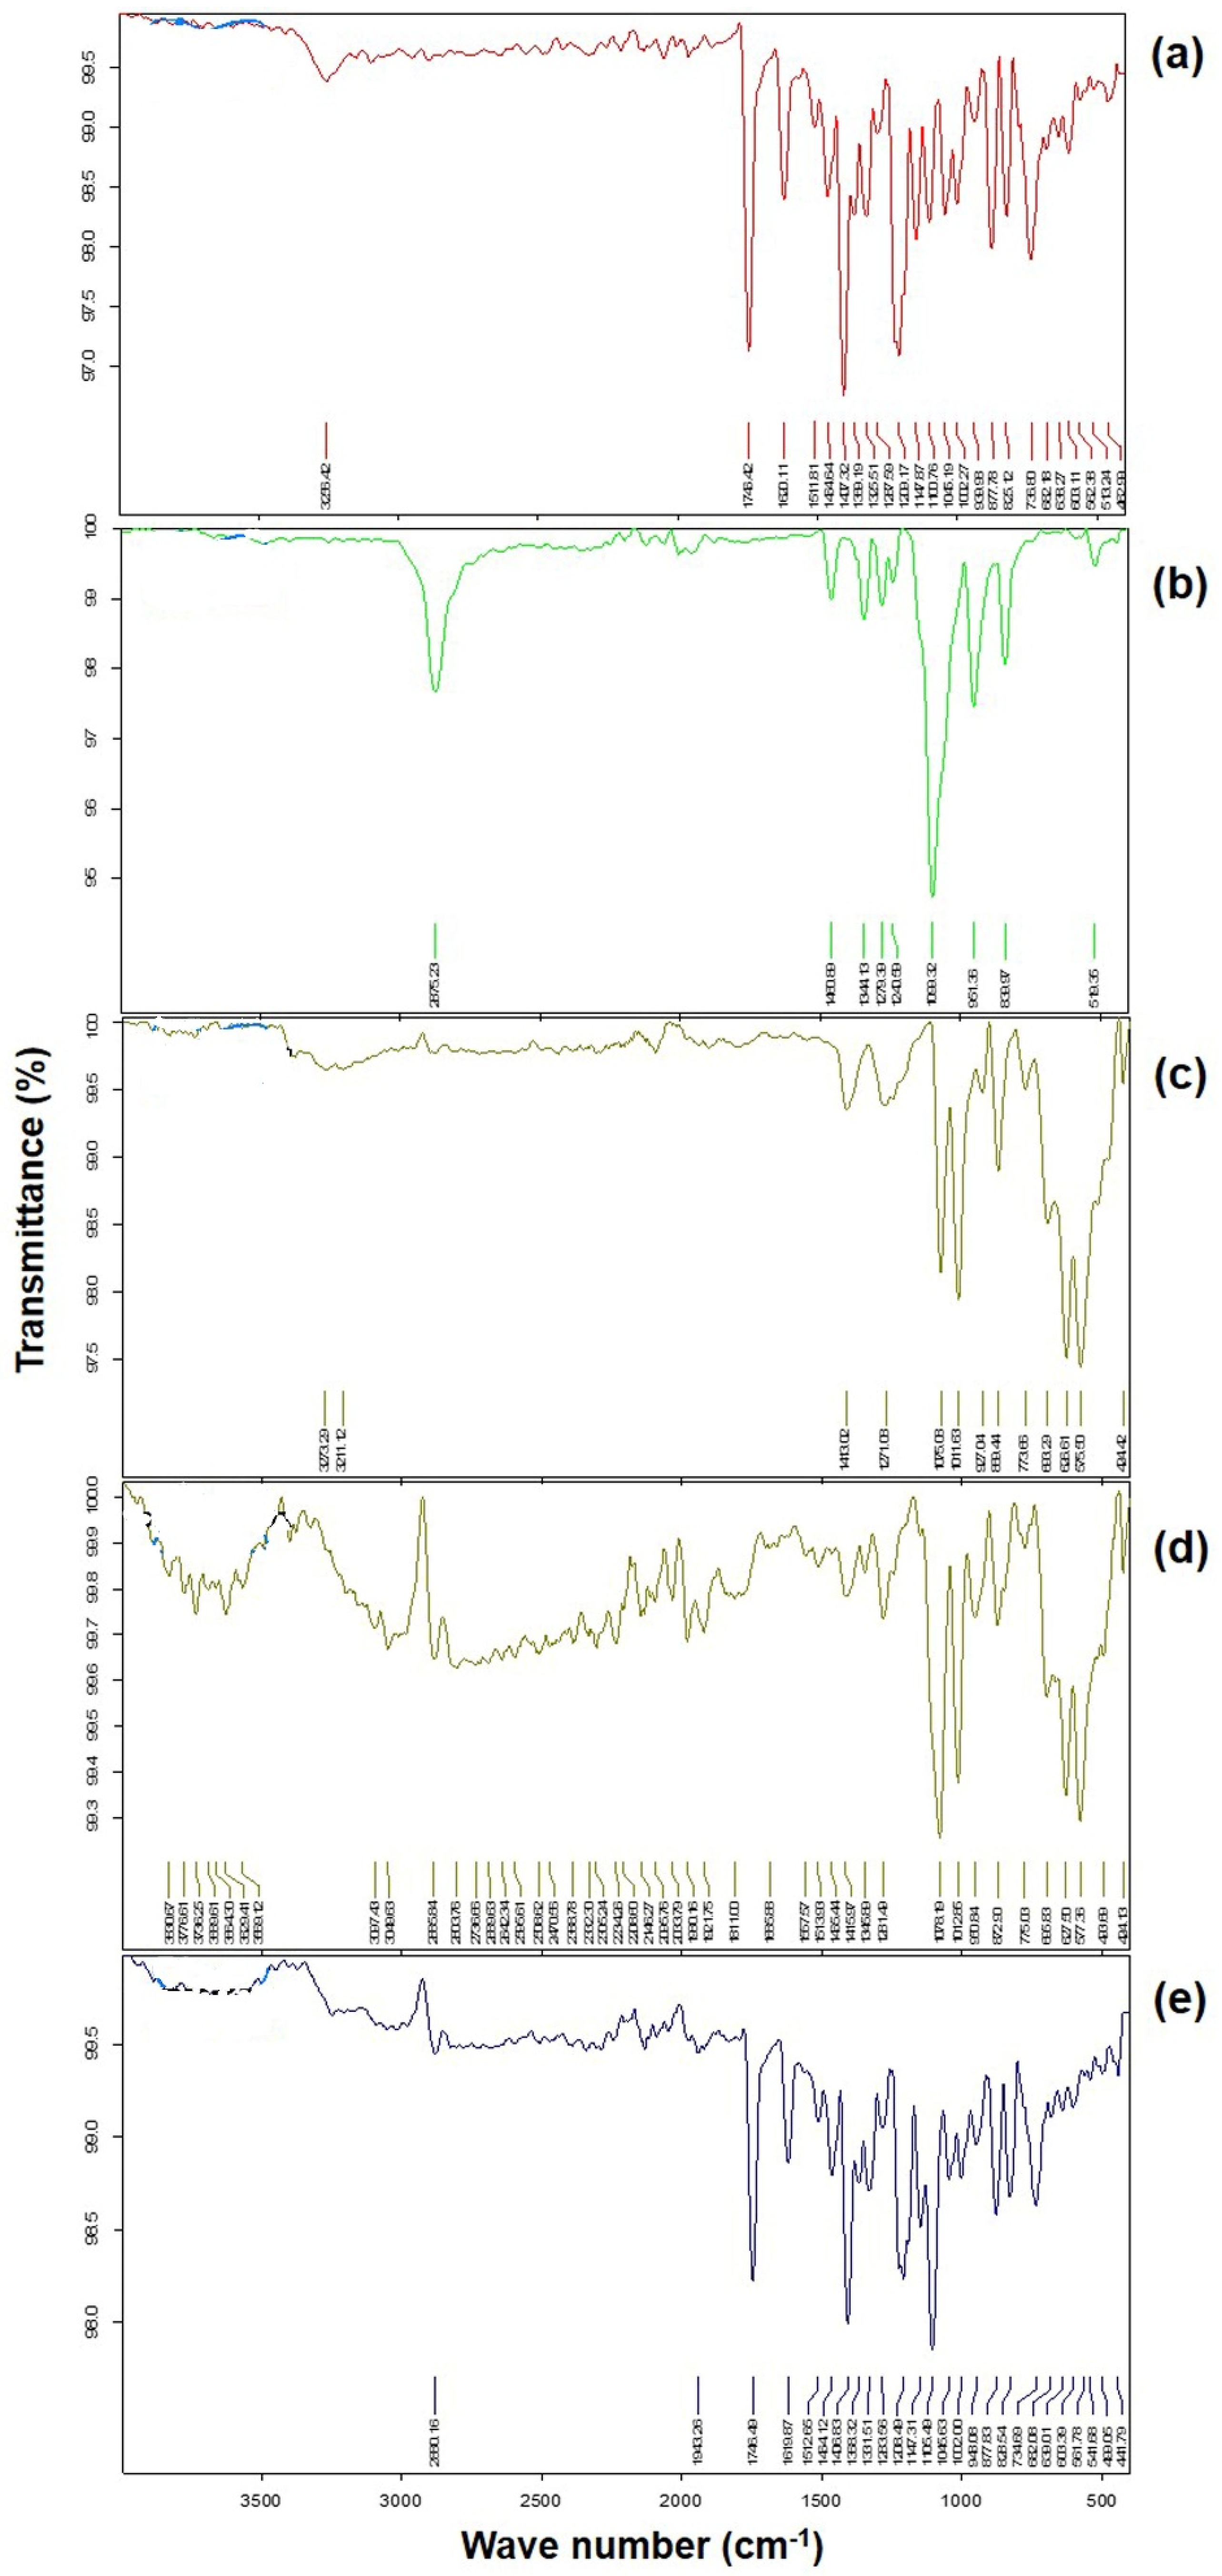
3.6. FTIR Analysis
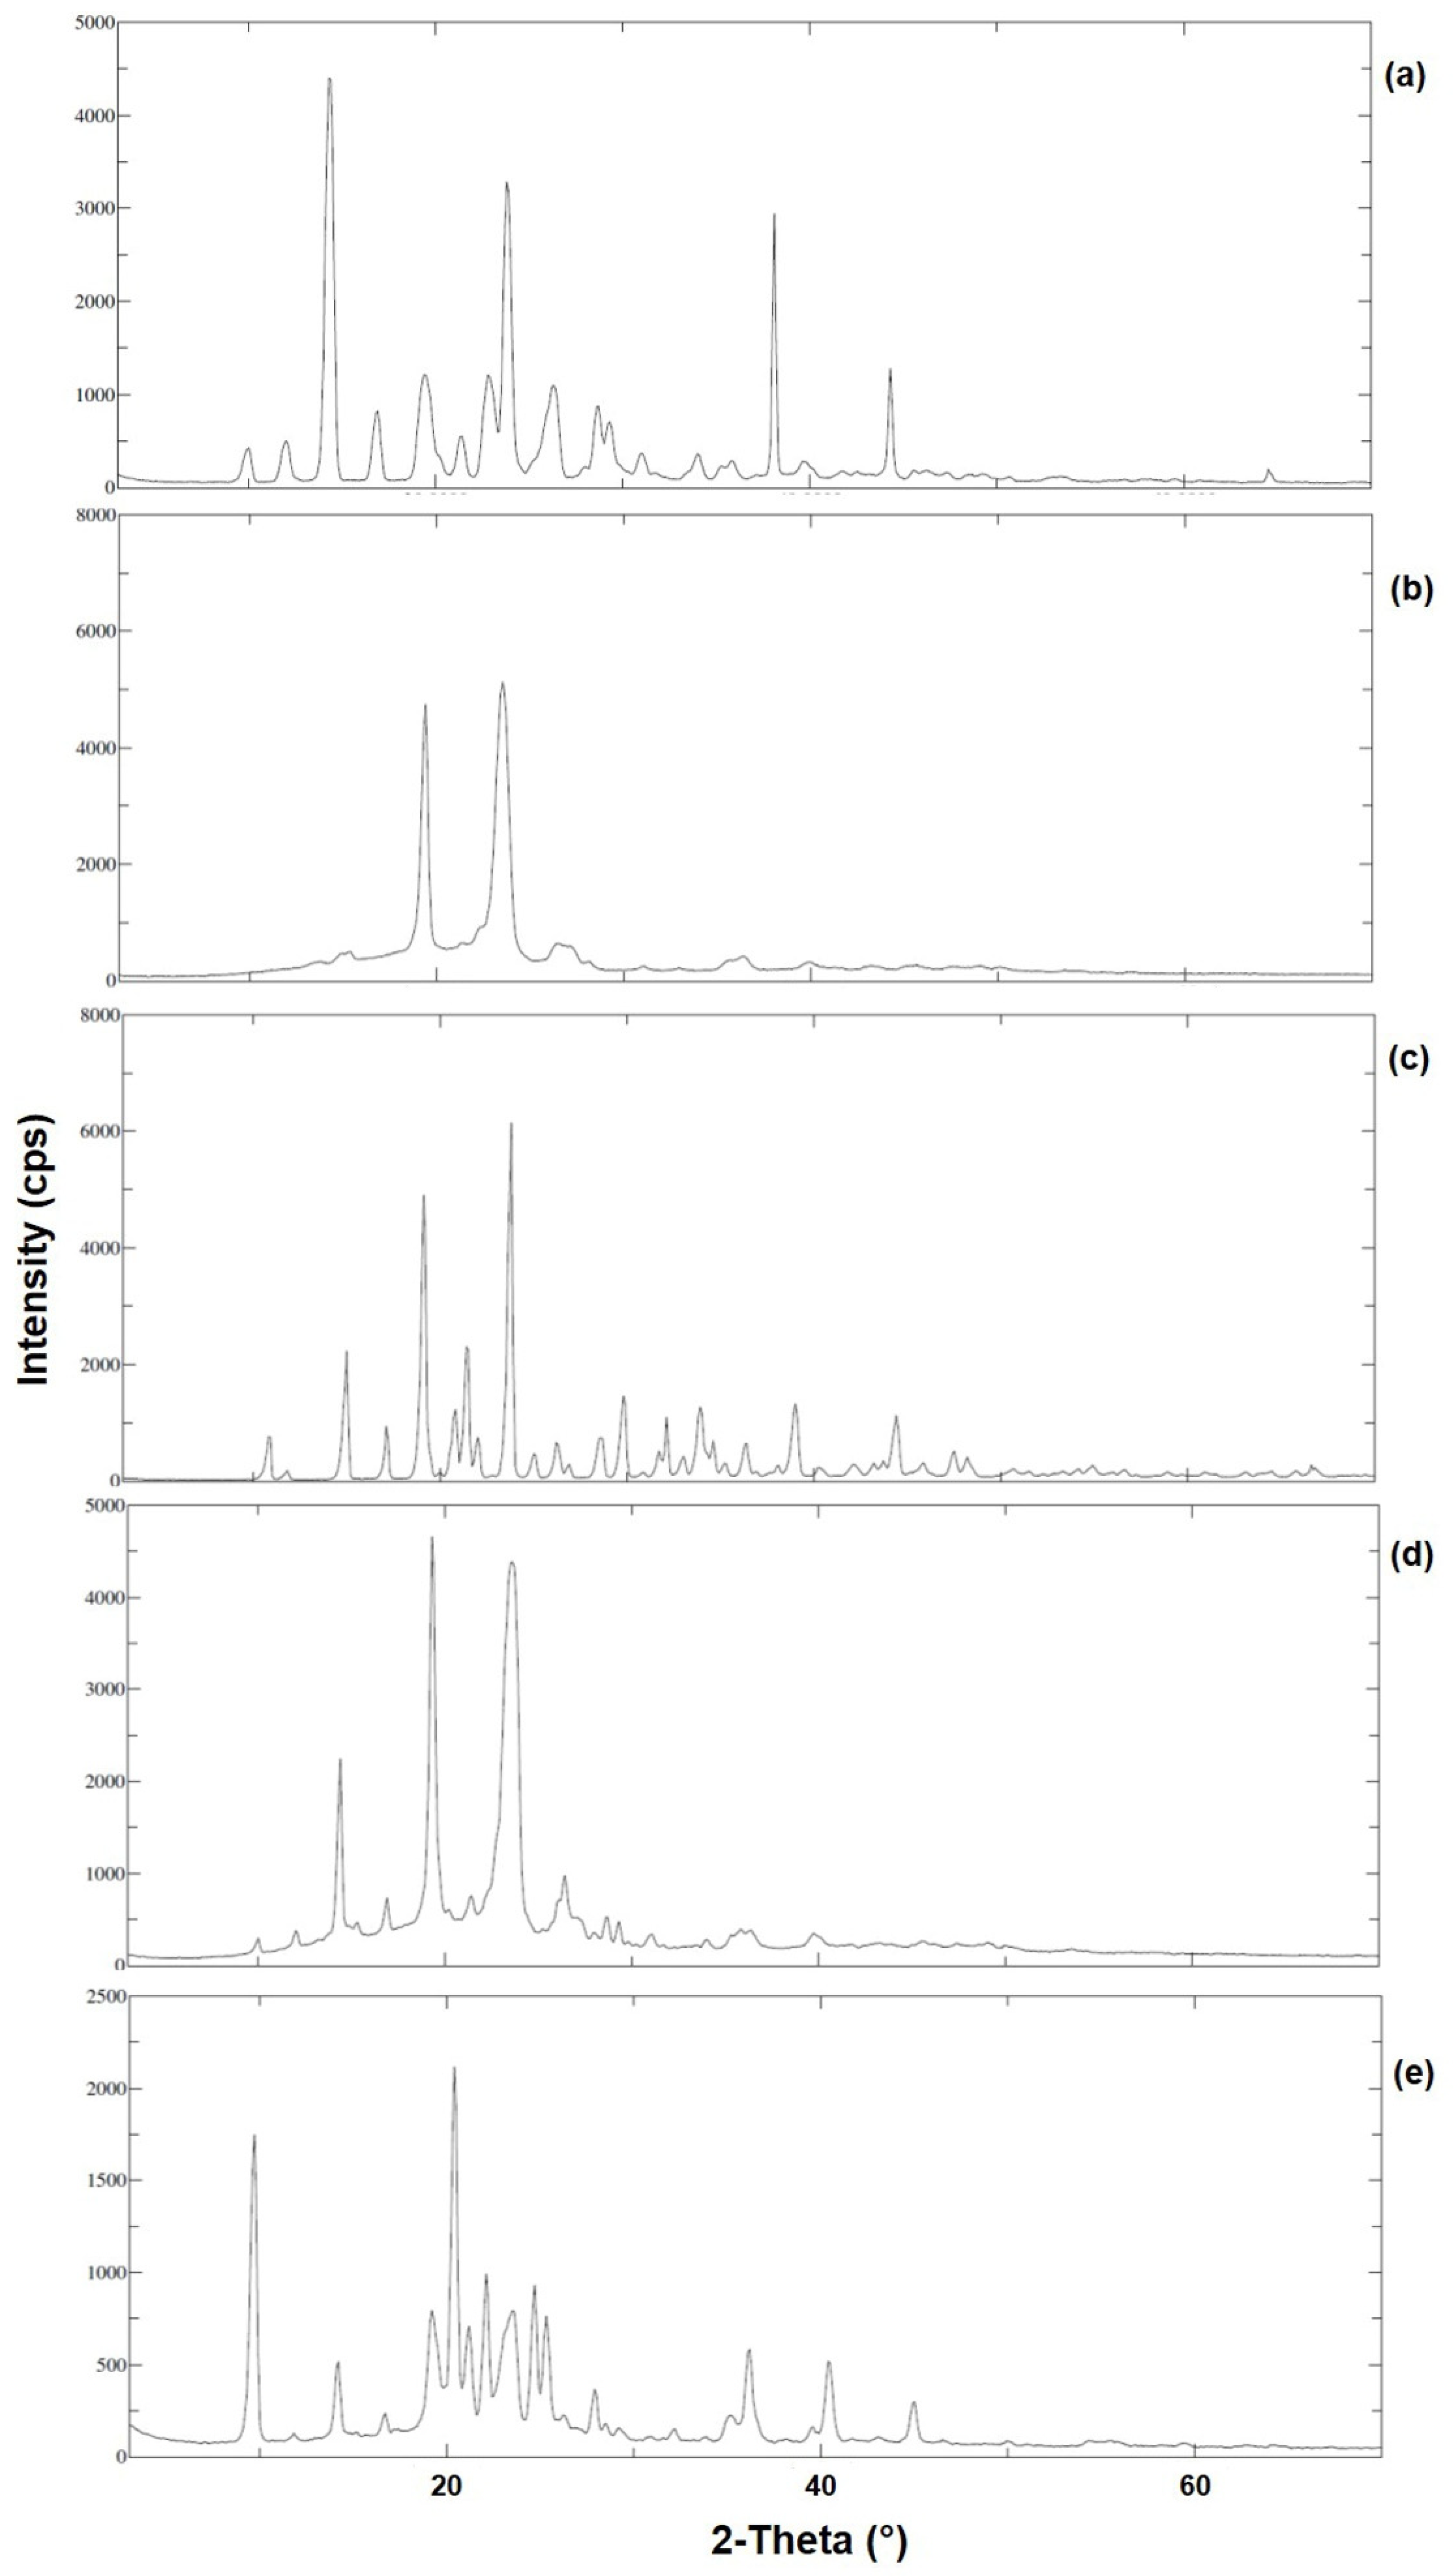
3.7. XRD Analysis
3.8. Physicochemical Characterization
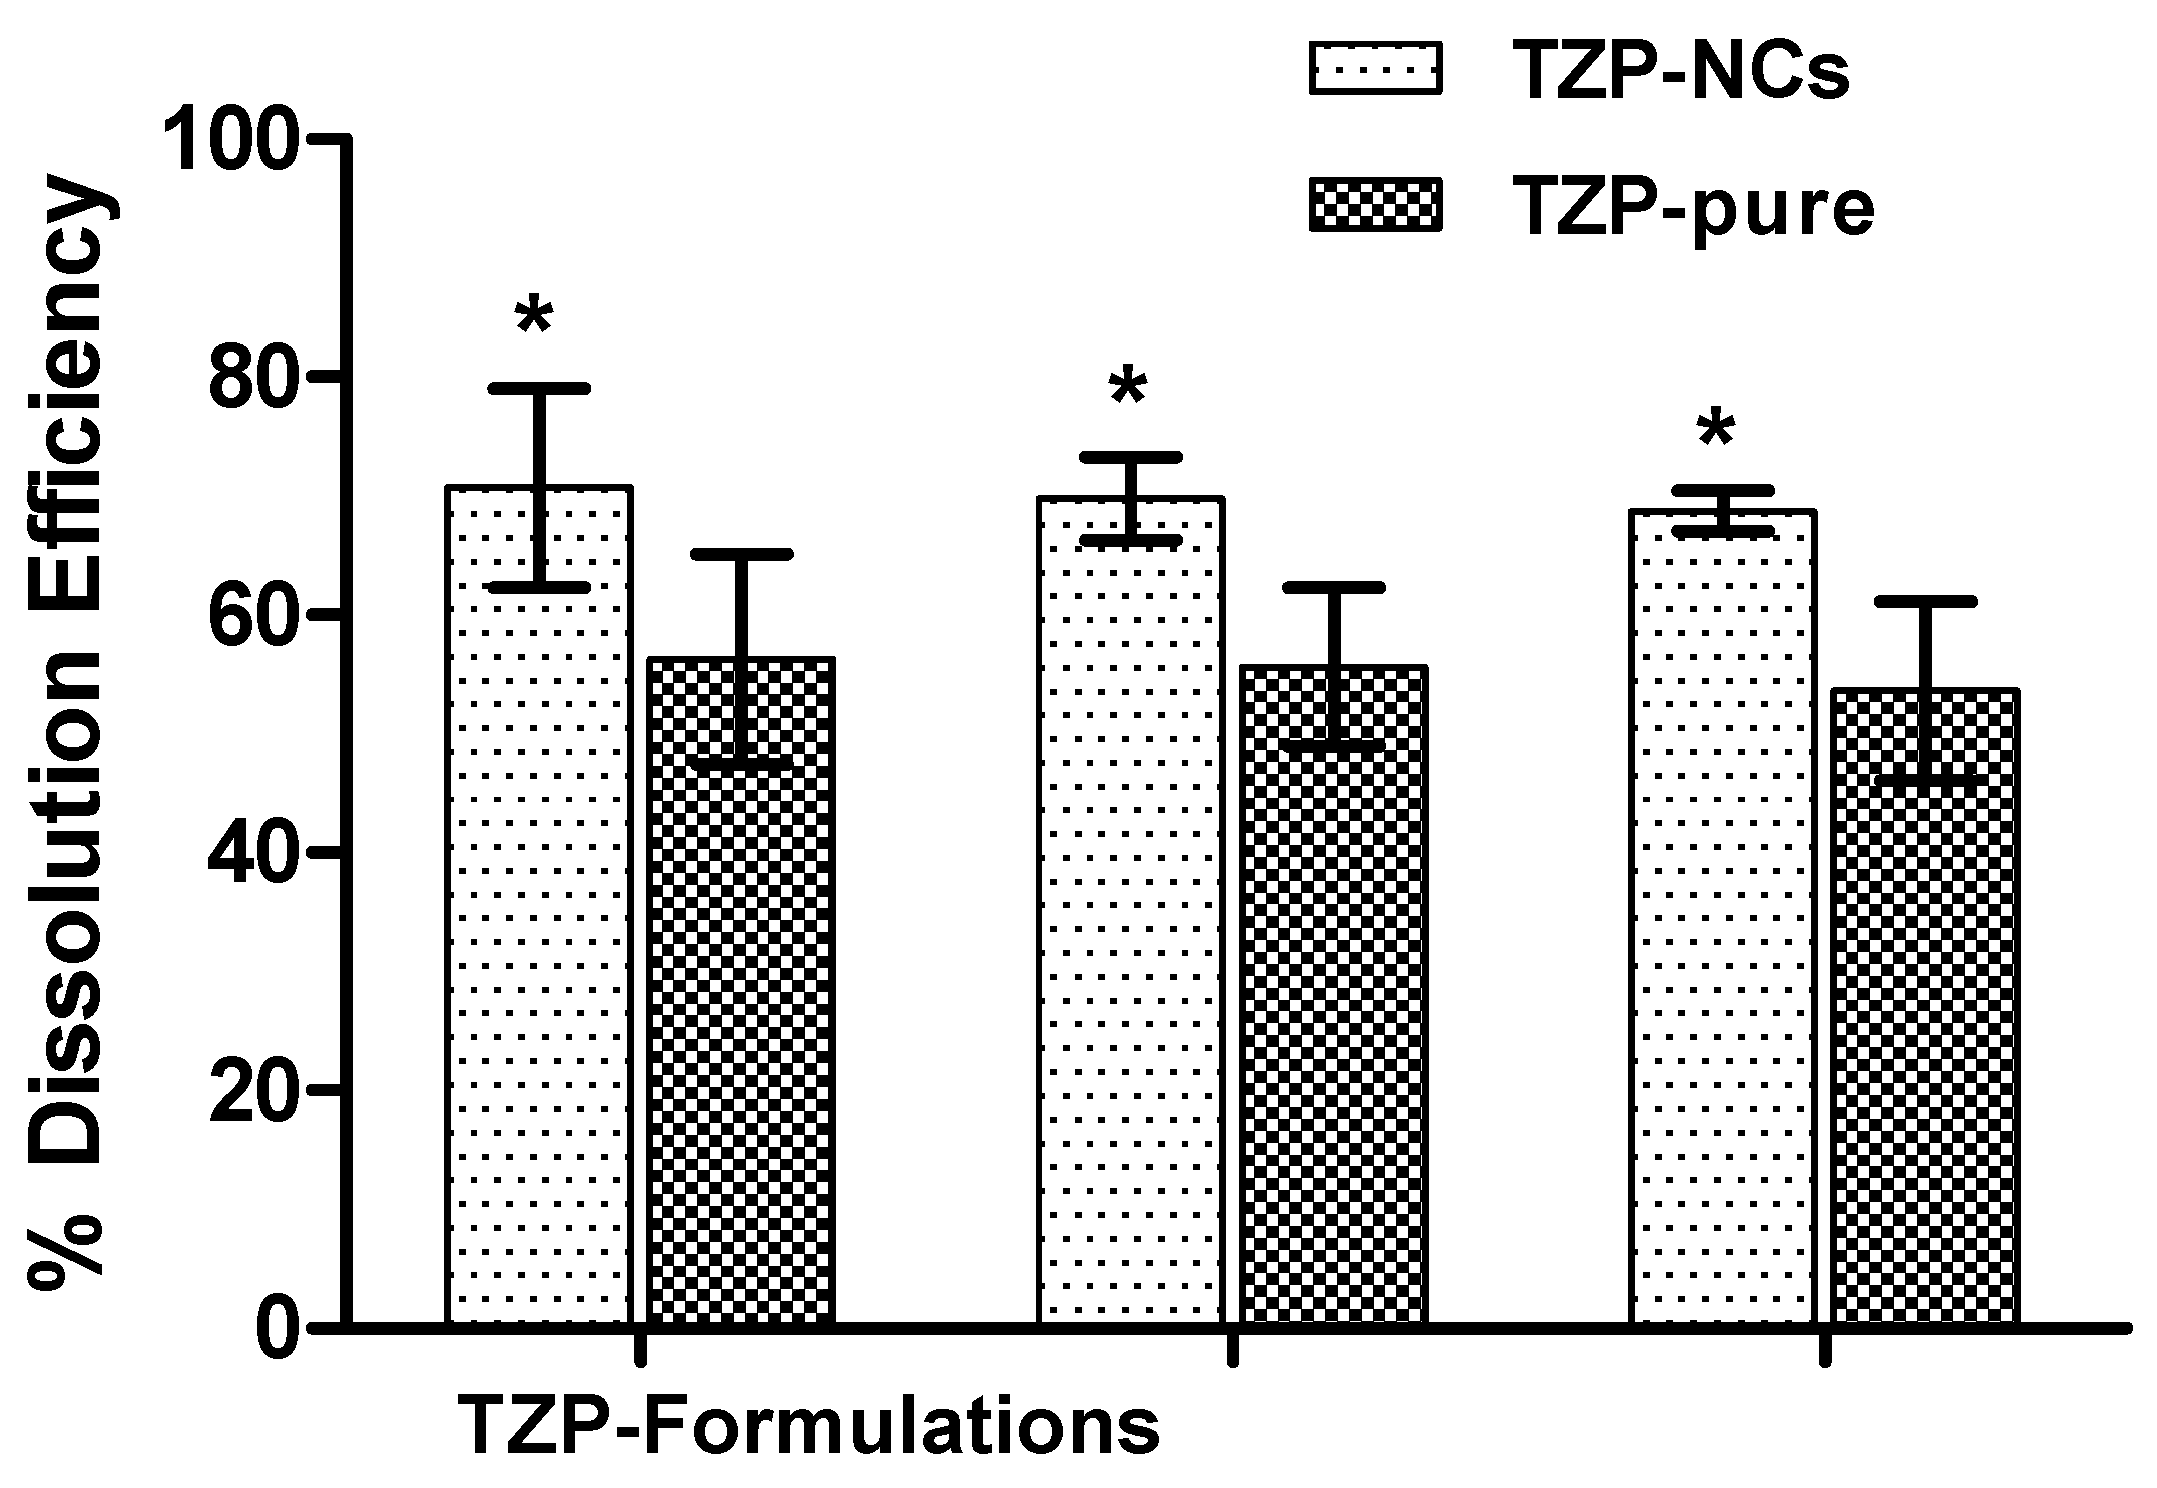
3.9. Solubility Determination
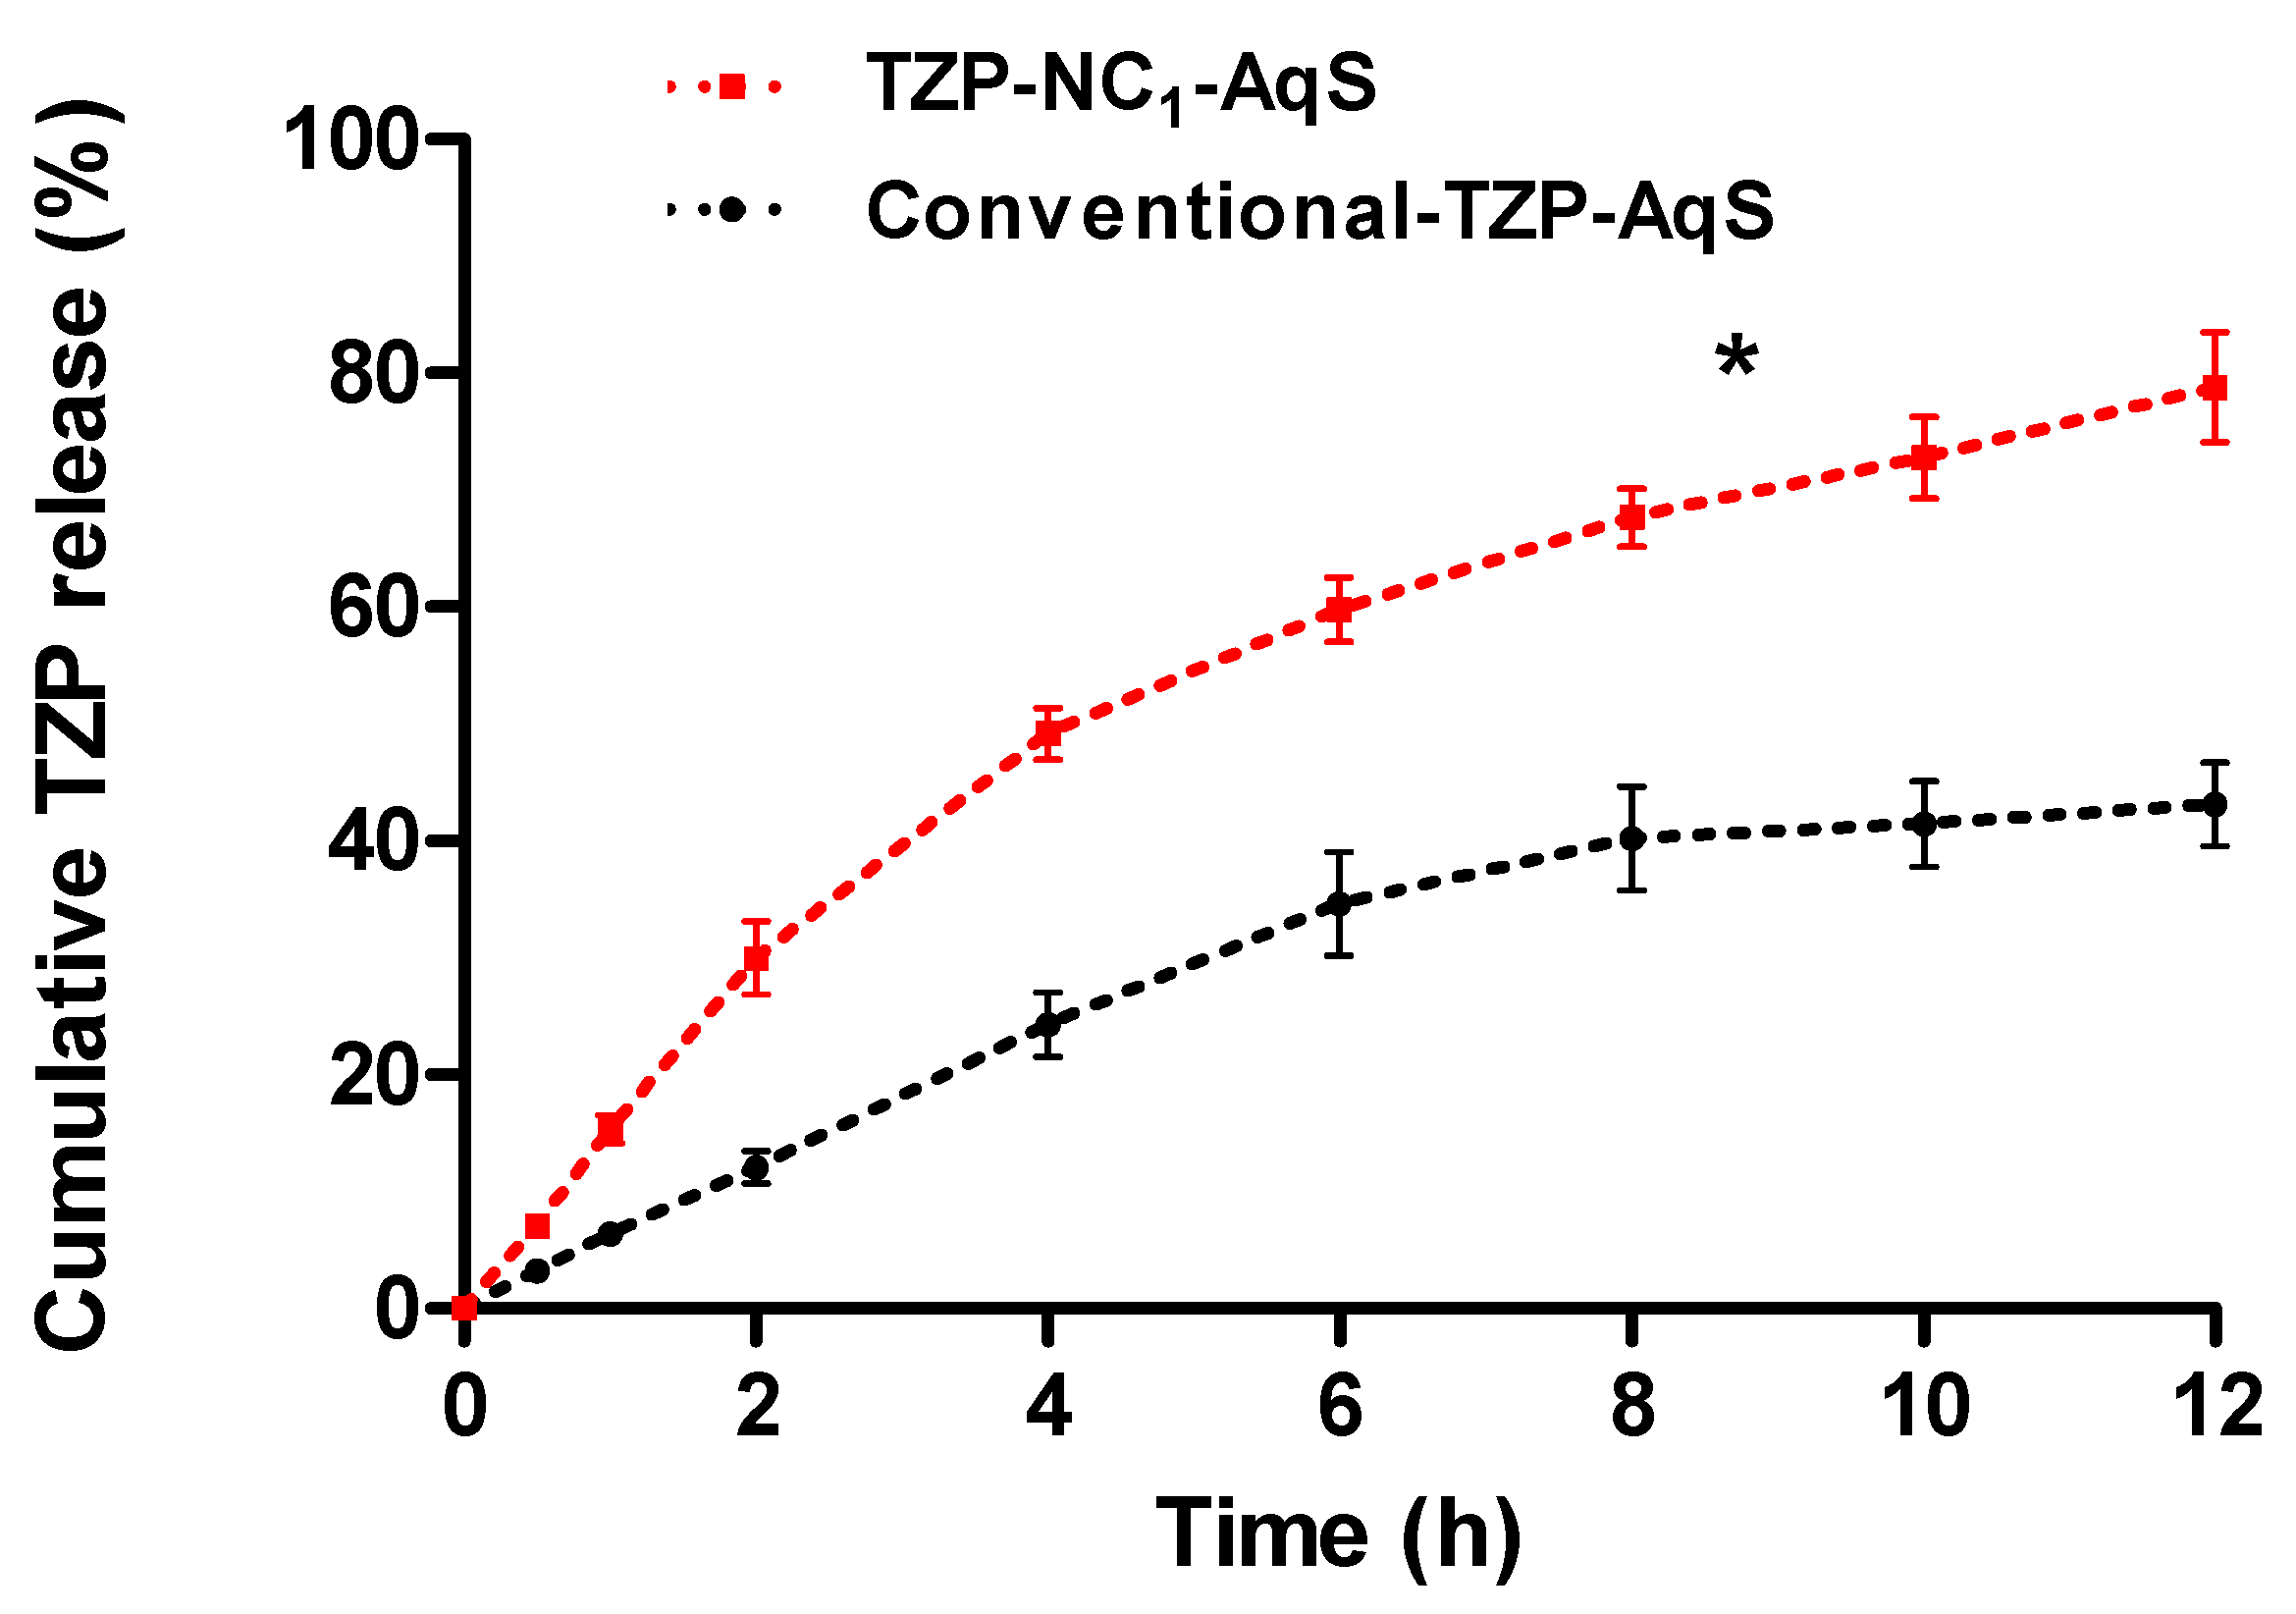
3.10. In Vitro Release Study
3.11. Stability Studies
4. Conclusions
Supplementary Materials
Author Contributions
Funding
Institutional Review Board Statement
Informed Consent Statement
Data Availability Statement
Acknowledgments
Conflicts of Interest
Abbreviations
| BCS | Biopharmaceutics Classification Systems |
| PVA | Polyvinyl alcohol |
| TZP | Tedizolid phosphate |
| TDZ | Tedizolid |
| NCs | Nanocrystals |
| DMSO | Dimethyl Sulfoxide |
| GRAS | Generally Regarded As Safe |
| P188 | Poloxamer-188 |
| HLB | Hydrophilic Lipophilic Balance |
| ZP | Zeta Potential |
| PDI | Polydispersity Index |
| SEM | Scanning Electron Microscopy |
| CLIJ | Confined Liquid Impinging Jets |
| FTIR | Fourier Transform Infrared Spectroscopy |
| DSC | Differential Scanning Calorimetry |
| XRD | X-Ray Diffraction; Å = Angstrom |
| FWHM | Full-Width Half-Maximum |
| STF | Simulated Tear Fluid |
| SLS | Sodium Lauryl Sulfate |
| BKC | Benzalkonium chloride |
| AqS | Aqueous Suspension |
| SCO2 | Supercritical Carbon-dioxide |
| Vit-E-TPGS | D- α-Tocopheryl Polyethylene Glycol-1000 Succinate |
| PPO | Polypropylene oxide |
| PEO | Polyethylene oxide |
| H-bonding | Hydrogen bonding |
| DE | Dissolution Efficiency |
| CI | Confidence intervals |
References
- Ammar, H.O.; Salama, H.A.; Ghorab, M.; Mahmoud, A.A. Nanoemulsion as a potential ophthalmic delivery system for dorzolamide hydrochloride. AAPS Pharmscitech 2009, 10, 808–819. [Google Scholar] [CrossRef] [PubMed] [Green Version]
- Lopez-Cano, J.J.; Gonzalez-Cela-Casamayor, M.A.; Andres-Guerrero, V.; Herrero-Vanrell, R.; Molina-Martinez, I.T. Liposomes as vehicles for topical ophthalmic drug delivery and ocular surface protection. Expert Opin. Drug Deliv. 2021, 18, 819–847. [Google Scholar] [CrossRef] [PubMed]
- Kalam, M.A.; Alshamsan, A. Poly (d, l-lactide-co-glycolide) nanoparticles for sustained release of tacrolimus in rabbit eyes. Biomed. Pharmacother. 2017, 94, 402–411. [Google Scholar] [CrossRef] [PubMed]
- Zhang, J.; Jiao, J.; Niu, M.; Gao, X.; Zhang, G.; Yu, H.; Yang, X.; Liu, L. Ten Years of Knowledge of Nano-Carrier Based Drug Delivery Systems in Ophthalmology: Current Evidence, Challenges, and Future Prospective. Int. J. Nanomed. 2021, 16, 6497–6530. [Google Scholar] [CrossRef]
- Araújo, J.; Gonzalez, E.; Egea, M.A.; Garcia, M.L.; Souto, E.B. Nanomedicines for ocular NSAIDs: Safety on drug delivery. Nanomed. Nanotechnol. Biol. Med. 2009, 5, 394–401. [Google Scholar] [CrossRef]
- Gan, L.; Wang, J.; Jiang, M.; Bartlett, H.; Ouyang, D.; Eperjesi, F.; Liu, J.; Gan, Y. Recent advances in topical ophthalmic drug delivery with lipid-based nanocarriers. Drug Discov. Today 2013, 18, 290–297. [Google Scholar] [CrossRef]
- Romero, G.B.; Keck, C.M.; Muller, R.H.; Bou-Chacra, N.A. Development of cationic nanocrystals for ocular delivery. Eur. J. Pharm. Biopharm. 2016, 107, 215–222. [Google Scholar] [CrossRef]
- Kalam, M.A.; Iqbal, M.; Alshememry, A.; Alkholief, M.; Alshamsan, A. Development and Evaluation of Chitosan Nanoparticles for Ocular Delivery of Tedizolid Phosphate. Molecules 2022, 27, 2326. [Google Scholar] [CrossRef]
- Sharma, O.P.; Patel, V.; Mehta, T. Nanocrystal for ocular drug delivery: Hope or hype. Drug Deliv. Transl. Res. 2016, 6, 399–413. [Google Scholar] [CrossRef]
- Abul Kalam, M.; Sultana, Y.; Ali, A.; Aqil, M.; Mishra, A.K.; Aljuffali, I.A.; Alshamsan, A. Part I: Development and optimization of solid-lipid nanoparticles using Box-Behnken statistical design for ocular delivery of gatifloxacin. J. Biomed. Mater. Res. Part A 2012, 101, 1813–1827. [Google Scholar]
- Kalam, M.A.; Sultana, Y.; Ali, A.; Aqil, M.; Mishra, A.K.; Chuttani, K. Preparation, characterization, and evaluation of gatifloxacin loaded solid lipid nanoparticles as colloidal ocular drug delivery system. J. Drug Target. 2009, 18, 191–204. [Google Scholar] [CrossRef] [PubMed]
- Lang, J.C. Ocular drug delivery conventional ocular formulations. Adv. Drug Deliv. Rev. 1995, 16, 39–43. [Google Scholar] [CrossRef]
- Hao, L.; Wang, X.; Zhang, D.; Xu, Q.; Song, S.; Wang, F.; Li, C.; Guo, H.; Liu, Y.; Zheng, D.; et al. Studies on the preparation, characterization and pharmacokinetics of Amoitone B nanocrystals. Int. J. Pharm. 2012, 433, 157–164. [Google Scholar] [CrossRef] [PubMed]
- Loscher, M.; Hurst, J.; Strudel, L.; Spitzer, M.S.; Schnichels, S. Nanoparticles as drug delivery systems in ophthalmology. Der Ophthalmol. 2018, 115, 184–189. [Google Scholar] [CrossRef] [PubMed]
- Franco, P.; De Marco, I. Nanoparticles and nanocrystals by supercritical CO2-assisted techniques for pharmaceutical applications: A review. Appl. Sci. 2021, 11, 1476. [Google Scholar] [CrossRef]
- Trucillo, P.; Ferrari, P.; Campardelli, R.; Reverchon, E.; Perego, P. A supercritical assisted process for the production of amoxicillin-loaded liposomes for antimicrobial applications. J. Supercrit. Fluids 2020, 163, 104842. [Google Scholar] [CrossRef]
- Campardelli, R.; Trucillo, P.; Reverchon, E. Supercritical assisted process for the efficient production of liposomes containing antibiotics for ocular delivery. J. CO2 Util. 2018, 25, 235–241. [Google Scholar] [CrossRef]
- Joshi, K.; Chandra, A.; Jain, K.; Talegaonkar, S. Nanocrystalization: An Emerging Technology to Enhance the Bioavailability of Poorly Soluble Drugs. Pharm. Nanotechnol. 2019, 7, 259–278. [Google Scholar] [CrossRef]
- Binkhathlan, Z.; Alomrani, A.H.; Hoxha, O.; Ali, R.; Kalam, M.A.; Alshamsan, A. Development and Characterization of PEGylated Fatty Acid-Block-Poly(ε-caprolactone) Novel Block Copolymers and Their Self-Assembled Nanostructures for Ocular Delivery of Cyclosporine A. Polymers 2022, 14, 1635. [Google Scholar] [CrossRef]
- Aksungur, P.; Demirbilek, M.; Denkbaş, E.B.; Vandervoort, J.; Ludwig, A.; Ünlü, N. Development and characterization of Cyclosporine A loaded nanoparticles for ocular drug delivery: Cellular toxicity, uptake, and kinetic studies. J. Control. Release 2011, 151, 286–294. [Google Scholar] [CrossRef]
- Dhahir, R.K.; Al-Nima, A.M.; Al-Bazzaz, F.Y. Nanoemulsions as Ophthalmic Drug Delivery Systems. Turk. J. Pharm. Sci. 2021, 18, 652–664. [Google Scholar] [CrossRef] [PubMed]
- Vandamme, T.F. Microemulsions as ocular drug delivery systems: Recent developments and future challenges. Prog. Retin. Eye Res. 2002, 21, 15–34. [Google Scholar] [CrossRef]
- Seyfoddin, A.; Shaw, J.; Al-Kassas, R. Solid lipid nanoparticles for ocular drug delivery. Drug Deliv. 2010, 17, 467–489. [Google Scholar] [CrossRef] [PubMed]
- Abul Kalam, M.; Sultana, Y.; Ali, A.; Aqil, M.; Mishra, A.K.; Chuttani, K.; Aljuffali, I.A.; Alshamsan, A. Part II: Enhancement of transcorneal delivery of gatifloxacin by solid lipid nanoparticles in comparison to commercial aqueous eye drops. J. Biomed. Mater. Res. Part A 2012, 101, 1828–1836. [Google Scholar] [CrossRef] [PubMed]
- Abdelbary, G.; El-Gendy, N. Niosome-encapsulated gentamicin for ophthalmic controlled delivery. AAPS Pharmscitech 2008, 9, 740–747. [Google Scholar] [CrossRef]
- Durak, S.; Esmaeili Rad, M.; Alp Yetisgin, A.; Eda Sutova, H.; Kutlu, O.; Cetinel, S.; Zarrabi, A. Niosomal Drug Delivery Systems for Ocular Disease-Recent Advances and Future Prospects. Nanomaterials 2020, 10, 1191. [Google Scholar] [CrossRef]
- Kambhampati, S.P.; Kannan, R.M. Dendrimer nanoparticles for ocular drug delivery. J. Ocul. Pharmacol. Ther. 2013, 29, 151–165. [Google Scholar] [CrossRef] [Green Version]
- Lancina, M.G.; Yang, H. Dendrimers for Ocular Drug Delivery. Can. J. Chem. 2017, 95, 897–902. [Google Scholar] [CrossRef]
- Kalam, M.A. Development of chitosan nanoparticles coated with hyaluronic acid for topical ocular delivery of dexamethasone. Int. J. Biol. Macromol. 2016, 89, 127–136. [Google Scholar] [CrossRef]
- Muller, R.H.; Keck, C.M. Twenty years of drug nanocrystals: Where are we, and where do we go? Eur. J. Pharm. Biopharm. 2012, 80, 1–3. [Google Scholar] [CrossRef]
- Mohammad, I.S.; Hu, H.; Yin, L.; He, W. Drug nanocrystals: Fabrication methods and promising therapeutic applications. Int. J. Pharm. 2019, 562, 187–202. [Google Scholar] [CrossRef] [PubMed]
- Gigliobianco, M.R.; Casadidio, C.; Censi, R.; Di Martino, P. Nanocrystals of Poorly Soluble Drugs: Drug Bioavailability and Physicochemical Stability. Pharmaceutics 2018, 10, 134. [Google Scholar] [CrossRef] [PubMed] [Green Version]
- Sun, B.; Yeo, Y. Nanocrystals for the parenteral delivery of poorly water-soluble drugs. Curr. Opin. Solid State Mater. Sci. 2012, 16, 295–301. [Google Scholar] [CrossRef] [PubMed] [Green Version]
- Sahoo, S.K.; Dilnawaz, F.; Krishnakumar, S. Nanotechnology in ocular drug delivery. Drug Discov. Today 2008, 13, 144–151. [Google Scholar] [CrossRef]
- Weng, Y.; Liu, J.; Jin, S.; Guo, W.; Liang, X.; Hu, Z. Nanotechnology-based strategies for treatment of ocular disease. Acta Pharm. Sin. B 2016, 7, 281–291. [Google Scholar] [CrossRef] [Green Version]
- Chen, Z.; Wu, W.; Lu, Y. What is the future for nanocrystal-based drug-delivery systems? Ther. Deliv. 2020, 11, 225–229. [Google Scholar] [CrossRef]
- Pathi, S.L.; Chennuru, R.; Bollineni, M. Olaparib Co-Crystals and Process of Preparation Thereof. WO2021044437A1, 11 March 2021. [Google Scholar]
- Rey, A.W.; Souza, F.E.S.; Bhattacharyya, A.; Khalili, B. Crystalline form of Olaparib. U.S. Patent 10662178B2, 26 May 2020. [Google Scholar]
- Kassem, M.A.; Abdel Rahman, A.A.; Ghorab, M.M.; Ahmed, M.B.; Khalil, R.M. Nanosuspension as an ophthalmic delivery system for certain glucocorticoid drugs. Int. J. Pharm. 2007, 340, 126–133. [Google Scholar] [CrossRef]
- Im, W.B.; Choi, S.H.; Park, J.Y.; Choi, S.H.; Finn, J.; Yoon, S.H. Discovery of torezolid as a novel 5-hydroxymethyl-oxazolidinone antibacterial agent. Eur. J. Med. Chem. 2011, 46, 1027–1039. [Google Scholar] [CrossRef]
- Ruiz, P.; Causse, M.; Vaquero, M.; Casal, M. In Vitro Activity of Tedizolid against Mycobacterium tuberculosis. Antimicrob. Agents Chemother. 2019, 63, e01939-18. [Google Scholar] [CrossRef] [Green Version]
- Das, D.; Tulkens, P.M.; Mehra, P.; Fang, E.; Prokocimer, P. Tedizolid phosphate for the management of acute bacterial skin and skin structure infections: Safety summary. Clin. Infect. Dis. 2013, 58 (Suppl. S1), S51–S57. [Google Scholar] [CrossRef] [Green Version]
- Yang, Z.; Tian, L.; Liu, J.; Huang, G. Construction and evaluation in vitro and in vivo of tedizolid phosphate loaded cationic liposomes. J. Liposome Res. 2017, 28, 322–330. [Google Scholar] [CrossRef] [PubMed]
- Ferrandez, O.; Urbina, O.; Grau, S. Critical role of tedizolid in the treatment of acute bacterial skin and skin structure infections. Drug Des. Dev. Ther. 2016, 11, 65–82. [Google Scholar] [CrossRef] [Green Version]
- Kisgen, J.J.; Mansour, H.; Unger, N.R.; Childs, L.M. Tedizolid: A new oxazolidinone antimicrobial. Am. J. Health-Syst. Pharm. 2014, 71, 621–633. [Google Scholar] [CrossRef] [PubMed] [Green Version]
- Moaaz, E.M.; Abdel-Moety, E.M.; Rezk, M.R.; Fayed, A.S. Stability-Indicating Determination of Tedizolid Phosphate in the Presence of its Active Form and Possible Degradants. J. Chromatogr. Sci. 2021, 60, 51–60. [Google Scholar] [CrossRef] [PubMed]
- Chan, H.-K.; Kwok, P.C.L. Production methods for nanodrug particles using the bottom-up approach. Adv. Drug Deliv. Rev. 2011, 63, 406–416. [Google Scholar] [CrossRef] [PubMed]
- Langford, J.I.; Wilson, A. Scherrer after sixty years: A survey and some new results in the determination of crystallite size. J. Appl. Crystallogr. 1978, 11, 102–113. [Google Scholar] [CrossRef]
- Iwasawa, A.; Ayaki, M.; Niwano, Y. Cell viability score (CVS) as a good indicator of critical concentration of benzalkonium chloride for toxicity in cultured ocular surface cell lines. Regul. Toxicol. Pharmacol. 2013, 66, 177–183. [Google Scholar] [CrossRef]
- Efron, N.; Young, G.; Brennan, N.A. Ocular surface temperature. Curr. Eye Res. 1989, 8, 901–906. [Google Scholar]
- Alkholief, M.; Kalam, M.A.; Almomen, A.; Alshememry, A.; Alshamsan, A. Thermoresponsive sol-gel improves ocular bioavailability of Dipivefrin hydrochloride and potentially reduces the elevated intraocular pressure in vivo. Saudi Pharm. J. 2020, 28, 1019–1029. [Google Scholar] [CrossRef]
- Kalam, M.A.; Alshehri, S.; Alshamsan, A.; Haque, A.; Shakeel, F. Solid liquid equilibrium of an antifungal drug itraconazole in different neat solvents: Determination and correlation. J. Mol. Liq. 2017, 234, 81–87. [Google Scholar] [CrossRef]
- Kassaye, L.; Genete, G. Evaluation and comparison of in-vitro dissolution profiles for different brands of amoxicillin capsules. Afr. Health Sci. 2013, 13, 369–375. [Google Scholar] [CrossRef] [PubMed] [Green Version]
- Anderson, N.H.; Bauer, M.; Boussac, N.; Khan-Malek, R.; Munden, P.; Sardaro, M. An evaluation of fit factors and dissolution efficiency for the comparison of in vitro dissolution profiles. J. Pharm. Biomed. Anal. 1998, 17, 811–822. [Google Scholar] [CrossRef]
- Ige, P.P.; Baria, R.K.; Gattani, S.G. Fabrication of fenofibrate nanocrystals by probe sonication method for enhancement of dissolution rate and oral bioavailability. Colloids Surf. B Biointerfaces 2013, 108, 366–373. [Google Scholar] [CrossRef] [PubMed]
- Freeman, P.D.; Kahook, M.Y. Preservatives in topical ophthalmic medications: Historical and clinical perspectives. Expert Rev. Ophthalmol. 2009, 4, 59–64. [Google Scholar] [CrossRef]
- Romanowski, E.G.; Yates, K.A.; Shanks, R.M.Q.; Kowalski, R.P. Benzalkonium Chloride Demonstrates Concentration-Dependent Antiviral Activity Against Adenovirus In Vitro. J. Ocul. Pharmacol. Ther. 2019, 35, 311–314. [Google Scholar] [CrossRef]
- Pannu, J.; Ciotti, S.; Ganesan, S.; Arida, G.; Costley, C.; Fattom, A. Nanodroplet-Benzalkonium Chloride Formulation Demonstrates In Vitro and Ex Vivo Broad-Spectrum Antiviral Activity Against SARS-CoV-2 and Other Enveloped Viruses. bioRxiv 2020. [Google Scholar] [CrossRef]
- Yanez, F.; Martikainen, L.; Braga, M.E.; Alvarez-Lorenzo, C.; Concheiro, A.; Duarte, C.M.; Gil, M.H.; de Sousa, H.C. Supercritical fluid-assisted preparation of imprinted contact lenses for drug delivery. Acta Biomater. 2011, 7, 1019–1030. [Google Scholar] [CrossRef]
- Reverchon, E.; De Marco, I.; Torino, E. Nanoparticles production by supercritical antisolvent precipitation: A general interpretation. J. Supercrit. Fluids 2007, 43, 126–138. [Google Scholar] [CrossRef]
- Srivalli, K.M.R.; Mishra, B. Drug nanocrystals: A way toward scale-up. Saudi Pharm. J. 2014, 24, 386–404. [Google Scholar] [CrossRef] [Green Version]
- Saengsorn, K.; Jimtaisong, A. Determination of hydrophilic–lipophilic balance value and emulsion properties of sacha inchi oil. Asian Pac. J. Trop. Biomed. 2017, 7, 1092–1096. [Google Scholar] [CrossRef]
- Liu, F.; Park, J.-Y.; Zhang, Y.; Conwell, C.; Liu, Y.; Bathula, S.R.; Huang, L. Targeted cancer therapy with novel high drug-loading nanocrystals. J. Pharm. Sci. 2010, 99, 3542–3551. [Google Scholar] [CrossRef] [PubMed]
- Sharma, M.; Mehta, I. Surface stabilized atorvastatin nanocrystals with improved bioavailability, safety and antihyperlipidemic potential. Sci. Rep. 2019, 9, 16105–16111. [Google Scholar] [CrossRef] [PubMed]
- Wang, Y.; Zheng, Y.; Zhang, L.; Wang, Q.; Zhang, D. Stability of nanosuspensions in drug delivery. J. Control. Release 2013, 172, 1126–1141. [Google Scholar] [CrossRef] [PubMed]
- Medarević, D.; Ibrić, S.; Vardaka, E.; Mitrić, M.; Nikolakakis, I.; Kachrimanis, K. Insight into the formation of glimepiride nanocrystals by wet media milling. Pharmaceutics 2020, 12, 53. [Google Scholar] [CrossRef] [Green Version]
- Medarevic, D.; Djuris, J.; Ibric, S.; Mitric, M.; Kachrimanis, K. Optimization of formulation and process parameters for the production of carvedilol nanosuspension by wet media milling. Int. J. Pharm. 2018, 540, 150–161. [Google Scholar] [CrossRef] [PubMed]
- Li, J.; Wang, Z.; Zhang, H.; Gao, J.; Zheng, A. Progress in the development of stabilization strategies for nanocrystal preparations. Drug Deliv. 2020, 28, 19–36. [Google Scholar] [CrossRef] [PubMed]
- Chiou, H.; Chan, H.-K.; Heng, D.; Prud’homme, R.K.; Raper, J.A. A novel production method for inhalable cyclosporine A powders by confined liquid impinging jet precipitation. J. Aerosol Sci. 2008, 39, 500–509. [Google Scholar] [CrossRef]
- Kumar, V.; Adamson, D.H.; Prud’homme, R.K. Fluorescent polymeric nanoparticles: Aggregation and phase behavior of pyrene and amphotericin B molecules in nanoparticle cores. Small 2010, 6, 2907–2914. [Google Scholar] [CrossRef]
- Paczkowska-Walendowska, M.; Rosiak, N.; Tykarska, E.; Michalska, K.; Plazinska, A.; Plazinski, W.; Szymanowska, D.; Cielecka-Piontek, J. Tedizolid-Cyclodextrin System as Delayed-Release Drug Delivery with Antibacterial Activity. Int. J. Mol. Sci. 2020, 22, 115. [Google Scholar] [CrossRef]
- Liao, J.B.; Liang, Y.Z.; Chen, Y.L.; Xie, J.H.; Liu, W.H.; Chen, J.N.; Lai, X.P.; Su, Z.R. Novel patchouli alcohol ternary solid dispersion pellets prepared by poloxamers. Iran. J. Pharm. Res. 2015, 14, 15–26. [Google Scholar]
- Gombás, Á.; Szabó-Révész, P.; Regdon, G.; Erős, I. Study of thermal behaviour of sugar alcohols. J. Therm. Anal. Calorim. 2003, 73, 615–621. [Google Scholar] [CrossRef]
- Hardiningtyas, S.D.; Wakabayashi, R.; Ishiyama, R.; Owada, Y.; Goto, M.; Kamiya, N. Enhanced potential of therapeutic applications of curcumin using solid-in-water nanodispersion technique. J. Chem. Eng. Jpn. 2019, 52, 138–143. [Google Scholar] [CrossRef] [Green Version]
- Michalska, K.; Mizera, M.; Lewandowska, K.; Cielecka-Piontek, J. Infrared, Raman and ultraviolet with circular dichroism analysis and theoretical calculations of tedizolid. J. Mol. Struct. 2016, 1115, 136–143. [Google Scholar] [CrossRef]
- Sharma, A.; Jain, C.P.; Tanwar, Y.S. Preparation and characterization of solid dispersions of carvedilol with poloxamer 188. J. Chil. Chem. Soc. 2013, 58, 1553–1557. [Google Scholar] [CrossRef] [Green Version]
- Rachmawati, H.; Al Shaal, L.; Muller, R.H.; Keck, C.M. Development of curcumin nanocrystal: Physical aspects. J. Pharm. Sci. 2013, 102, 204–214. [Google Scholar] [CrossRef]
- Srivalli, K.M.R.; Mishra, B. Preparation and pharmacodynamic assessment of ezetimibe nanocrystals: Effect of P-gp inhibitory stabilizer on particle size and oral absorption. Colloids Surf. B Biointerfaces 2015, 135, 756–764. [Google Scholar] [CrossRef]
- Abelson, M.B.; Udell, I.J.; Weston, J.H. Normal human tear pH by direct measurement. Arch. Ophthalmol. 1981, 99, 301. [Google Scholar] [CrossRef]
- Tomlinson, A.; Khanal, S.; Ramaesh, K.; Diaper, C.; McFadyen, A. Tear film osmolarity: Determination of a referent for dry eye diagnosis. Investig. Ophthalmol. Vis. Sci. 2006, 47, 4309–4315. [Google Scholar] [CrossRef] [Green Version]
- Potvin, R.; Makari, S.; Rapuano, C.J. Tear film osmolarity and dry eye disease: A review of the literature. Clin. Ophthalmol. 2015, 9, 2039–2047. [Google Scholar] [CrossRef] [Green Version]
- Troiano, P.; Monaco, G. Effect of hypotonic 0.4% hyaluronic acid drops in dry eye patients: A cross-over study. Cornea 2008, 27, 1126–1130. [Google Scholar] [CrossRef]
- Zhu, H.; Chauhan, A. Effect of viscosity on tear drainage and ocular residence time. Optom. Vis. Sci. 2008, 85, 715–725. [Google Scholar] [CrossRef] [PubMed]
- Salmani, J.M.M.; Lv, H.; Asghar, S.; Zhou, J. Amorphous solid dispersion with increased gastric solubility in tandem with oral disintegrating tablets: A successful approach to improve the bioavailability of atorvastatin. Pharm. Dev. Technol. 2015, 20, 465–472. [Google Scholar] [CrossRef] [PubMed]
- Hattori, Y.; Haruna, Y.; Otsuka, M. Dissolution process analysis using model-free Noyes–Whitney integral equation. Colloids Surf. B Biointerfaces 2013, 102, 227–231. [Google Scholar] [CrossRef] [PubMed]
- Kim, M.; Heinrich, F.; Haugstad, G.; Yu, G.; Yuan, G.; Satija, S.K.; Zhang, W.; Seo, H.S.; Metzger, J.M.; Azarin, S.M.J.L. Spatial Distribution of PEO–PPO–PEO Block Copolymer and PEO Homopolymer in Lipid Bilayers. Langmuir 2020, 36, 3393–3403. [Google Scholar] [CrossRef] [PubMed]
- Zana, R.; Marques, C.; Johner, A. Dynamics of micelles of the triblock copolymers poly(ethylene oxide)-poly(propylene oxide)-poly(ethylene oxide) in aqueous solution. Adv. Colloid Interface Sci. 2006, 123–126, 345–351. [Google Scholar] [CrossRef]
- Al-Kassas, R.; Bansal, M.; Shaw, J. Nanosizing techniques for improving bioavailability of drugs. J. Control. Release 2017, 260, 202–212. [Google Scholar] [CrossRef]
- Verma, S.; Kumar, S.; Gokhale, R.; Burgess, D.J. Physical stability of nanosuspensions: Investigation of the role of stabilizers on Ostwald ripening. Int. J. Pharm. 2011, 406, 145–152. [Google Scholar] [CrossRef]
- Ezquer-Garin, C.; Ferriols-Lisart, R.; Martinez-Lopez, L.M.; Sangrador-Pelluz, C.; Nicolas-Pico, J.; Alos-Alminana, M. Stability of tedizolid phosphate-sodium rifampicin and tedizolid phosphate-meropenem admixtures in intravenous infusion bags stored at different temperatures. Die Pharm. 2020, 75, 172–176. [Google Scholar] [CrossRef]
- Gora, S.; Mustafa, G.; Sahni, J.K.; Ali, J.; Baboota, S. Nanosizing of valsartan by high pressure homogenization to produce dissolution enhanced nanosuspension: Pharmacokinetics and pharmacodyanamic study. Drug Deliv. 2016, 23, 940–950. [Google Scholar] [CrossRef] [Green Version]


| Batches | Stabilizers (mg)/Concentrations (%, w/v) | Physical Characterization | ||
|---|---|---|---|---|
| Particle Size (nm) | Polydispersity Index | Zeta Potential (mV) | ||
| (a) Preliminary trials of NCs * with 1.0 % (w/v) stabilizers | ||||
| NC-P188 | Polxamer-188 | 495.3 ± 23.5 | 0.265 ± 0.011 | −16.2 ± 2.8 |
| NC-PVA | PVA | 514.8 ± 29.4 | 0.375 ± 0.023 | −6.8 ± 1.9 |
| NC-P407 | Poloxamer-407 (F127) | 614.6 ± 72.5 | 0.419 ± 0.012 | −14.1 ± 3.2 |
| NC-PVP | Polyvinylpyrrolidone K30 | 596.6 ± 45.2 | 0.279 ± 0.005 | +5.5 ± 2.1 |
| NC-TPGS | Vit-E TPGS | 675.2 ± 77.6 | 0.439 ± 0.018 | +9.7 ± 2.6 |
| NC-SLS | Sodium lauryl sulfate | 579.5 ± 36.7 | 0.512 ± 0.029 | −1.2 ± 0.8 |
| NC-Tween | Tween-80 | 563.7 ± 43.6 | 0.468 ± 0.008 | −8.4 ± 2.4 |
| (b) Optimization of NCs * prepared with POL * or PVA * as stabilizers (Mean ± SD, n = 3) | ||||
| NC-POL1 | 100 (0.5%, w/v) | 715.2 ± 61.7 | 0.458 ± 0.024 | −6.6 ± 3.5 |
| NC-POL2 | 200 (1.0%, w/v) | 481.7 ± 58.4 | 0.252 ± 0.021 | −17.2 ± 5.6 |
| NC-POL3 | 400 (2.0%, w/v) | 603.0 ± 70.4 | 0.396 ± 0.006 | −18.6 ± 4.0 |
| NC-POL4 | 500 (2.5%, w/v) | 600.5 ± 65.2 | 0.442 ± 0.009 | −19.9 ± 6.9 |
| NC-PVA1 | 100 (0.5%, w/v) | 745.2 ± 89.1 | 0.403 ± 0.027 | −0.6 ± 2.4 |
| NC-PVA2 | 200 (1.0%, w/v) | 613.8 ± 65.7 | 0.375 ± 0.019 | −7.6 ± 3.4 |
| NC-PVA3 | 400 (2.0%, w/v) | 556.6 ± 59.5 | 0.328 ± 0.023 | −6.3 ± 4.2 |
| NC-PVA4 | 500 (2.5%, w/v) | 507.6 ± 45.9 | 0.292 ± 0.007 | −8.8 ± 3.9 |
| Nanocrystals (NCs) | TZP (mg) | Homogenization Time (min) at 21,500 rpm | Sonication Time (s); 10 s Each Cycle | Physical Characterization (Mean ± SD, n = 3) | |||
|---|---|---|---|---|---|---|---|
| Particle Size (nm) | Polydispersity Index | Zeta Potential (mV) | TZP Content (%) | ||||
| NCs-1 | 10 | 5 | 40 | 565.3 ± 42.7 | 0.428 ± 0.073 | −5.8 ± 2.3 | 90.9 ± 1.5 |
| NCs-2 | 10 | 7.5 | 50 | 389.5 ± 58.4 | 0.401 ± 0.021 | −6.7 ± 3.9 | 90.1 ± 2.6 |
| NCs-3 | 10 | 10 | 60 | 150.4 ± 18.3 | 0.231 ± 0.006 | −13.5 ± 1.5 | 96.7 ± 1.2 |
| NCs-4 | 10 | 15 | 70 | 147.5 ± 11.5 | 0.249 ± 0.012 | −10.6 ± 9.9 | 92.4 ± 2.8 |
| Nanocrystals (NCs) | Particle Size (nm) | PDI | Zeta Potential (mV) | TZP (%) Contents | ||||
|---|---|---|---|---|---|---|---|---|
| Freeze Drying | Freeze Drying | Freeze Drying | Freeze Drying | |||||
| Before | After | Before | After | Before | After | Before | After | |
| NC0 (No mannitol) | 150.4 ± 18.3 | 153.7 ± 16.6 | 0.231 ± 0.006 | 0.237 ± 0.003 | +26.3 ± 5.1 | +28.07 ± 5.0 | 93.1 ± 2.8 | 93.3 ± 2.8 |
| NC1 (1%, w/v mannitol) | 151.6 ± 17.5 | 154.3 ± 17.9 | 0.237 ± 0.005 | 0.243 ± 0.009 | +29.4 ± 3.9 | +31.64 ± 3.8 | 96.2 ± 2.5 | 96.4 ± 2.5 |
| NC2.5 (2.5%, w/v mannitol) | 157.5 ± 19.4 | 161.1 ± 19.3 | 0.344 ± 0.012 | 0.351 ± 0.016 | +27.5 ± 5.6 | +29.21 ± 5.6 | 92.4 ± 3.0 | 92.6 ± 2.9 |
| NC5 (5%, w/v mannitol) | 160.8 ± 18.7 | 163.2 ± 20.7 | 0.358 ± 0.016 | 0.365 ± 0.019 | +28.9 ± 5.2 | +30.87 ± 5.2 | 91.2 ± 2.6 | 91.6 ± 2.1 |
| Formulations | Clarity at 25 °C | pH | Osmolarity (mOsm·L−1) | Drug Content (%) | Viscosity (cPs) at | |
|---|---|---|---|---|---|---|
| 20 ± 1 °C | 35 ± 1 °C | |||||
| * TZP-NC1 (1%, w/v mannitol) | Clear and transparent | 7.0 ± 0.4 | 298.0 ± 5.0 | 96.4 ± 2.6 | 28.5 ± 1.2 | 21.1 ± 1.1 |
| ** TZP-AqS | Cloudy and translucent | 6.2 ± 0.5 | 304.0 ± 4.0 | 98.4 ± 1.8 | 29.4 ± 2.1 | 23.1 ± 1.8 |
| Release Models | Kinetic Parameters | TZP-NC1-AqS | Conventional TZP-AqS |
|---|---|---|---|
| Zero order (Fraction drug released vs. time) | R2 | 0.9157 | 0.8309 |
| n-value | 0.2631 | 0.0138 | |
| k0 (µgh−1) | 1.11 × 10⁻¹ | 0.53 × 10⁻¹ | |
| First order (Log% Drug remaining vs. time) | R2 | 0.9875 | 0.9728 |
| n-value | 0.0238 | 0.0081 | |
| k1 (h−1) | 2.28 | 2.37 × 10⁻¹ | |
| Korsmeyer-Peppas (Log Fraction drug released vs. log time) | R2 | 0.9685 | 0.9645 |
| n-value | 0.3221 | 0.3534 | |
| kK-P (h−n) | 4.52 × 10⁻¹ | 2.39 × 10⁻¹ | |
| Hixon-Crowell (Mo1/3–Mt1/3 vs. time) | R2 | 0.9699 | 0.8386 |
| n-value | 0.0141 | 0.0054 | |
| kH-C (µg1/3h−1) | 4.79 × 10⁻¹ | 4.77 × 10⁻¹ |
| Stability of TZP-NC1 | Values at Different Time Points (Mean ± SD, n = 3) | ||||
|---|---|---|---|---|---|
| Initially (0 Day) | At 7 Days | At 30 Days | At 90 Days | At 180 Days | |
| At 4 ± 2 °C | |||||
| Particle size (nm) | 154.3 ± 17.9 | 157.2 ± 14.7 | 159.8 ± 15.2 | 161.8 ± 15.6 | 164.1 ± 15.8 |
| Polydispersity index | 0.242 ± 0.009 | 0.244 ± 0.008 | 0.245 ± 0.008 | 0.247 ± 0.009 | 0.249 ± 0.011 |
| Zeta potentials (mV) | +31.6 ± 3.8 | +31.4 ± 3.7 | +30.8 ± 3.8 | +30.2 ± 3.7 | +29.4 ± 3.5 |
| Drug content (%) | 96.2 ± 3.1 | 96.17 ± 2.56 | 95.8 ± 2.8 | 95.2 ± 3.4 | 94.5 ± 3.6 |
| At 25 ± 1 °C | |||||
| Particle size (nm) | 154.3 ± 17.9 | 159.1 ± 14.9 | 161.6 ± 15.1 | 174.2 ± 16.4 | 190.0 ± 17.8 |
| Polydispersity index | 0.242 ± 0.009 | 0.247 ± 0.008 | 0.248 ± 0.008 | 0.251 ± 0.009 | 0.253 ± 0.008 |
| Zeta potentials (mV) | +31.6 ± 3.8 | +31.0 ± 3.7 | +30.6 ± 3.6 | +29.4 ± 3.4 | +29.1 ± 3.4 |
| Drug content (%) | 96.2 ± 3.1 | 96.1 ± 2.8 | 95.6 ± 3.2 | 95.4 ± 3.5 | 94.9 ± 3.4 |
| At 37 ± 1°C | |||||
| Particle size (nm) | 154.3 ± 17.9 | 161.0 ± 15.2 | 162.8 ± 15.3 | 176.4 ± 16.6 | 192.1 ± 18.0 |
| Polydispersity index | 0.242 ± 0.009 | 0.247 ± 0.007 | 0.249 ± 0.008 | 0.252 ± 0.009 | 0.255 ± 0.008 |
| Zeta potentials (mV) | +31.6 ± 3.8 | +30.6 ± 3.8 | +30.3 ± 3.6 | +29.0 ± 3.4 | +28.6 ± 3.4 |
| Drug content (%) | 96.2 ± 3.1 | 95.8 ± 2.9 | 95.6 ± 3.1 | 95.3 ± 3.5 | 94.2 ± 3.2 |
Publisher’s Note: MDPI stays neutral with regard to jurisdictional claims in published maps and institutional affiliations. |
© 2022 by the authors. Licensee MDPI, Basel, Switzerland. This article is an open access article distributed under the terms and conditions of the Creative Commons Attribution (CC BY) license (https://creativecommons.org/licenses/by/4.0/).
Share and Cite
Kalam, M.A.; Iqbal, M.; Alshememry, A.; Alkholief, M.; Alshamsan, A. Fabrication and Characterization of Tedizolid Phosphate Nanocrystals for Topical Ocular Application: Improved Solubilization and In Vitro Drug Release. Pharmaceutics 2022, 14, 1328. https://doi.org/10.3390/pharmaceutics14071328
Kalam MA, Iqbal M, Alshememry A, Alkholief M, Alshamsan A. Fabrication and Characterization of Tedizolid Phosphate Nanocrystals for Topical Ocular Application: Improved Solubilization and In Vitro Drug Release. Pharmaceutics. 2022; 14(7):1328. https://doi.org/10.3390/pharmaceutics14071328
Chicago/Turabian StyleKalam, Mohd Abul, Muzaffar Iqbal, Abdullah Alshememry, Musaed Alkholief, and Aws Alshamsan. 2022. "Fabrication and Characterization of Tedizolid Phosphate Nanocrystals for Topical Ocular Application: Improved Solubilization and In Vitro Drug Release" Pharmaceutics 14, no. 7: 1328. https://doi.org/10.3390/pharmaceutics14071328