
Quality by Design Methodology Applied to Process Optimization and Scale up of Curcumin Nanoemulsions Produced by Catastrophic Phase Inversion


Abstract
:
1. Introduction
2. Materials and Methods
2.1. Materials
2.2. Curcumin Solubility in Oils and Surfactants
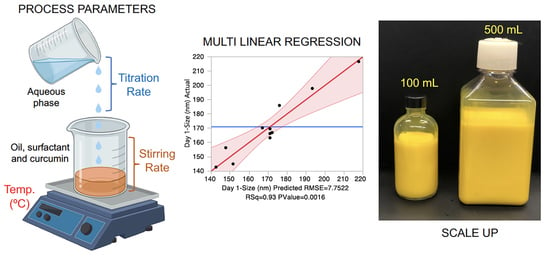
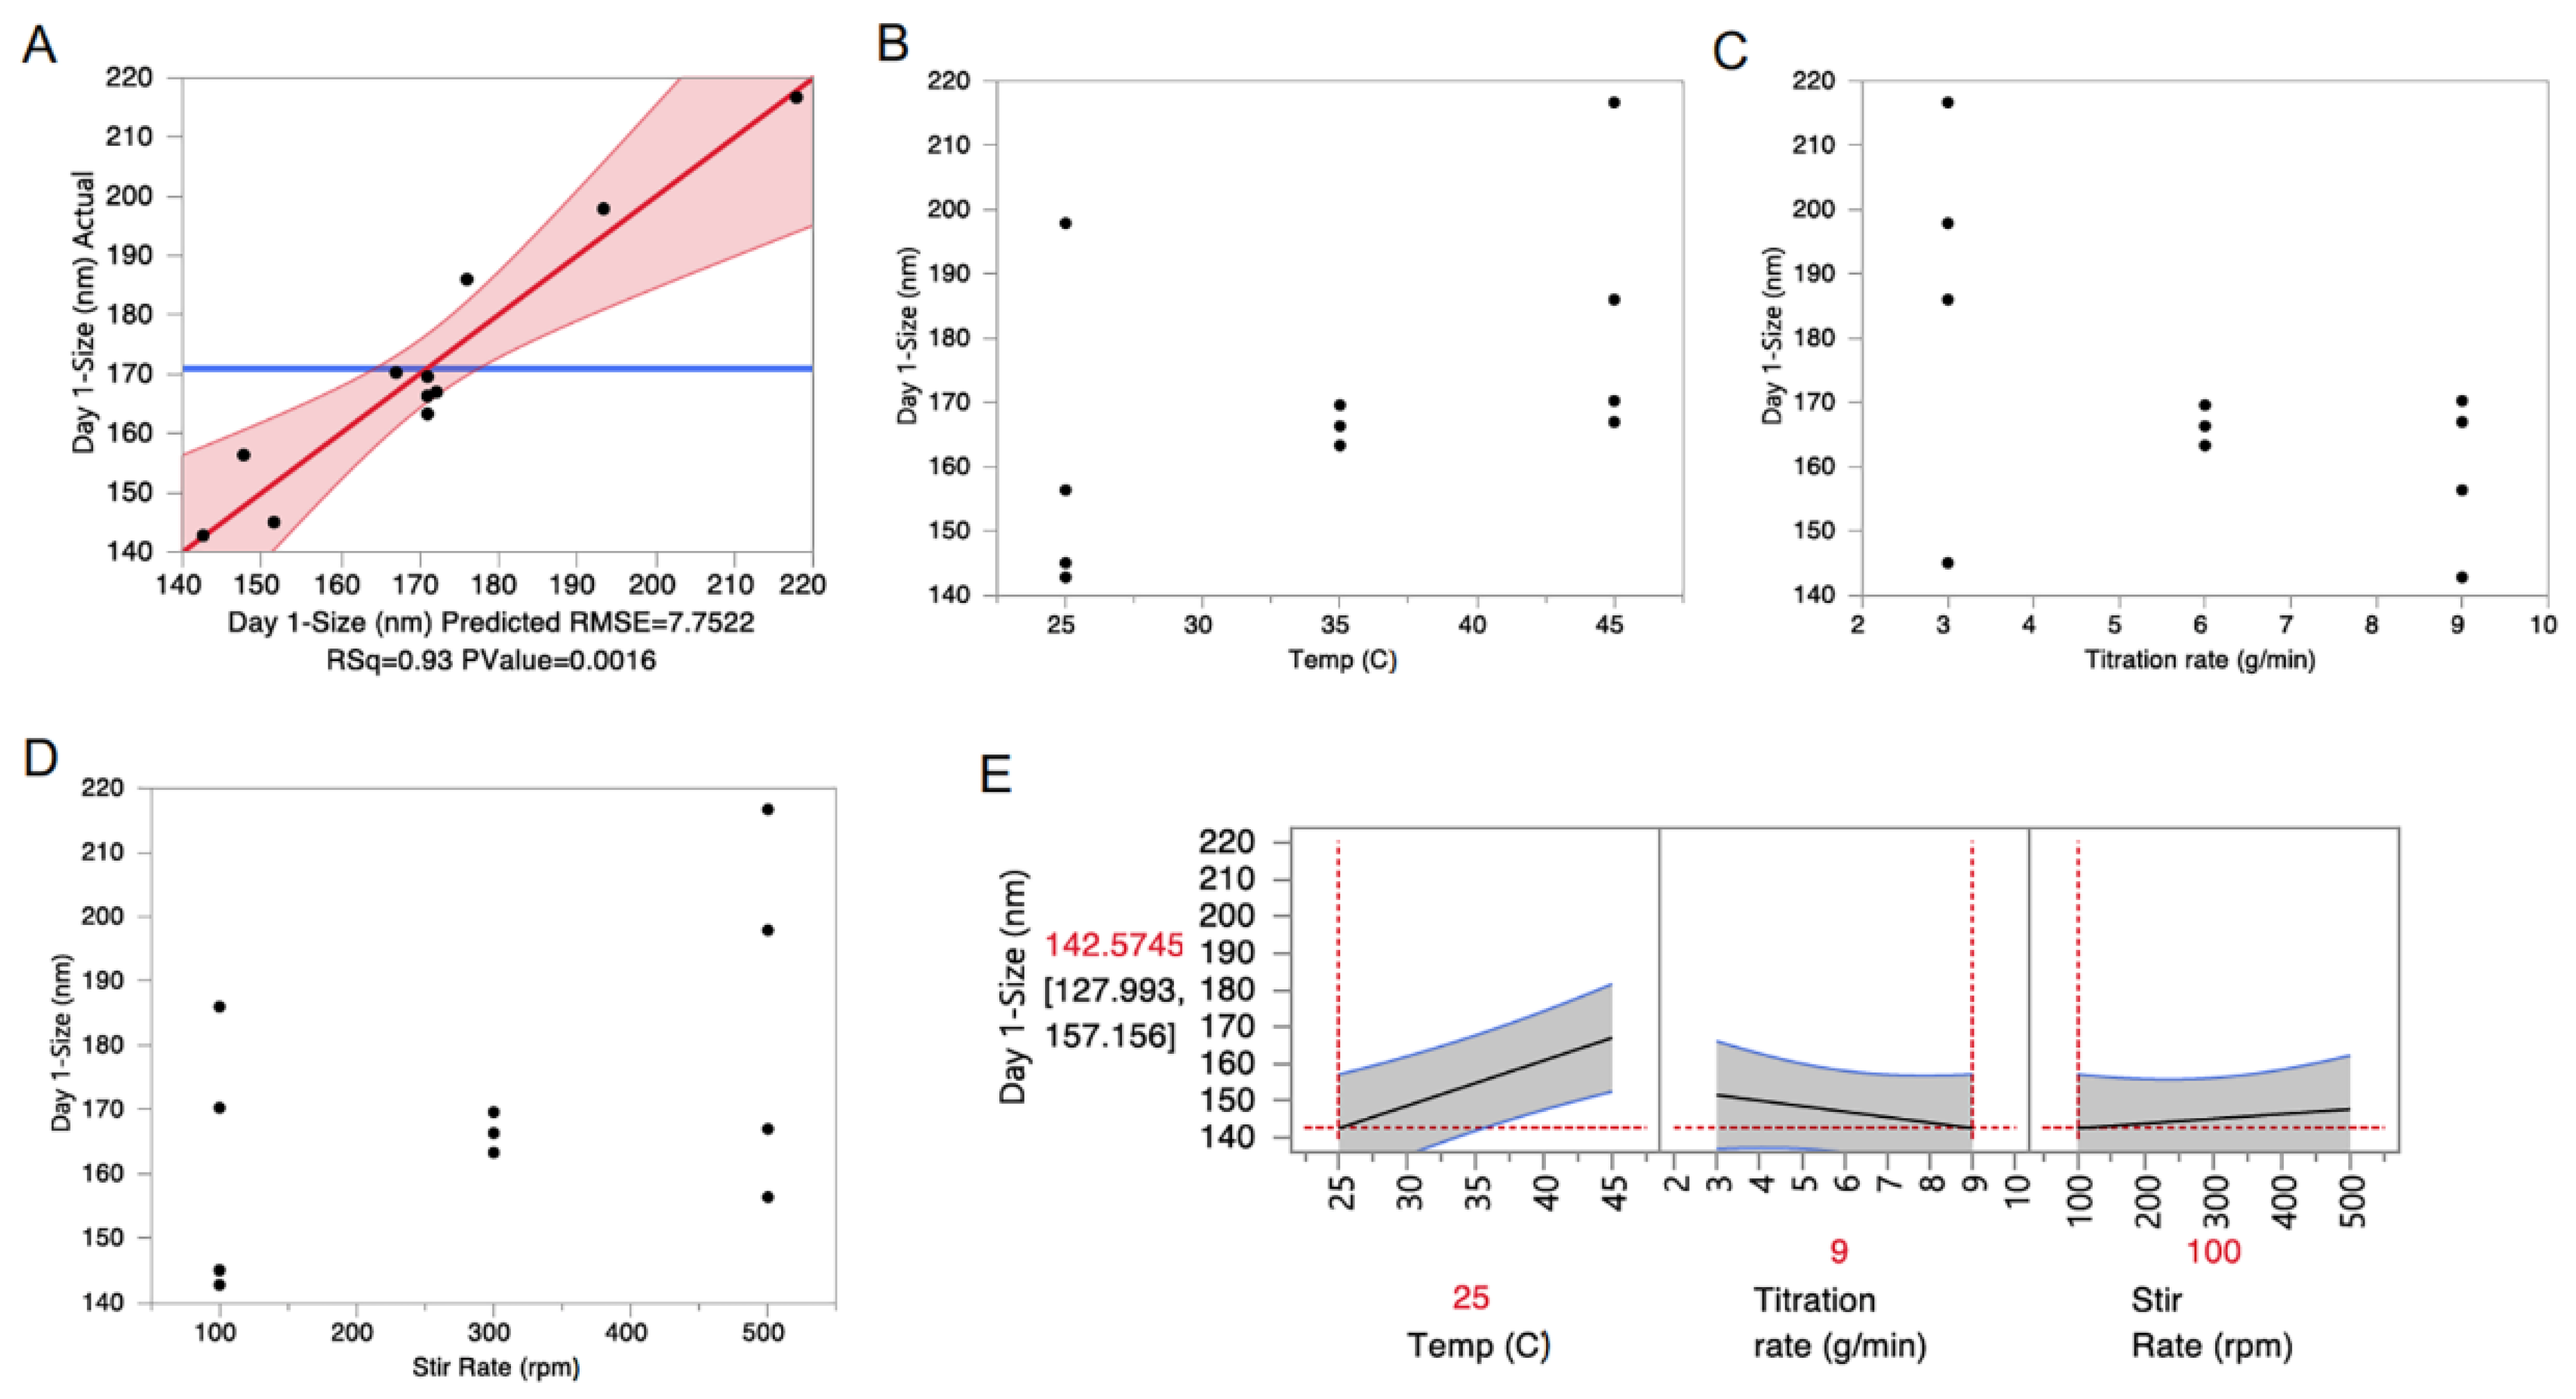
2.3. Design of Experiments and Multiple Linear Regression Modeling
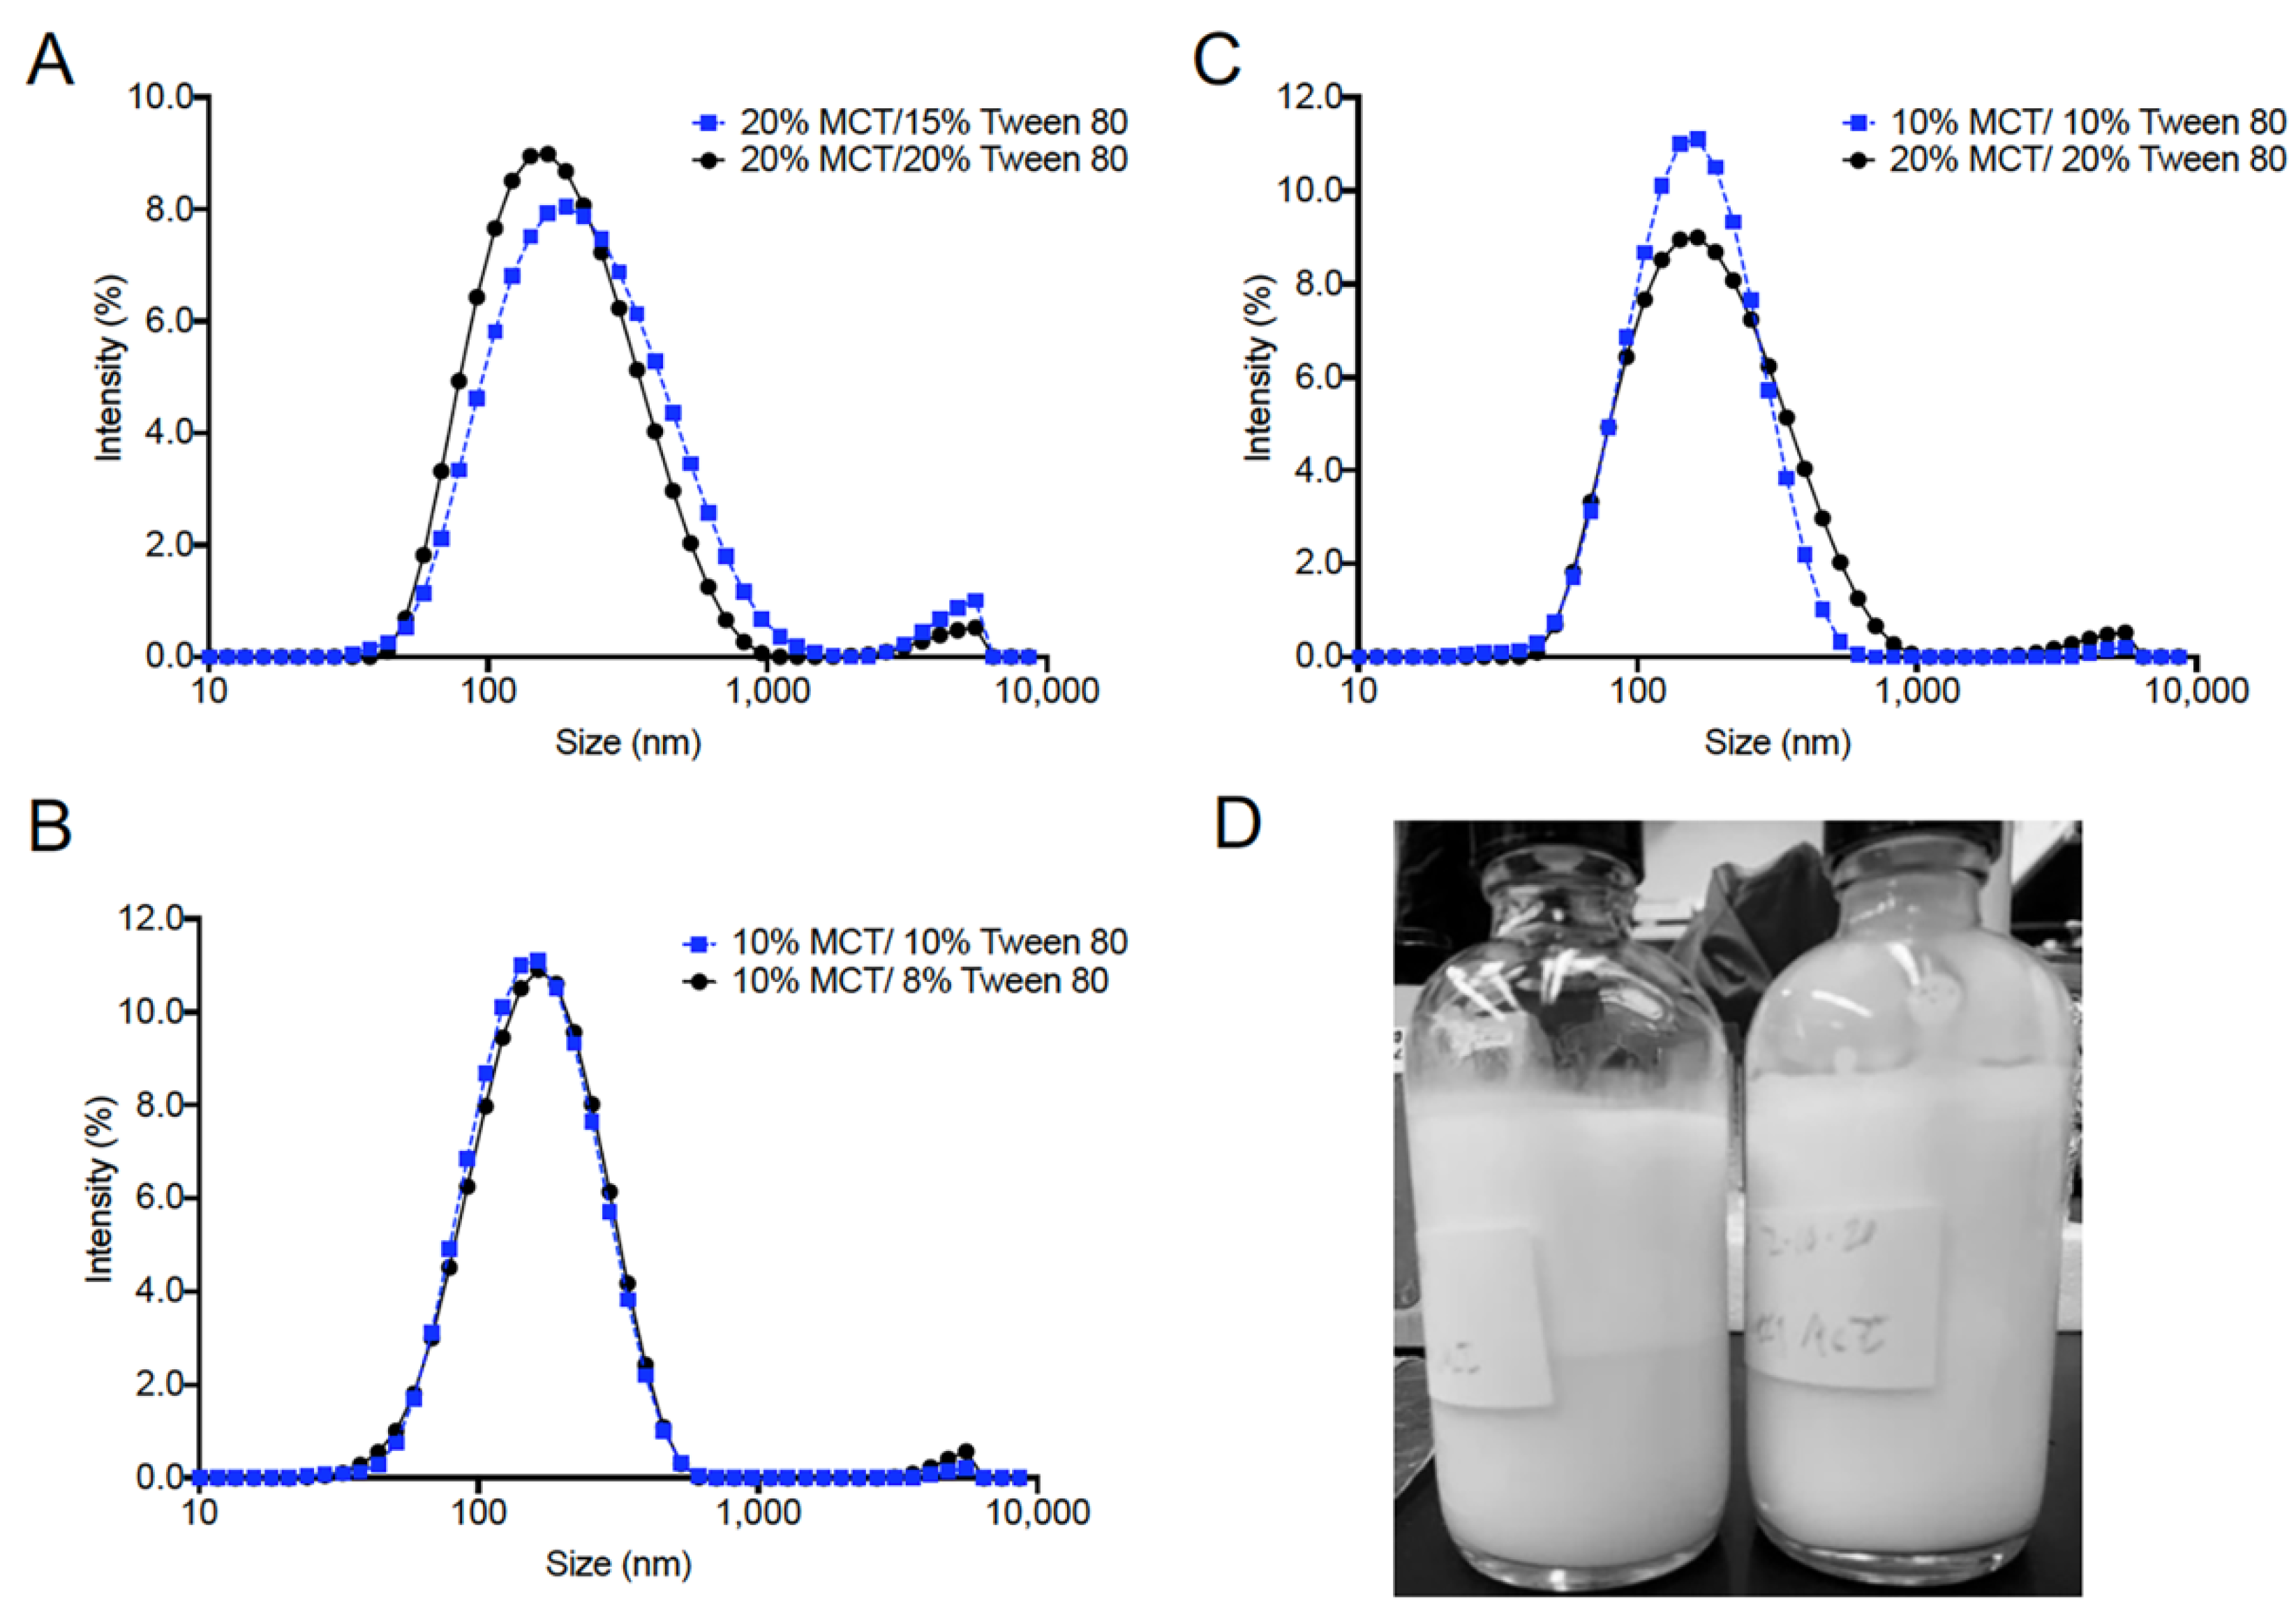
2.4. Dynamic Light Scattering
2.5. Nanoemulsion Stability Testing
2.5.1. Centrifugal Force Stability
2.5.2. Serum Stability
2.5.3. Thermal Stability
2.6. Drug Free Nanoemulsion Production
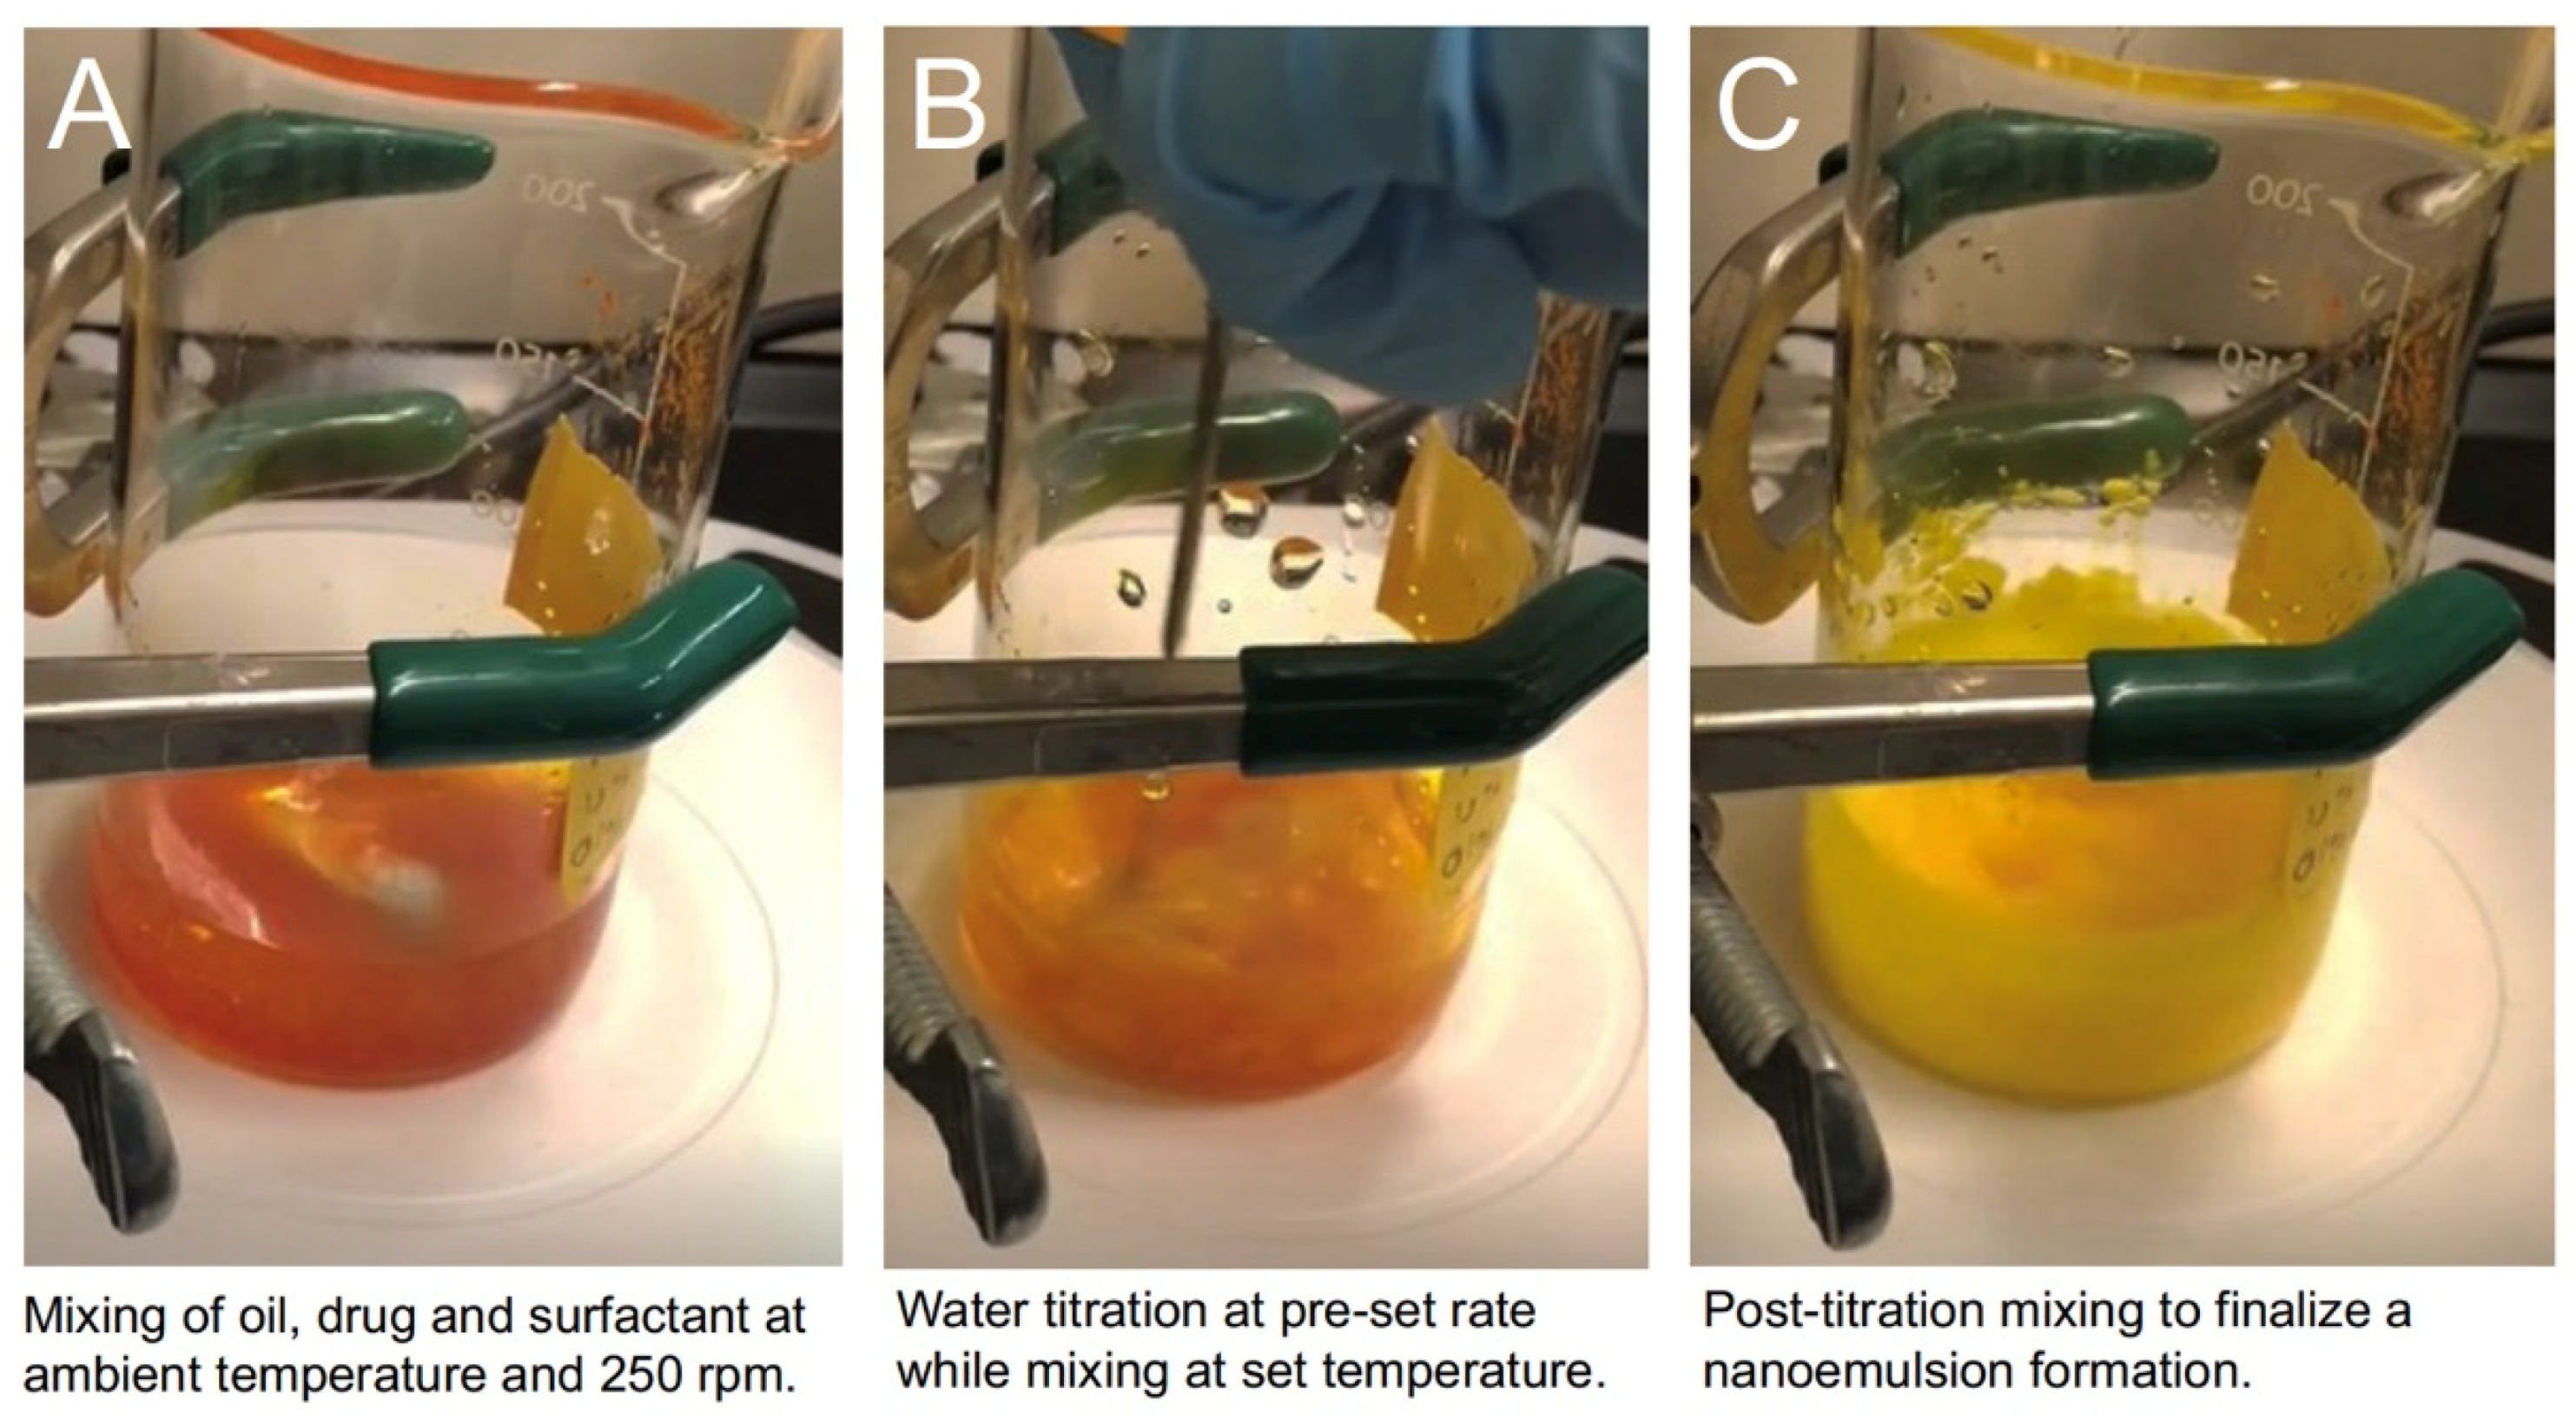
2.7. Manufacture and Scale-up of CUR-Loaded Nanoemulsion
2.8. CUR Drug Content by High Performance Liquid Chromatography (HPLC)
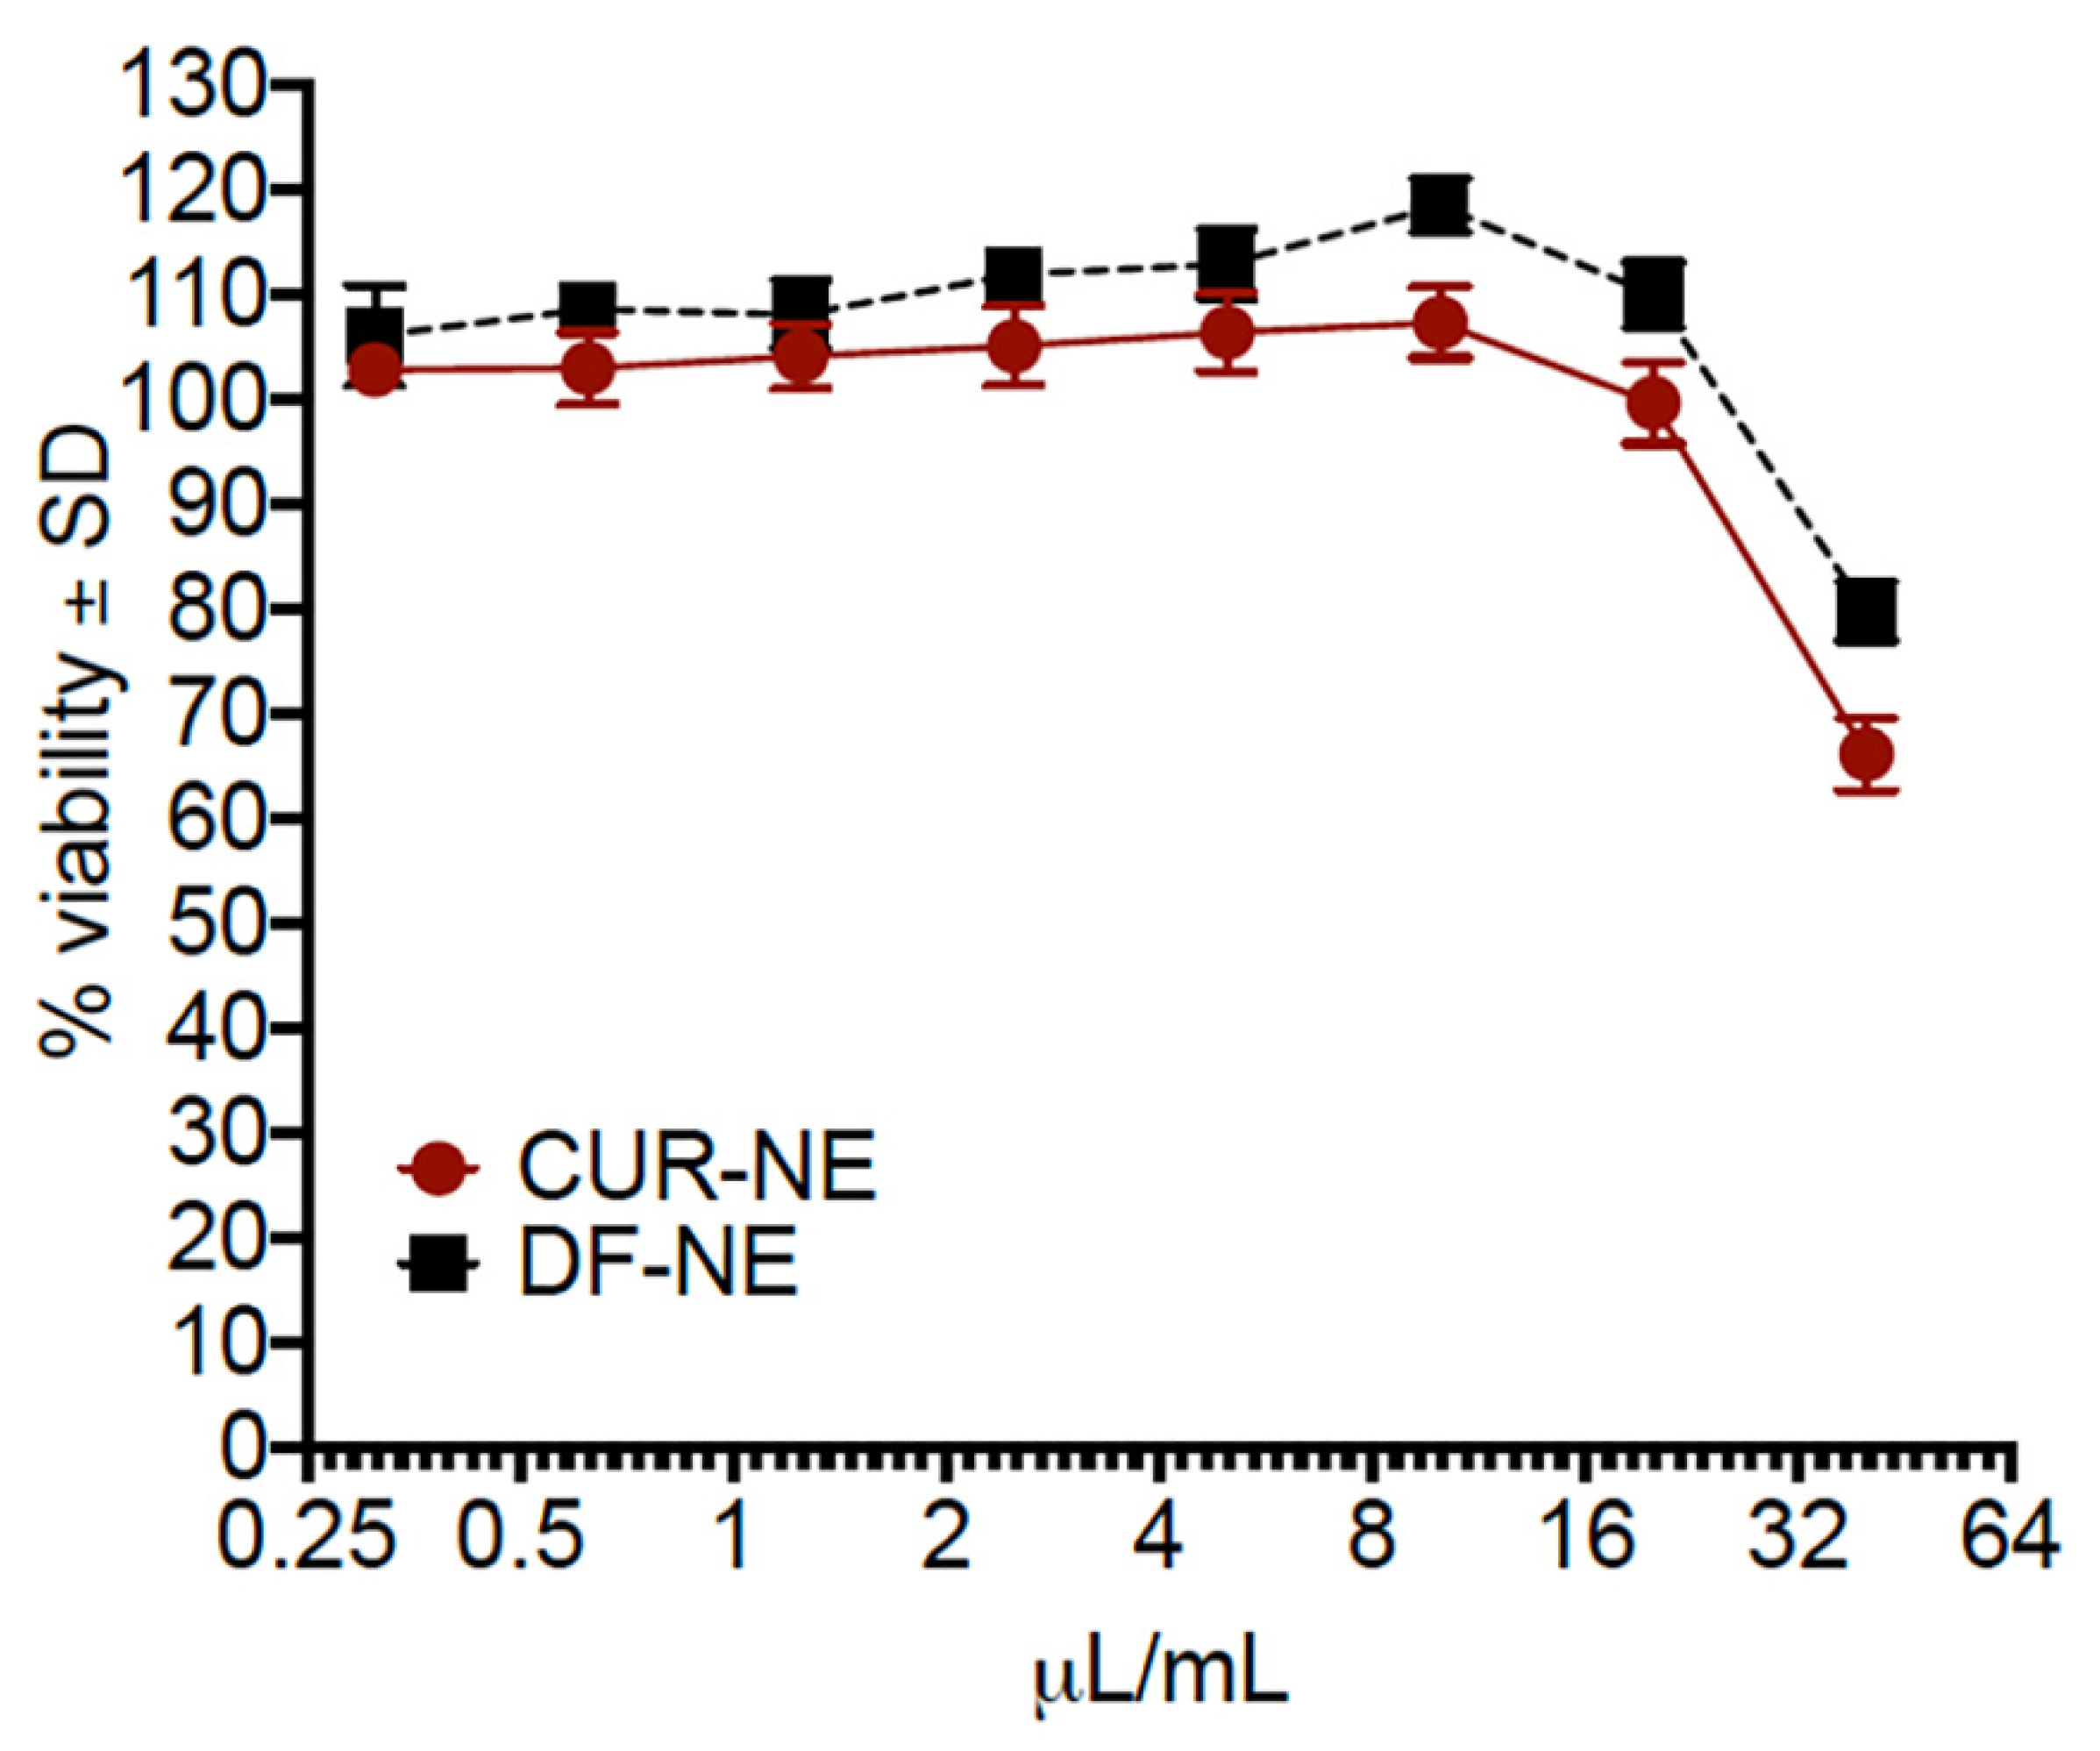
2.9. Cell Viability
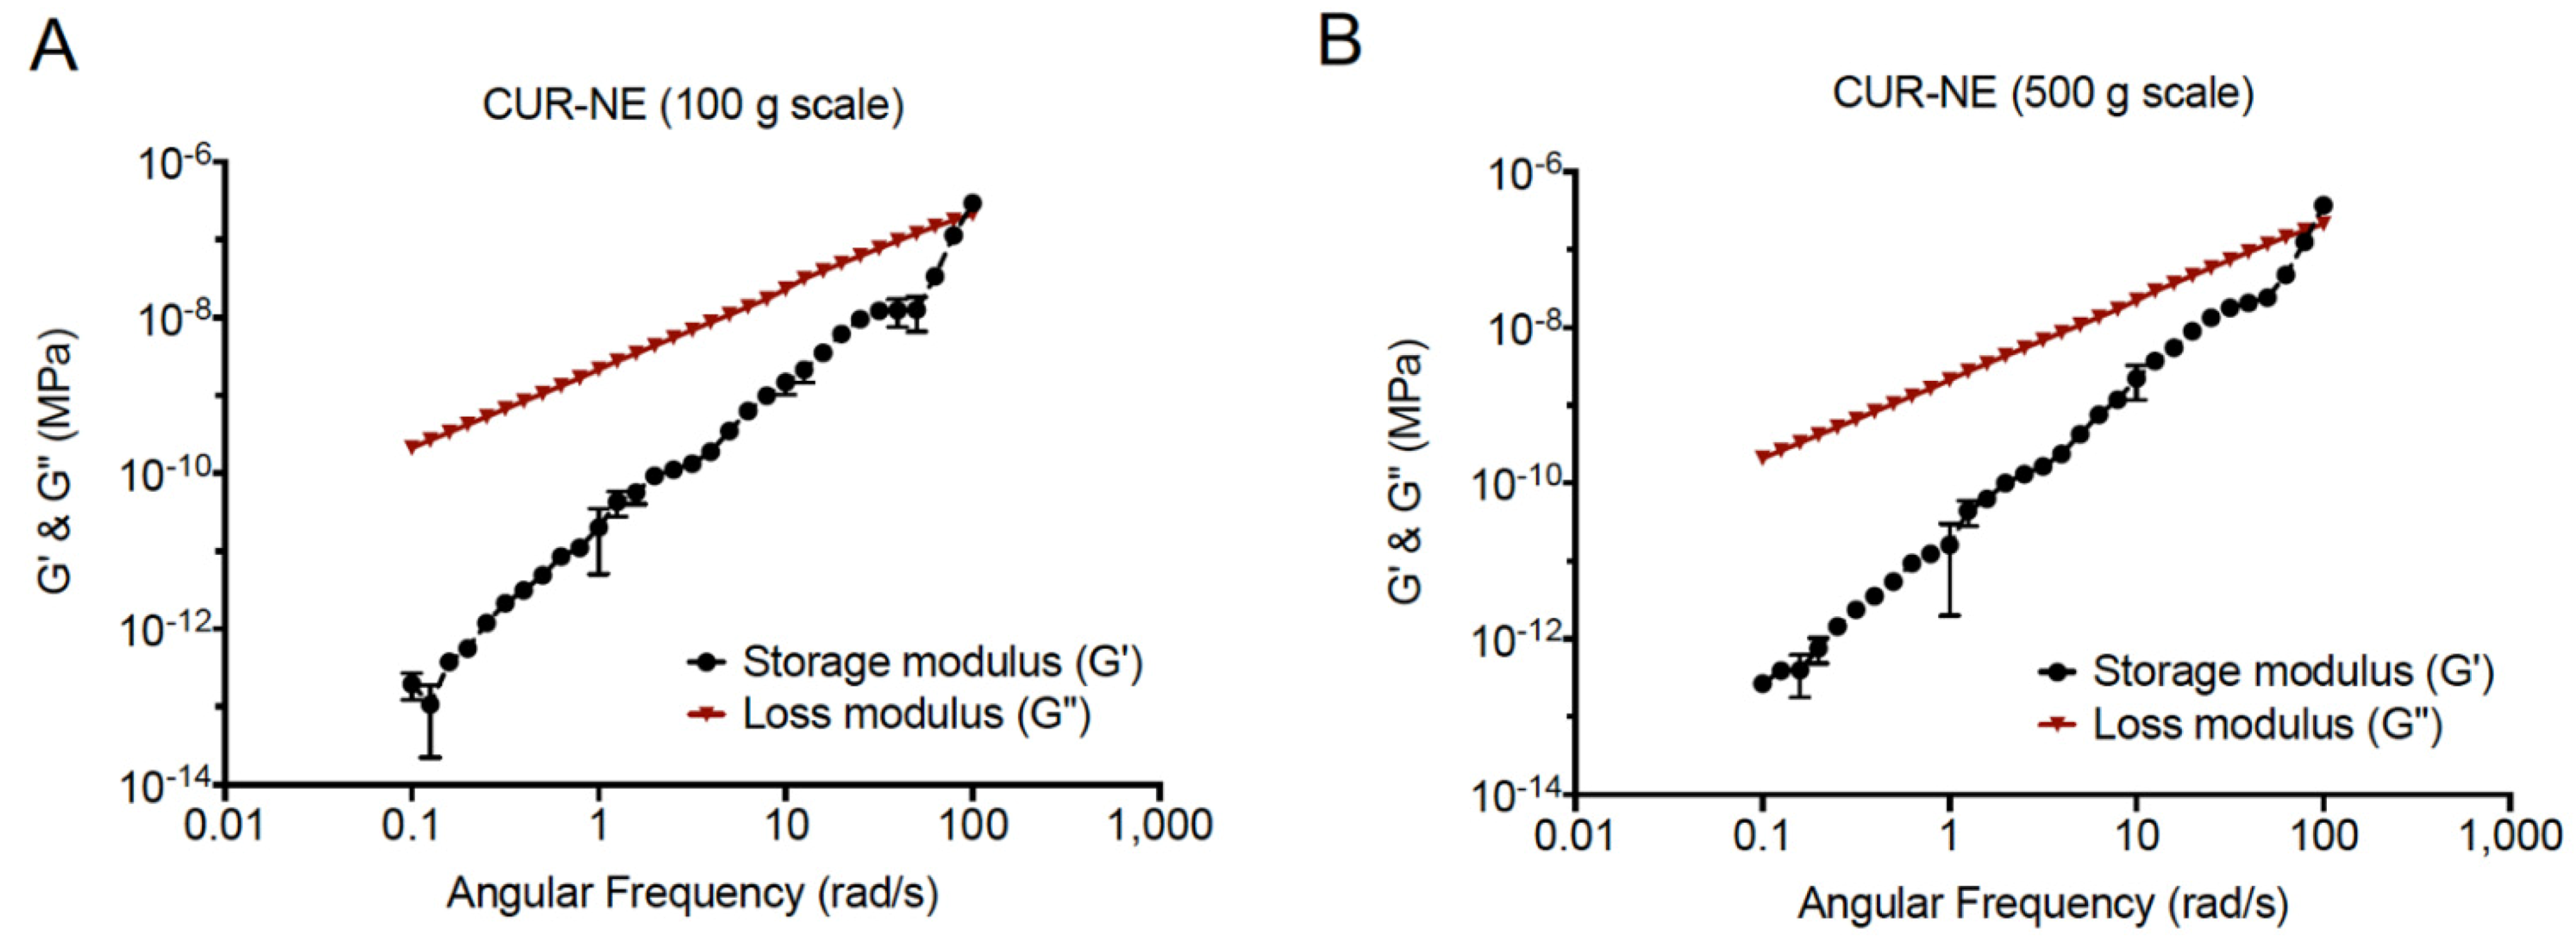
2.10. Rheology
3. Results
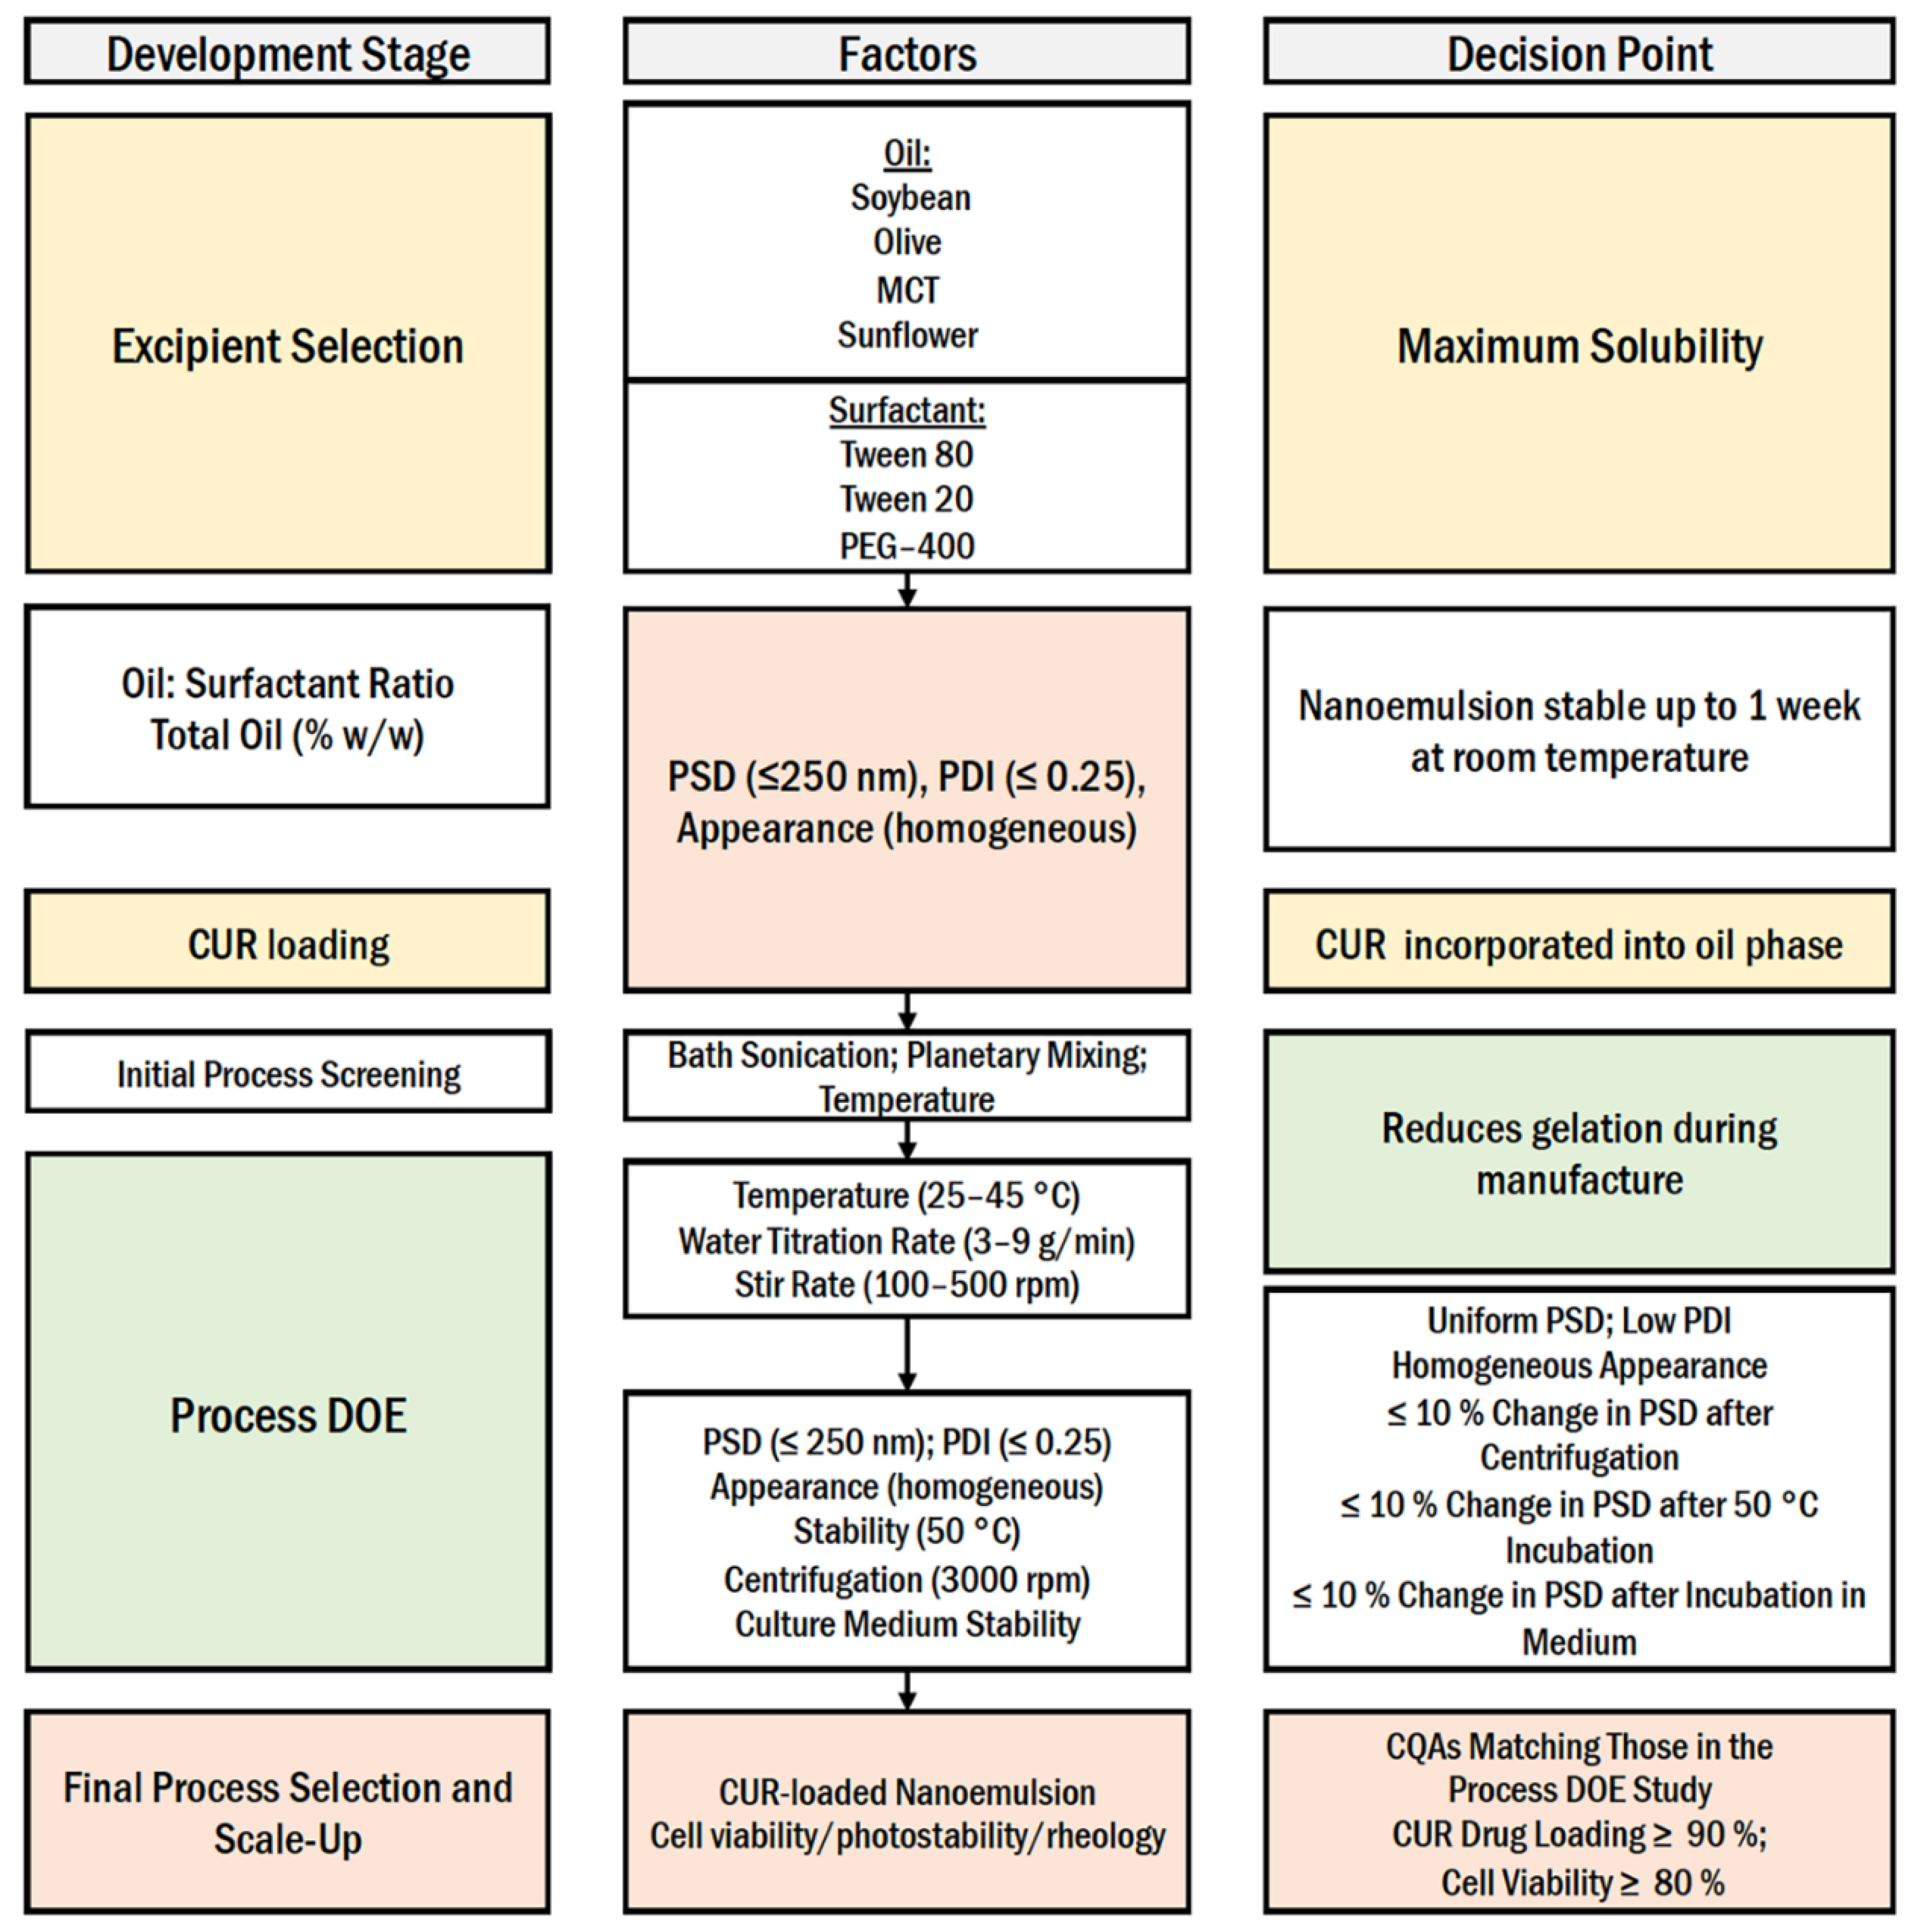
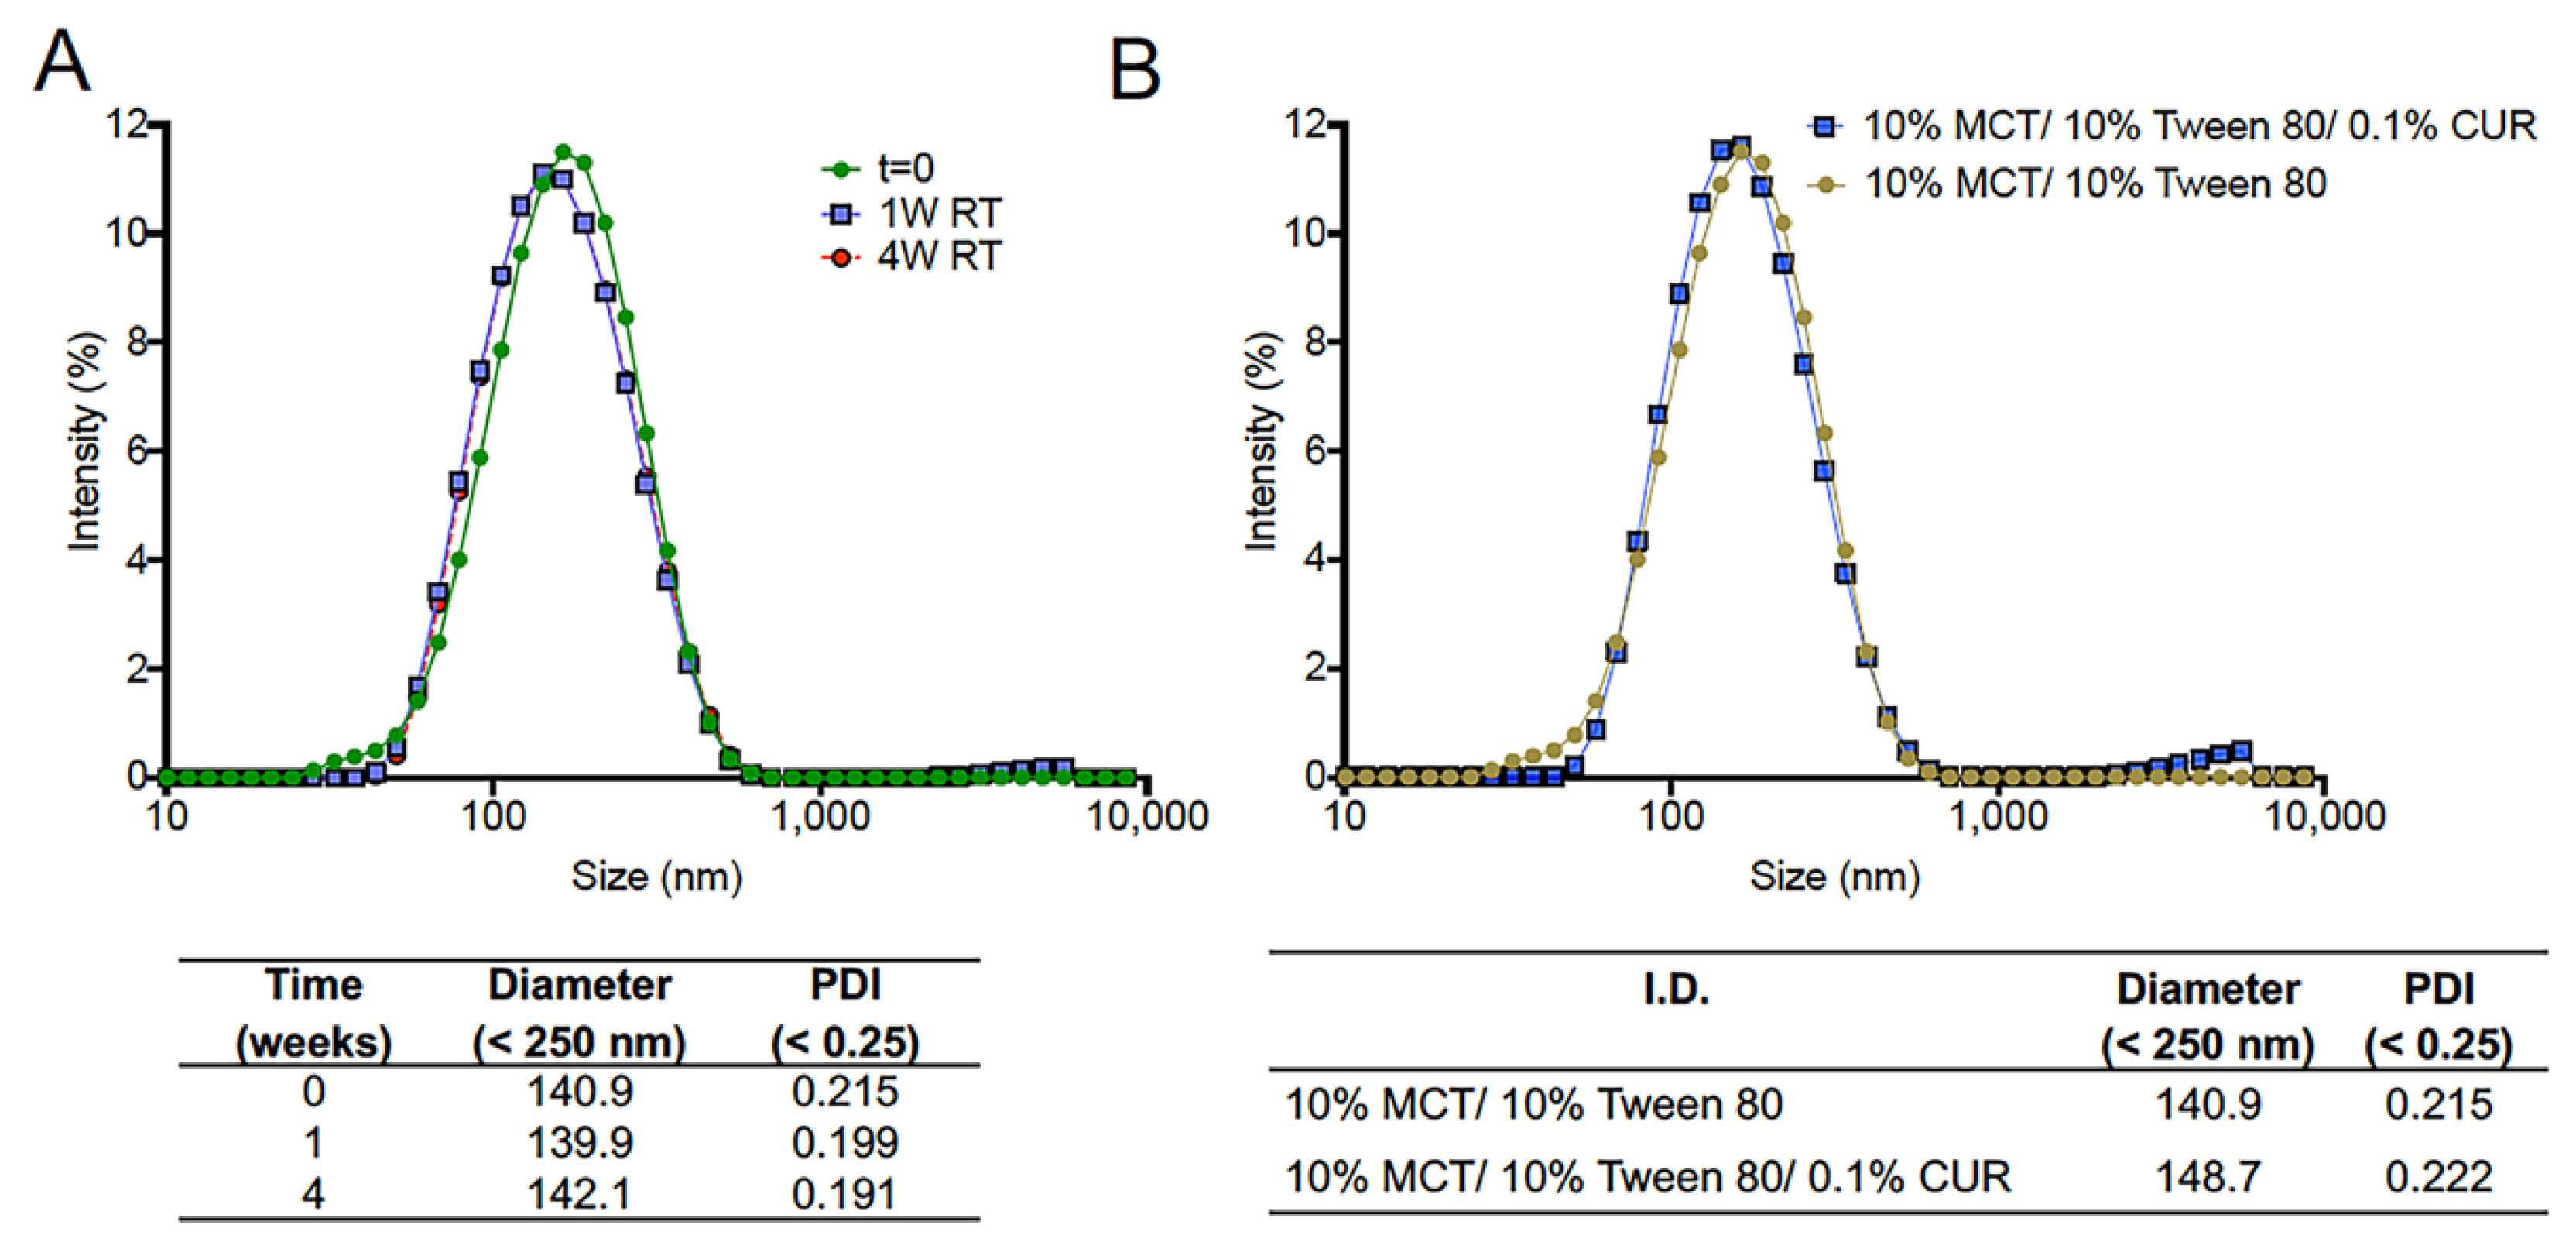
3.1. Excipient Selection and Formulation Development
3.2. Initial Process Screening
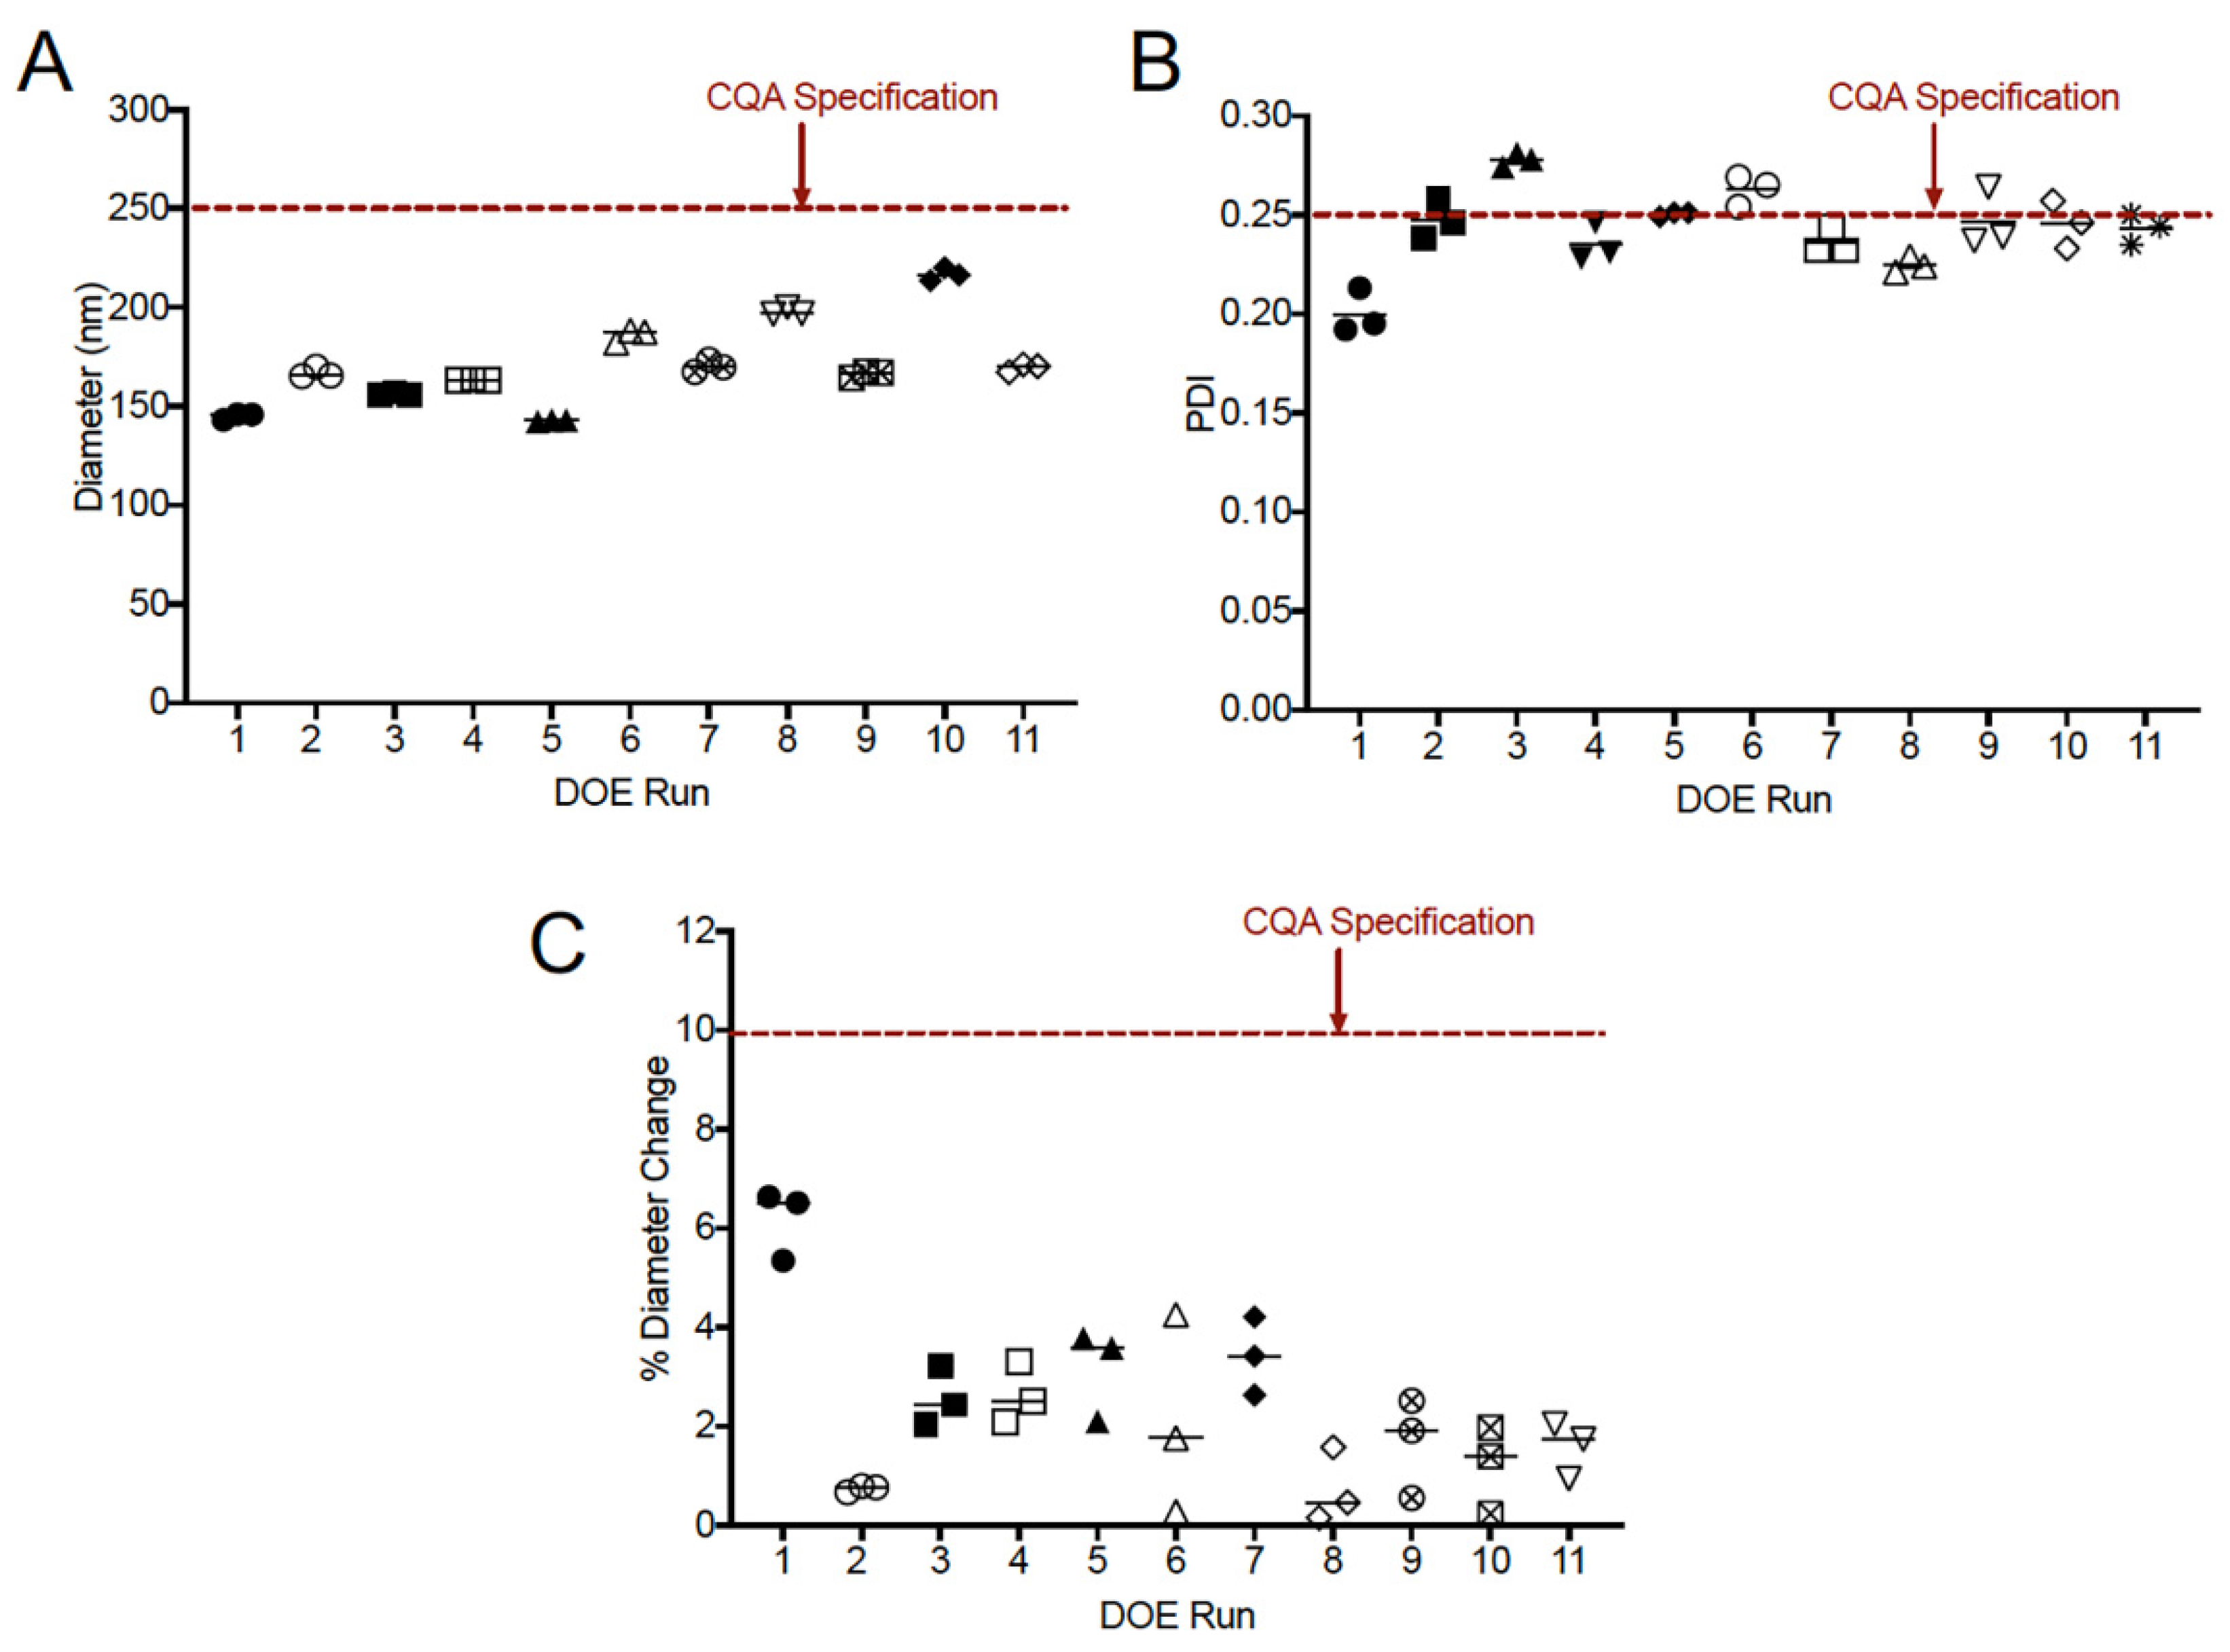
3.3. Selection of Critical Quality Attributes and Design of Experiments
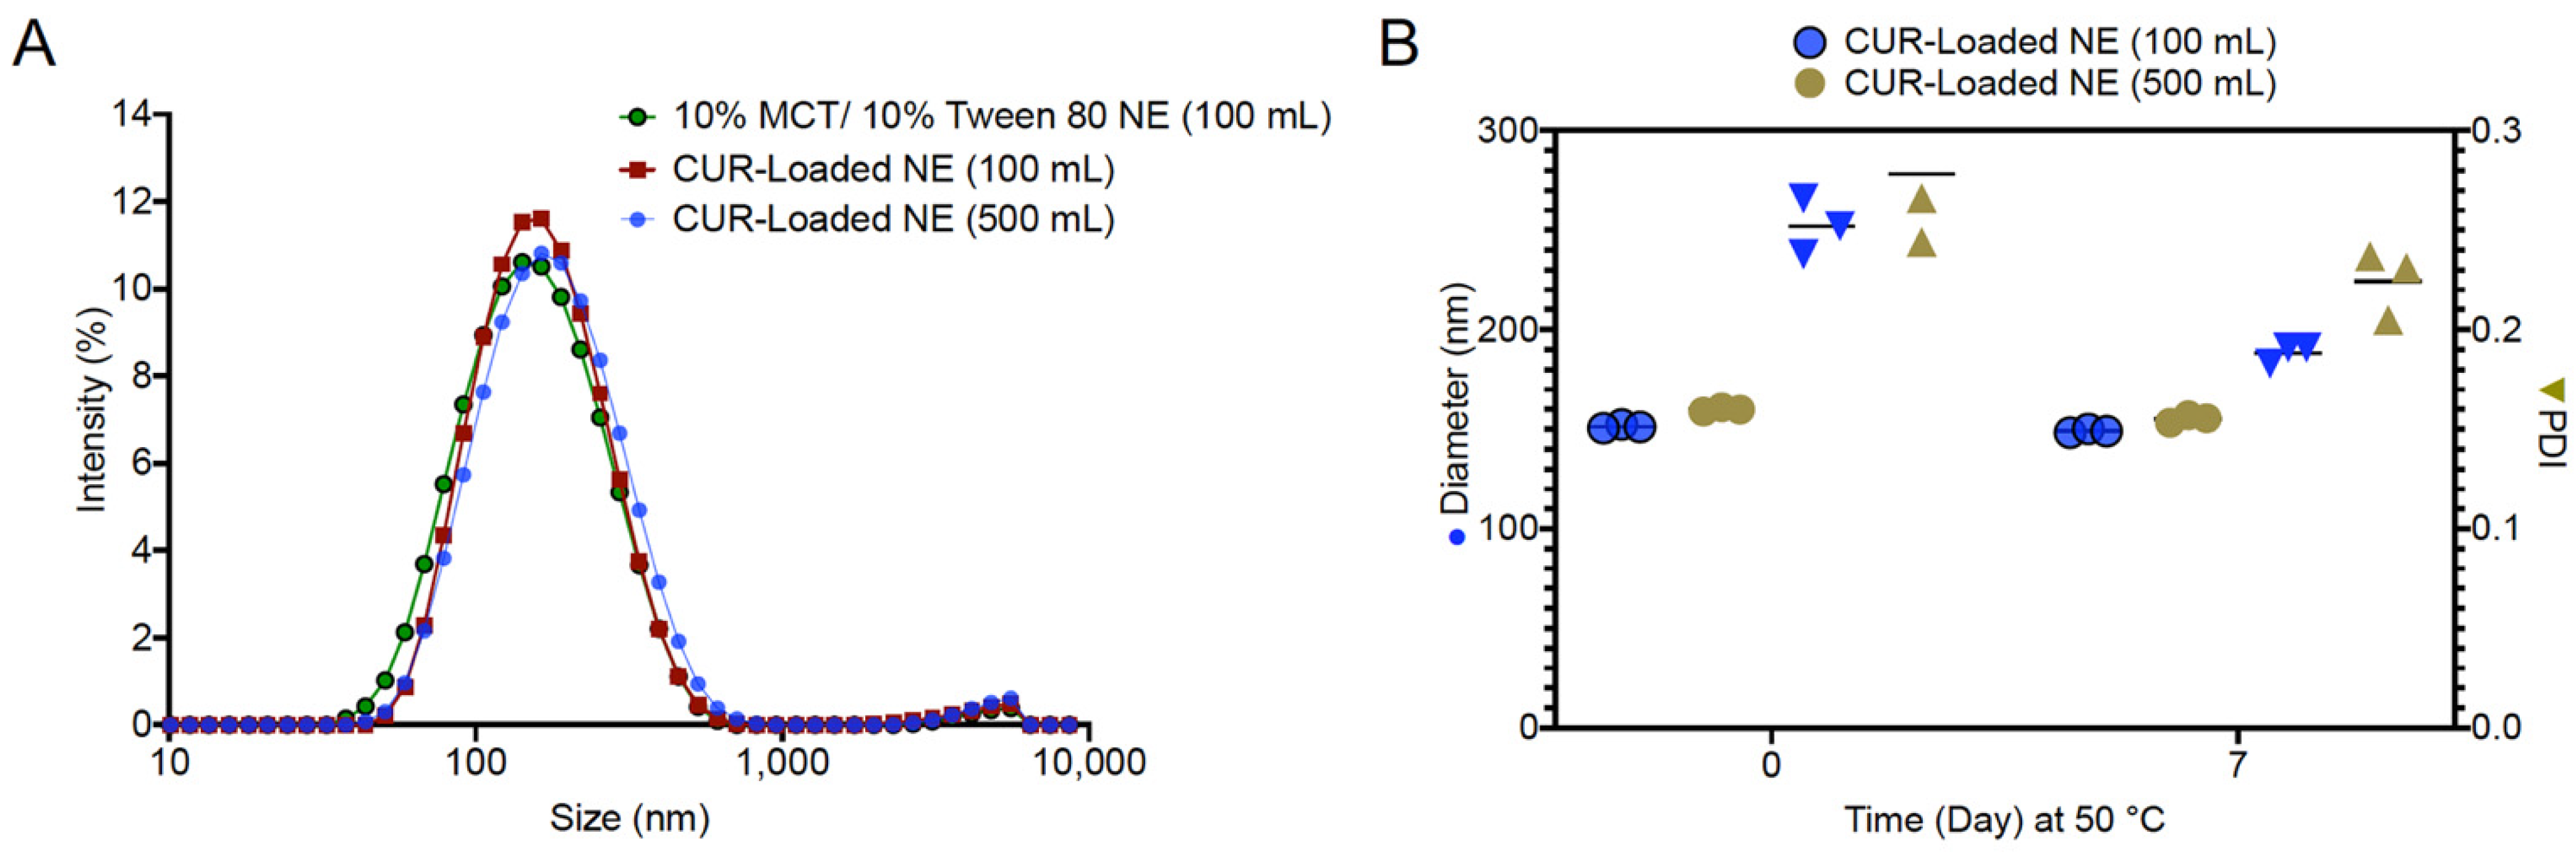
3.4. Manufacture and Scale-up of CUR Nanoemulsion
3.5. Cell Viability Assays
3.6. Rheological Behavior of Curcumin Nanoemulsions
4. Discussion
5. Conclusions
Supplementary Materials
Author Contributions
Funding
Data Availability Statement
Conflicts of Interest
References
- Tayyem, R.F.; Heath, D.D.; Al-Delaimy, W.K.; Rock, C.L. Curcumin content of turmeric and curry powders. Nutr. Cancer 2006, 55, 126–131. [Google Scholar] [CrossRef] [PubMed]
- Gera, M.; Sharma, N.; Ghosh, M.; Huynh, D.L.; Lee, S.J.; Min, T.; Kwon, T.; Jeong, D.K. Nanoformulations of curcumin: An emerging paradigm for improved remedial application. Oncotarget 2017, 8, 66680–66698. [Google Scholar] [CrossRef] [PubMed] [Green Version]
- Gupta, S.C.; Patchva, S.; Aggarwal, B.B. Therapeutic roles of curcumin: Lessons learned from clinical trials. AAPS J. 2013, 15, 195–218. [Google Scholar] [CrossRef] [Green Version]
- Hussain, T.; Tan, B.; Yin, Y.; Blachier, F.; Tossou, M.C.; Rahu, N. Oxidative stress and inflammation: What polyphenols can do for us? Oxidative Med. Cell. Longev. 2016, 2016, 7432797. [Google Scholar] [CrossRef] [PubMed] [Green Version]
- Sahebkar, A.; Serban, M.-C.; Ursoniu, S.; Banach, M. Effect of curcuminoids on oxidative stress: A systematic review and meta-analysis of randomized controlled trials. J. Funct. Foods 2015, 18, 898–909. [Google Scholar] [CrossRef]
- Sintov, A.C. Transdermal delivery of curcumin via microemulsion. Int. J. Pharm. 2015, 481, 97–103. [Google Scholar] [CrossRef] [PubMed]
- Basu, P.; Maier, C.; Basu, A. Effects of Curcumin and Its Different Formulations in Preclinical and Clinical Studies of Peripheral Neuropathic and Postoperative Pain: A Comprehensive Review. Int. J. Mol. Sci. 2021, 22, 4666. [Google Scholar] [CrossRef] [PubMed]
- Zielińska, A.; Alves, H.; Marques, V.; Durazzo, A.; Lucarini, M.; Alves, T.F.; Morsink, M.; Willemen, N.; Eder, P.; Chaud, M.V. Properties, extraction methods, and delivery systems for curcumin as a natural source of beneficial health effects. Medicina 2020, 56, 336. [Google Scholar] [CrossRef]
- Ak, T.; Gülçin, İ. Antioxidant and radical scavenging properties of curcumin. Chem. Biol. Interact. 2008, 174, 27–37. [Google Scholar] [CrossRef]
- Biswas, S.K. Does the interdependence between oxidative stress and inflammation explain the antioxidant paradox? Oxidative Med. Cell. Longev. 2016, 2016, 5698931. [Google Scholar] [CrossRef] [Green Version]
- Hewlings, S.J.; Kalman, D.S. Curcumin: A review of its effects on human health. Foods 2017, 6, 92. [Google Scholar] [CrossRef]
- Anand, P.; Kunnumakkara, A.B.; Newman, R.A.; Aggarwal, B.B. Bioavailability of curcumin: Problems and promises. Mol. Pharm. 2007, 4, 807–818. [Google Scholar] [CrossRef]
- Gately, S.T.; Triezenberg, S.J.; Wang, T. Solid Forms of Curcumin. U.S. Patent 9,447,050, 20 September 2016. [Google Scholar]
- Metzler, M.; Pfeiffer, E.; Schulz, S.I.; Dempe, J.S. Curcumin uptake and metabolism. Biofactors 2013, 39, 14–20. [Google Scholar] [CrossRef] [PubMed]
- Suresh, K.; Nangia, A. Curcumin: Pharmaceutical solids as a platform to improve solubility and bioavailability. Cryst. Eng. Comm. 2018, 20, 3277–3296. [Google Scholar] [CrossRef]
- Iurciuc-Tincu, C.-E.; Atanase, L.I.; Ochiuz, L.; Jérôme, C.; Sol, V.; Martin, P.; Popa, M. Curcumin-loaded polysaccharides-based complex particles obtained by polyelectrolyte complexation and ionic gelation. I-Particles obtaining and characterization. Int. J. Biol. Macromol. 2020, 147, 629–642. [Google Scholar] [CrossRef]
- Atanase, L.I.; Jérôme, C.; Sol, V.; Martin, P.; Popa, M.; Ochiuz, L. Polysaccharides-Based Complex Particles’ Protective Role on the Stability and Bioactivity of Immobilized Curcumin. Int. J. Mol. Sci. 2021, 22, 3075. [Google Scholar]
- Iurciuc-Tincu, C.-E.; Cretan, M.S.; Purcar, V.; Popa, M.; Daraba, O.M.; Atanase, L.I.; Ochiuz, L. Drug delivery system based on pH-sensitive biocompatible poly (2-vinyl pyridine)-b-poly (ethylene oxide) nanomicelles loaded with curcumin and 5-fluorouracil. Polymers 2020, 12, 1450. [Google Scholar] [CrossRef] [PubMed]
- Anjana, D.; Nair, K.A.; Somashekara, N.; Venkata, M.; Sripathy, R.; Yelucheri, R.; Parmar, H.; Upadhyay, R.; Verma, S.R.; Ramchand, C. Development of curcumin based ophthalmic formulation. Am. J. Infect. Dis. 2012, 8, 41–49. [Google Scholar] [CrossRef] [Green Version]
- Kim, S.-H.; Ji, Y.-S.; Lee, E.-S.; Hong, S.-T. Ostwald ripening stability of curcumin-loaded MCT nanoemulsion: Influence of various emulsifiers. Prev. Nutr. food Sci. 2016, 21, 289. [Google Scholar] [CrossRef] [PubMed] [Green Version]
- Ma, P.; Zeng, Q.; Tai, K.; He, X.; Yao, Y.; Hong, X.; Yuan, F. Development of stable curcumin nanoemulsions: Effects of emulsifier type and surfactant-to-oil ratios. J. Food Sci. Technol. 2018, 55, 3485–3497. [Google Scholar] [CrossRef] [PubMed]
- Marin, E.; Briceno, M.; George, C. Method to produce curcumin oil-in-water nanoemulsions as templates for drug carriers. J. Biotechnol. Biomater. 2016, 6, 1–8. [Google Scholar]
- Nikolic, I.; Lunter, D.J.; Randjelovic, D.; Zugic, A.; Tadic, V.; Markovic, B.; Cekic, N.; Zivkovic, L.; Topalovic, D.; Spremo-Potparevic, B. Curcumin-loaded low-energy nanoemulsions as a prototype of multifunctional vehicles for different administration routes: Physicochemical and in vitro peculiarities important for dermal application. Int. J. Pharm. 2018, 550, 333–346. [Google Scholar] [CrossRef]
- Nikolic, I.; Mitsou, E.; Pantelic, I.; Randjelovic, D.; Markovic, B.; Papadimitriou, V.; Xenakis, A.; Lunter, D.J.; Zugic, A.; Savic, S. Microstructure and biopharmaceutical performances of curcumin-loaded low-energy nanoemulsions containing eucalyptol and pinene: Terpenes’ role overcome penetration enhancement effect? Eur. J. Pharm. Sci. 2020, 142, 105135. [Google Scholar] [CrossRef]
- Borrin, T.R.; Georges, E.L.; Moraes, I.C.; Pinho, S.C. Curcumin-loaded nanoemulsions produced by the emulsion inversion point (EIP) method: An evaluation of process parameters and physico-chemical stability. J. Food Eng. 2016, 169, 1–9. [Google Scholar] [CrossRef]
- Kharat, M.; Du, Z.; Zhang, G.; McClements, D.J. Physical and chemical stability of curcumin in aqueous solutions and emulsions: Impact of pH, temperature, and molecular environment. J. Agric. Food Chem. 2017, 65, 1525–1532. [Google Scholar] [CrossRef] [PubMed]
- Shaker, D.S.; Ishak, R.A.; Ghoneim, A.; Elhuoni, M.A. Nanoemulsion: A review on mechanisms for the transdermal delivery of hydrophobic and hydrophilic drugs. Sci. Pharm. 2019, 87, 17. [Google Scholar] [CrossRef] [Green Version]
- Ahmad, N.; Ahmad, R.; Al-Qudaihi, A.; Alaseel, S.E.; Fita, I.Z.; Khalid, M.S.; Pottoo, F.H. Preparation of a novel curcumin nanoemulsion by ultrasonication and its comparative effects in wound healing and the treatment of inflammation. RSC Adv. 2019, 9, 20192–20206. [Google Scholar] [CrossRef] [Green Version]
- Rachmawati, H.; Budiputra, D.K.; Mauludin, R. Curcumin nanoemulsion for transdermal application: Formulation and evaluation. Drug Dev. Ind. Pharm. 2015, 41, 560–566. [Google Scholar] [CrossRef] [PubMed]
- Bilbao-Sáinz, C.; Avena-Bustillos, R.J.; Wood, D.F.; Williams, T.G.; McHugh, T.H. Nanoemulsions prepared by a low-energy emulsification method applied to edible films. J. Agric. Food Chem. 2010, 58, 11932–11938. [Google Scholar] [CrossRef]
- Santana, R.; Perrechil, F.; Cunha, R. High-and low-energy emulsifications for food applications: A focus on process parameters. Food Eng. Rev. 2013, 5, 107–122. [Google Scholar] [CrossRef]
- Solans, C.; Solé, I. Nano-emulsions: Formation by low-energy methods. Curr. Opin. Colloid Interface Sci. 2012, 17, 246–254. [Google Scholar] [CrossRef]
- Ostertag, F.; Weiss, J.; McClements, D.J. Low-energy formation of edible nanoemulsions: Factors influencing droplet size produced by emulsion phase inversion. J. Colloid Interface Sci. 2012, 388, 95–102. [Google Scholar] [CrossRef]
- Komaiko, J.S.; McClements, D.J. Formation of food-grade nanoemulsions using low-energy preparation methods: A review of available methods. Compr. Rev. Food Sci. Food Saf. 2016, 15, 331–352. [Google Scholar] [CrossRef]
- Janjic, J.M.; Shao, P.; Zhang, S.; Yang, X.; Patel, S.K.; Bai, M. Perfluorocarbon nanoemulsions with fluorescent, colloidal and magnetic properties. Biomaterials 2014, 35, 4958–4968. [Google Scholar] [CrossRef] [Green Version]
- Herneisey, M.; Lambert, E.; Kachel, A.; Shychuck, E.; Drennen, J.K.; Janjic, J.M. Quality by design approach using multiple linear and logistic regression modeling enables microemulsion scale up. Molecules 2019, 24, 2066. [Google Scholar] [CrossRef] [Green Version]
- Liu, L.; Bagia, C.; Janjic, J.M. The first scale-up production of theranostic nanoemulsions. BioResearch Open Access 2015, 4, 218–228. [Google Scholar] [CrossRef] [Green Version]
- TA Instruments. Understanding Rheology of Structured Fluids. Available online: http://www.tainstruments.com/pdf/literature/AAN016_V1_U_StructFluids.pdf (accessed on 24 May 2021).
- Lambert, E.; Janjic, J.M. Quality by design approach identifies critical parameters driving oxygen delivery performance in vitro for perfluorocarbon based artificial oxygen carriers. Sci. Rep. 2021, 11, 5569. [Google Scholar] [CrossRef]
- Herneisey, M.; Liu, L.; Lambert, E.; Schmitz, N.; Loftus, S.; Janjic, J.M. Development of Theranostic Perfluorocarbon Nanoemulsions as a Model Non-Opioid Pain Nanomedicine Using a Quality by Design (QbD) Approach. AAPS Pharm. Sci. Tech. 2019, 20, 65. [Google Scholar] [CrossRef]
- Sagitani, H. Making homogeneous and fine droplet O/W emulsions using nonionic surfactants. J. Am. Oil Chem. Soc. 1981, 58, 738–743. [Google Scholar] [CrossRef]
- Maestro, A.; Solè, I.; González, C.; Solans, C.; Gutiérrez, J.M. Influence of the phase behavior on the properties of ionic nanoemulsions prepared by the phase inversion composition method. J. Colloid Interface Sci. 2008, 327, 433–439. [Google Scholar] [CrossRef]
- Arechabala, B.; Coiffard, C.; Rivalland, P.; Coiffard, L.; Roeck-Holtzhauer, Y.D. Comparison of cytotoxicity of various surfactants tested on normal human fibroblast cultures using the neutral red test, MTT assay and LDH release. J. Appl. Toxicol. 1999, 19, 163–165. [Google Scholar] [CrossRef]
- Solè, I.; Pey, C.M.; Maestro, A.; González, C.; Porras, M.; Solans, C.; Gutiérrez, J.M. Nano-emulsions prepared by the phase inversion composition method: Preparation variables and scale up. J. Colloid Interface Sci. 2010, 344, 417–423. [Google Scholar] [CrossRef]
- Nishitani Yukuyama, M.; Tomiko Myiake Kato, E.; Lobenberg, R.; Araci Bou-Chacra, N. Challenges and future prospects of nanoemulsion as a drug delivery system. Curr. Pharm. Des. 2017, 23, 495–508. [Google Scholar] [CrossRef] [PubMed]
- U.S. Food and Drug Administration Inactive Ingredient Database. Available online: https://www.accessdata.fda.gov/scripts/cder/iig/index.cfm?event=BasicSearch.page (accessed on 14 May 2021).


| DOE Runs | MCT Oil (g) | Tween 80 (g) | Water (g) | Temperature (°C) | Titration Rate (g/min) | Stir Rate (rpm) |
|---|---|---|---|---|---|---|
| 1 | 10 | 10 | 80 | 25 | 3 | 100 |
| 2 | 10 | 10 | 80 | 45 | 9 | 500 |
| 3 | 10 | 10 | 80 | 25 | 9 | 500 |
| 4 | 10 | 10 | 80 | 35 | 6 | 300 |
| 5 | 10 | 10 | 80 | 25 | 9 | 100 |
| 6 | 10 | 10 | 80 | 45 | 3 | 100 |
| 7 | 10 | 10 | 80 | 45 | 9 | 100 |
| 8 | 10 | 10 | 80 | 25 | 3 | 500 |
| 9 | 10 | 10 | 80 | 35 | 6 | 300 |
| 10 | 10 | 10 | 80 | 45 | 3 | 500 |
| 11 | 10 | 10 | 80 | 35 | 6 | 300 |
| CQA (Specification) | |||||||||
|---|---|---|---|---|---|---|---|---|---|
| Run | Appearance | Diameter (≤250 nm) | PDI (≤0.25) | Centrifugation Diameter Change (≤10%) | Centrifugation PDI (≤0.25) | 1 W 50 °C Diameter Change (≤10%) | 1 W 50 °C PDI (≤0.25) | Cell Culture Diameter Change (≤10%) | Cell Culture PDI (≤0.30) |
| 1 | Homogenous | 145.03 | 0.200 | 0.712 | 0.183 | 6.160 | 0.152 | 9.400 | 0.212 |
| 2 | Homogenous | 166.97 | 0.247 | 2.815 | 0.228 | 0.299 | 0.229 | 1.717 | 0.251 |
| 3 | Homogenous | 156.37 | 0.278 | 3.176 | 0.259 | 2.558 | 0.224 | 3.667 | 0.316 |
| 4 * | Homogenous | 163.30 | 0.235 | 6.144 | 0.238 | 2.633 | 0.182 | 2.082 | 0.264 |
| 5 | Homogenous | 142.80 | 0.250 | 4.552 | 0.220 | 3.151 | 0.190 | 3.058 | 0.265 |
| 6 | Homogenous | 186.00 | 0.263 | 4.767 | 0.233 | 1.918 | 0.249 | 0.197 | 0.245 |
| 7 | Homogenous | 170.27 | 0.236 | 4.150 | 0.220 | 3.426 | 0.219 | 0.078 | 0.240 |
| 8 | Homogenous | 197.90 | 0.225 | 3.672 | 0.191 | 0.421 | 0.170 | 5.087 | 0.221 |
| 9 * | Homogenous | 166.33 | 0.247 | 3.146 | 0.226 | 1.303 | 0.171 | 1.202 | 0.264 |
| 10 | Homogenous | 216.70 | 0.245 | 4.507 | 0.313 | 0.108 | 0.237 | 1.615 | 0.232 |
| 11 * | Homogenous | 169.60 | 0.243 | 4.363 | 0.223 | 0.432 | 0.184 | 0.649 | 0.266 |
| Source | Estimate | Standard Error | p-Value |
|---|---|---|---|
| Intercept | 137.93 | 12.02 | <0.0001 |
| Titration rate (g/min) | −4.5508 | 0.9136 | 0.0025 |
| Temp (°C) | 1.2230 | 0.2740 | 0.0043 |
| Stir Rate (rpm) | 0.0587 | 0.0137 | 0.0052 |
| Titration rate (g/min) * Stir Rate (rpm) | −0.0153 | 0.0046 | 0.0156 |
| Formulation Composition | DoE Scale-100 g | Scale-up-500 g |
| MCT Oil (g) | 10.0 | 50.0 |
| Tween 80 (g) | 10.0 | 50.0 |
| Curcumin (g) | 0.1 | 0.5 |
| Water (g) | 79.9 | 399.5 |
| Processing Parameters | DoE Scale-100 g | Scale-up-500 g |
| Temperature (°C) | 25 | 25 |
| Titration Rate (g/min) | 9 | 45 |
| Stir Rate (rpm) | 100 | 300 |
| CQA (Specification) | |||||||||
|---|---|---|---|---|---|---|---|---|---|
| Scale (g) | Diameter (≤250 nm) | PDI (≤0.25) | CUR Loading (≥90%) | Centrifugation Diameter Change (≤10%) | Centrifugation PDI (≤0.25) | 1 W 50 °C Diameter Change (≤10%) | 1 W 50 °C PDI (≤0.25) | Cell Culture Diameter Change (≤10%) | Cell Culture PDI (≤0.30) |
| 100 | 148.73 | 0.22 | 96.29 ± 0.76% | 3.78 | 0.21 | 1.30 | 0.25 | 3.91 | 0.23 |
| 500 | 155.10 | 0.25 | 95.60 ± 0.88% | 4.89 | 0.23 | 0.33 | 0.27 | 4.85 | 0.26 |
Publisher’s Note: MDPI stays neutral with regard to jurisdictional claims in published maps and institutional affiliations. |
© 2021 by the authors. Licensee MDPI, Basel, Switzerland. This article is an open access article distributed under the terms and conditions of the Creative Commons Attribution (CC BY) license (https://creativecommons.org/licenses/by/4.0/).
Share and Cite
Adena, S.K.R.; Herneisey, M.; Pierce, E.; Hartmeier, P.R.; Adlakha, S.; Hosfeld, M.A.I.; Drennen, J.K.; Janjic, J.M. Quality by Design Methodology Applied to Process Optimization and Scale up of Curcumin Nanoemulsions Produced by Catastrophic Phase Inversion. Pharmaceutics 2021, 13, 880. https://doi.org/10.3390/pharmaceutics13060880
Adena SKR, Herneisey M, Pierce E, Hartmeier PR, Adlakha S, Hosfeld MAI, Drennen JK, Janjic JM. Quality by Design Methodology Applied to Process Optimization and Scale up of Curcumin Nanoemulsions Produced by Catastrophic Phase Inversion. Pharmaceutics. 2021; 13(6):880. https://doi.org/10.3390/pharmaceutics13060880
Chicago/Turabian StyleAdena, Sandeep Kumar Reddy, Michele Herneisey, Eric Pierce, Paul R. Hartmeier, Suneera Adlakha, Marco A. I. Hosfeld, James K. Drennen, and Jelena M. Janjic. 2021. "Quality by Design Methodology Applied to Process Optimization and Scale up of Curcumin Nanoemulsions Produced by Catastrophic Phase Inversion" Pharmaceutics 13, no. 6: 880. https://doi.org/10.3390/pharmaceutics13060880