Article

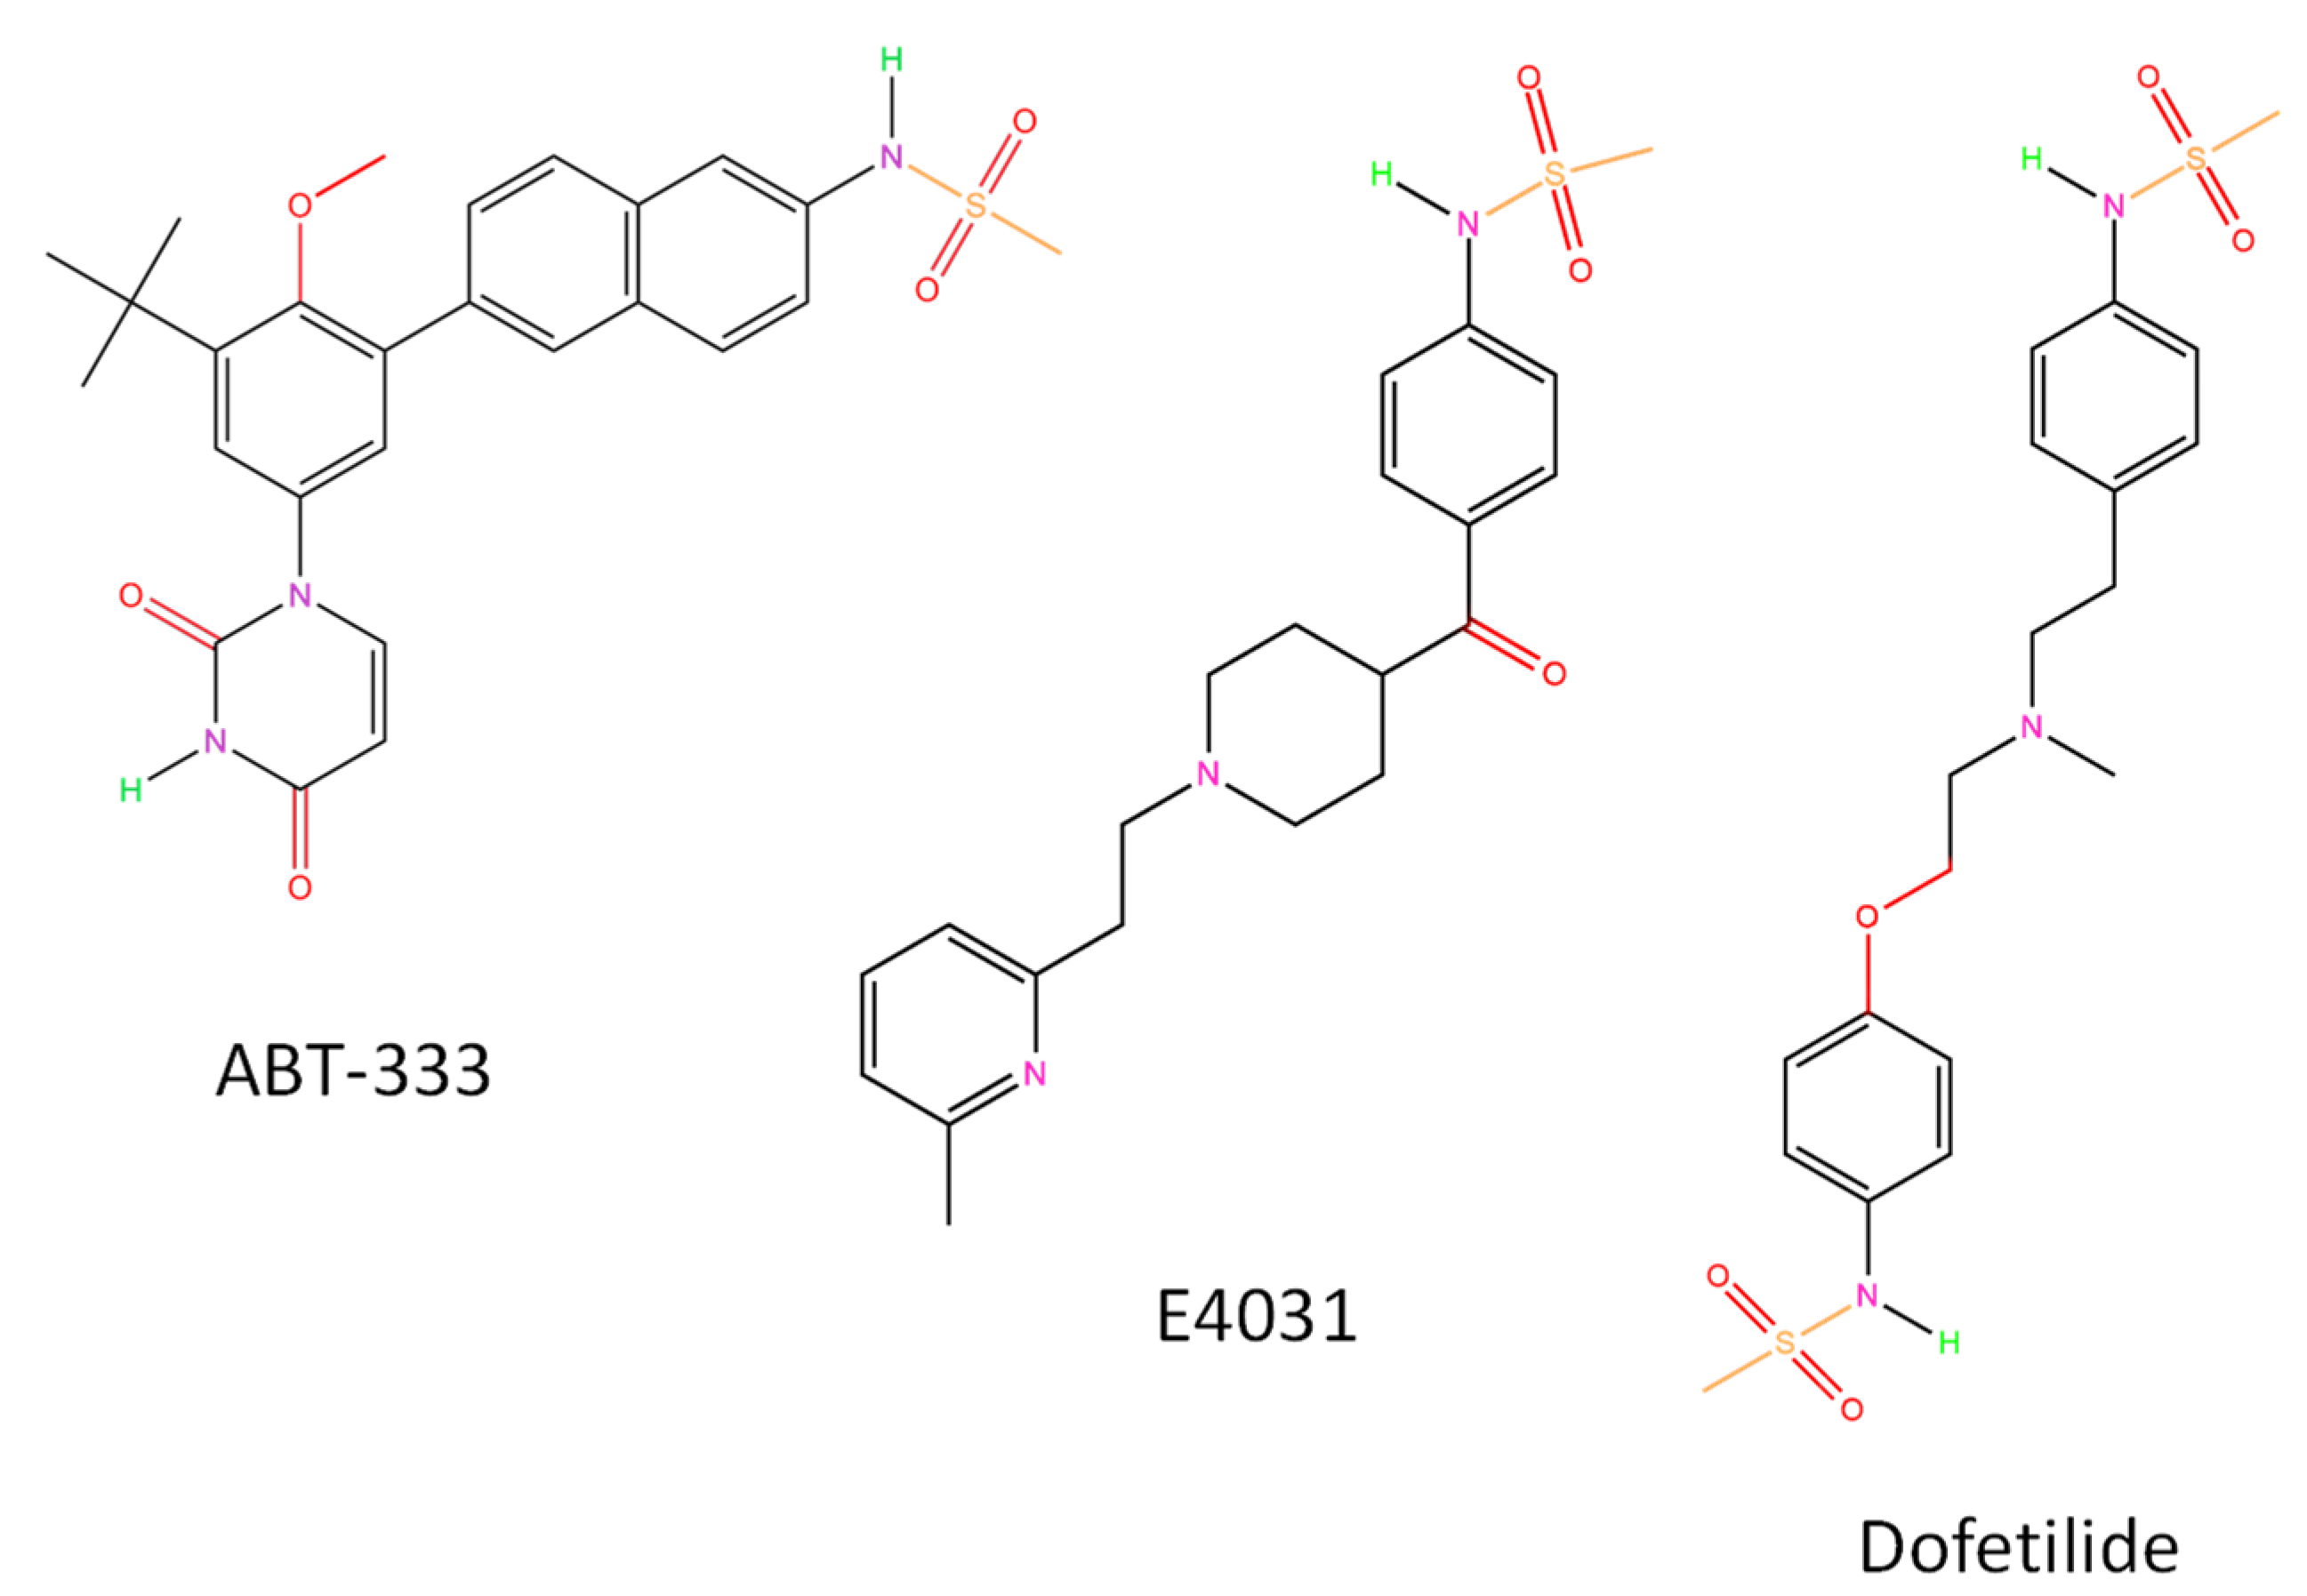
ABT-333 (Dasabuvir) Increases Action Potential Duration and Provokes Early Afterdepolarizations in Canine Left Ventricular Cells via Inhibition of IKr

1
Department of Physiology, Faculty of Medicine, University of Debrecen, H-4032 Debrecen, Hungary
2
Doctoral School of Molecular Medicine, University of Debrecen, H-4032 Debrecen, Hungary
3
Doctoral School of Dental Sciences, University of Debrecen, H-4032 Debrecen, Hungary
4
Division of Sport Physiology, Department of Physiology, Faculty of Medicine, University of Debrecen, H-4032 Debrecen, Hungary
5
Department of Dental Physiology and Pharmacology, Faculty of Dentistry, University of Debrecen, H-4032 Debrecen, Hungary
6
Department of Biophysics and Cell Biology, Faculty of Medicine, University of Debrecen, H-4032 Debrecen, Hungary
7
Department of Basic Medical Sciences, Faculty of Dentistry, University of Debrecen, H-4032 Debrecen, Hungary
*
Author to whom correspondence should be addressed.
These authors contributed equally to the study.
Pharmaceuticals 2023, 16(4), 488; https://doi.org/10.3390/ph16040488
Submission received: 24 January 2023 / Revised: 17 March 2023 / Accepted: 22 March 2023 / Published: 25 March 2023
(This article belongs to the Special Issue New Advances in Antiarrhythmic Drugs)

Abstract

:
ABT-333 (dasabuvir) is an antiviral agent used in hepatitis C treatment. The molecule, similarly to some inhibitors of hERG channels, responsible for the delayed rectifier potassium current (IKr), contains the methanesulfonamide group. Reduced IKr current leads to long QT syndrome and early afterdepolarizations (EADs), therefore potentially causing life-threatening arrhythmias and sudden cardiac death. Our goal was to investigate the acute effects of ABT-333 in enzymatically isolated canine left ventricular myocardial cells. Action potentials (APs) and ion currents were recorded with a sharp microelectrode technique and whole-cell patch clamp, respectively. Application of 1 μM ABT-333 prolonged the AP in a reversible manner. The maximal rates of phases 0 and 1 were irreversibly decreased. Higher ABT-333 concentrations caused larger AP prolongation, elevation of the early plateau potential, and reduction of maximal rates of phases 0, 1, and 3. EADs occurred in some cells in 3–30 μM ABT-333 concentrations. The 10 μM ABT-333-sensitive current, recorded with AP voltage clamp, contained a late outward component corresponding to IKr and an early outward one corresponding to transient outward potassium current (Ito). ABT-333 reduced hERG-channel-mediated ion current in a concentration-dependent, partially reversible manner with a half-inhibitory concentration of 3.2 μM. As the therapeutic plasma concentration of ABT-333 is 1 nM, the arrhythmic risk of ABT-333 is very low, even in the case of drug overdose.

1. Introduction

The rapid component of delayed rectifier potassium current (IKr) is one of the most important potassium currents of the cardiac repolarization as it corresponds to the initiation of late repolarization (phase 3) [1,2]. IKr is mediated by hERG channel proteins [3,4] and targeted by class III antiarrhythmics of the Vaughan Williams classification [5]. Early afterdepolarizations (EADs) can be generated on the basis of action potential (AP) prolongation induced by inhibition of IKr [6,7]. The AP prolongation due to reduction of IKr is known as long QT syndrome type 2 (LQTS2). This condition increases the short-term variability (SV) of APD [8] and the heterogeneity of transmural action potential duration (APD). Both of these can lead to life-threatening cardiac arrhythmias such as torsade de pointes (TdP) [9] and sudden cardiac death [10,11].
Some IKr blockers, such as E4031 and dofetilide, contain methanesulfonamide groups; there are two such groups in the latter one (Figure 1). Many active substances in the currently used medications contain the same group in their chemical structure. An example is rosuvastatin, a widely used drug to reduce serum cholesterol levels with potential IKr-inhibiting action [12]. This is partly due to direct inhibition of hERG by accelerating current inactivation and also the reduction of mature hERG protein expression [13]. Two other methanesulfonamide-containing drugs are the antineoplastic amsacrine and the nonsteroidal anti-inflammatory drug nimesulide. There is no data for IKr inhibition with the latter, but amsacrine blocked hERG channels in the open and inactivated states and its binding required a common drug receptor site within the pore-S6 region [14]. Moreover, from 20 May 2018 amsacrine is listed as a drug with conditional risk of TdP (only in certain conditions) in the CredibleMeds website accessed on 11 January 2023 (https://www.crediblemeds.org/blog/five-drugs-added-crediblemeds-qtdrugs-lists).
ABT-333, or dasabuvir, a non-nucleoside hepatitis C virus (HCV) polymerase inhibitor containing the methanesulfonamide group, is used to treat chronic HCV infection, often in combination with other compounds such as ombitasvir, paritaprevir, and ritonavir [15,16,17]. Chronic HCV infection is a silent worldwide epidemic, with 130–170 million individuals involved [18] and remains quiescent for decades before significant symptoms [19]. The disease contributes to high morbidity and mortality, as well as substantial costs in healthcare [20]. Cardiac side effects of ABT-333 containing anti-HCV medication were detected in some patients, and this was summarized by Li et al. [21]. These side effects included extreme bradycardia [22], cardiac arrest [23], and chest pain [24]. As ABT-333 is metabolized by hepatic cytochrome P450 2C8 enzyme (CYP2C8), strong inhibitors of CYP2C8 may increase ABT-333 plasma levels and carry increased risk of QT prolongation [25]. This can be the case with clopidogrel administration, as its glucuronidated metabolite inhibits CYP2C8 [26].
As ABT-333 contains a methanesulfonamide group and there is a risk of QT prolongation, we aimed to study its actions on the AP of canine ventricular isolated cardiomyocytes, a good model of human cardiomyocytes regarding cellular electrophysiology [27] and also on expressed hERG channels.

2. Results

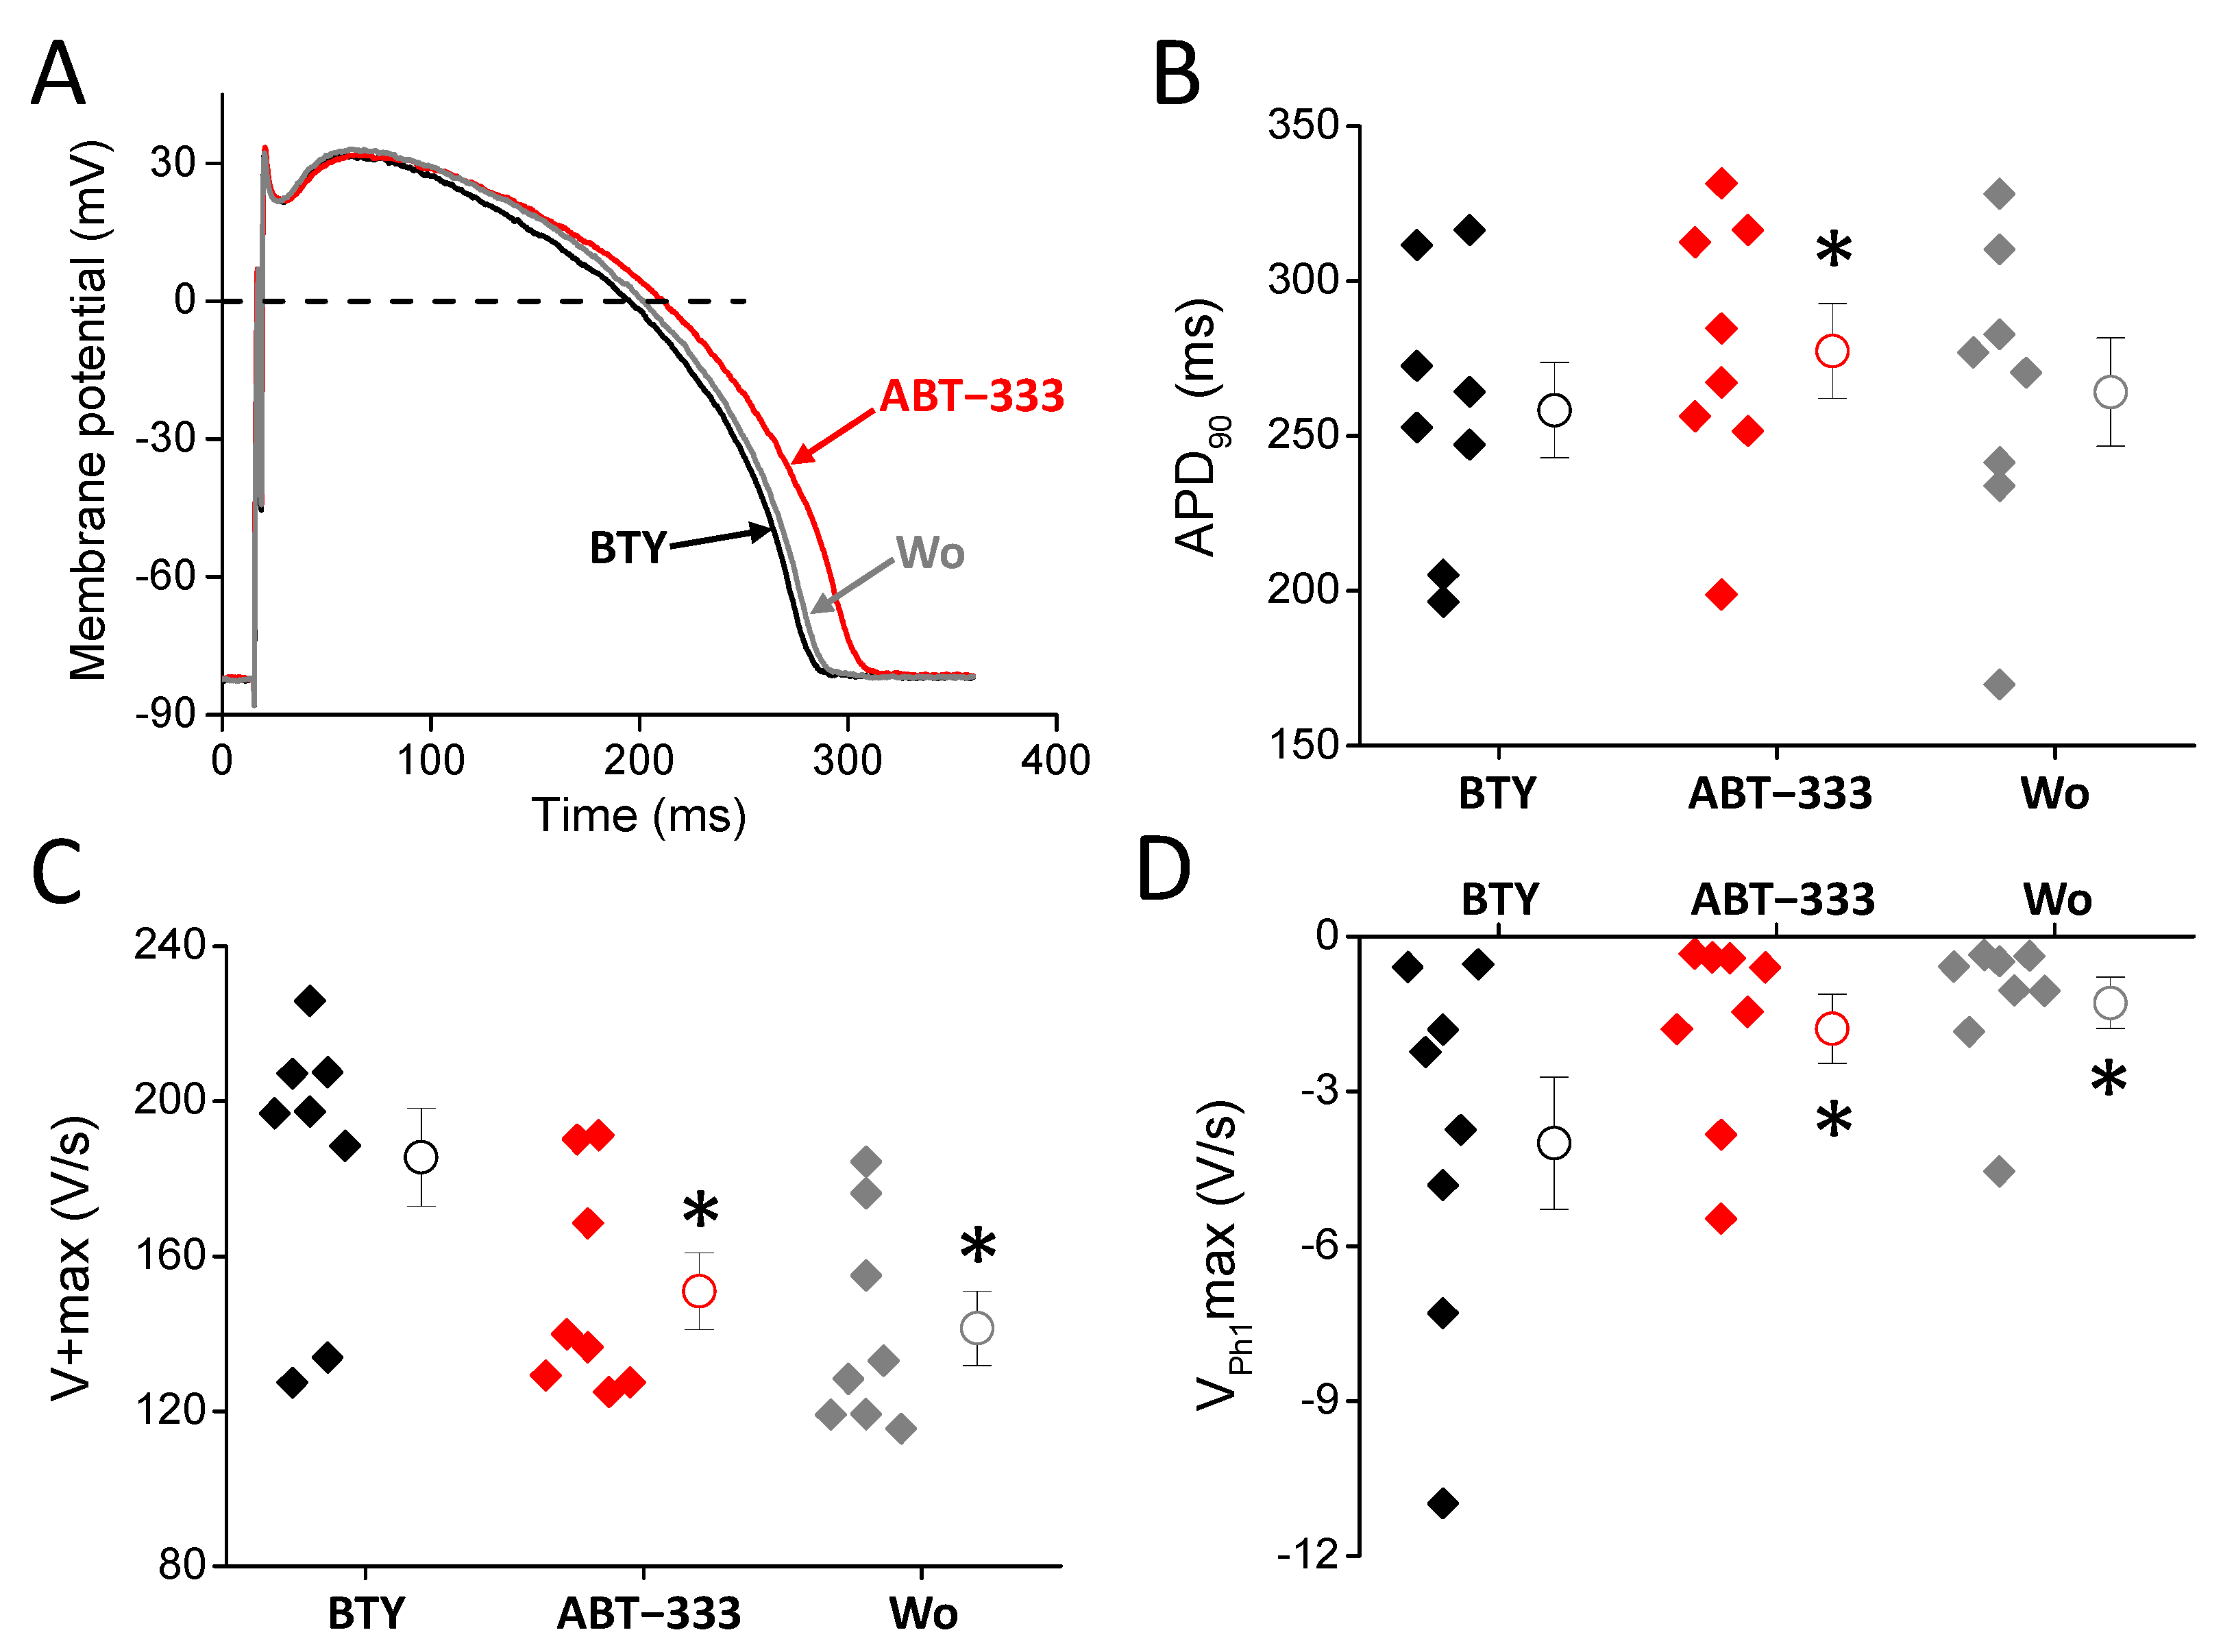
2.1. 1 µM ABT-333 Prolonged the Left Ventricular Action Potential

First, we perfused canine left ventricular cells with 1 μM ABT-333. During these experiments, ABT-333 perfusion lasted for 15 min, which was followed by a 20-minute-long washout. The analyzed parameters of the last ten action potentials recorded before ABT-333 perfusion were averaged to reduce the short-term variability of APs and are indicated as control: bicarbonate buffer containing Tyrode solution (BTY). Again, the average of the last ten APs before the washout was considered as ABT-333, while the average of other ten APs after the 20 min washout is indicated as Wo.
ABT-333, applied in 1 μM concentration, increased the AP duration of left ventricular cells from 258.3 ± 15.4 to 277.4 ± 15.3 ms (Figure 2A,B), resulting in a 7.84 ± 3.09% increase in the duration of the AP from the peak to 90% repolarization (APD90). This AP prolongation was not statistically significant (p = 0.08) for the duration of the AP from the peak to 50% repolarization (APD50), but the prolongation tendency was reversible upon washout, just as the ABT-333-induced APD90 increase. ABT-333 significantly reduced the maximal rates of phase 0 (Figure 2C) and phase 1 (VPh1max, Figure 2D) to 82.8 ± 5.1 and 51.6 ± 11.3%, respectively, in a non-reversible manner. Other AP parameters, such as action potential amplitude (APA), the ratio of APD50 and APD90, overshoot potential (OSP), resting membrane potential (RMP), membrane potential differences between the RMP and the membrane potential value of at the 20 and 50% duration of APD90 (Plateau20 and Plateau50 amplitudes, respectively), and maximal rate of phase 3 (V − max) values did not change (Table 1).

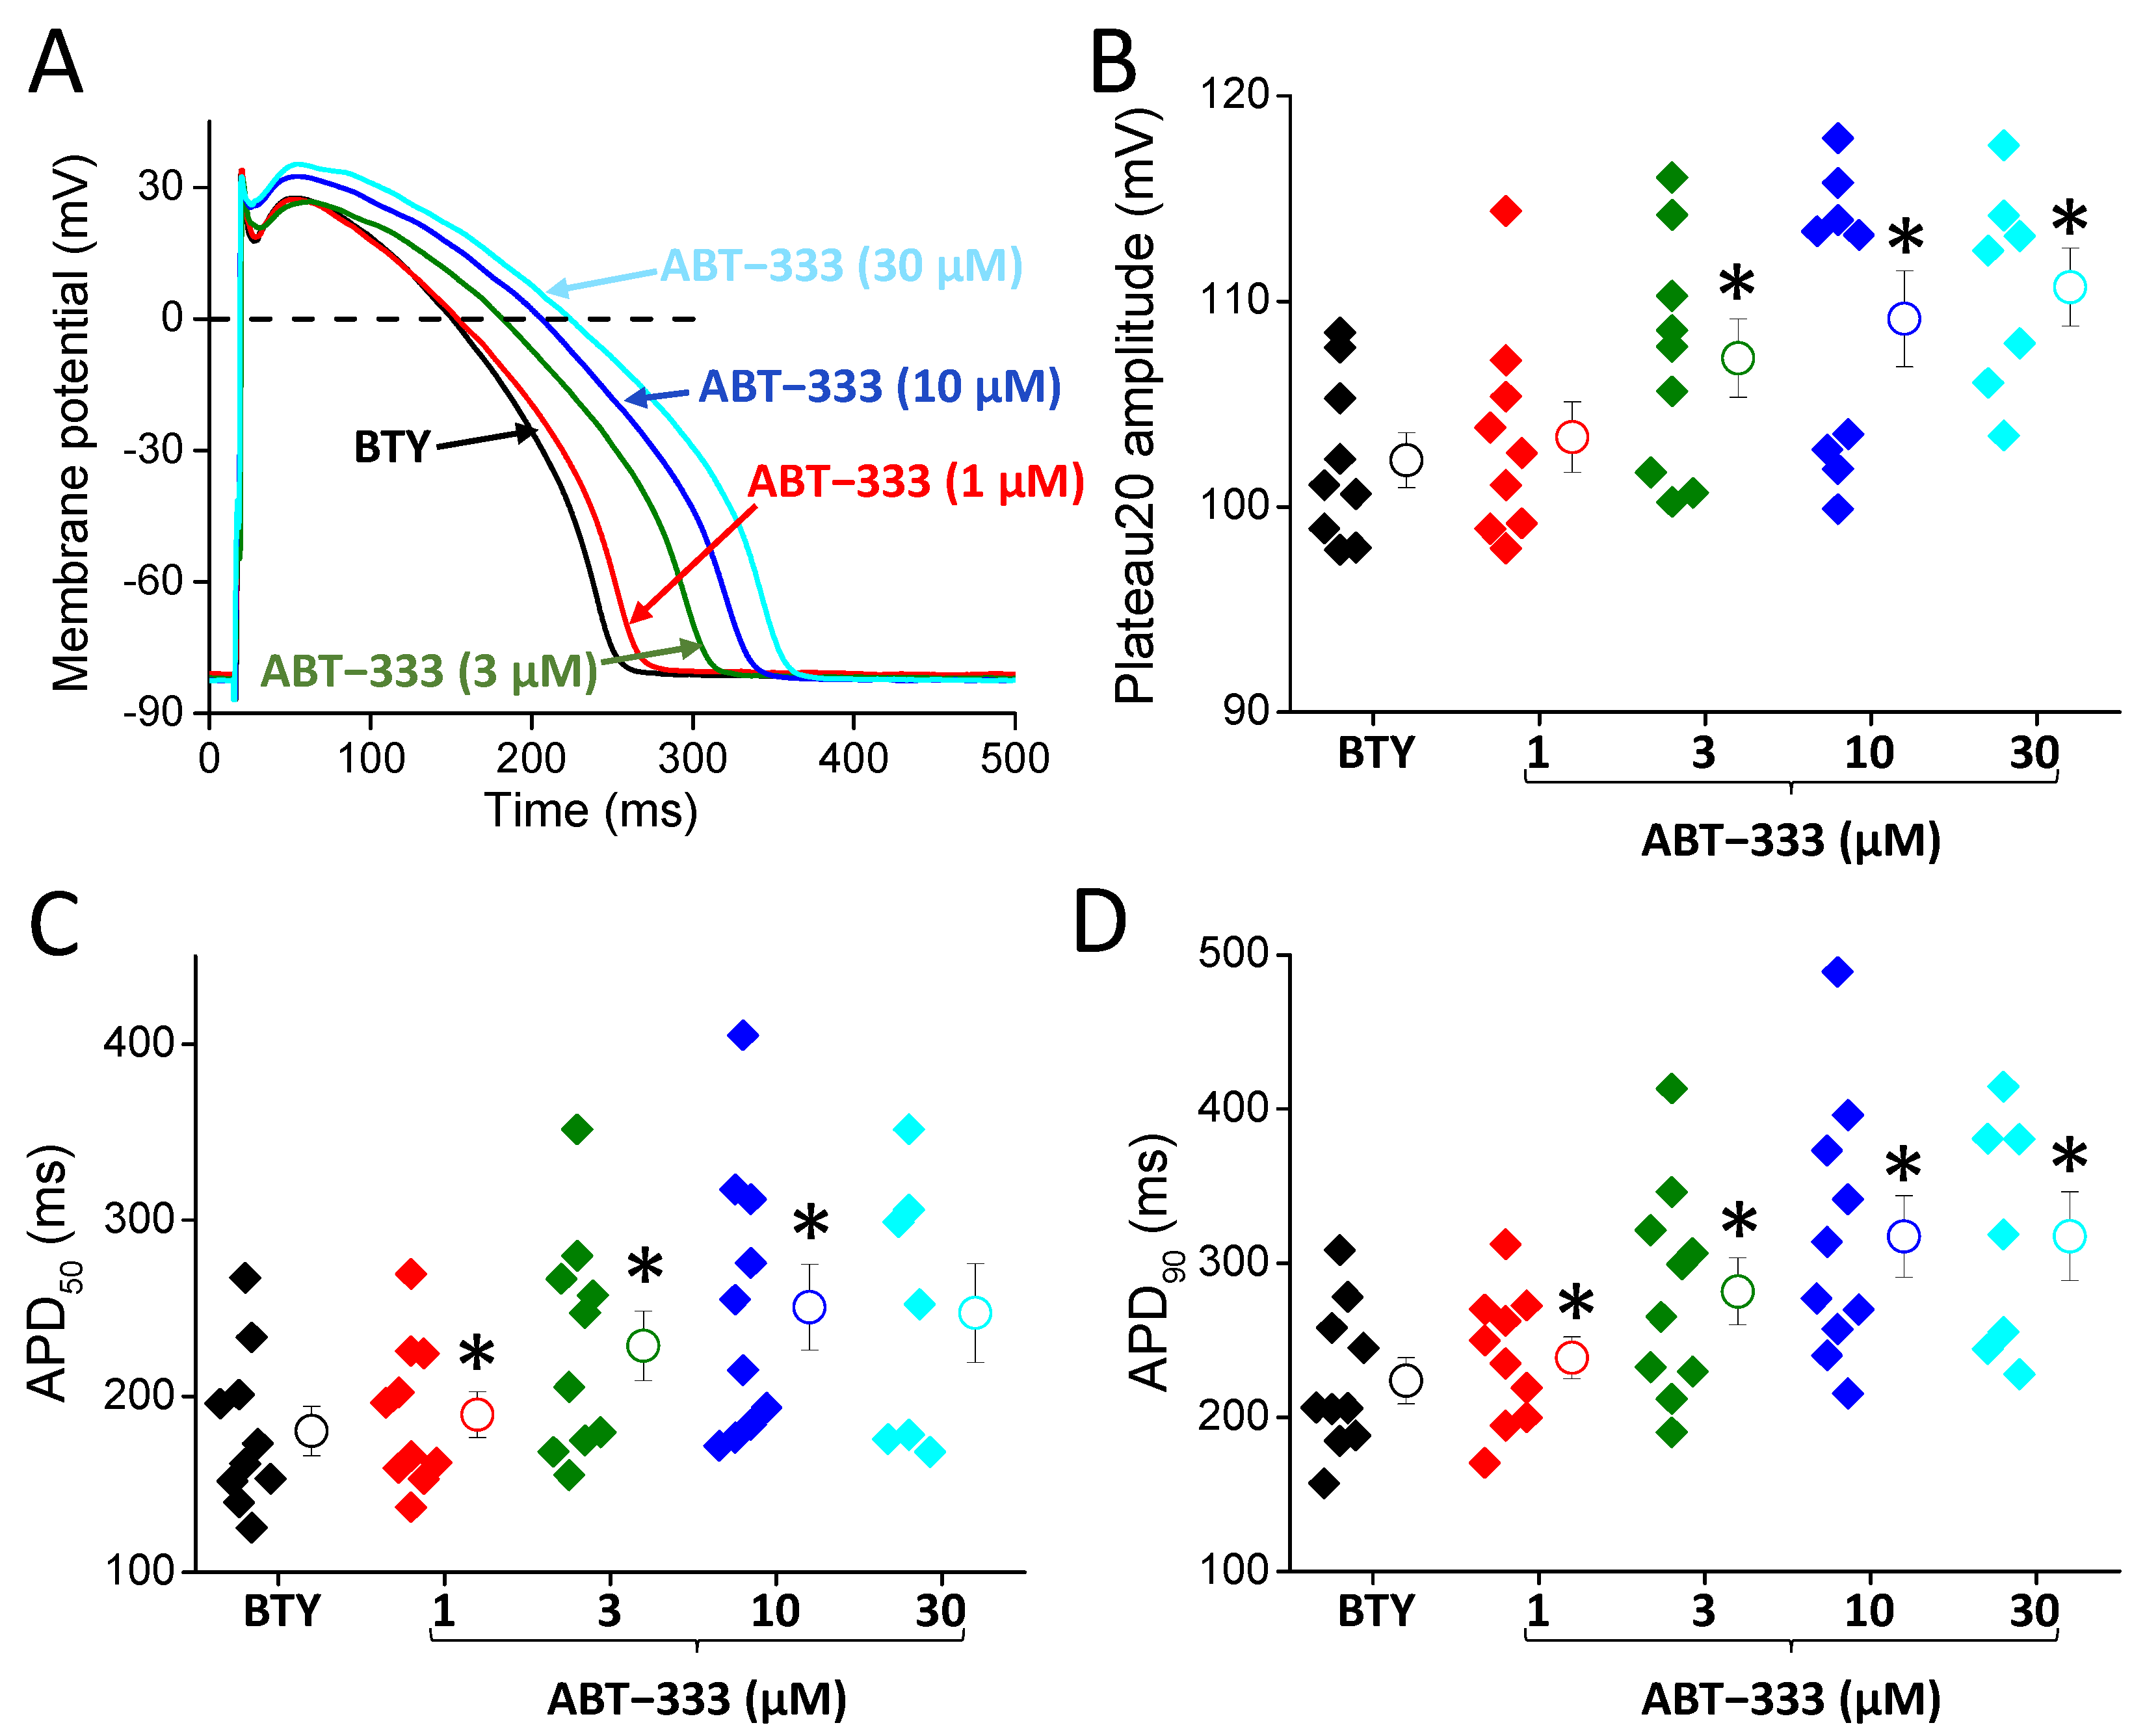
2.2. Concentration Dependent Actions of ABT-333 on the Ventricular Action Potential

After detecting the 1 μM ABT-333-induced prolongation of canine left ventricular AP, we checked the actions of higher ABT-333 concentrations in a cumulative manner using 5-minute-long perfusion with increasing concentrations of ABT-333 between 1 and 30 μM. We frequently detected early afterdepolarizations (EADs) in the presence of higher ABT-333 concentrations. AP parameters of these experiments are summarized in Table 2.
ABT-333, applied in increasing concentrations, prolonged the AP of left ventricular cells (Figure 3A,B), resulting in 8.1 ± 2.7, 26.3 ± 5.9, 37.6 ± 7.6, and 54.3 ± 15.2% increases in APD50 values in cases of 1, 3, 10, and 30 μM, respectively. Similarly, ABT-333 increased APD90 values by 7.4 ± 2.9, 26.2 ± 6.0, 42.6 ± 8.6, and 52.6 ± 13.6% in 1, 3, 10, and 30 μM concentrations, respectively. Higher ABT-333 concentrations (3–30 μM) also increased the height of early plateau phase as plateau20 amplitude values were slightly, but significantly, increased by 4.3 ± 0.7, 6.1 ± 1.7, and 9.2 ± 1.2% in 3, 10, and 30 μM concentrations, respectively.
ABT-333 also reduced the maximal rate depolarization (phase 0; V + max), maximal rate of early repolarization (phase 1; VPh1max), and maximal rate of terminal repolarization (phase 3; V − max). Only 10 and 30 μM ABT-333 decreased V + max significantly to 84.4 ± 6.2 and 77.8 ± 10.9% of the control, respectively. Higher ABT-333 concentrations also reduced V − max values to 95.1 ± 0.9, 87.1 ± 4.2, and 84.4 ± 5.6% of the control in 3, 10, and 30 μM concentrations, respectively. ABT-333 reduced the maximal rates of phase 1 repolarization to 78.5 ± 6.3, 57.7 ± 6.8, and 40.0 ± 8.3% in the cases of 3, 10, and 30 μM, respectively.

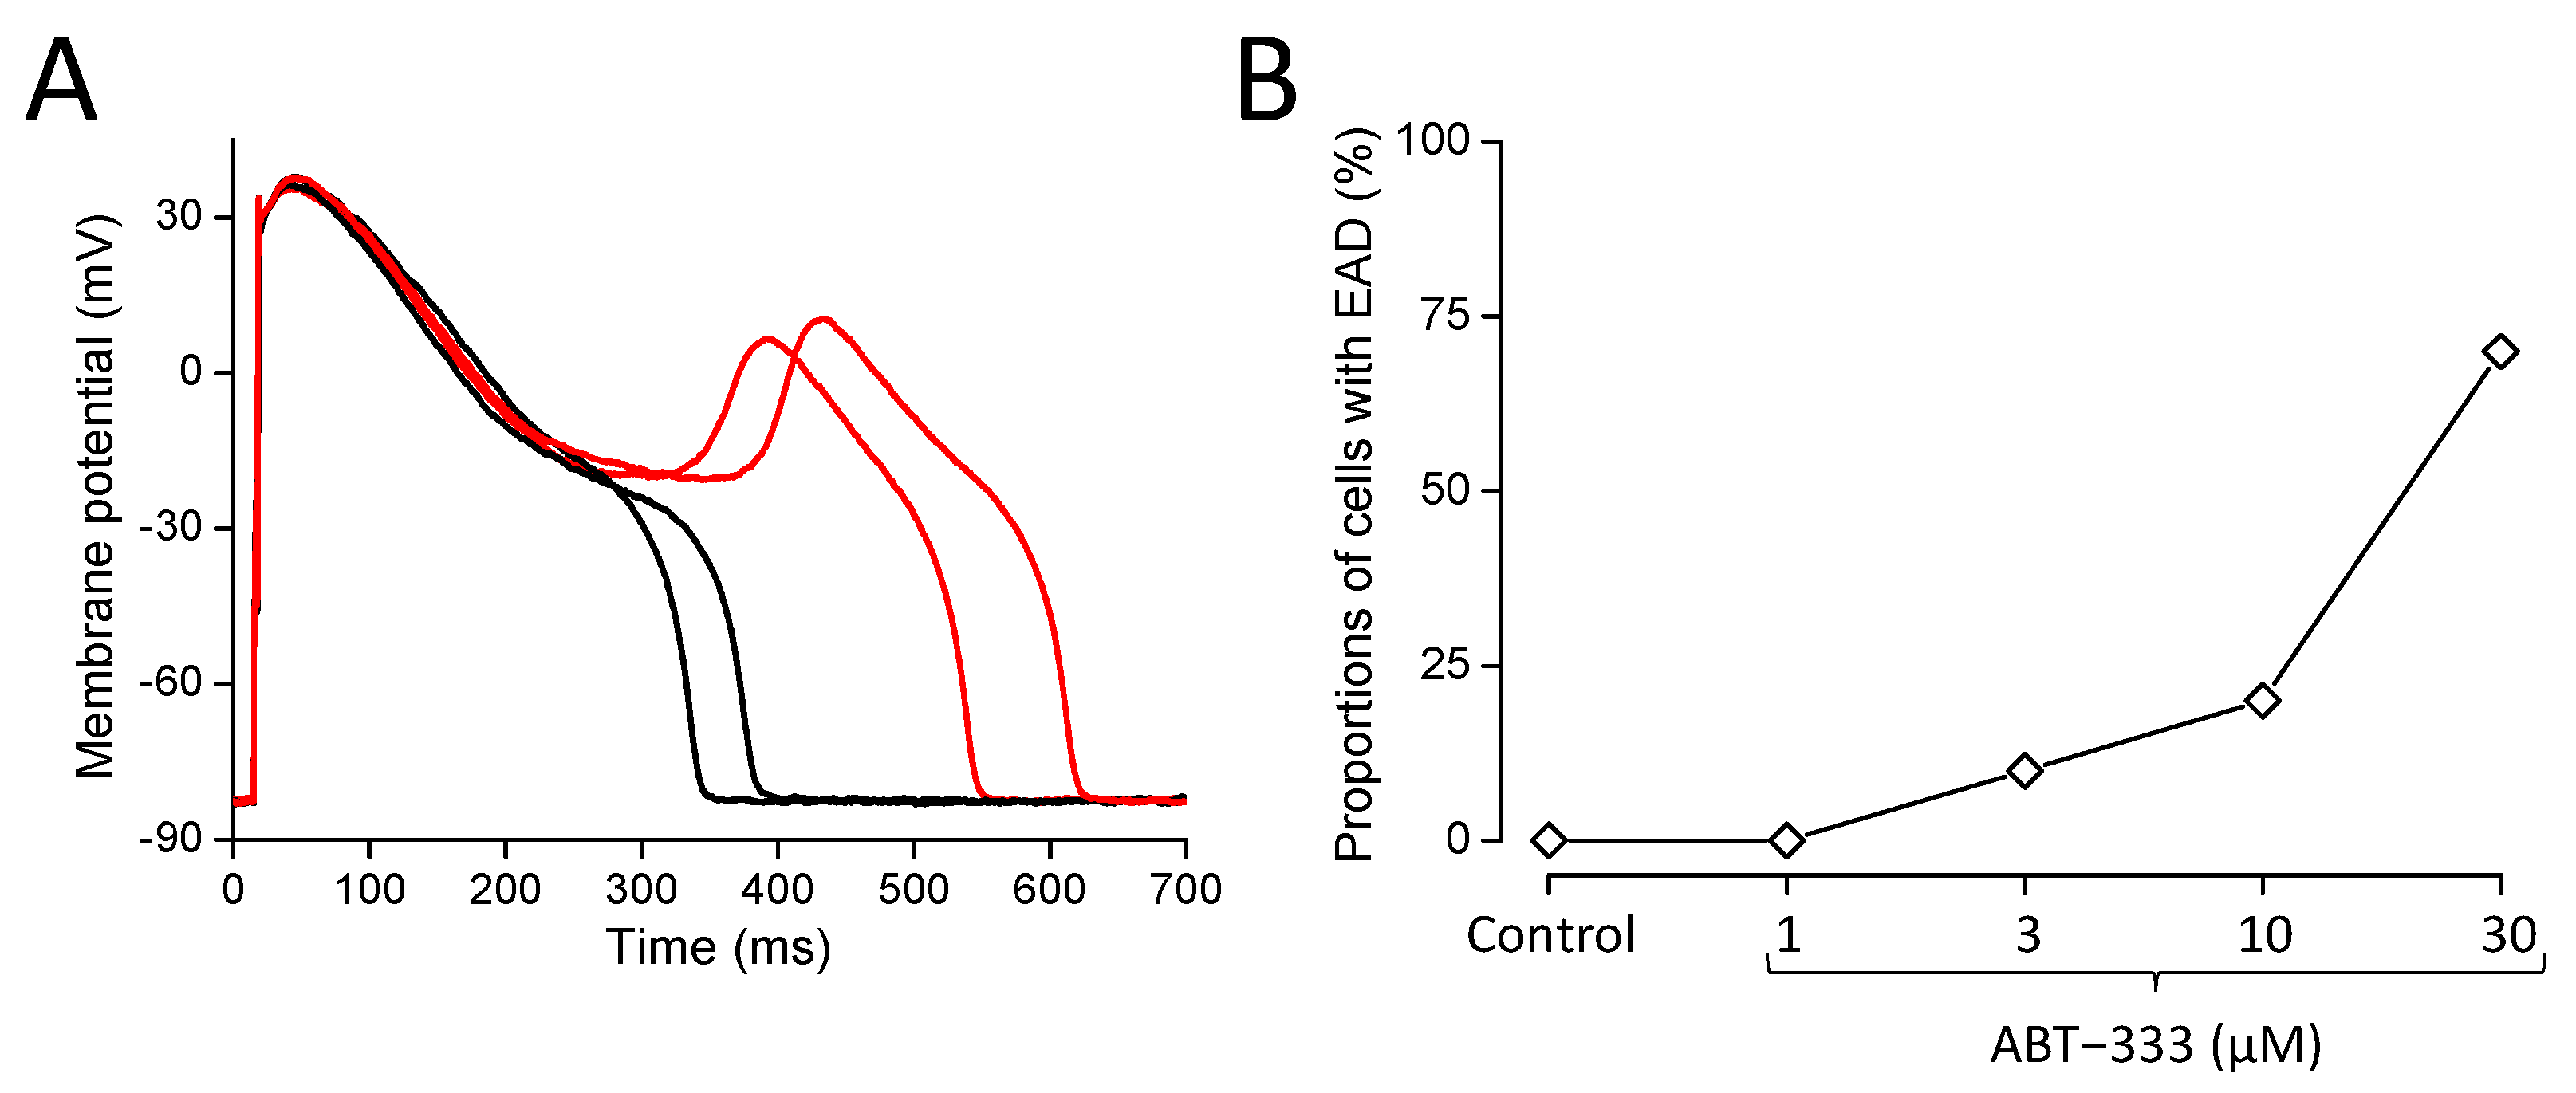
2.3. Development of Early Afterdepolarizations in the Presence of ABT-333

As mentioned previously, in the presence of ABT-333, we detected EADs in certain cells (Figure 4). We summarized the EAD appearance in a way that EAD presence was claimed in the given cell from the lowest concentration of ABT-333 in which the first EAD appeared and in all higher concentrations, even if the EADs did not persist. We did not observe any EADs in the control, and even in the presence of 1 µM ABT-333, but in higher concentrations of the drug, the percentage of cells developing EADs gradually increased (Figure 4B).

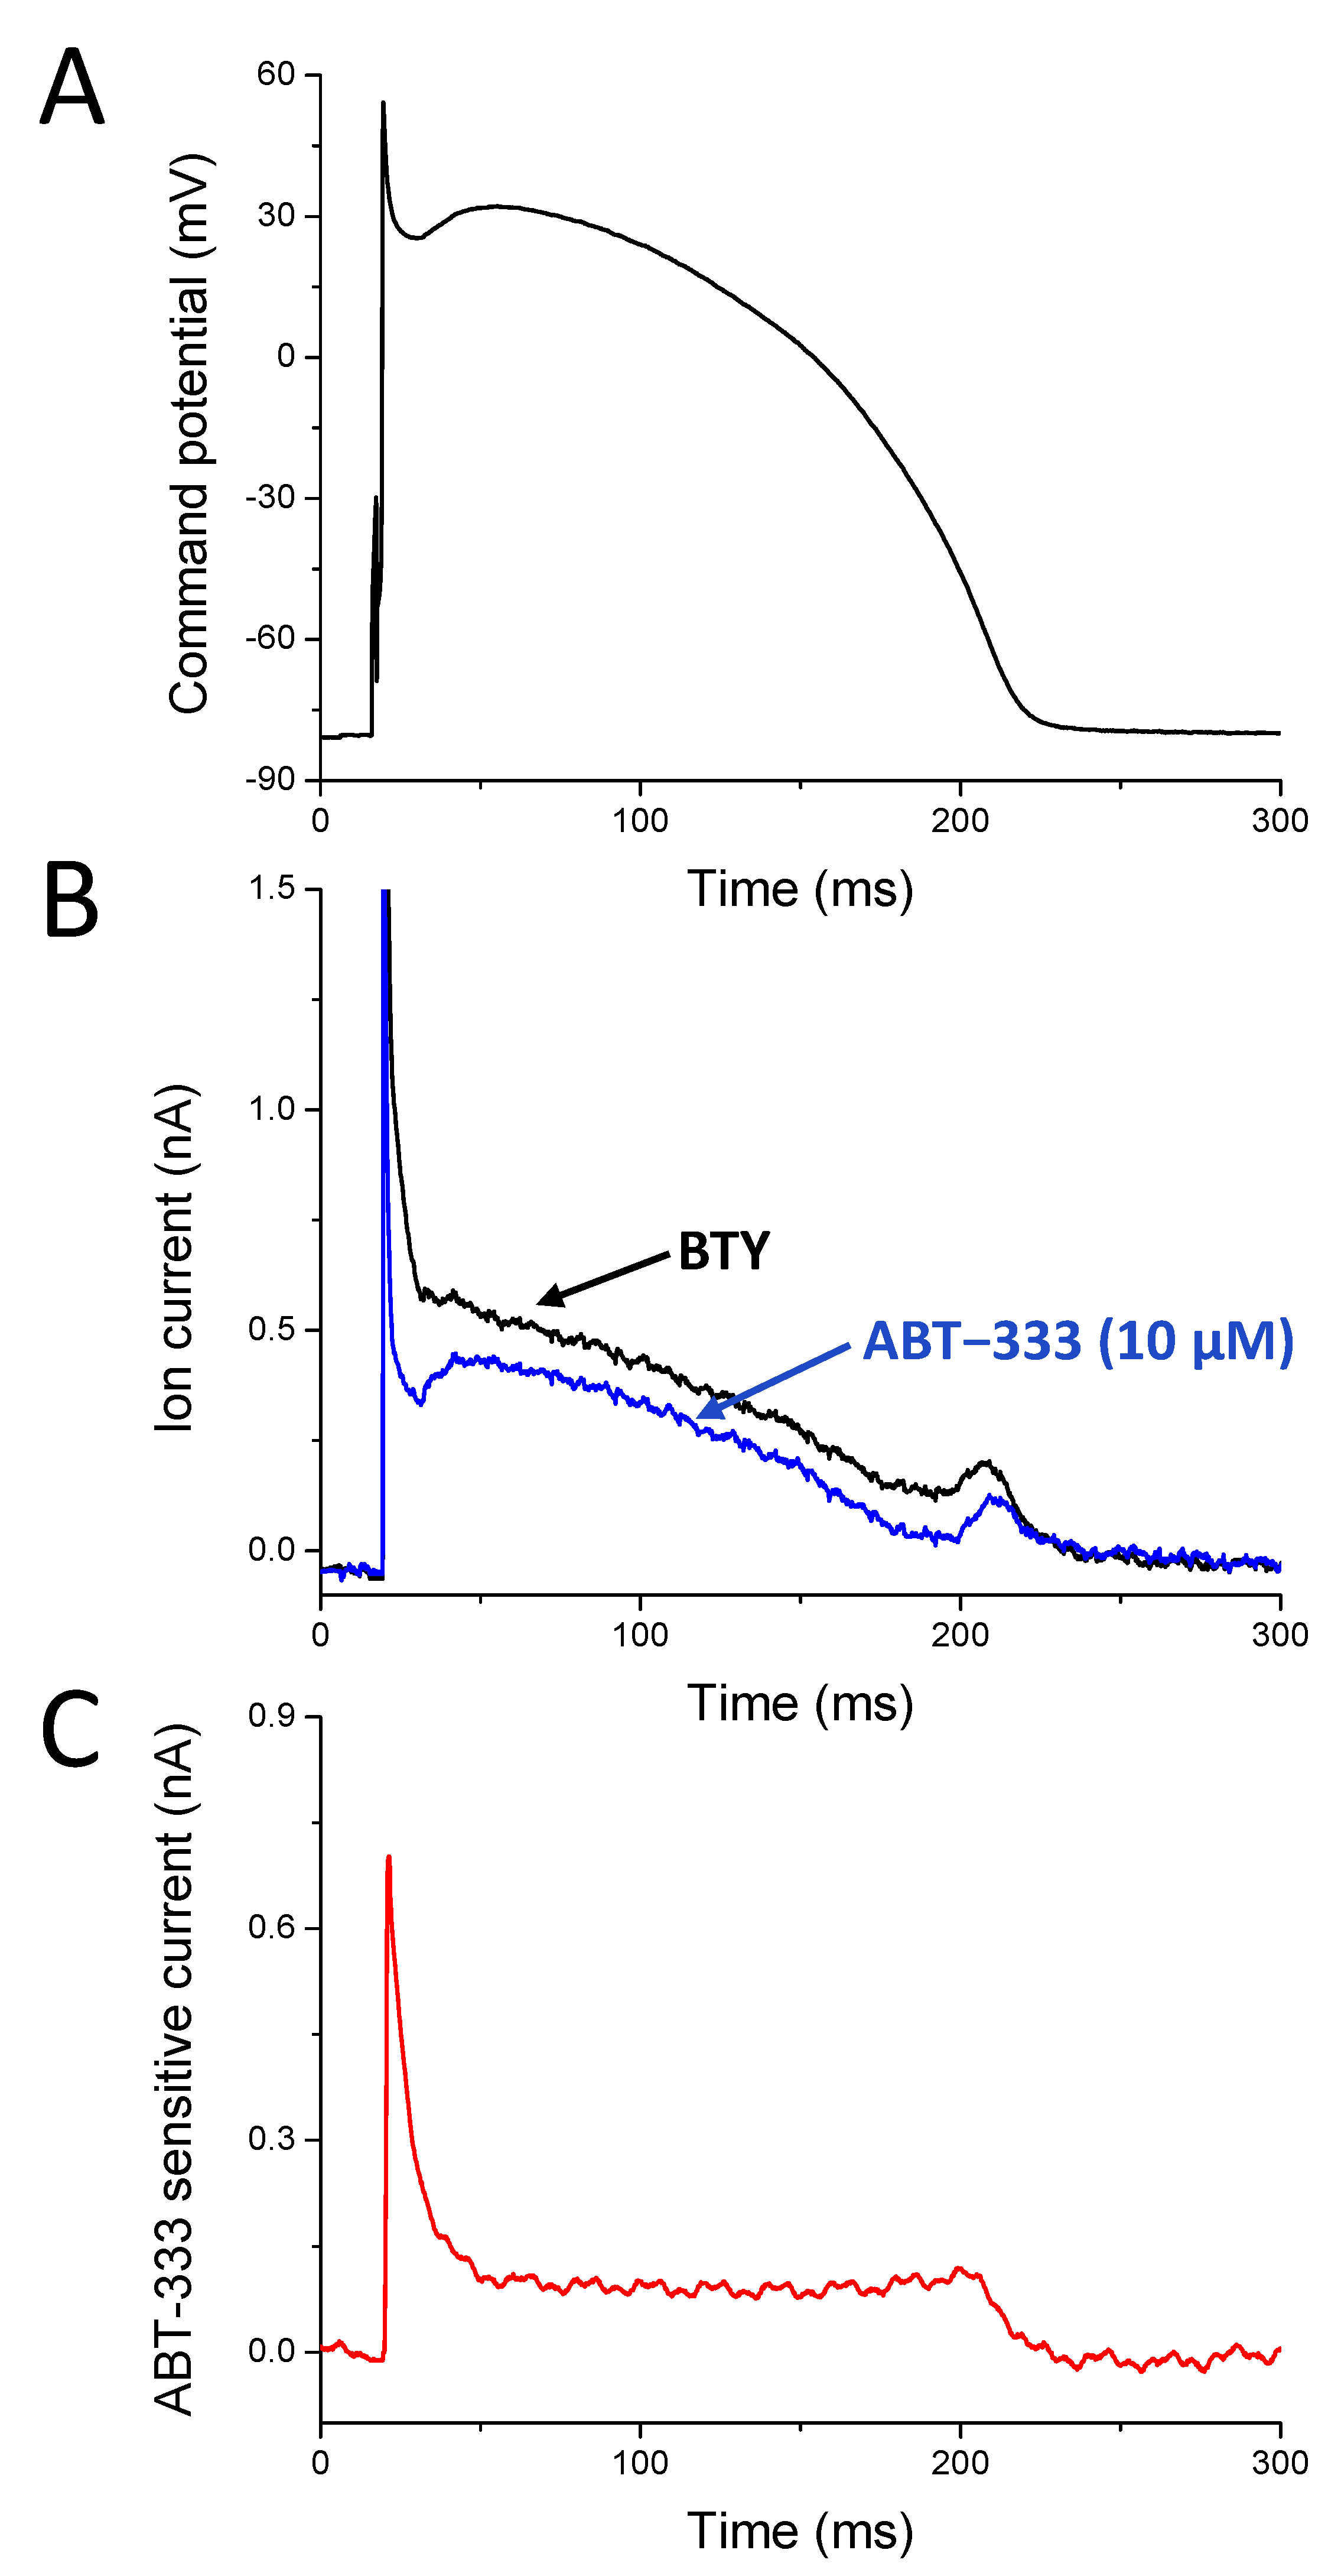
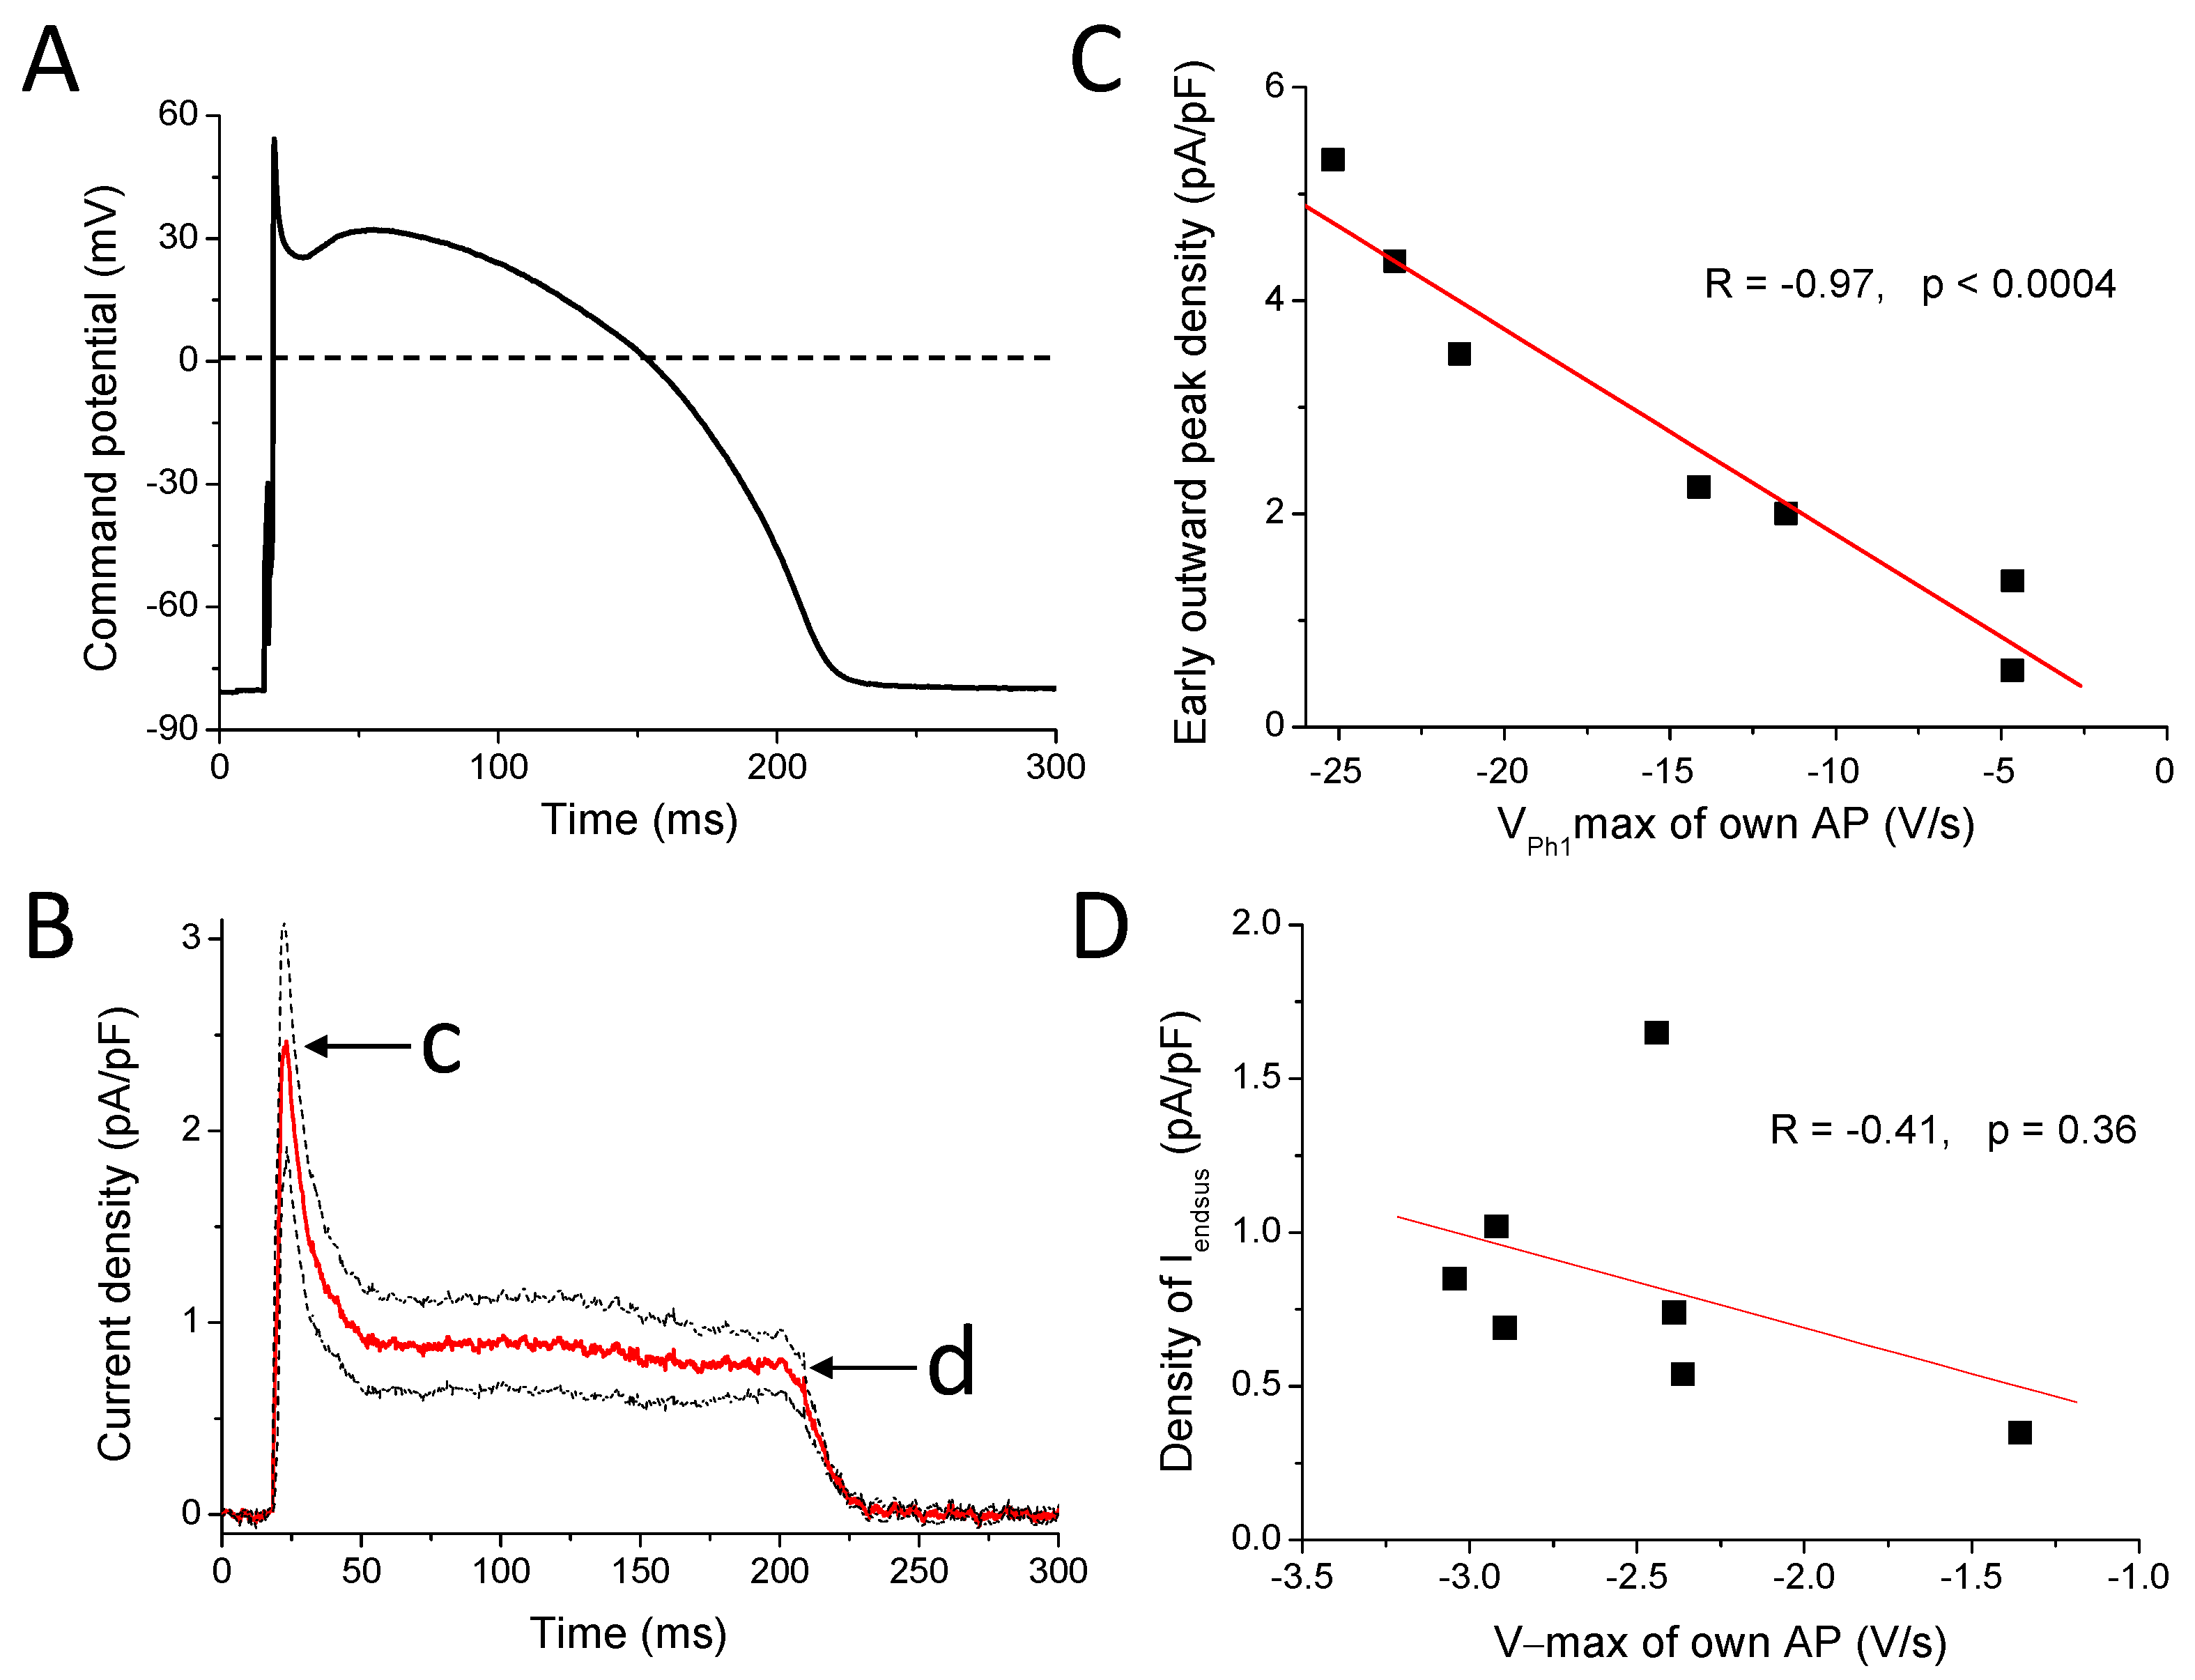
2.4. ABT-333-Sensitive Current Profile with AP Voltage Clamp (APVC)

ABT-333-induced AP prolongation and reduction of V − max suggests the inhibition of IKr as both of these changes can be a consequence of IKr reduction. ABT-333-induced reduction of VPh1max suggests inhibition of Ito, as VPh1max is greatly influenced by Ito amplitude. To confirm this hypothesis, we recorded the effects of 10 μM ABT-333 during the AP voltage clamp technique using a canonical AP as command potential (Figure 5A) and analyzed the properties of the ABT-333-sensitive current. The ABT-333-sensitive current was created by deducting the current trace in the presence of ABT-333 (blue trace on Figure 5B) from the one recorded before ABT-333 application (black trace on Figure 5B). Therefore, the ABT-333-sensitive current contained all those ion currents, which was modified by ABT-333 (Figure 5C). On the graph, an outward (positive) current was seen in the case of both the ABT-333-induced inhibition of an outward current as well as the ABT-333-induced increase in an inward current.
The 10 μM ABT-333-sensitive current was outward throughout the AP. We observed an early outward current peak with a density of 2.76 ± 0.64 pA/pF (Figure 6B). These current traces peaked 2.90 ± 0.81 ms later than the time of the VPh1max of the command AP. On the basis of the shape of the own AP of the studied cells, there was a negative correlation between the VPh1max values and the early outward peak current density values (Figure 6C). The outward current at the half duration of the command AP was 0.89 ± 0.24 pA/pF. The end of the sustained outward current (Iendsus, measured just before the start of returning to zero, indicated with d on Figure 6B) corresponding to terminal repolarization was 0.83 ± 0.16 pA/pF, and its position was 7.82 ± 1.64 ms before the time of the V − max of the canonical AP. There was no correlation between the density of Iendsus and the V − max values of the own AP of the measured cells (Figure 6D).

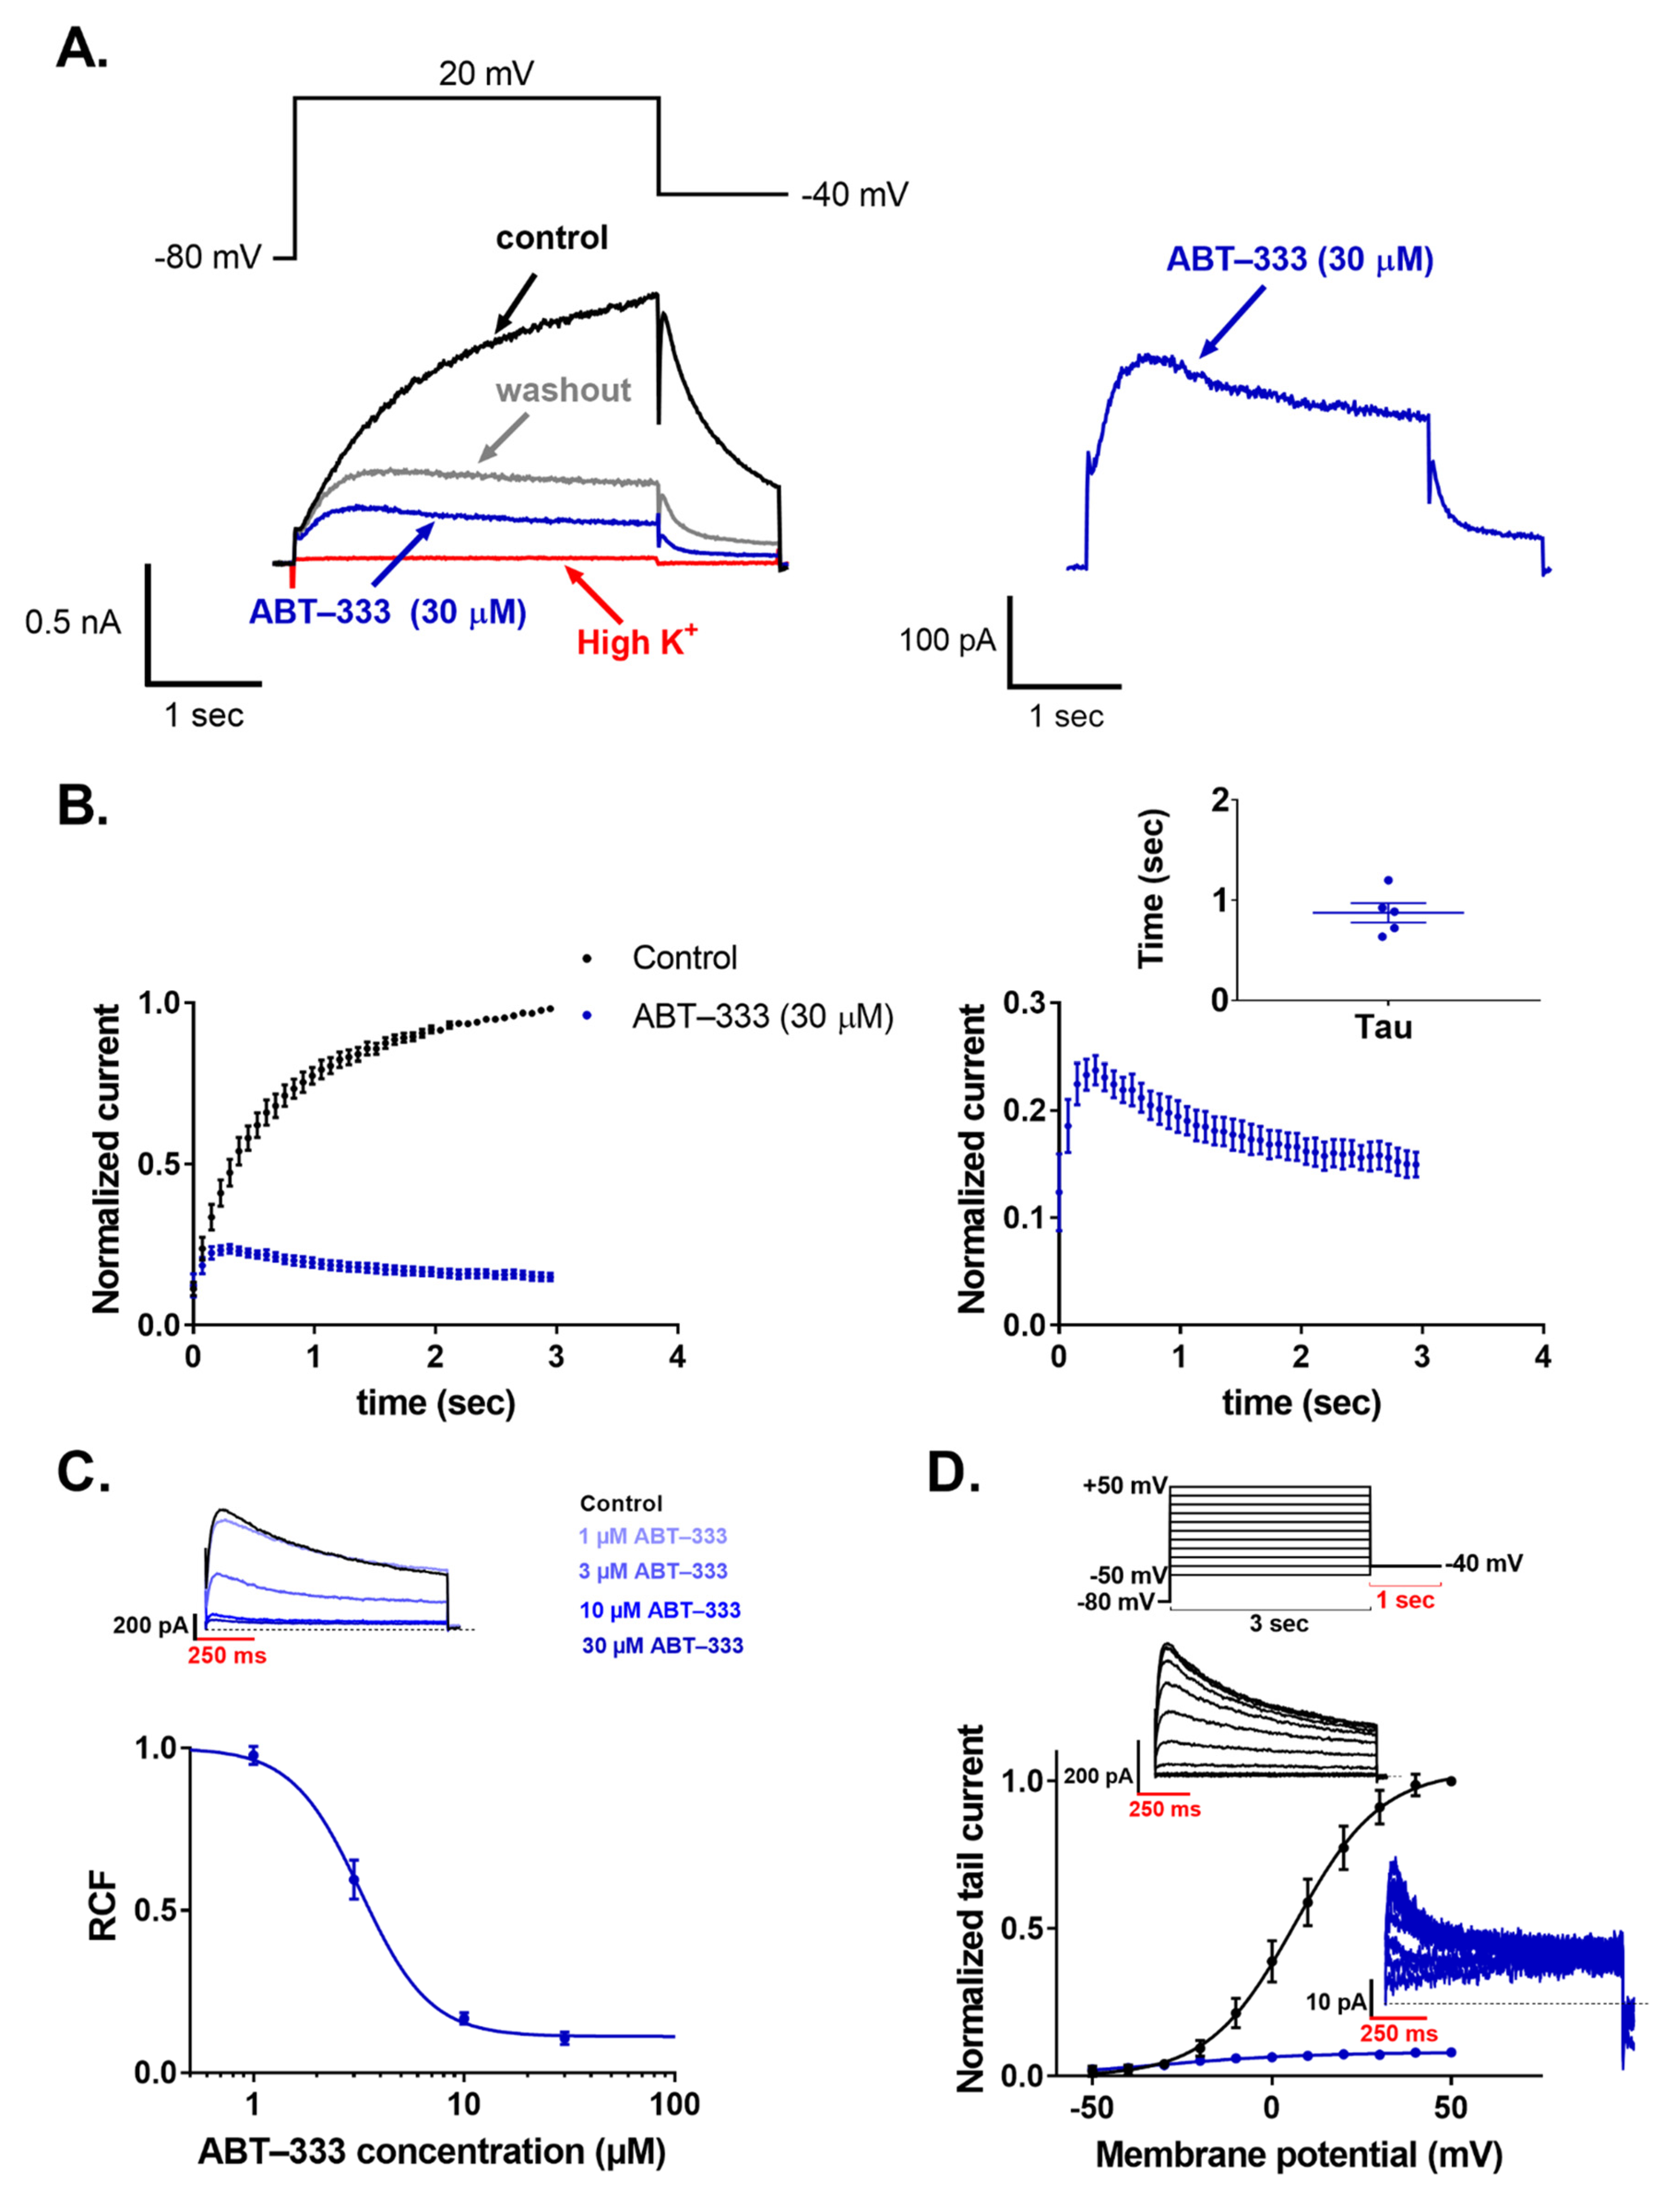
2.5. ABT-333 Blocked Expressed hERG Channels in a Time- and Concentration-Dependent Manner

ABT-333 inhibited the hERG current in 30 μM concentration as observed by a 3-second-long depolarizing step to +20 mV followed by a repolarizing step to −40 mV, which led to a characteristic fast recovery of inactivated hERG channels (Figure 7A). The holding potential was −80 mV, and pulses were applied every 30 s. The application of ABT-333 caused a reduction of the hERG current both at +20 and −40 mV. The monotonic increasing control current at +20 mV changed into a decaying current in the presence of ABT-333, which was fit with a single exponential function, yielding a time constant of 0.87 ± 0.09 s (Figure 7B, n = 5). To test the concentration dependence of the inhibition, we applied 1, 3, 10, and 30 μM ABT-333. The remaining current fractions (RCFs) were 0.93 ± 0.04, 0.63 ± 0.05, 0.26 ± 0.04, and 0.15 ± 0.02, respectively (n ≥ 4 for each concentration). The concentration–response curve yielded a half maximal inhibitory concentration (IC50) of 3.2 μM (Figure 7C). The effect of ABT-333 on the voltage sensing of hERG channels was tested by an I-V protocol consisting of depolarizing pulses ranging from −50 mV to +50 mV in +10 mV increments. From the normalized tail current peaks, we created the G-V curves of the control solution and the 30 μM ABT-333-superfused recordings. Fitting them with the Boltzmann equation, the V1/2 value for the control solution was 6.50 ± 1.03 mV. For ABT-333, the V1/2 value was unable to be obtained this way, as its application reduced the current to the extent where proper determination of the V1/2 value was not possible (Figure 7D, n = 3). However, visually, a large voltage-shift was not apparent.

3. Discussion

3.1. Effects of 1 µM ABT-333

We first tested ABT-333 actions on cardiac AP in 1 µM, where APD90 was significantly and reversibly increased, likely due to the expected IKr blockade of the drug. IKr is responsible for the initiation of phase 3 repolarization, but its maximal rate (the value of V − max) mainly, and it does not exclusively depend on the density of inward rectifier potassium current, IK1 [1]. Accordingly, ABT-333 did not reduce V − max in 1 µM concentration, suggesting that it did not inhibit IK1. The APD50/APD90 ratio is often used as a marker of AP triangulation. The smaller the value, the more triangular the shape of the cardiac APs, which is often seen during inhibition of IK1. As the APD50/APD90 ratio did not change significantly in the presence of ABT-333, it also confirms that the drug did not inhibit IK1. The ABT-333-induced VPh1max and V + max reductions can be caused by the inhibition of transient outward potassium current (Ito) and sodium current (INa), respectively. These actions did not reverse the 20 min washout, raising the possibility of an irreversible channel blockade by ABT-333.

3.2. Actions of Higher Concentrations of ABT-333

Compared to 1 µM ABT-333, higher concentrations of the drug generated further changes of AP parameters (Figure 3, Table 2). Both APD50 and APD90 values, as well as the amplitude of early plateau phase (Plateau20 amplitude), were increased in a concentration-dependent manner, suggesting again that ABT-333 reduced IKr. V + max and VPh1max values were also smaller in the presence of ABT-333. These observations raise the possibility of Ito and INa inhibition apart from IKr blockade.
At larger concentrations of ABT-333, EADs appeared, also suggesting the inhibition of IKr, as AP prolongation often leads to EAD formation. In a computer simulation study, major (more than 90%) IKr reduction was needed for EAD development [6]. The APD increase, however, is not always due to IKr inhibition but can be due to the increase in sodium or calcium currents. The former one can probably be ruled out as the reduction of V + max seen with ABT-333 is not consistent with a larger sodium current. Calcium current increase by ABT-333 is a possibility, especially as it would lead to elevation of the early plateau potential, which was indeed detected with ABT-333 (Figure 3B). Therefore, it is possible that ABT-333 greatly reduced IKr or induced EADs by reduction of IKr and simultaneous increase in the calcium current, especially in higher concentrations.

3.3. ABT-333-Sensitive Current Profile with APVC

ABT-333-induced reduction of VPh1max suggested inhibition of Ito on top of the IKr inhibition. We tried to confirm this with the APVC measurements. The properties of the early outward peak of the average ABT-333-sensitive current were very similar to that shown earlier with the Ito inhibitor 4-AP [1,28]. It was found that 1 mM 4-AP inhibits approximately 70% of Ito and resulted in approximately 3 pA/pF peak current density (see Figure 1 in Banyasz et al. [1]). In the current study, the ABT-333-sensitive current early peak density was slightly smaller: 2.76 ± 0.64 pA/pF, probably due to the higher presence of cells with small Ito current in the current study. Moreover, the time of the ABT-333-sensitive current peak was always after the time of VPh1max but before the deepest point of the incisura of the command potential. Further proof that ABT-333 reduces Ito is the good correlation between early current peak density values and VPh1max values of own APs (Figure 6C). Moreover, the early outward current decayed very rapidly, similarly to the 4-AP-sensitive current [29]. An amount of 100 µM chromanol 293B can also be used to study Ito, wherein the decay of the current was less rapid [30]. Of note, the ABT-333-sensitive current did not decay to nearly zero, as seen with the 4-AP-sensitive one [1]. This might have been due to the effect of ABT-333 on other ion channels conducting during this early plateau phase of the AP. Nevertheless, on the basis of the results, it seems that 10 μM ABT-333 inhibits Ito substantially.
We also confirmed the expected IKr inhibition of ABT-333 with APVC. The position of Iendsus was 7.82 ± 1.64 ms before the time of the V − max of command potential, which is in good agreement with earlier results [1,29]. The peak value of the 1 μM E4031-sensitive current was approximately 0.6 pA/pF, slightly smaller than the ABT-333-sensitive current of the current study (approx. 0.8 pA/pF). This could have been due to larger IKr currents in cells of the current study than those in our previous one (see Figure 2 in Banyasz et al. [1]) as 1 μM E4031 inhibits approximately 80% of IKr [31], similarly to the large reduction of hERG by 10 μM ABT-333 (Figure 7C). In addition, it is possible that ABT-333-sensitive current might contain an activated calcium current component besides Ito and IKr, as suggested previously. This activated calcium current, if still active during the late phase of plateau, can add to the late peak value of the ABT-333-sensitive current on top of the IKr, resulting in a larger last part than the E4031 sensitive current. This possibility is evident if one observes the fingerprints of Ito and IKr, as Ito decays to zero at the latest after 50 ms of the plateau phase, while IKr only starts to activate about 70–80 ms after the AP peak [1]. However, Ito can decay more slowly [30] and therefore might contribute to the maintained outward component of the ABT-333-sensitive current during the early plateau phase (Figure 6B). The ABT-333-induced augmentation of late sodium or calcium current can be also responsible, as that will appear as an outward current. The contribution of the late sodium current is, however, unlikely, as ABT-333 reduced the V + max value of the AP, which argues against sodium current activation.

3.4. ABT-333-Induced Reduction of hERG Channel Currents

ABT-333-induced AP parameter changes, namely, the increase in APD50 and APD90, mainly without the alteration of their ratio; the reduction of V − max suggested the inhibition of IKr. This was expected due to the presence of the methanesulfonamide group in the structure of ABT-333. Moreover, the ABT-333-sensitive current was also outward during the late plateau phase, suggesting IKr inhibition as well. To confirm this, we carried out experiments on HEK cells stably expressing hERG channels. The hERG-mediated current was indeed reduced by ABT-333 in a concentration-dependent manner with an IC50 of 3.2 μM. Similarly to some AP parameters where ABT-333-induced changes were (partly) irreversible upon washout, the reduction of hERG current by ABT-333 also was unable to be fully reversed. Moreover, applying ABT-333 in 30 µM concentration caused the time-dependent inhibition during the depolarizing pulse with a time constant of 0.87 ± 0.09 s (Figure 7B). This led us to investigate the possible effects of the ABT-333 on the hERG channel gating transitions (Figure S1). On this basis, 3 µM ABT-333 significantly decreased the deactivation time constant ratio (τABT-333control = 0.46 ± 0.04, p = 0.0001), and the superfusion of 30 µM ABT-333 decreased the inactivation time constant ratio to 0.78 ± 0.15 (mean ± SEM). These results suggest that ABT-333 blocks the channel pore mainly during the open state of the channel.

3.5. Medical Relevance

According to our hypothesis, ABT-333 indeed blocked the IKr current. This was supported by (i) prolongation of canine ventricular AP; (ii) reduction of maximal rate of repolarization (V − max decrease); (iii) detecting IKr-like profile of the late phase of the ABT-333-sensitive current with APVC; and (iv) inhibition the current of expressed hERG channels, the pore forming protein responsible for IKr. In this study, we used ABT-333 between 1–30 μM. The IC50 value of ABT-333 against recombinant HCV polymerase (NS5B) was in the range of 2–10 nM [32]. Similar values (2–8 nM) were observed for half effective ABT-333 concentrations using cell culture assays for inhibition of replication of HCV subgenomic replicons for two genotypes (1a (H77) and 1b (Con1)), but the values were greatly (approximately 12–13-fold) increased in the presence of 40% human plasma to 20–100 nM [32]. Even more important is to compare the concentrations of ABT-333 in the current study with plasma concentrations of the drug in patients taking the compound during anti-HCV treatment. The maximal plasma concentration (Cmax) in HCV and HIV co-infected patients taking ABT-333 in combination was approximately 600 ng/mL according to King et al. [33], which corresponds to approximately 1.2 nM. In healthy volunteers taking a 200 mg ABT-333-containing tablet alone twice daily resulted in maximal concentration of 500 ng/mL, approximately 1 nM [34]. Increasing the dose resulted in linearly higher Cmax values (1.8, 2.9, and 4.2 nM for 400, 600, and 1000 mg containing tablets twice daily, respectively). There was no major daily fluctuation in plasma levels, and also in accumulation ratio, except for the 1000 mg dose where 1.6 times higher concentrations were seen by the 10th day [34]. Moreover, renal and hepatic impairment (unless severe in the case of the latter one) did not alter the metabolism of ABT-333, hardy influencing the maximal plasma concentration [34]. The plasma concentration of ABT-333 can be increased in patients taking clopidogrel [25] and also gemfibrozil [35]. Taken together, it is rather unlikely that ABT-333 can reach higher than 1 nM concentration in blood plasma, given the fact that the recommended dose is 250 mg twice daily. Therefore, even in the case of ABT-333 overdose, the arrhythmic risk of ABT-333 is very low.
A compound can cause dual action on certain ion channels, as in the case of 2-ABP with TRPM7 channels [36] or channels responsible for Ca2+-release-activated Ca2+ current [37]. Moreover, several IKr activators such as RPR260243 [38], NS1643 [39], NS3623 [40], ICA-105574 [41], and A-935142 [42] were shown to reduce IKr in large concentrations. Given the large difference between the therapeutic dose of ABT-333 and the concentrations we studied above, we also tested the therapeutic concentration of ABT-333 (1 nM). The amount of 1 nM ABT-333 did not influence either the AP of left ventricular cells or expressed hERG currents (Figure S1, Table S1).

3.6. Summary and Conclusions

ABT-333, on the basis of its molecular structure, is expected to block hERG channels and the IKr current. This was confirmed as ABT-333 application led to prolongation of the cardiac AP and generation of EADs. ABT-333 most likely inhibits Ito current too and might activate calcium current. Despite these factors, ABT-333 can be considered safe as its plasma level is unlikely to reach a high enough concentration for the abovementioned actions, even during overdose, and also due to lack of action in the therapeutic concentration.

4. Materials and Methods

4.1. Isolation of Canine Ventricular Myocytes

Cell isolation was carried out with the segment perfusion technique by enzymatic digestion, as described previously [2]. Intramuscular application of 10 mg/kg ketamine hydrochloride (Calypsol, Richter Gedeon, Budapest, Hungary) and 1 mg/kg xylazine hydrochloride (Sedaxylan, Eurovet Animal Health BV, Bladel, The Netherlands) was used to achieve complete narcosis in adult mongrel dogs of either sex according to protocols approved by the local ethical committee (license no. 2/2020/DEMÁB), in line with the ethical standards laid down in the Declaration of Helsinki in 1964 and its later amendments, as well as with the Guide to the Care and Use of Experimental Animals (Vol. 1, 2nd ed., 1993, and Vol. 2, 1984, Canadian Council on Animal Care). Chemicals and reagents were purchased from Sigma-Aldrich Co. (St. Louis, MO, USA) if not specified otherwise. Hearts were quickly removed in left lateral thoracotomy and washed in cold Tyrode solution containing (in mmol/L) NaCl 144, KCl 5.6, CaCl2 2.5, MgCl2 1.2, 4-(2-hydroxyethyl)piperazine-1-ethanesulfonic acid (HEPES) 5, glucose 10 (pH = 7.4; adjusted with NaOH). Left anterior descending coronary artery was cannulated and perfused with a nominally Ca2+-free JMM solution (Minimum Essential Medium Eagle, Joklik Modification, product no. M0518) gassed with a mixture of 95% O2 and 5% CO2 and supplemented with 2.5 g/L taurine, 200 mg/L NaH2PO4, 1.4 g/L NaHCO3, 175 mg/L pyruvic acid, 13.5 mg/L allopurinol, and 750 mg/L D-ribose, pH 6.8 at 37 °C. Then, atria were cut off, and a wedge-shaped section of the left ventricular wall supplied by the left anterior descending coronary artery was perfused. Following further 5 min of perfusion to completely remove blood from the tissue, 0.9 g/L collagenase (type II, 245 U/mg; Worthington Biochemical Co., Lakewood, NJ, USA), 2 g/L bovine serum albumin (Fraction V.), and 50 µM CaCl2 were added to the JMM solution. During the 30–40 min-long enzymatic digestion, the solutions were kept at 37 °C and gassed with a mixture of 95% O2 and 5% CO2. Cells were sedimented and filtered four times to remove large chunks. During this procedure, the Ca2+ concentration of the JMM solution was gradually restored to the final 1.8 mmol/L. After this, cells were stored in MEM solution (Minimum Essential Medium Eagle, product no. M0643) supplemented with the following: 2.5 g/L taurine, 200 mg/L NaH2PO4, 2.2 g/L NaHCO3, 175 mg/L pyruvic acid, 13.5 mg/L allopurinol, and 750 mg/L D-ribose (pH = 7.3, equilibrated with a mixture 95% O2 and 5% CO2) at 15 °C until further use within 36 h after isolation. The percentage of living cells (having clear cytoplasm, sharp edges, and clear striations) were usually 30–60%, and only these were used for experiments.

4.2. Electrophysiology

Cells were placed in a plexiglass chamber with a volume of 1 mL and continuously superfused with bicarbonate buffer containing Tyrode solution (BTY) containing (in mmol/L): NaCl 121; KCl 4; MgCl2 1; CaCl2 1.3; HEPES 10; glucose 10; NaHCO3 25 (pH = 7.3; adjusted with NaOH) supplied by a gravity-driven system at a speed of 2 mL/min. During experiments, the bath temperature was set to 37 °C by a temperature controller (Cell Micro Controls, Norfolk, VA, USA). Cells were visualized by inverted microscopes placed in a Faraday cage on an anti-vibration table (Newport, Rochester, NY, USA). Electrical signals were recorded with intracellular amplifiers (MultiClamp 700A or 700B, Molecular Devices, San Jose, CA, USA) after analogue–digital conversion (Digidata 1440A or 1332, Molecular Devices, San Jose, CA, USA) and recorded with pClamp 10 software (Molecular Devices, San Jose, CA, USA). Cells were perfused with 1 μM ABT-333 (Cayman Chemical, Ann Arbor, MI, USA, product no. 18482) for 15 min, followed by a 20-minute-long period of washout. When higher ABT-333 concentrations were used (1-3-10–30 μM), each concentration was applied for 5 min in a cumulative manner. ABT-333 was dissolved in DMSO so that the maximal DMSO concentration (in case of 30 μM ABT-333) was 1.5%, which did not affect any of the AP parameters studied (Table S2.).

4.3. Recording of Action Potentials

Action potentials (APs) were measured with 3 mol/L KCl containing borosilicate microelectrodes with a tip resistance of 20–50 MΩ. A 1 s cycle length steady-state pacing was achieved for supra-threshold current pulses (2 ms long, 120–130% of threshold) produced by an electronic stimulator (DS-R3; Főnixcomp Ltd., Debrecen, Hungary). APs were digitized at 50 kHz, and upon the off-line analysis of APs, the following parameters were determined in ten consecutive APs then averaged: APD50 and APD90 values (duration of the AP from the peak to 50 and 90% of repolarization, respectively); maximal rate of phases 0, 1, and 3 (V + max, VPh1max, and V − max, respectively); resting membrane potential (RMP); overshoot potential (OSP); APA (action potential amplitude, determined as the difference between OSP and RMP); and membrane potential difference between the RMP and the membrane potential value of at the 20% and 50% durations of APD90 (Plateau20 and Plateau50 amplitudes, respectively).

4.4. Action Potential Voltage Clamp (APVC) Studies

Action potential voltage clamp experiments were conducted according to the method described previously [2], and signals were digitized at 50 kHz. In the experiments, a previously recorded typical AP (recorded with 700 ms long cycle length pacing on a midmyocardial cell, termed as “canonic” AP) was applied to the voltage clamped cells as command signal. In action potential voltage clamp experiments, ABT-333-sensitive current was obtained by pharmacological subtraction calculated by deducting the current signals recorded in the presence of 10 µM ABT-333 from those measured in the control condition (BTY) [2]. On this ABT-333-sensitive current, an outward (positive) current will be seen in cases of both the ABT-333-induced inhibition of an outward current as well as the ABT-333-induced increase in an inward current.
Membrane currents were recorded using the patch-clamp technique [43] in whole-cell configuration. The cells were superfused with bicarbonate buffer containing Tyrode solution (see above for composition) at 37 °C. Borosilicate glass micropipettes had tip resistance of 2–3 MΩ after filling with pipette solution containing (in mmol/L) K-aspartate 120, KCl 30, MgATP 3, HEPES 10, Na2-phosphocreatine 3, EGTA 0.01, cAMP 0.002, and KOH 10 at pH = 7.3 with an osmolarity of 285 mOsm measured with a vapor pressure osmometer (Vapro 5520, Wescor Inc., Logan, UT, USA). After establishing high (1–10 GΩ)-resistance seal by gentle suction, the cell membrane beneath the tip of the electrode was disrupted by further suction and/or by applying 1.5 V electrical pulses for 1 ms. The series resistance was typically 4–6 MΩ. Experiments were discarded when the series resistance was high or substantially increased during the measurement. Ion currents were normalized to cell capacitance using short hyperpolarizing pulses to −10 mV for 45 ms from 20 ms long depolarization to 0 mV from the holding voltage of −80 mV applied at 10 Hz. The average value of cell capacitance was 154.2 ± 6.4 pF in the 7 myocytes studied.

4.5. Recording of hERG Currents

Whole-cell currents of voltage-clamped HEK (human embryonic kidney) cells stably expressing hERG channels were recorded by manual patch-clamp according to standard protocols using Axopatch 200B amplifiers connected to computers via Digidata 1550B digitizers (Molecular Devices, San Jose, CA, USA). Pipettes were pulled from GC 150F-15 borosilicate glass capillaries (Harvard Apparatus, Hollister, MA, USA) in three stages with 3–5 MΩ resistance. Immediately before the measurement, the cells were maintained in the recording Petri dish in bath solution (i.e., control solution, composition in mmol/L: choline chloride 140, KCl 5, MgCl2 2, CaCl2 2, glucose 20, HEPES 10, and CdCl2 0.1; pH = 7.35 (adjusted with NaOH)). For the recordings, the composition of the solution used in patch pipette (internal solution) was made of in mmol/L: KCl 140, HEPES 10, MgCl2 2, and EGTA 10, pH = 7.3 (adjusted with KOH). To test if the charge carrier was K+, a high concentration potassium solution (in mmol/L: KCl 150, HEPES 10, glucose 5.5, MgCl2 1, CaCl2 1; pH = 7.35, adjusted with KOH) was used as a positive control. ABT-333 was diluted to 30, 10, 3, and 1 μM concentrations. As ABT-333 was dissolved in DMSO, DMSO was also added to the control solution in 1.5% V/V. Solution exchange was achieved by using a gravity-flow system with continuous excess fluid removal. To avoid the changing of junction potentials during solution changes, the reference electrode, placed in a dish containing internal solution, was connected to the bath solution with an agar bridge. For the voltage-clamp measurements, a holding potential of -80 mV was used. Patch-clamp data were acquired with pClamp10 (Molecular Devices, San Jose, CA, USA). In general, currents were low pass filtered using the built-in analog four-pole Bessel filters of the amplifiers and sampled at 20 kHz. Before analysis, whole-cell current traces were digitally filtered (five-point boxcar smoothing). Experiments were performed at room temperature, ranging between 20 and 24 °C. Clampfit 10.7 (Molecular Devices, San Jose, CA, USA) and Graphpad Prism 7 (Graphpad, San Diego, CA, USA) were used for data display and analysis. The G-V curves were assembled by the normalization of the tail currents and fit with the Boltzmann equation ( G = 1 / ( 1 + e V 1 / 2 V / k ) ) , where k is the slope factor, V is the set membrane potential, and V1/2 is the midpoint voltage. The concentration–response curve was fit with the Hill equation ( R C F = 1 / ( 1 + ( c n H / I C 50 n H ) ) ) , where RCF is the remaining current fraction, nH is the Hill coefficient, [c] is the concentration of the ABT-333, and the IC50 is the concentration where half of the channels are inhibited. The RCF values were calculated by the following equation: R C F = I A B T / I c o n t r o l , where IABT is the tail current measured in the presence of ABT-333, and Icontrol is the tail current measured in control solution. The time dependence was fit with a one-phase exponential decay equation Y = Y 0 C × e t / τ + C , where Y0 is the Y value when time (t) is zero, C is the plateau where Y saturates over time, and τ is the time constant.

4.6. Statistical Analysis

All values are presented as arithmetic means ± standard error of the mean (SEM). Given the biological variability among cells, each cell was treated as independent in the statistical tests, although more cells could be obtained from the same animal. The statistical significance of differences was evaluated using paired Student’s t-tests. Differences were considered significant when p was less than 0.05, and this is indicated with asterisks on graphs.

Supplementary Materials

The following supporting information can be downloaded at https://www.mdpi.com/article/10.3390/ph16040488/s1, Figure S1: The effect of the ABT-333 on the gating transitions of the hERG channel; Table S1: AP parameters obtained with 1 nM ABT-333; Table S2: AP parameters obtained with 1.5% DMSO.

Author Contributions

Conceptualization, N.S. and P.P.N.; methodology, J.Ó., Z.M.K. and C.D.; formal analysis, Z.M.K. and A.F.; investigation, J.Ó., Z.M.K., C.D. and A.F.; writing—original draft preparation, N.S.; writing—review and editing, T.B., J.M., A.F., Z.V. and B.H.; supervision, P.P.N. and N.S.; funding acquisition, P.P.N., B.H. and N.S. All authors have read and agreed to the published version of the manuscript.

Funding

This work was funded by the National Research Development and Innovation Office (NKFIH-K138090 to C.D., J.M., N.S. and P.P.N.; NKFIH-K142764 to J.O., Z.M.K., C.D., J.M., T.B. and N.S.; NKFIH-FK128116 to T.B., N.S., J.M., C.D. and B.H.; and NKFIH-K132906 to Z.V.). Support was also obtained from the Thematic Excellence Program of the Ministry for Innovation and Technology in Hungary (TKP-2020-NKA-04), within the framework of the Space Sciences thematic program of the University of Debrecen. Z.M.K. was supported by the ÚNKP-22-3-II-DE-112 New National Excellence Program of the Ministry for Innovation and Technology from the source of National Research Development and Innovation Fund. A.F. was supported by the ÚNKP-22-3-II-DE-38 New National Excellence Program of the Ministry for Innovation and Technology from the source of National Research Development and Innovation Fund. Funding sources had no involvement in the preparation of the article; in the study design; in the collection, analysis, and interpretation of data; in the writing of the report; and in the decision to submit the article for publication.

Institutional Review Board Statement

The animal study protocol was approved by the local Ethics Committee in line with the ethical standards laid down in the Declaration of Helsinki in 1964 and its later amendments as well as with the Guide to the Care and Use of Experimental Animals (Vol. 1, 2nd ed., 1993, and Vol. 2, 1984, Canadian Council on Animal Care) (protocol code 2/2020/DEMÁB, date of approval: 15 June 2020).

Informed Consent Statement

Not applicable.

Data Availability Statement

Data is contained within the article and Supplementary Material.

Conflicts of Interest

The authors declare no conflict of interest.

Abbreviations

ABT-333another name of the dasabuvir molecule
APaction potential
APAaction potential amplitude
APDaction potential duration
APD50action potential duration at 50% of repolarization
APD90action potential duration at 90% of repolarization
APVCaction potential voltage clamp
BTYbicarbonate buffer containing Tyrode solution
Cmaxmaximal plasma concentration
CYP2C8cytochrome P450 2C8 enzyme
EADearly afterdepolarization
HCVhepatitis C virus
HEKhuman embryonic kidney
IC50half maximal inhibitory concentration
Iendsusend of the ABT-333-sensitive sustained outward current
IK1inward rectifier potassium current
IKrrapid component of the delayed rectifier potassium current
INasodium current
Itotransient outward potassium current
LQTS2long QT syndrome type 2
OSPovershoot potential
VPh1maxmaximal rate of phase 1 repolarization
Plateau20 amplitudedifference between RMP and membrane potential value of at 20% duration of APD90
Plateau50 amplitudedifference between RMP and membrane potential value of at 50% duration of APD90
RCFremaining current fraction
RMPresting membrane potential
SVshort-term variability of repolarization
TdPtorsade de pointes
V + maxmaximal rate of phase 0 depolarization
V − maxmaximal rate of phase 3 repolarization

References

  1. Bányász, T.; Magyar, J.; Szentandrássy, N.; Horváth, B.; Birinyi, P.; Szentmiklósi, J.; Nánási, P.P. Action potential clamp fingerprints of K+ currents in canine cardiomyocytes: Their role in ventricular repolarization. Acta Physiol. 2007, 190, 189–198. [Google Scholar] [CrossRef]
  2. Horváth, B.; Kiss, D.; Dienes, C.; Hézső, T.; Kovács, Z.; Szentandrássy, N.; Almássy, J.; Magyar, J.; Bányász, T.; Nánási, P.P. Ion current profiles in canine ventricular myocytes obtained by the “onion peeling” technique. J. Mol. Cell. Cardiol. 2021, 158, 153–162. [Google Scholar] [CrossRef] [PubMed]
  3. Sanguinetti, M.C.; Zou, A. Molecular physiology of cardiac delayed rectifier K+ channels. Heart Vessel. 1997, (Suppl. S12), 170–172. [Google Scholar]
  4. Tseng, G.N. I(Kr): The hERG channel. J. Mol. Cell. Cardiol. 2001, 33, 835–849. [Google Scholar] [CrossRef] [PubMed]
  5. Vaughan Williams, E.M. Classifying antiarrhythmic actions: By facts or speculation. J. Clin. Pharmacol. 1992, 32, 964–977. [Google Scholar] [CrossRef] [PubMed]
  6. Christophe, B. Occurrence of early afterdepolarization under healthy or hypertrophic cardiomyopathy conditions in the human ventricular endocardial myocyte: In silico study using 109 torsadogenic or non-torsadogenic compounds. Toxicol. Appl. Pharmacol. 2022, 438, 115914. [Google Scholar] [CrossRef]
  7. Studenik, C.R.; Zhou, Z.; January, C.T. Differences in action potential and early afterdepolarization properties in LQT2 and LQT3 models of long QT syndrome. Br. J. Pharmacol. 2001, 132, 85–92. [Google Scholar] [CrossRef]
  8. Szentandrássy, N.; Kistamás, K.; Hegyi, B.; Horváth, B.; Ruzsnavszky, F.; Váczi, K.; Magyar, J.; Bányász, T.; Varró, A.; Nánási, P.P. Contribution of ion currents to beat-to-beat variability of action potential duration in canine ventricular myocytes. Pflug. Arch. 2015, 467, 1431–1443. [Google Scholar] [CrossRef] [Green Version]
  9. Baumert, M.; Porta, A.; Vos, M.A.; Malik, M.; Couderc, J.P.; Laguna, P.; Piccirillo, G.; Smith, G.L.; Tereshchenko, L.G.; Volders, P.G. QT interval variability in body surface ECG: Measurement, physiological basis, and clinical value: Position statement and consensus guidance endorsed by the European Heart Rhythm Association jointly with the ESC Working Group on Cardiac Cellular Electrophysiology. Europace 2016, 18, 925–944. [Google Scholar] [CrossRef]
  10. Shimizu, W.; Antzelevitch, C. Cellular basis for long QT, transmural dispersion of repolarization, and torsade de pointes in the long QT syndrome. J. Electrocardiol. 1999, 32, 177–184. [Google Scholar] [CrossRef]
  11. Curran, M.E.; Splawski, I.; Timothy, K.W.; Vincent, G.M.; Green, E.D.; Keating, M.T. A molecular basis for cardiac arrhythmia: HERG mutations cause long QT syndrome. Cell 1995, 80, 795–803. [Google Scholar] [CrossRef] [PubMed] [Green Version]
  12. Plante, I.; Vigneault, P.; Drolet, B.; Turgeon, J. Rosuvastatin blocks hERG current and prolongs cardiac repolarization. J. Pharm. Sci. 2012, 101, 868–878. [Google Scholar] [CrossRef] [PubMed]
  13. Feng, P.F.; Zhang, B.; Zhao, L.; Fang, Q.; Liu, Y.; Wang, J.N.; Xu, X.Q.; Xue, H.; Li, Y.; Yan, C.C.; et al. Intracellular Mechanism of Rosuvastatin-Induced Decrease in Mature hERG Protein Expression on Membrane. Mol. Pharm. 2019, 16, 1477–1488. [Google Scholar] [CrossRef]
  14. Thomas, D.; Hammerling, B.C.; Wu, K.; Wimmer, A.B.; Ficker, E.K.; Kirsch, G.E.; Kochan, M.C.; Wible, B.A.; Scholz, E.P.; Zitron, E.; et al. Inhibition of cardiac HERG currents by the DNA topoisomerase II inhibitor amsacrine: Mode of action. Br. J. Pharmacol. 2004, 142, 485–494. [Google Scholar] [CrossRef] [Green Version]
  15. Droc, G.; Istrate, M.; Mercan-Stanciu, A.; Dodot, M.; Isac, T.; Toma, L.; Zgura, A.; Trifan, A.; Serbanica, A.N.; Iliescu, L.; et al. Safety and Efficacy of Direct-acting Antiviral Therapies for Chronic HCV Infection in Hemodialysis Patients. In Vivo 2022, 36, 2918–2922. [Google Scholar] [CrossRef]
  16. Gentile, I.; Buonomo, A.R.; Borgia, G. Dasabuvir: A Non-Nucleoside Inhibitor of NS5B for the Treatment of Hepatitis C Virus Infection. Rev. Recent Clin. Trials 2014, 9, 115–123. [Google Scholar] [CrossRef] [PubMed]
  17. Zeuzem, S.; Jacobson, I.M.; Baykal, T.; Marinho, R.T.; Poordad, F.; Bourlière, M.; Sulkowski, M.S.; Wedemeyer, H.; Tam, E.; Desmond, P.; et al. Retreatment of HCV with ABT-450/r-ombitasvir and dasabuvir with ribavirin. N. Engl. J. Med. 2014, 370, 1604–1614. [Google Scholar] [CrossRef]
  18. Lavanchy, D. The global burden of hepatitis C. Liver Int. 2009, 29 (Suppl. S1), 74–81. [Google Scholar] [CrossRef]
  19. Raedler, L.A. Viekira Pak (Ombitasvir, Paritaprevir, and Ritonavir Tablets; Dasabuvir Tablets): All-Oral Fixed Combination Approved for Genotype 1 Chronic Hepatitis C Infection. Am. Health Drug Benefits 2015, 8, 142–147. [Google Scholar]
  20. Wong, J.B.; McQuillan, G.M.; McHutchison, J.G.; Poynard, T. Estimating future hepatitis C morbidity, mortality, and costs in the United States. Am. J. Public Health 2000, 90, 1562–1569. [Google Scholar] [CrossRef] [Green Version]
  21. Li, T.; Qu, Y.; Guo, Y.; Wang, Y.; Wang, L. Efficacy and safety of direct-acting antivirals-based antiviral therapies for hepatitis C virus patients with stage 4–5 chronic kidney disease: A meta-analysis. Liver Int. 2017, 37, 974–981. [Google Scholar] [CrossRef] [PubMed]
  22. Ucciferri, C.; Occhionero, A.; Vecchiet, J.; Falasca, K. Cardiac Toxicity Associated with HCV Direct Antiviral Agents. Mediterr. J. Hematol. Infect. Dis. 2018, 10, e2018069. [Google Scholar] [CrossRef] [PubMed]
  23. Özer Etik, D.; Suna, N.; Öcal, S.; Selçuk, H.; Dağlı, Ü.; Çolak, T.; Hilmioğlu, F.; Boyacıoğlu, A.S.; Haberal, M. Successful Treatment With Direct-Acting Antiviral Agents of Hepatitis C in Patients With End-Stage Renal Disease and Kidney Transplant Recipients. Exp. Clin. Transpl. 2019, 17, 52–58. [Google Scholar] [CrossRef]
  24. Pockros, P.J.; Reddy, K.R.; Mantry, P.S.; Cohen, E.; Bennett, M.; Sulkowski, M.S.; Bernstein, D.E.; Cohen, D.E.; Shulman, N.S.; Wang, D.; et al. Efficacy of Direct-Acting Antiviral Combination for Patients With Hepatitis C Virus Genotype 1 Infection and Severe Renal Impairment or End-Stage Renal Disease. Gastroenterology 2016, 150, 1590–1598. [Google Scholar] [CrossRef] [Green Version]
  25. Stark, J.E. Potential for a Significant Interaction Between Clopidogrel and Dasabuvir. Clin. Infect. Dis. 2015, 61, 134–135. [Google Scholar] [CrossRef] [PubMed] [Green Version]
  26. Arya, V.; Zhao, P.; Reynolds, K.S.; Mishra, P.; Younis, I.R. Utilizing PBPK Modeling to Evaluate the Potential of a Significant Drug-Drug Interaction Between Clopidogrel and Dasabuvir: A Scientific Perspective. Clin. Pharmacol. Ther. 2017, 102, 578–580. [Google Scholar] [CrossRef] [PubMed]
  27. Nánási, P.P.; Horváth, B.; Tar, F.; Almássy, J.; Szentandrássy, N.; Jost, N.; Baczkó, I.; Bányász, T.; Varró, A. Canine Myocytes Represent a Good Model for Human Ventricular Cells Regarding Their Electrophysiological Properties. Pharmaceuticals 2021, 14, 748. [Google Scholar] [CrossRef]
  28. Zygmunt, A.C.; Robitelle, D.C.; Eddlestone, G.T. Ito1 dictates behavior of ICl(Ca) during early repolarization of canine ventricle. Am. J. Physiol. 1997, 273, H1096–H1106. [Google Scholar] [CrossRef]
  29. Szentandrássy, N.; Nagy, D.; Ruzsnavszky, F.; Harmati, G.; Bányász, T.; Magyar, J.; Szentmiklósi, A.J.; Nánási, P.P. Powerful technique to test selectivity of agents acting on cardiac ion channels: The action potential voltage-clamp. Curr. Med. Chem. 2011, 18, 3737–3756. [Google Scholar] [CrossRef]
  30. Varró, A.; Tomek, J.; Nagy, N.; Virág, L.; Passini, E.; Rodriguez, B.; Baczkó, I. Cardiac transmembrane ion channels and action potentials: Cellular physiology and arrhythmogenic behavior. Physiol. Rev. 2021, 101, 1083–1176. [Google Scholar] [CrossRef] [PubMed]
  31. Sanguinetti, M.C.; Jurkiewicz, N.K. Two components of cardiac delayed rectifier K+ current. Differential sensitivity to block by class III antiarrhythmic agents. J. Gen Physiol. 1990, 96, 195–215. [Google Scholar] [CrossRef] [PubMed]
  32. Kati, W.; Koev, G.; Irvin, M.; Beyer, J.; Liu, Y.; Krishnan, P.; Reisch, T.; Mondal, R.; Wagner, R.; Molla, A.; et al. In vitro activity and resistance profile of dasabuvir, a nonnucleoside hepatitis C virus polymerase inhibitor. Antimicrob. Agents Chemother. 2015, 59, 1505–1511. [Google Scholar] [CrossRef] [Green Version]
  33. King, J.R.; Khatri, A.; Trinh, R.; Viani, R.M.; Ding, B.; Zha, J.; Menon, R. Pharmacokinetic Evaluation of Darunavir Administered Once or Twice Daily in Combination with Ritonavir or the Three-Direct-Acting Antiviral Regimen of Ombitasvir/Paritaprevir/Ritonavir and Dasabuvir in Adults Coinfected with Hepatitis C and Human Immunodeficiency Viruses. Antimicrob. Agents Chemother. 2017, 61, e02135-16. [Google Scholar] [CrossRef] [Green Version]
  34. King, J.R.; Zha, J.; Khatri, A.; Dutta, S.; Menon, R.M. Clinical Pharmacokinetics of Dasabuvir. Clin. Pharmacokinet. 2017, 56, 1115–1124. [Google Scholar] [CrossRef] [PubMed]
  35. Menon, R.M.; Badri, P.S.; Wang, T.; Polepally, A.R.; Zha, J.; Khatri, A.; Wang, H.; Hu, B.; Coakley, E.P.; Podsadecki, T.J.; et al. Drug-drug interaction profile of the all-oral anti-hepatitis C virus regimen of paritaprevir/ritonavir, ombitasvir, and dasabuvir. J. Hepatol. 2015, 63, 20–29. [Google Scholar] [CrossRef] [Green Version]
  36. Li, M.; Jiang, J.; Yue, L. Functional characterization of homo- and heteromeric channel kinases TRPM6 and TRPM7. J. Gen Physiol. 2006, 127, 525–537. [Google Scholar] [CrossRef] [Green Version]
  37. Prakriya, M.; Lewis, R.S. Potentiation and inhibition of Ca2+ release-activated Ca2+ channels by 2-aminoethyldiphenyl borate (2-APB) occurs independently of IP3 receptors. J. Physiol. 2001, 536, 3–19. [Google Scholar] [CrossRef]
  38. Zhou, J.; Augelli-Szafran, C.E.; Bradley, J.A.; Chen, X.; Koci, B.J.; Volberg, W.A.; Sun, Z.; Cordes, J.S. Novel potent human ether-a-go-go-related gene (hERG) potassium channel enhancers and their in vitro antiarrhythmic activity. Mol. Pharmacol. 2005, 68, 876–884. [Google Scholar] [CrossRef]
  39. Casis, O.; Olesen, S.P.; Sanguinetti, M.C. Mechanism of action of a novel human ether-a-go-go-related gene channel activator. Mol. Pharmacol. 2006, 69, 658–665. [Google Scholar] [CrossRef] [PubMed] [Green Version]
  40. Hansen, R.S.; Diness, T.G.; Christ, T.; Wettwer, E.; Ravens, U.; Olesen, S.P.; Grunnet, M. Biophysical characterization of the new human ether-a-go-go-related gene channel opener NS3623 [N-(4-bromo-2-(1H-tetrazol-5-yl)-phenyl)-N′-(3′-trifluoromethylphenyl)urea]. Mol. Pharmacol. 2006, 70, 1319–1329. [Google Scholar] [CrossRef] [Green Version]
  41. Gerlach, A.C.; Stoehr, S.J.; Castle, N.A. Pharmacological removal of human ether-à-go-go-related gene potassium channel inactivation by 3-nitro-N-(4-phenoxyphenyl) benzamide (ICA-105574). Mol. Pharmacol. 2010, 77, 58–68. [Google Scholar] [CrossRef] [PubMed]
  42. Su, Z.; Limberis, J.; Souers, A.; Kym, P.; Mikhail, A.; Houseman, K.; Diaz, G.; Liu, X.; Martin, R.L.; Cox, B.F.; et al. Electrophysiologic characterization of a novel hERG channel activator. Biochem. Pharmacol. 2009, 77, 1383–1390. [Google Scholar] [CrossRef] [PubMed]
  43. Hamill, O.P.; Marty, A.; Neher, E.; Sakmann, B.; Sigworth, F.J. Improved patch-clamp techniques for high-resolution current recording from cells and cell-free membrane patches. Pflug. Arch. 1981, 391, 85–100. [Google Scholar] [CrossRef] [PubMed]
Figure 1. Chemical structures of ABT-333 and two IKr blockers. All structures were created by ChemDrawPro 12.0 software.
Pharmaceuticals 16 00488 g001
Figure 2. Effects of 1 μM ABT-333 on left ventricular AP. (A) Representative action potentials. The black trace is the AP measured in BTY (control solution), the red is the presence of 1 μM ABT-333, while the gray is after washout. (BD) Diagrams showing AP parameters in control condition (BTY, black), in the presence of ABT-333 (1 µM, red) and after washout of ABT-333 (grey) where filled diamond symbols, circles, and whiskers show the individual values, means, and ±SEM, respectively. Values of action potential duration measured at 90% of repolarization (APD90, (B)), maximal rate of depolarization (V + max, (C)), and maximal rate of early repolarization (VPh1max, (D)) obtained in 8 examined cells isolated from 4 animals. Asterisks show statistically significant difference from control (p < 0.05).
Pharmaceuticals 16 00488 g002
Figure 3. Effects of 1–30 μM ABT-333 on left ventricular AP. (A) Representative action potentials. The black trace is the AP measured in BTY (control solution), the color-coded ones are in the presence of increasing ABT-333 concentrations. (BD) Diagrams showing AP parameters in the control condition (black) and in the presence of ABT-333 (various concentrations using color coding) where filled diamond symbols, circles, and whiskers show the individual values, means, and ±SEM, respectively. Values of early phase plateau amplitude (plateau20 amplitude, (B)), action potential duration measured at 50% of repolarization (APD50, (C)), and action potential duration measured at 90% of repolarization (APD90, (D)), obtained in 10 cells from 7 animals, except in 30 μM ABT-333, where it was 7 cells from 6 animals. Asterisks show statistically significant difference from control (p < 0.05).
Pharmaceuticals 16 00488 g003
Figure 4. EAD formation in the presence of ABT-333. (A) Representative action potentials measured consecutively in the presence of 30 µM ABT-333. Red traces show APs with EADs. (B) Diagram shows the percentages of cells developing EADs out of the 10 studied cells obtained from 7 animals.
Pharmaceuticals 16 00488 g004
Figure 5. Representative APVC experiment. (A) The canonical action potential, which was used as stimulus command. (B) Current traces recorded before (black trace) and in the presence of 10 µM ABT-333 (blue trace). (C) The 10 µM ABT-333-sensitive current calculated by deducting the blue trace from the black one on panel B.
Pharmaceuticals 16 00488 g005
Figure 6. ABT-333-sensitive current in APVC condition. (A) The canonical action potential, which was used as stimulus command. (B) Average (red trace) ± SEM (black dotted lines) of 10 µM ABT-333-sensitive current. c marks the early outward peak, while d indicates the end of the sustained outward current (Iendsus). (C) Correlation of early outward peak current density values (indicated with c on panel B) with VPh1max of the own APs. (D) Relationship between density of Iendsus values (indicated with d on panel B) and V − max values of the own APs.
Pharmaceuticals 16 00488 g006
Figure 7. Effects of ABT-333 on hERG current expressed in HEK cells. ((A) left) A representative patch-clamp recording in voltage clamp mode. The black trace is the current measured in control solution, while the blue trace is with 30 μM ABT-333 perfusion (red trace represents perfusion-test high K+ application, and gray trace shows washout). ((A) right) The trace of the ABT-333 inhibited current is magnified. ((B) left) Averaged and normalized (to the peak current in control solution) current traces (n = 5). ((B) right) Magnified version of the ABT-333 time-dependent hERG current inhibition with individual time constants of the current decay (tau) as an inset. (C) Concentration–response curve of the ABT-333, which was fit on the 1, 3, 10, and 30 μM concentrations (n ≥ 4 for each concentration). Above the dose–response curve, a representative measurement of tail currents is shown in the control condition and during ABT-333 perfusion at the given concentrations. (D) G-V curves calculated from data measured in control solution (black) and in 30 μM ABT-333 (blue) (n = 3). Above the G-V curve, the voltage protocol is shown, and there are two representative measurements of the tail currents in control condition (black traces) and after the effect of 30 µM ABT-333 saturated (blue traces).
Pharmaceuticals 16 00488 g007
Table 1. AP parameters obtained with 1 μM ABT-333.
ParameterBTY (Control)1 μM ABT-333Washout
APA (mV)108.9 ± 2.5106.4 ± 3.0105.7 ± 3.6
APD50 (ms)220.0 ± 13.1236.7 ± 13.3225.5 ± 15.0
APD90 (ms)258.3 ± 15.4277.4 ± 15.3264.2 ± 17.5
APD50/APD900.85 ± 0.010.85 ± 0.010.85 ± 0.01
OSP (mV)17.6 ± 2.013.7 ± 3.012.0 ± 3.4
VPh1max (V/s)−4.00 ± 1.28−1.79 ± 0.67−1.29 ± 0.50
Plateau20 amplitude (mV)106.6 ± 1.9107.3 ± 2.4107.0 ± 2.5
Plateau50 amplitude (mV)90.0 ± 2.089.1 ± 2.389.2 ± 2.5
RMP (mV)−81.2 ± 1.4−82.6 ± 1.6−83.7 ± 1.3
V + max (V/s)185.6 ± 12.6151.0 ± 9.9141.4 ± 9.6
V − max (V/s)−1.72 ± 0.08−1.64 ± 0.07−1.65 ± 0.08
Values in bold indicate significant difference versus BTY (control) (p < 0.05). Data are mean ± SEM from 8 cells obtained from 4 animals. Explanation of abbreviations can be found in the list of abbreviations.
Table 2. AP parameters recorded with increasing ABT-333 concentrations.
ParameterBTY
(Control)
ABT-333
(1 μM)
ABT-333
(3 μM)
ABT-333
(10 μM)
ABT-333
(30 μM)
APA (mV)115.9 ± 2.5115.6 ± 2.4117.0 ± 2.6117.5 ± 2.5115.9 ± 1.6
APD50 (ms)198.8 ± 14.4213.8 ± 14.2252.2 ± 22.5273.9 ± 25.3284.3 ± 29.4
APD90 (ms)223.8 ± 14.9238.6 ± 13.6281.7 ± 21.7317.4 ± 26.5317.5 ± 28.7
APD50/APD900.80 ± 0.010.79 ± 0.020.81 ± 0.010.78 ± 0.020.77 ± 0.02
OSP (mV)32.6 ± 2.731.3 ± 2.931.9 ± 2.933.3 ± 2.732.7 ± 2.5
VPh1max (V/s)−7.44 ± 1.47−6.69 ± 1.40−5.99 ± 1.37−4.21 ± 1.01−3.63 ± 1.15
Plateau20 amplitude (mV)102.3 ± 1.2103.4 ± 1.5106.8 ± 1.8108.6 ± 2.2110.7 ± 1.9
Plateau50 amplitude (mV)84.9 ± 1.284.5 ± 2.286.3 ± 1.584.4 ± 2.683.6 ± 2.5
RMP (mV)−81.3 ± 1.2−82.3 ± 1.6−83.0 ± 1.1−82.2 ± 1.2−83.1 ± 1.8
V + max (V/s)189.6 ± 22.6169.5 ± 18.0167.4 ± 15.1152.4 ± 14.3123.5 ± 21.0
V − max (V/s)−1.78 ± 0.08−1.71 ± 0.09−1.69 ± 0.07−1.53 ± 0.07−1.42 ± 0.09
Values in bold indicate significant difference versus BTY (control) (p < 0.05). Data are mean ± SEM from 10 cells from 7 animals, except in 30 μM ABT-333, where it was 7 cells from 6 animals. Explanation of abbreviations can be found in the list of abbreviations.
Disclaimer/Publisher’s Note: The statements, opinions and data contained in all publications are solely those of the individual author(s) and contributor(s) and not of MDPI and/or the editor(s). MDPI and/or the editor(s) disclaim responsibility for any injury to people or property resulting from any ideas, methods, instructions or products referred to in the content.

