
Bioactive Diterpenes, Norditerpenes, and Sesquiterpenes from a Formosan Soft Coral Cespitularia sp.


1
Doctoral Degree Program in Marine Biotechnology, National Sun Yat-sen University, Kaohsiung 804, Taiwan
2
Institute of Biomedical Science, National Chung-Hsing University, Taichung 402, Taiwan
3
Department of Marine Biotechnology and Resources, National Sun Yat-sen University, Kaohsiung 804, Taiwan
4
Department of Medical Research, China Medical University Hospital, China Medical University, Taichung 404, Taiwan
5
Graduate Institute of Natural Products, Kaohsiung Medical University, Kaohsiung 807, Taiwan
6
Frontier Center for Ocean Science and Technology, National Sun Yat-sen University, Kaohsiung 804, Taiwan
*
Author to whom correspondence should be addressed.
Pharmaceuticals 2021, 14(12), 1252; https://doi.org/10.3390/ph14121252
Submission received: 28 September 2021
/
Revised: 18 November 2021
/
Accepted: 28 November 2021
/
Published: 1 December 2021
(This article belongs to the Special Issue Chemistry and Biomedical Potential of Marine Natural Products)
Abstract
:Chemical investigation of the soft coral Cespitularia sp. led to the discovery of twelve new verticillane-type diterpenes and norditerpenes: cespitulins H–O (1–8), one cyclic diterpenoidal amide cespitulactam L (9), norditerpenes cespitulin P (10), cespitulins Q and R (11 and 12), four new sesquiterpenes: cespilins A–C (13–15) and cespitulolide (16), along with twelve known metabolites. The structures of these metabolites were established by extensive spectroscopic analyses, including 2D NMR experiments. Anti-inflammatory effects of the isolated compounds were studied by evaluating the suppression of pro-inflammatory protein tumor necrosis factor-α (TNF-α) and nitric oxide (NO) overproduction, and the inhibition of the gene expression of inducible nitric oxide synthase (iNOS) and cyclooxygenase-2 (COX-2), in lipopolysaccharide-induced dendritic cells. A number of these metabolites were found to exhibit promising anti-inflammatory activities.
1. Introduction
In the inflammatory stimuli, the inflammatory mediators such as tumor necrosis factor-α (TNF-α), prostaglandin E2 (PGE2), and nitric oxide (NO) are known to be secreted through lipopolysaccharide (LPS)-induced activation of macrophages [1,2,3] and dendritic cells [4,5,6,7]. Furthermore, the overexpression of two inducible proteins, inducible nitric oxide synthase (iNOS) and cyclooxygenase-2 (COX-2) produced the excess amount of NO and PGE2 in the inflammatory process. It has been well known that natural products have a great potential in drug discovery, thus the anti-inflammatory activity screening by evaluating the suppression of TNF-α and NO overproduction, and the inhibition of iNOS and COX-2 protein and gene expression, in LPS-induced macrophages or dendritic cells (DCs) is one of the important methods for searching for anti-inflammatory agents from natural compounds [8,9,10,11,12,13,14].
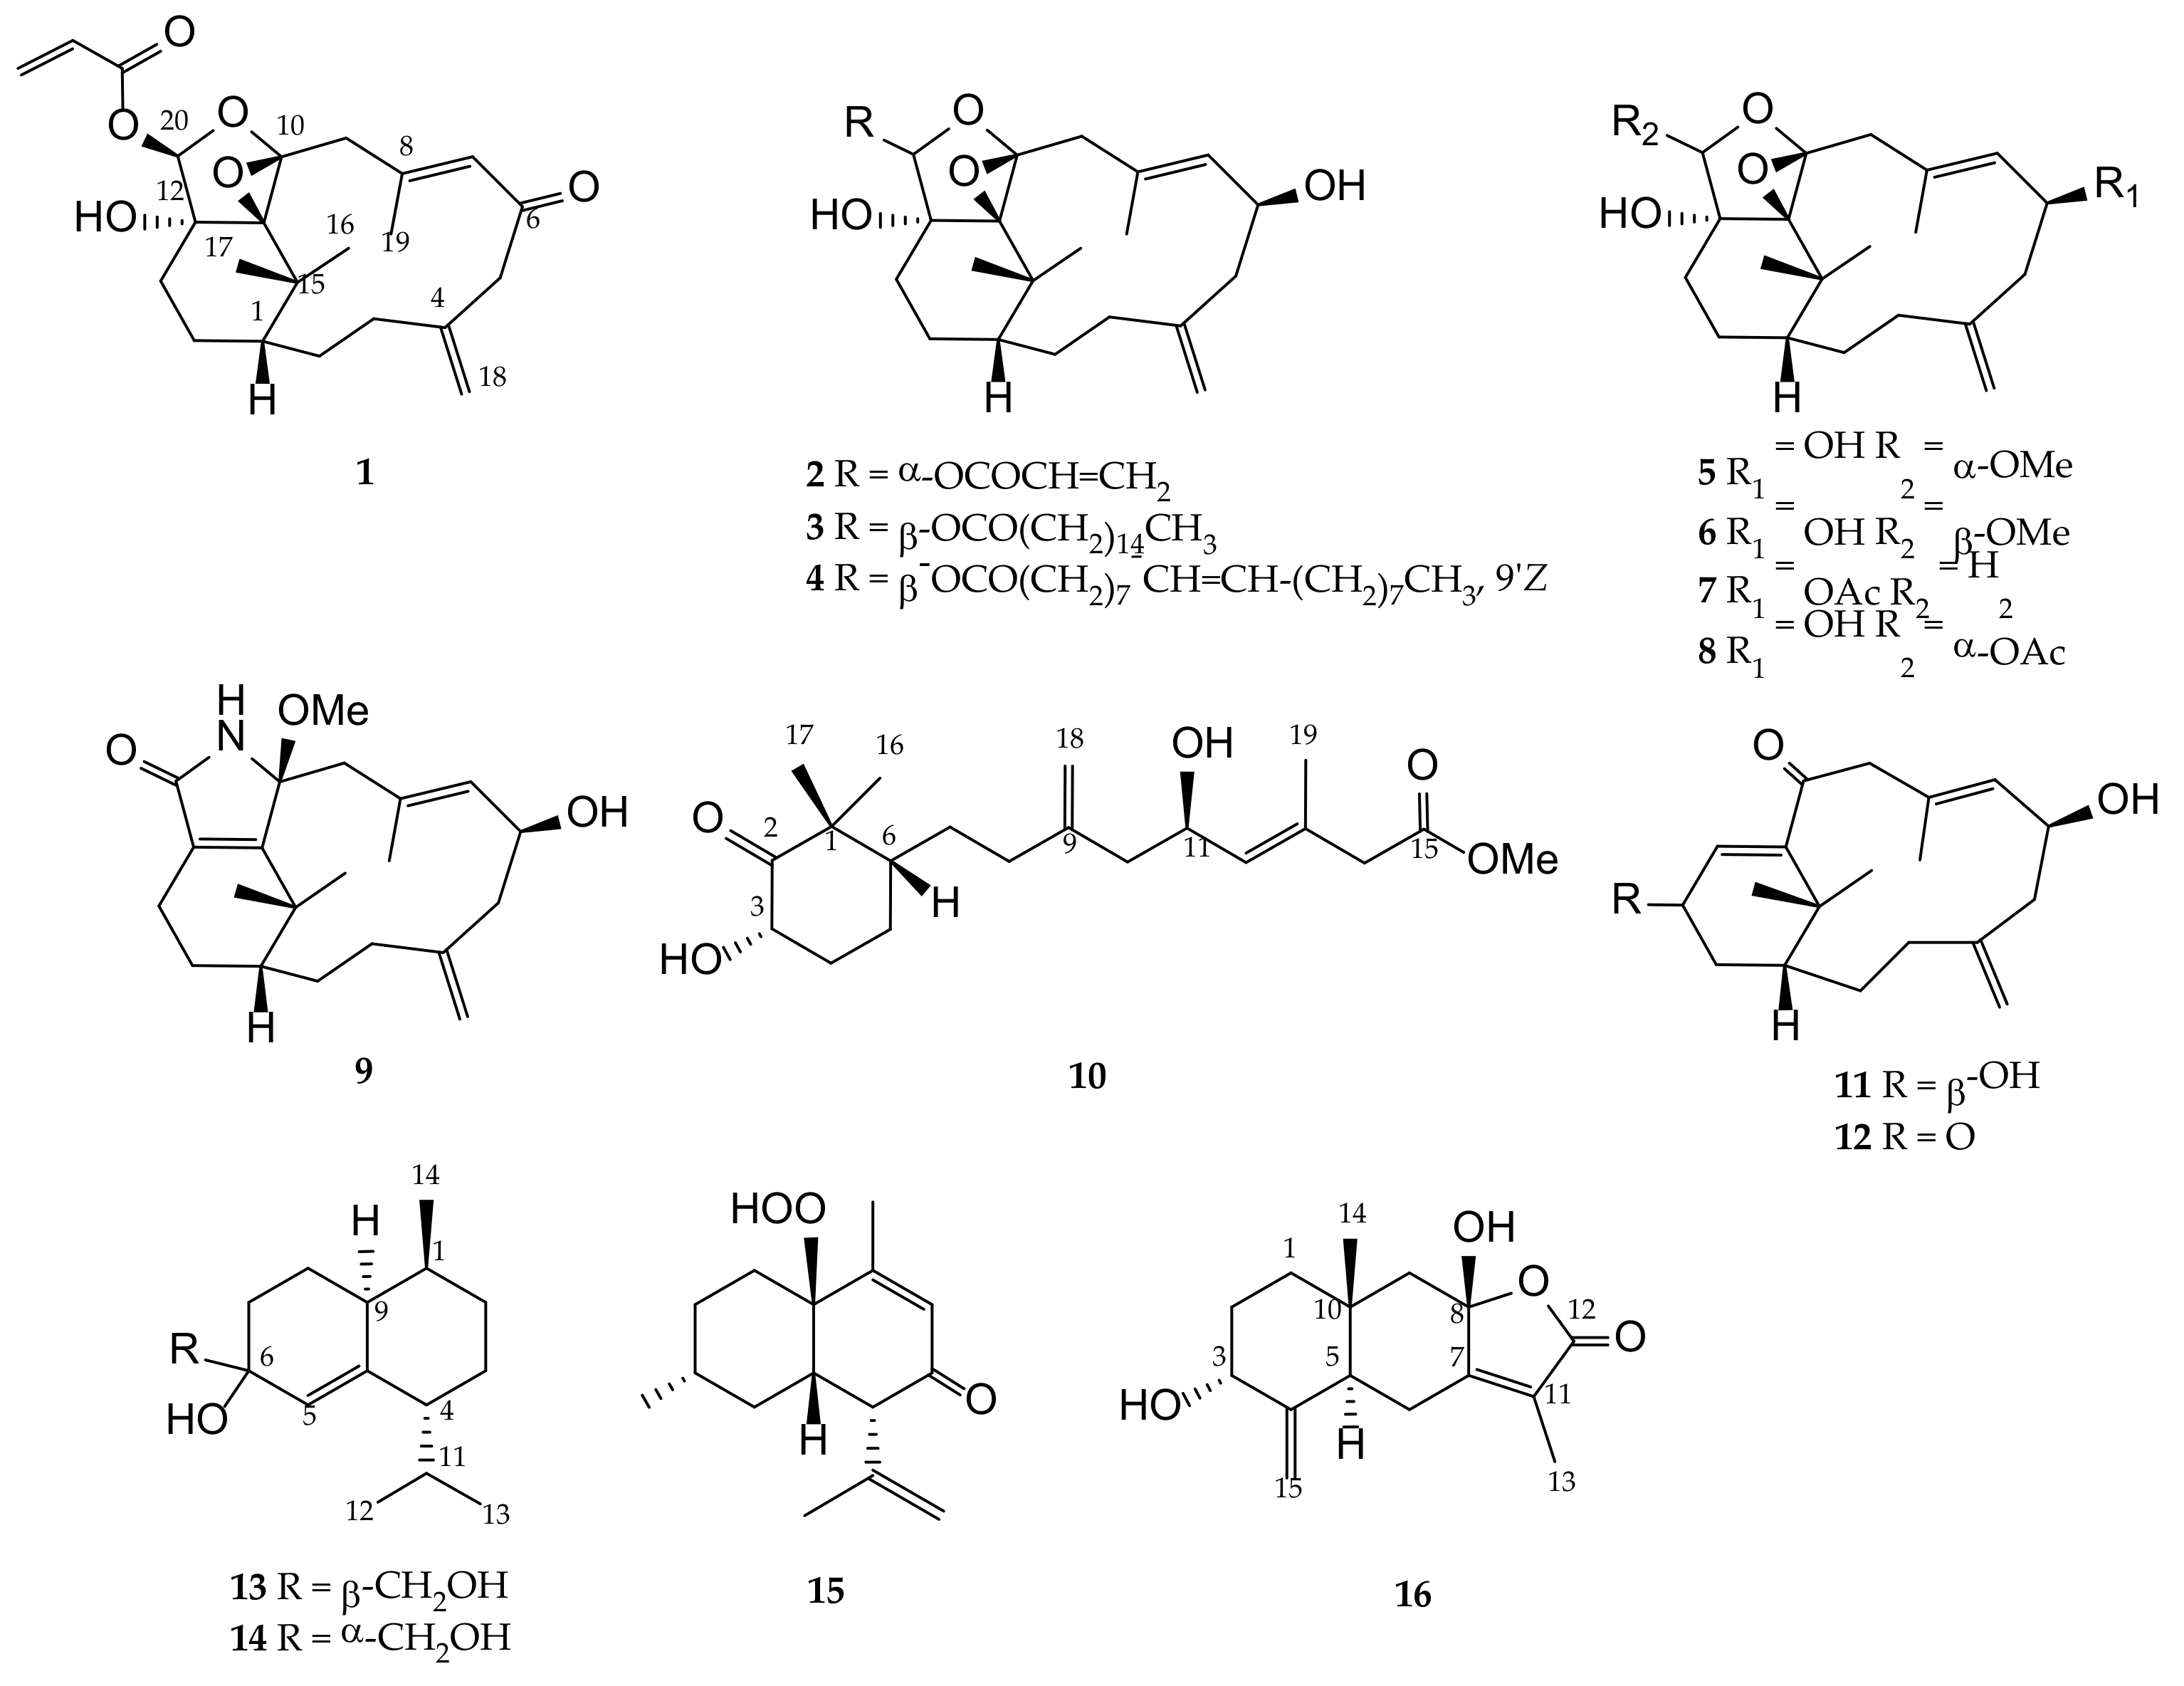
Soft corals, in particular, those belonging to the genus Cespitularia (family Xeniidae), have afforded a series of verticillane-type diterpenes and some eudesmane-type sesquiterpenoids [15]. Secondary metabolites obtained from these soft corals have been shown to exhibit interesting biological activities, including cytotoxic [16,17,18,19,20,21,22,23,24,25], anti-inflammatory [25,26,27], antimicrobial [22], and antiviral [28] activities. Following the above findings, and with the aim of discovering bioactive compounds from marine invertebrates for further biomedical studies, we carried out the chemical investigation of the EtOAc extract of a Formosan soft coral Cespitularia sp. to search the bioactive principles, as preliminary bioassay showed that this crude extract exhibited significant activity to suppress the release of TNF-α and NO, and inhibited the upregulation of pro-inflammatory iNOS and COX-2 gene in lipopolysaccharide (LPS)-induced DCs. This study has led to the isolation of twenty-eight compounds, including eight new verticillane-type diterpenes cespitulins H–O (1–8), one new cyclic verticillane-type diterpenoidal amide cespitulactam L (9), three new verticillane-type norditerpenes cespitulins P–R (10–12), three new cadinane-type sesquiterpenes cespilins A–C (13–15), and one new eudesmane-type sesquiterpenoid cespitulolide (16) (Figure 1), along with twelve known compounds, cespitularin Q (17) [18,26], cespitularin E (18) [17], cespihypotin D (19) [29], cespihypotin F (20) [28], cespitularin O (21) [18], cespitularin D (22) [17,20,21], cespitularin I (23) [18,26], cespitularin F (24) [17,20,21,22,26], atractylenolide III (25) [30,31,32,33], atractylenolide II (26) [31,33], atractylenolide V (27) [32], and 5-hydroxy-3,4-dimethyl-5-pentylfuran-2(5H)-one (hydroxydihydrobovolide) (28) [34] (Figure 2). The structures of the compounds were elucidated on the basis of extensive spectroscopic analyses (IR, MS, 1D, and 2D NMR) and by comparison of the spectroscopic data with those of related known compounds.
Additionally, in order to discover bioactive substances for future medicinal application, the anti-inflammatory activities of the inhibition of TNF-α and NO, and the suppression of iNOS and COX-2 gene expression in LPS-induced DCs of the isolated compounds 1–28 were also evaluated and are reported herein.
2. Results
2.1. Structure Elucidation of the Verticillane-Type Diterpenes 1–9
From the previously published reports [15,16,17,18,19,20,21,22,26,27,28,29], it was found that there is no unambiguous evidence for determining the absolute configuration of the verticillane-type compounds.
Cespitulin H (1) was isolated as a white amorphous powder and its molecular formula was established as C23H30O6 by HRESIMS (m/z 425.1932 [M + Na]+), accounting for nine degrees of unsaturation. The IR spectrum of 1 exhibited the absorption peaks of hydroxy (3480 cm–1) and carbonyl (1741 cm–1) groups. Assignment of two germinal methyls (δC 26.8 and 24.9, both CH3; δH 1.35 and 0.72, both s), a methyl (δC 19.2, CH3; δH 2.11, s), a vinyl group (δC 132.6, CH2 and 127.6, CH; δH 6.15, br d, J = 17.5 Hz, 5.16, dd, J = 10.5, 1.0 Hz and 5.77, dd, J = 17.5, 10.5 Hz), a 1,1-disubstituted double bond (δC 144.1, C and 116.5, CH2; δH 5.09 and 4.77, both s), a trisubstituted double bond (δC 148.5, C and 129.4, CH; δH 6.13, s), an acetal (δC 101.8, CH; δH 5.96, s), three other sp3 oxygenated carbons (δC 94.6, 80.0, and 72.8, C), a conjugated ester carbonyl (δC 164.9, C), and a conjugated ketone (δC 197.7, C) of verticillane-type diterpene were supported by analysis of the 13C and 1H NMR signals along with heteronuclear single quantum coherence (HSQC) spectrum (Table 1 and Table 2).
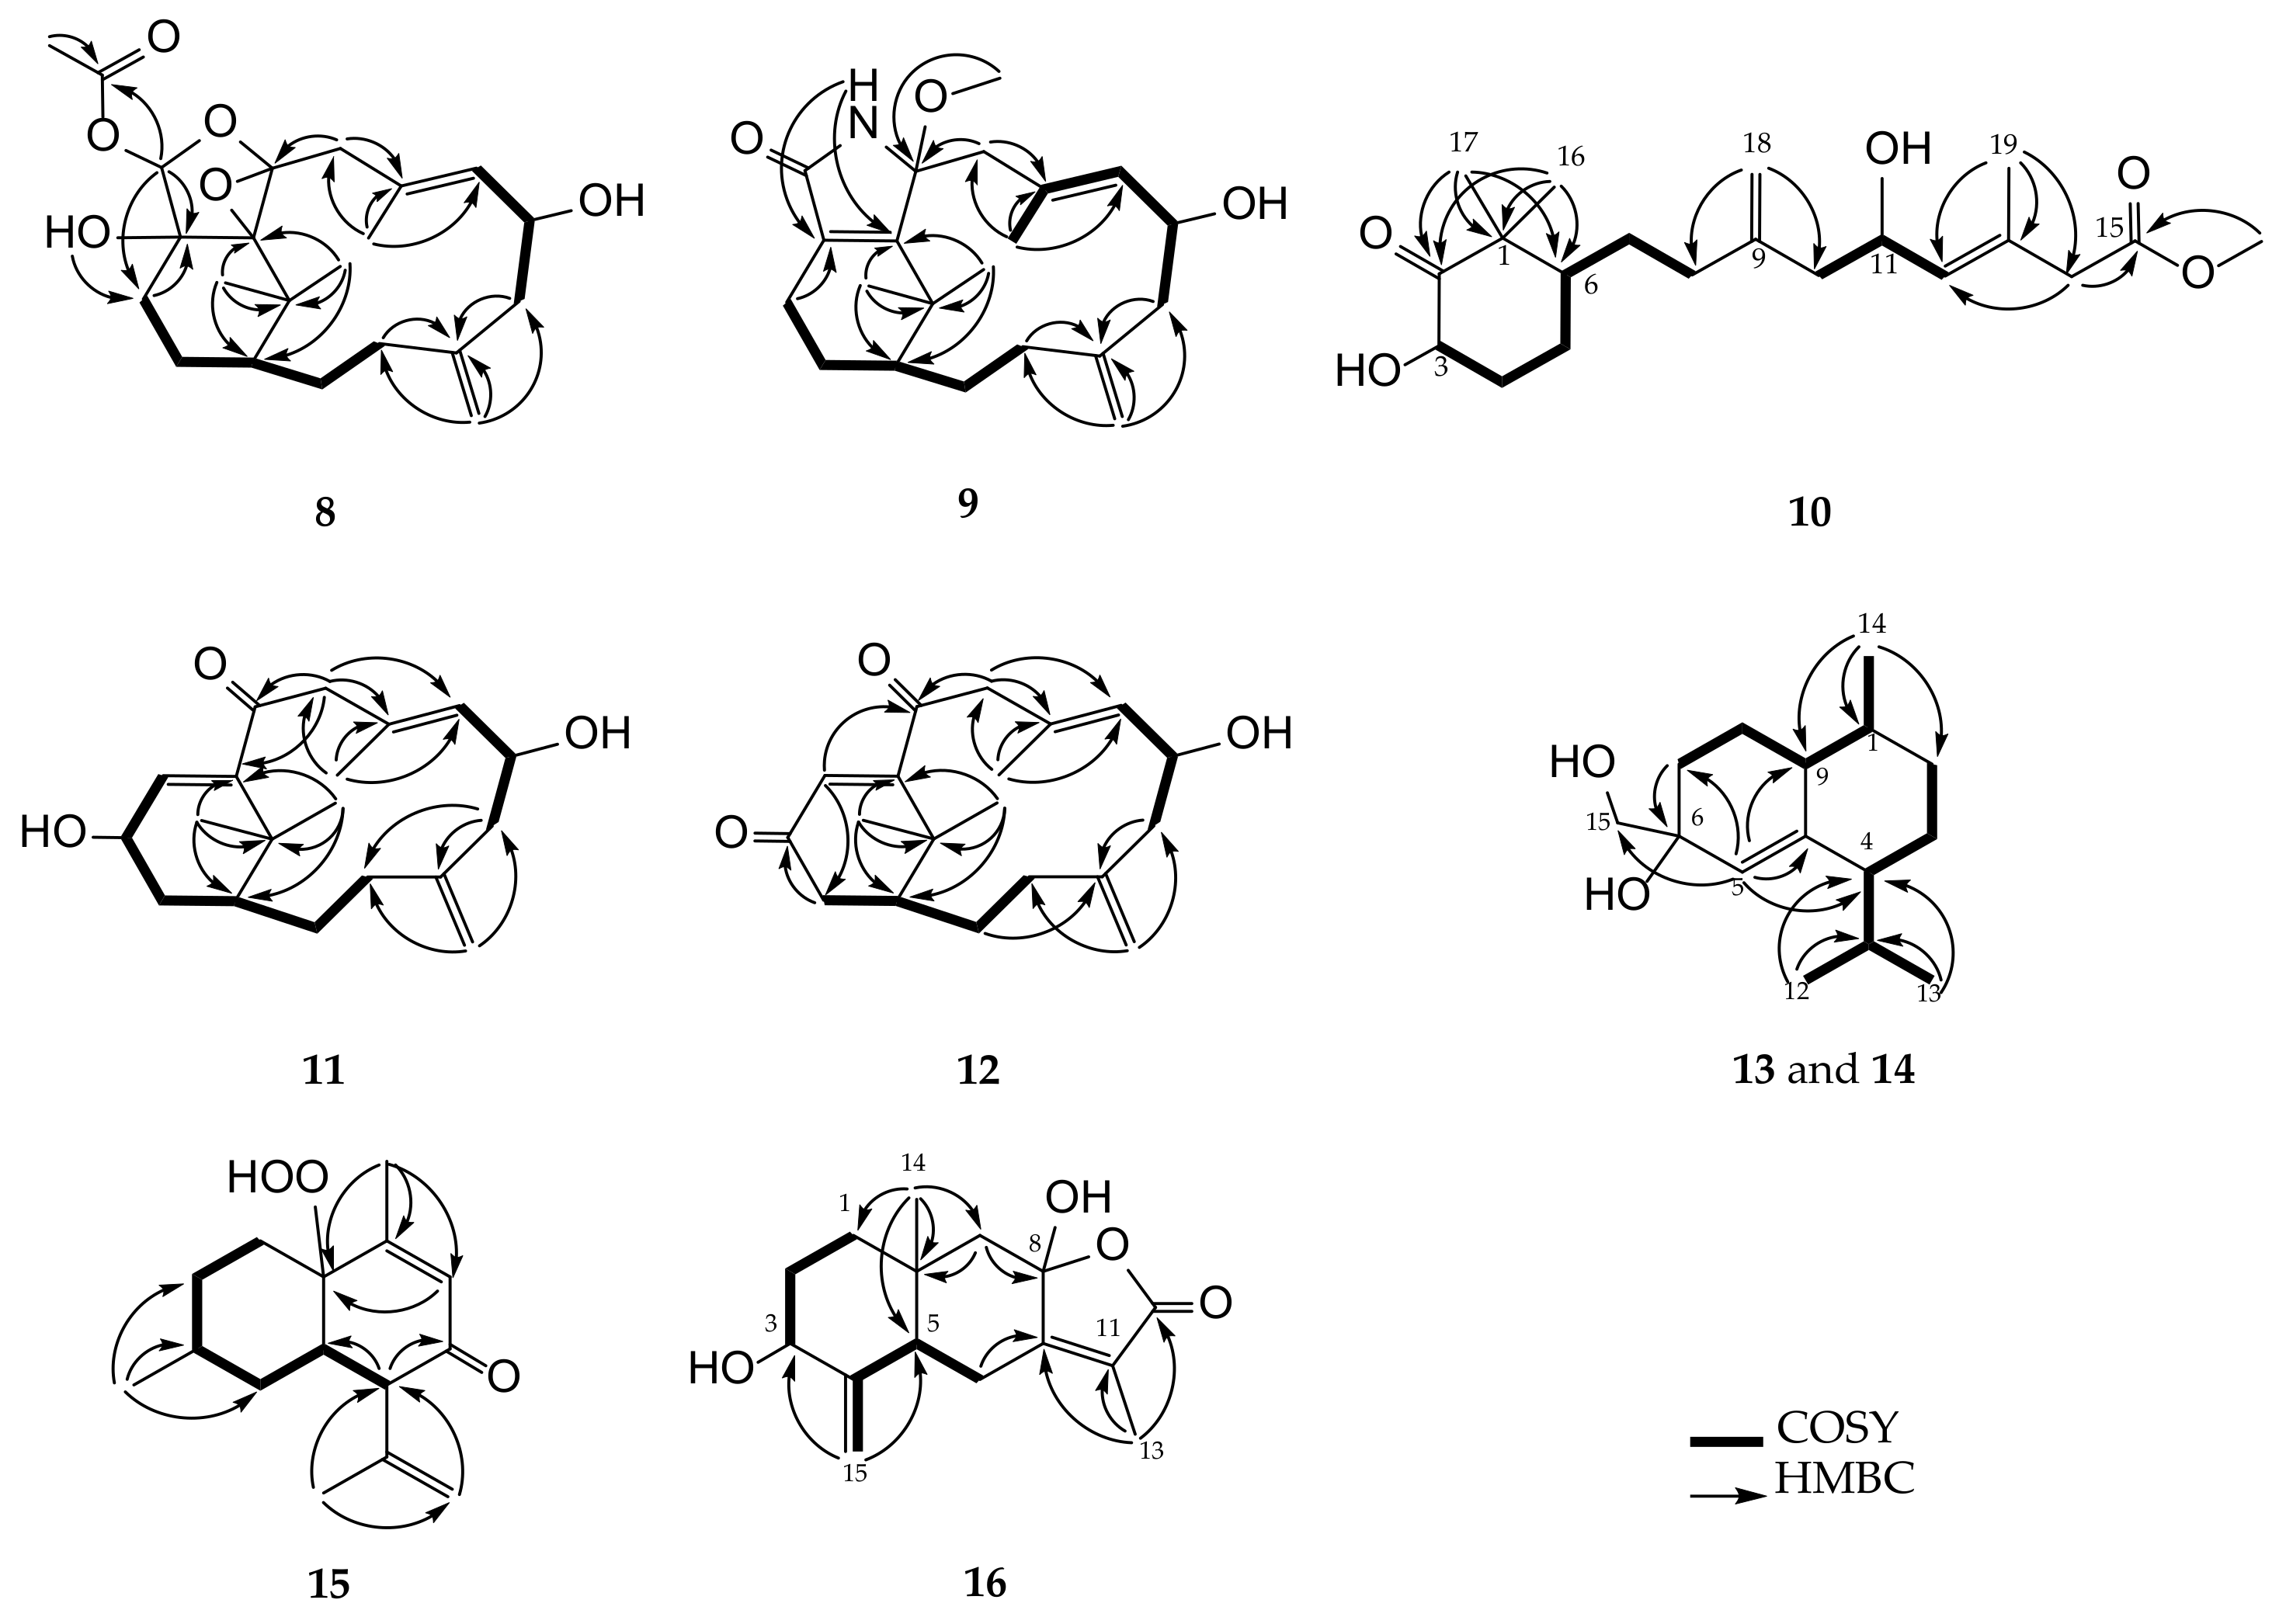
The planar structure of 1 was further determined by analysis of correlations spectroscopy (COSY) and heteronuclear multiple bond correlation (HMBC) correlations (Figure 3). The HMBC correlations of H2-9 (δH 3.00 and 2.21, both d, J = 16.0 Hz) to C-10 (δC 94.6, C) and C-11 (δC 72.8, C), assigned a possible 10,11-tetrasubstituted epoxide moiety. Additionally, HMBC correlations of a hydroxy proton (δH 2.25, br s) to both C-12 (δC 80.0, C) and C-13 (δC 26.8, CH2), as well as an acetal proton H-20 (δH 5.96, s) to both C-12 and ester carbonyl carbon (δC 164.9, C, C-21), positioned a hydroxy group at C-12 and an acrylate group at C-20. The above findings and the remaining one degree of unsaturation were used to establish a polyoxygenated epoxytetrahydrofuran ring, as shown in formula of 1.
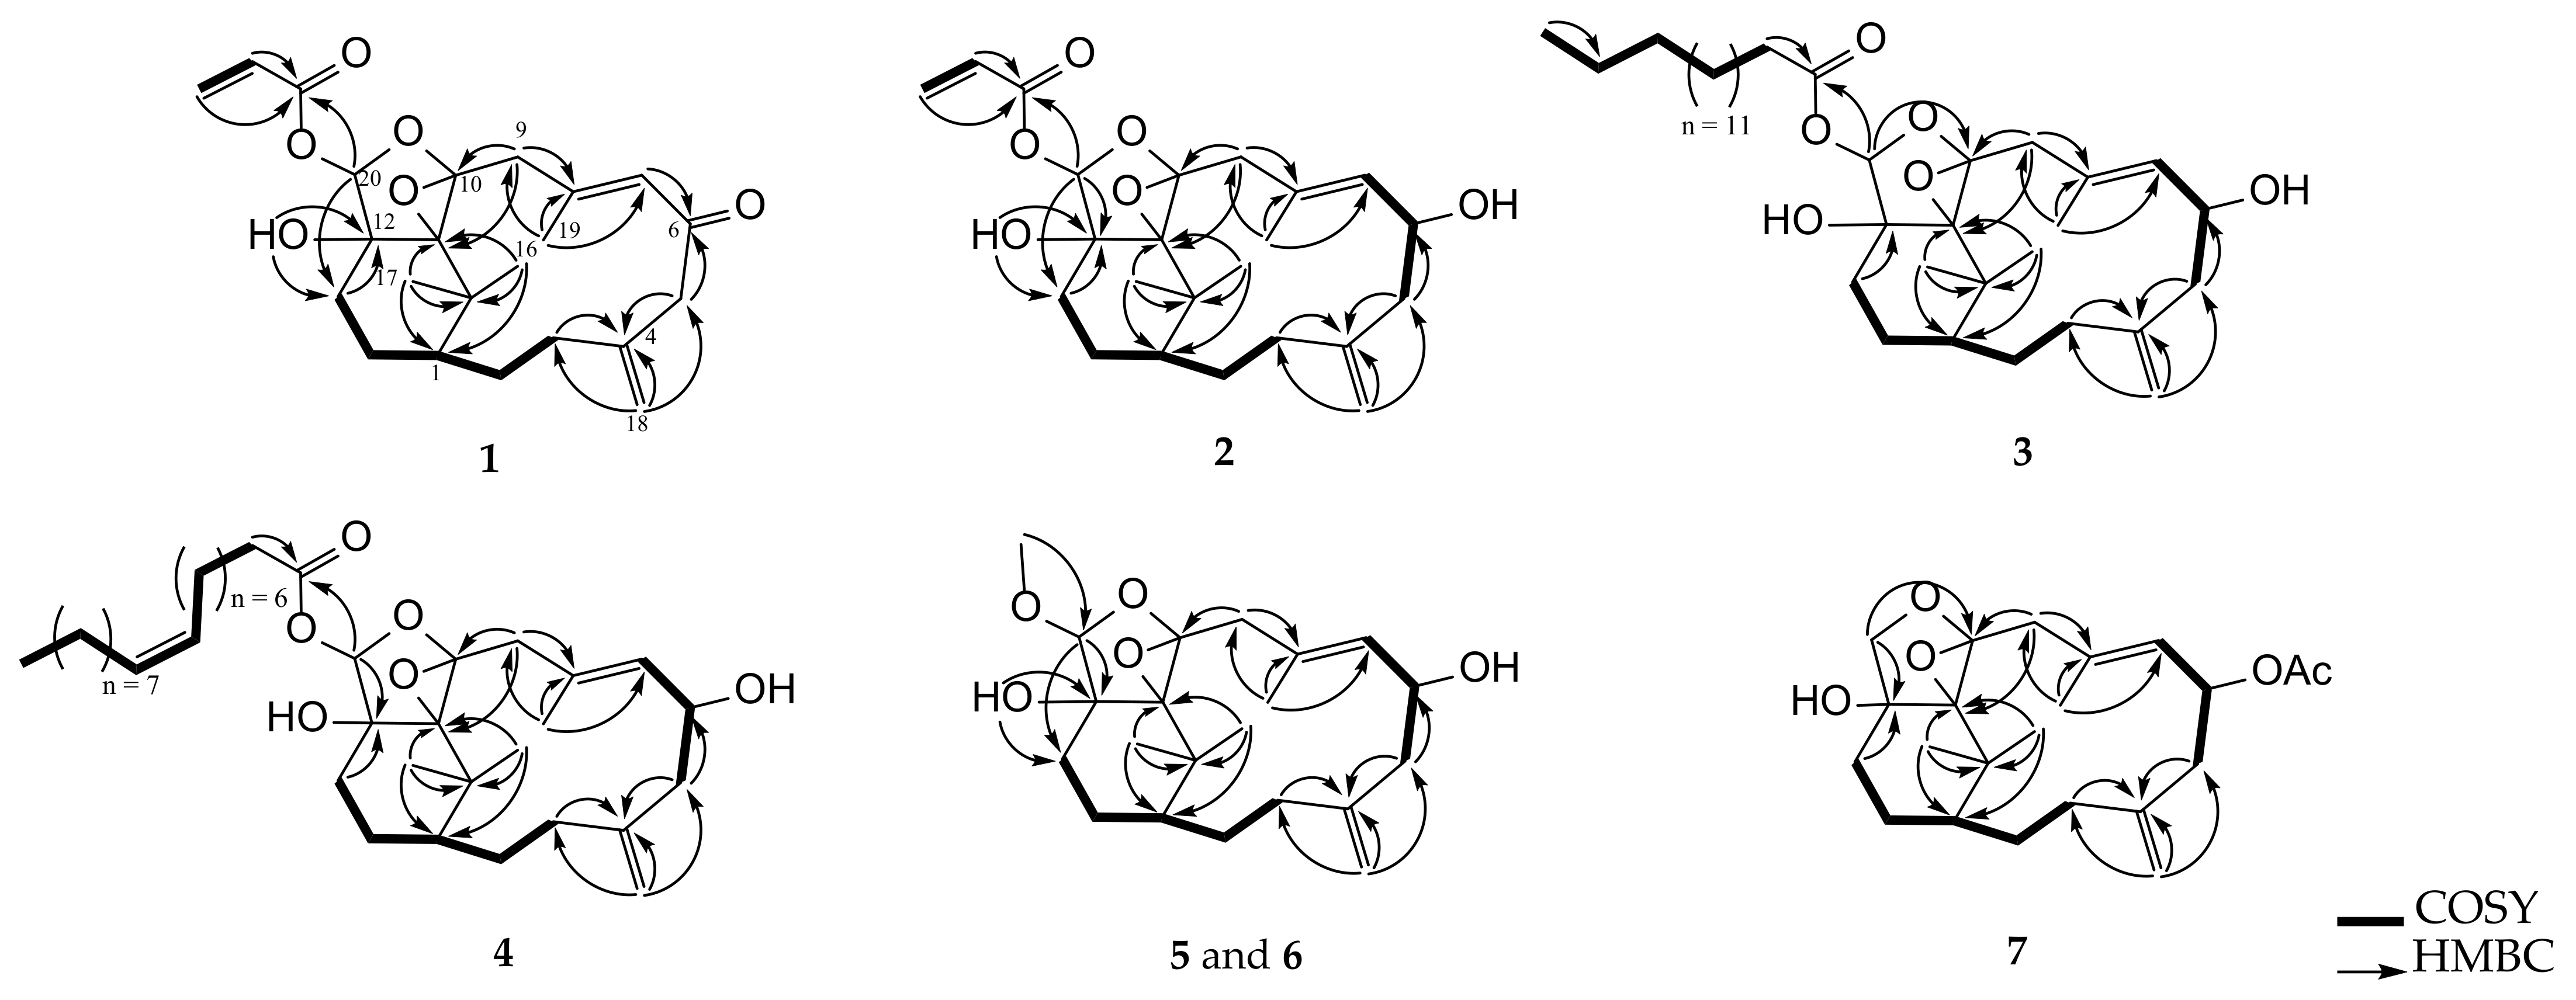
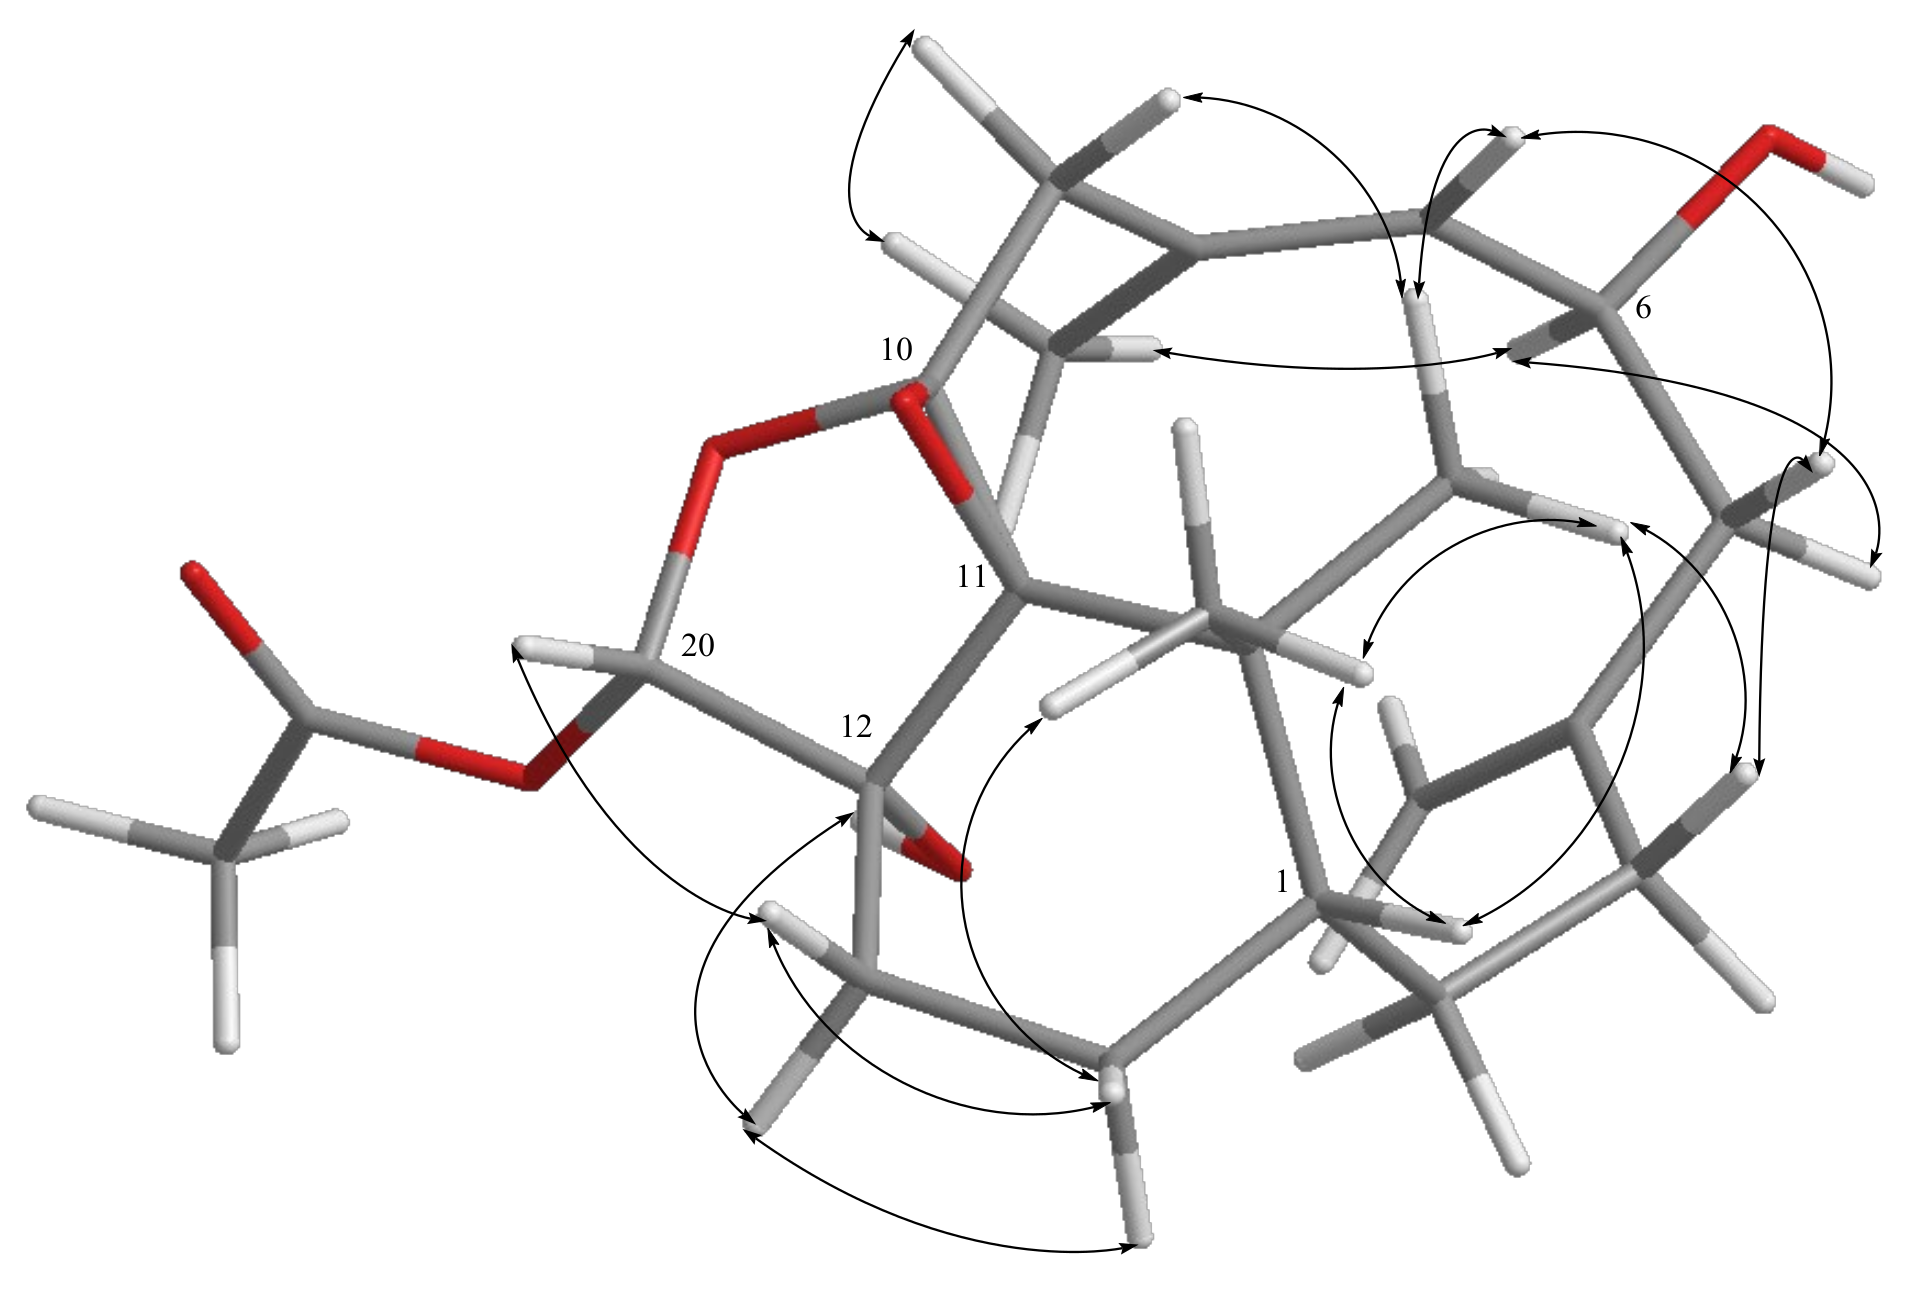
The relative stereochemistry of 1 was determined by the analysis of nuclear Overhauser effect spectroscopy (NOESY) correlations and molecular modeling from energy-minimized (MM2) force field calculation. Assuming the β-orientation of H-1 (δH 1.19, m), the NOE correlations of H-1 with both H3-16 (δH 0.72, s) and H3-17 (δH 1.35, s) indicted the upward orientation of both H3-16 and H3-17. One proton of H2-14 (δH 2.16, m) exhibited NOE correlations with one proton of H2-13 (δH 1.46, m) and H3-17; thus the above methylene protons were characterized as H-14β and H-13β, while the rest protons were assigned as H-14α (δH 1.11, ddd, J = 14.0, 6.0, 3.5 Hz) and H-13α (δH 1.57, td, J = 14.0, 3.5 Hz). Subsequently, H-20 (δH 5.96, s) exhibited NOE interactions with both H-13α and 12-OH (δH 2.25, br s), revealing that H-20 and the 12-hydroxy group were positioned on the α face. Moreover, H-7 (δH 6.13, br s) exhibited an NOE response with one proton of H-9 (δH 2.21, d, J = 16.0 Hz), while H3-19 (δH 2.11, s) showed an NOE interaction with the other proton of H-9 (δH 3.00, d, J = 16.0 Hz) but not with H-7, confirming the E geometry of trisubstituted double bond at C-7/C-8. The above NOE results were shown to be well matched with a molecular model of minimized energy generated from MM2 calculation in Figure 4. Additionally, conformational searching of compound 1 by molecular mechanics model with MMFF force field calculation in the Spartan’14 program [35] was further performed. In a relative energy window of 0−3 Kcal/mol, the results of the calculation displayed nine lowest energy conformers for 1 (Table S2 and Figure S113) which were shown to fit from the observed NOE correlations. From the above findings, the relative configuration of 1 was elucidated as that for formula 1.
Cespitulin I (2) appeared as a white amorphous powder with the molecular formula C23H32O6 as indicated by the HRESIMS (m/z 427.2089 [M + Na]+) spectrum, suggesting the presence of eight degrees of unsaturation. The IR spectrum showed the absorptions of hydroxy (3440 cm–1) and carbonyl (1740 cm–1) groups. The NMR data of 2 (Table 1 and Table 2) revealed this compound to be a tricyclic verticillane-type diterpene and should be very similar to cespihypotin H [28] except for the position of a tetrasubstituted epoxide and the hydroxy group in the tetrahydrosubstituted furan ring. Similar to 1, this tetrasubstituted epoxide was located between C-10 (δC 94.7, C) and C-11 (δC 72.4, C), and the hydroxy group was found at C-12 (δC 79.8, C) on the basis of the assistance of HMBC correlations. The position of the acrylate group at C-20 was also confirmed by the HMBC correlations from H-20 (δH 5.70, s) and H-22 (δH 6.14, dd, J = 17.2, 10.4 Hz) to C-21 (δC 164.8, C). These observations, together with analysis of other COSY and HMBC correlations, enabled the gross structure of 2 to be established reasonably (Figure 3).
The relative configurations of the six chiral centers at C-1, C-6, C-10, C-11, C-12, and C-20 in 2 were also determined from key NOE correlations with an MM2 force field calculation (Figure 4). One proton of H2-9 (δH 2.55, d, J = 14.4 Hz) showed NOE interaction with the known β-oriented H3-16 (δH 0.94, s) and suggested as H-9β, while the other proton at C-9 was assigned as H-9α (δH 3.10, d, J = 14.4 Hz). Similar to 1, the E geometry of 7,8-trisubstituted double bond was confirmed, as the NOE correlations of H-9β with H-7 and H-9α with H3-19 (δH 1.81, s) were found and also from the observation of an upfield chemical shift of C-19 at 17.2 ppm [9]. Moreover, H-6 (δH 4.49, t, J = 8.0 Hz) displayed NOE correlations with one proton of H2-5 (δH 2.65, dd, J = 12.5, 3.2 Hz) and H3-19, while H-7 was found to correlate with the other proton of H2-5 (δH 2.24, m), reflecting the β-orientation of hydroxy group at C-6. Furthermore, the NOE correlation observed between the β-oriented H3-17 and one proton of H2-14 (δH 2.28, m), which also correlated with one proton of H2-13 (δH 1.71, td, J = 14.0, 3.6 Hz), suggested the β-orientation of these two methylene protons at C-14 and C-13, respectively. H-13β exhibited an NOE correlation with H-20 (δH 5.70, s), while 12-OH (δH 2.64, br s) correlated with H-13α (δH 1.58, m) but not with H-20, revealing that the acrylate group at C-20 was α-oriented. By conformational searching for 2 using MMFF molecular mechanics model, 13 lowest conformers (Table S2 and Figure S114) of 2 were found and also could explain the observed NOE correlations. From these results and other detailed NOE correlations, the relative configuration of 2 was determined.
Cespitulin J (3) was isolated as a colorless oil. The HRESIMS (m/z 611.4282 [M + Na]+) and NMR data (Table 1 and Table 2) of 3 exhibited a molecular formula of C36H60O6, acquiring seven degrees of unsaturation. The IR spectrum suggested the presence of hydroxy (3446 cm–1) and ester carbonyl (1758 cm–1) groups. Comparison of the NMR spectroscopic data of 3 and 2 indicated that the structure of 3 was highly similar to that of 2, with the exception of an acrylate ester group in 2 being replaced by a long-chain ester moiety in 3. Furthermore, it is reasonable to elucidate the hexadecanoyl ester group at C-20 (δC 100.8, CH) by HRESIMS and 2D NMR spectroscopic data, including HMBC and COSY correlations. Thus, the structural framework of 3 was established to be a verticillane-type diterpene, including a polyoxygenated epoxytetrahydrofuran ring, too (Figure 3). The analysis of the NOESY spectrum revealed that 3 possessed the same relative configurations at C-1, C-6, C-10, C-11, and C-12 as those of compound 2. A difference in the stereochemistry of H-20 between 2 and 3 was demonstrated with the assistance of the NOESY experiment which revealed that H-20 (δH 5.63, s) had an NOESY correlation with 12-OH (δH 2.52, br s), indicating that H-20 of 3 should be α-oriented and accomplished the elucidation of the relative configuration of 3.
Cespitulin K (4) was obtained as a colorless oi1 that gave a sodiated adduct ion peak at m/z 637.4440 [M + Na]+ in the HRESIMS spectrum, suggesting the molecular formula C38H62O6 with eight degrees of unsaturation. IR absorptions at 3420 and 1748 cm–1 showed the presence of hydroxy and ester carbonyl functionalities, too. The 13C and 1H NMR spectroscopic data (Table 1 and Table 2) of 4 were found to be very similar to those of 3, with the exception that the hexadecanoyl ester at C-20 in 3 was converted to the octadecenoyl ester group in 4 by the HRESIMS data and 2D NMR (HMBC and COSY) correlations (Figure 3) of 3. The remaining one degree of unsaturation has arisen from the cis C-9′/C-10′ double bond of the octadecenoyl ester group in 4 by comparison of 13C NMR spectroscopic data of this ester side chain at C-20 with those reported previously [36,37]. Finally, the Z geometry of the 9′, 10′-double bond was also deduced from a 10.5 Hz coupling constant between H-9′ and H-10′ in the 1H NMR spectrum.
The relative configuration of 4 was also determined by a NOESY experiment. The NOE correlations of H-1(δH 1.49, m), H2-5 (δH 2.66, dd, J = 12.5, 2.5 Hz and 2.25, m), H-6 (δH 4.50, m), H-7 (δH 5.47, d, J = 8.0 Hz), H2-9 (δH 3.09 and 2.54, both d, J = 14.0 Hz), H3-16 (δH 0.98, s), H3-17 (δH 1.33, s), H3-19 (δH 1.81, s), H-20 (δH 5.63, s), and 12-OH (δH 2.53, br s) were almost the same as those of 3, suggesting the same configurations at the corresponding carbons in both 3 and 4. On the basis of the above results, the relative configuration of 4 was established.
Cespitulin L (5) was isolated as a white amorphous powder. Its molecular formula, C21H32O5, was established by HRESIMS (m/z 365.2315 [M + H]+), implying six degrees of unsaturation. The IR spectrum showed the presence of the hydroxy moiety (3445 cm–1). The 13C and 1H NMR spectroscopic data revealed that 5 was found to possess a 10,20-ether linkage tetrahydrosufuran ring (δC 104.6, CH, C-20 and 94.3, C, C-10; δH 4.36, s, H-20) and a 10,11-tetrasubstituted epoxide (δC 72.8, C, C-11), as well as the same verticillane core skeleton of compounds 2–4 (Table 1 and Table 2). The presence of a methoxy group at C-20 of 5 was further established by an HMBC correlation from H3-21 (δH 3.47, s) to C-20 (Figure 3). These results suggested that the relative configuration of 5 was nearly the same as those of 2–4. Further, the 20-acetal proton (δH 4.36, s) was found to show an NOE interaction with H-13β (δH 1.70, br d, J = 14.0 Hz), while the 12-OH (δH 3.29, s) exhibited interactions with both H-13α (δH 1.58, m) and H3-21, indicating the β-orientation of H-20 and the α-orientation of the 21-methoxy group (Figure 4).
Cespitulin M (6) was found to possess the same molecular formula, C21H32O5, as that of 5 from the HRESIMS data (387.2142 [M + Na]+). Analysis of the 1D NMR spectroscopic data (Table 1 and Table 3) and the 2D NMR (HSQC, COSY, and HMBC) correlations enabled the planar structure of 6 to be established the same as 5 (Figure 3). The 13C NMR spectroscopic data of 6 were nearly similar to those of 5, with the exception of downfield shifts observed at C-12 (∆δC +1.6) and C-20 (∆δC +4.5) relative to 5, revealing that 6 should be the C-12 or C-20 isomer of 5. Further analysis of NOE correlations revealed that 6 possessed the identical relative configurations at C-1, C-6, C-10, C-11, and C-12 as those of 5. A difference in relative configuration for C-20 of the tetrahydrofuran ring between 5 and 6 was characterized by a comparison of their key NOE correlations (Figure 4).
Cespitulin N (7) had the molecular formula C22H32O5 as determined by HRESIMS (m/z 399.2142 [M + Na]+). The IR spectrum of 7 showed the presence of hydroxy (3446 cm–1) and ester carbonyl (1733 cm–1) groups. All the proton and carbon signals of 7 were assigned from the 13C and 1H NMR spectroscopic data (Table 3 and Table 4), along with HSQC spectrum, which established the structure of 7 as a tetracyclic verticillane-type diterpene with an acetoxy group (δC 170.2, C and 21.3, CH3; δH 2.02, s). In addition, the NMR data of 7 were found to resemble those of cespitulin G [27]. Detailed analysis of 2D NMR spectra (COSY, HMBC, and NOESY), revealed that 7 possesses a 10,20-ether linkage trihydrosubstituted furan ring (δC 95.9, C, C-10 and 75.5, CH2, C-20; δH 3.59 and 3.43, both d, J = 9.0 Hz), a 10,11-epoxide (δC 74.0, C, C-11), and a hydroxy group at C-12 (δC 78.7, C; δH 1.96, br d, J = 2.0 Hz, 12-OH). Furthermore, key NOE correlations of the 12-OH to H-13α (δH 1.76, m) and H-20α (δH 3.43, d, J = 9.0 Hz) indicated that the 12-hydroxy group should be positioned on the α face.
The protonated adduct ion peak [M + H]+ of cespitulin O (8) at m/z 393.2267 in HRESIMS indicated a molecular formula C22H32O6. The IR absorptions showed the presence of the hydroxy (3419 cm–1) and an ester carbonyl (1733 cm–1) groups. The 13C and 1H spectroscopic data (Table 3 and Table 4) of 8 were very similar to those of cespihypotin I [28] and had the same molecular formula. However, the gross structure of 8 was established as a 10,11-epoxy-10,11,12,20-tetrahydrosubstituted-furanyl diterpene containing an acetoxy group at C-20 by the results of 2D NMR experiments (including COSY and HMBC correlations, Figure 5). Further analysis of the NOE correlations revealed that H-20 (δH 5.76, s) showed NOE interaction with H-13β (δH 1.81, m), while 12-OH (δH 2.68, br s) with H-13α (δH 1.62, m), confirming the β-orientation of the acetoxy group at C-20 (Figure 6).
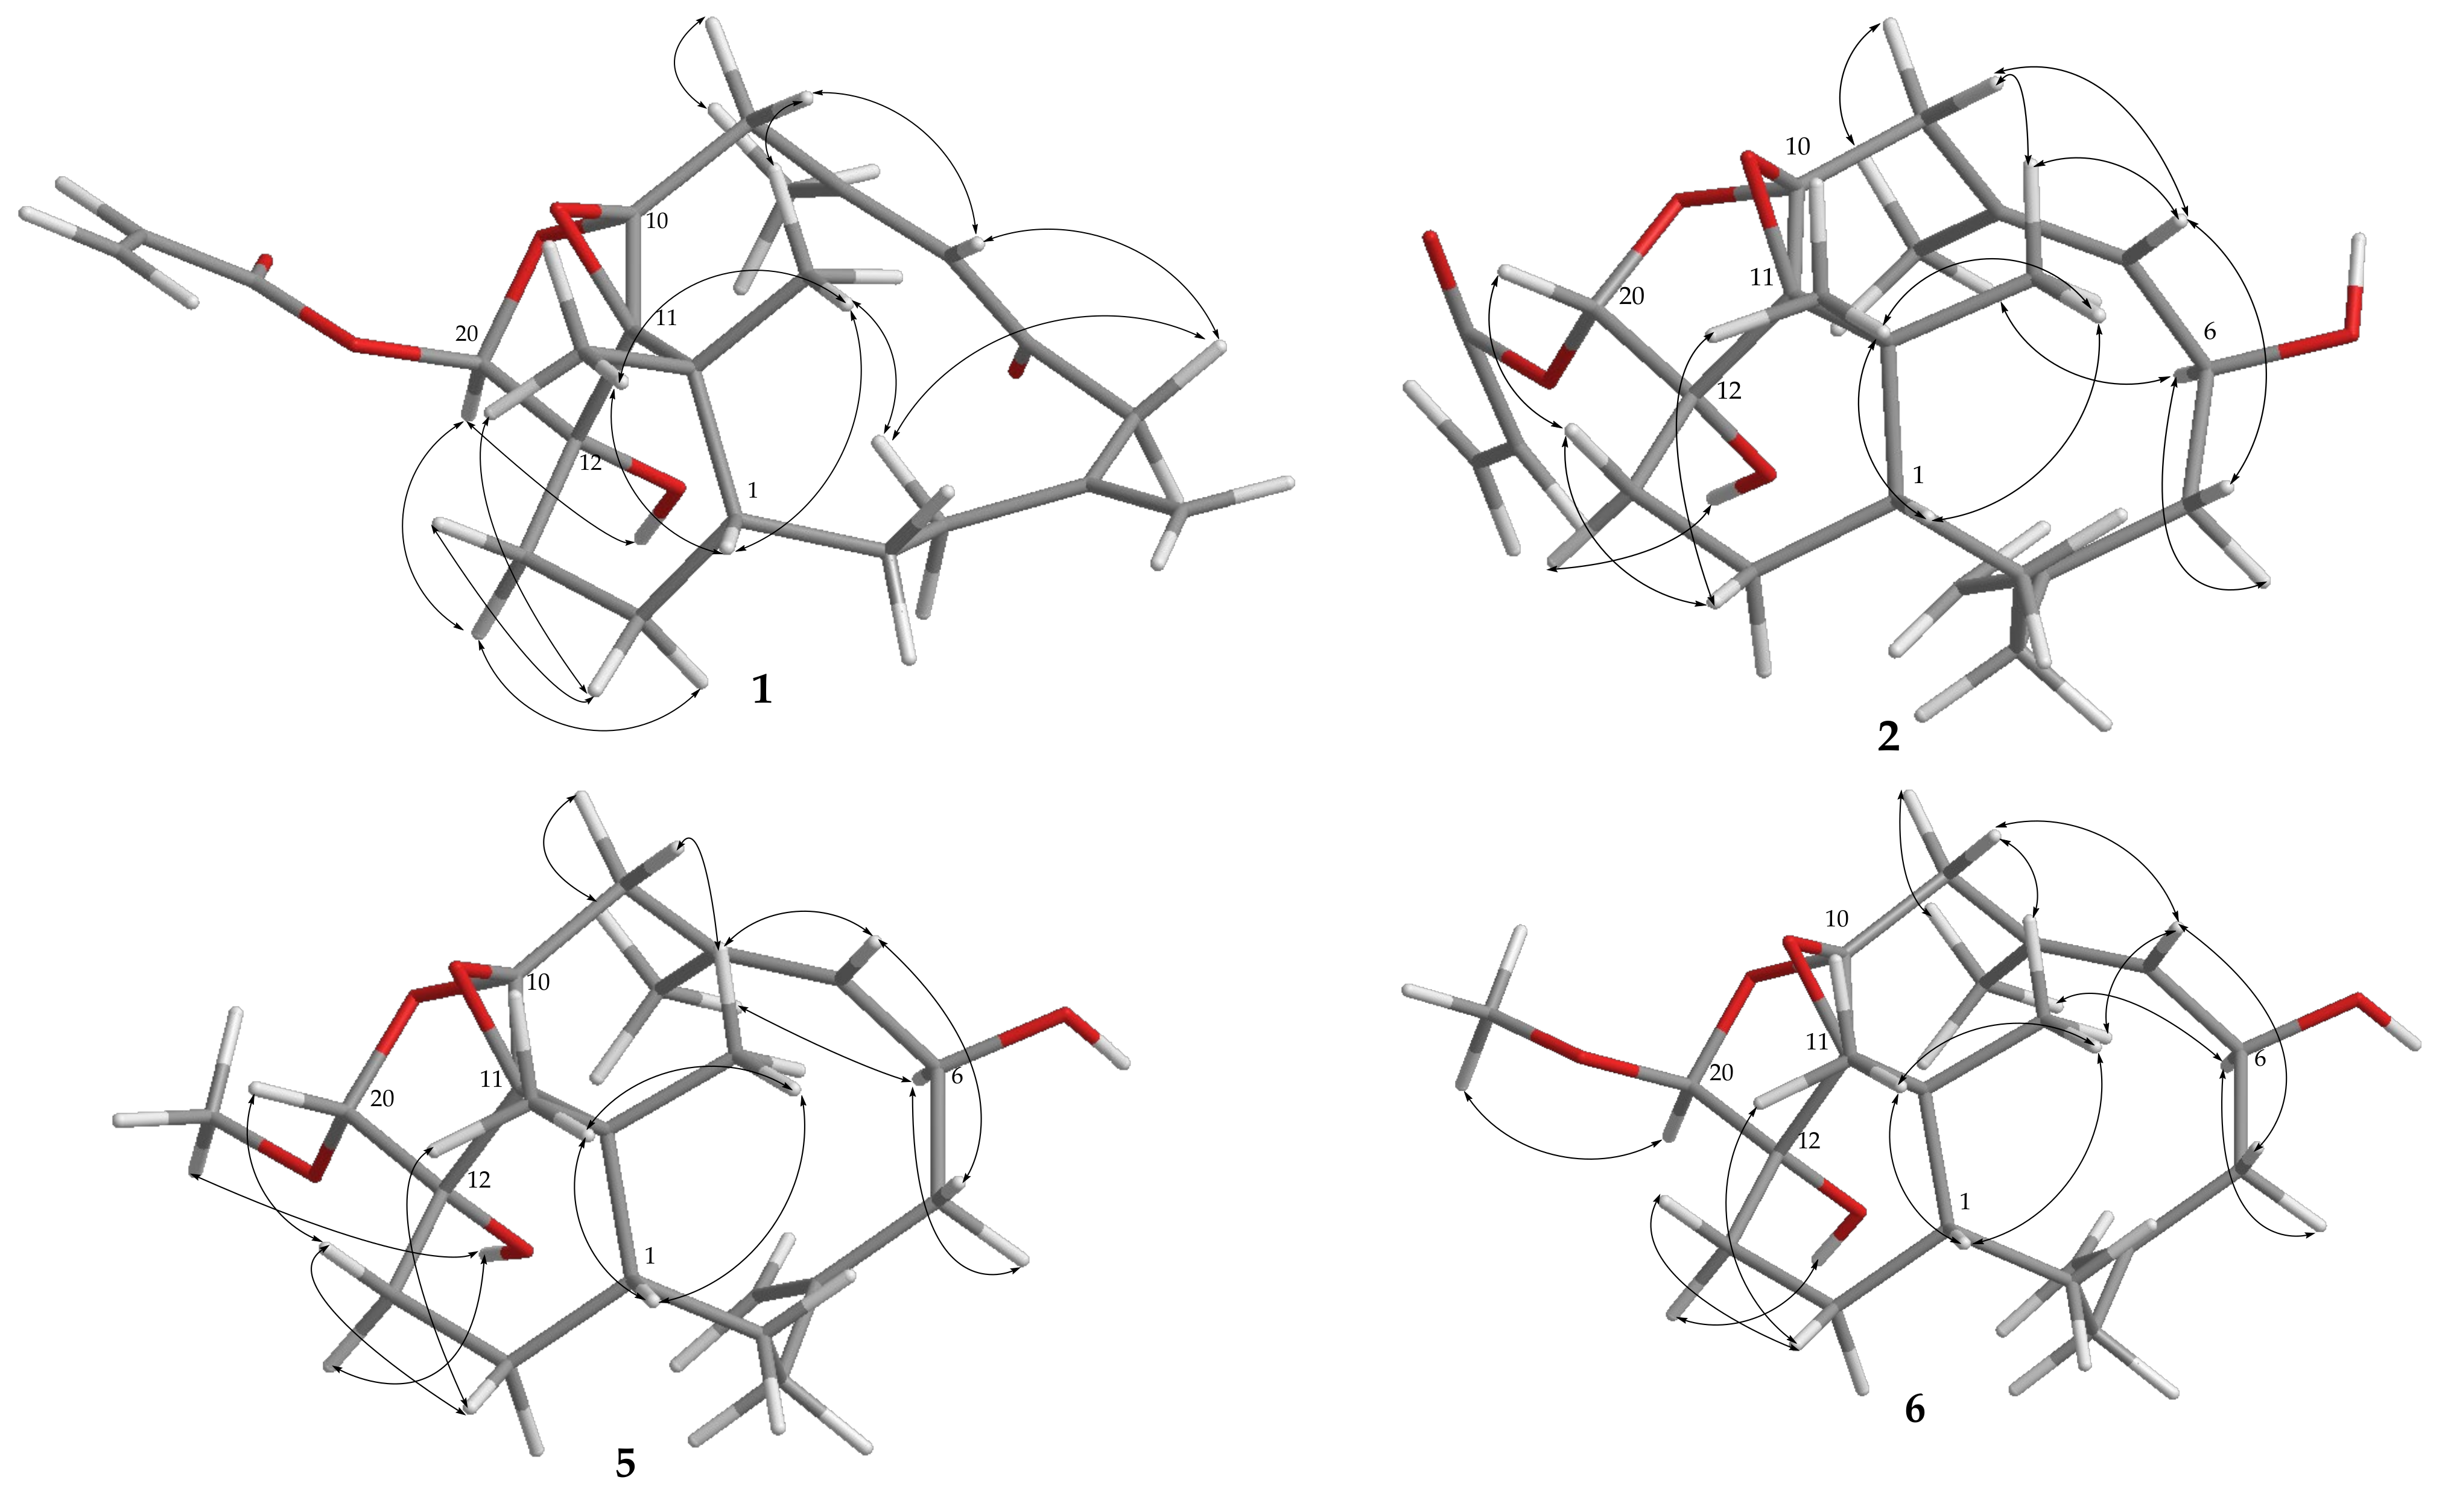
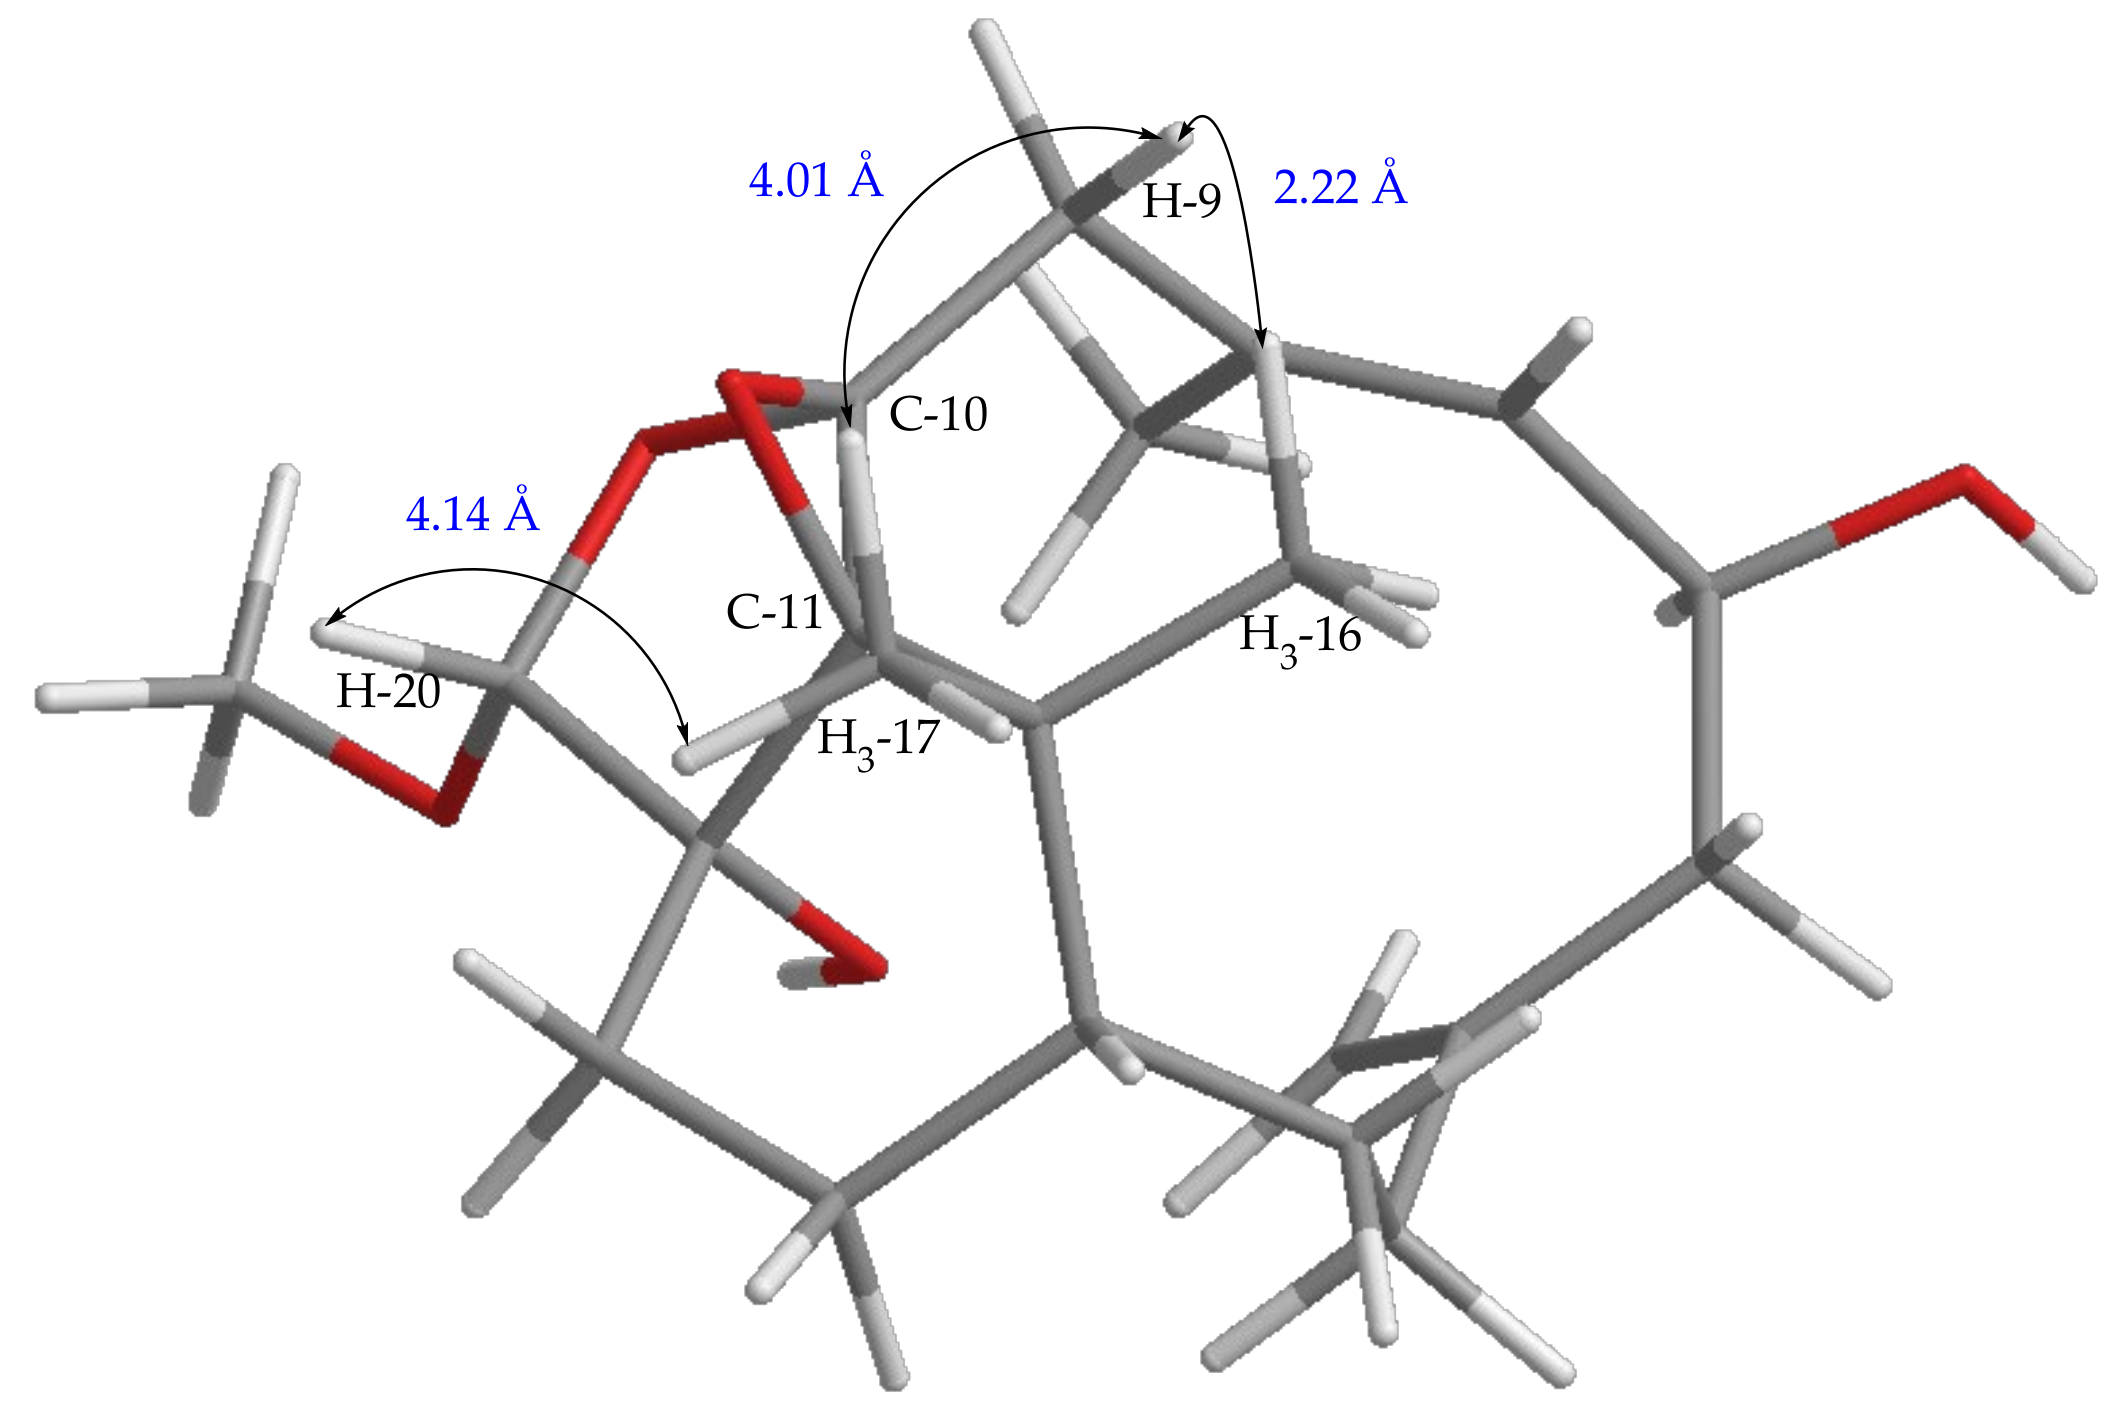
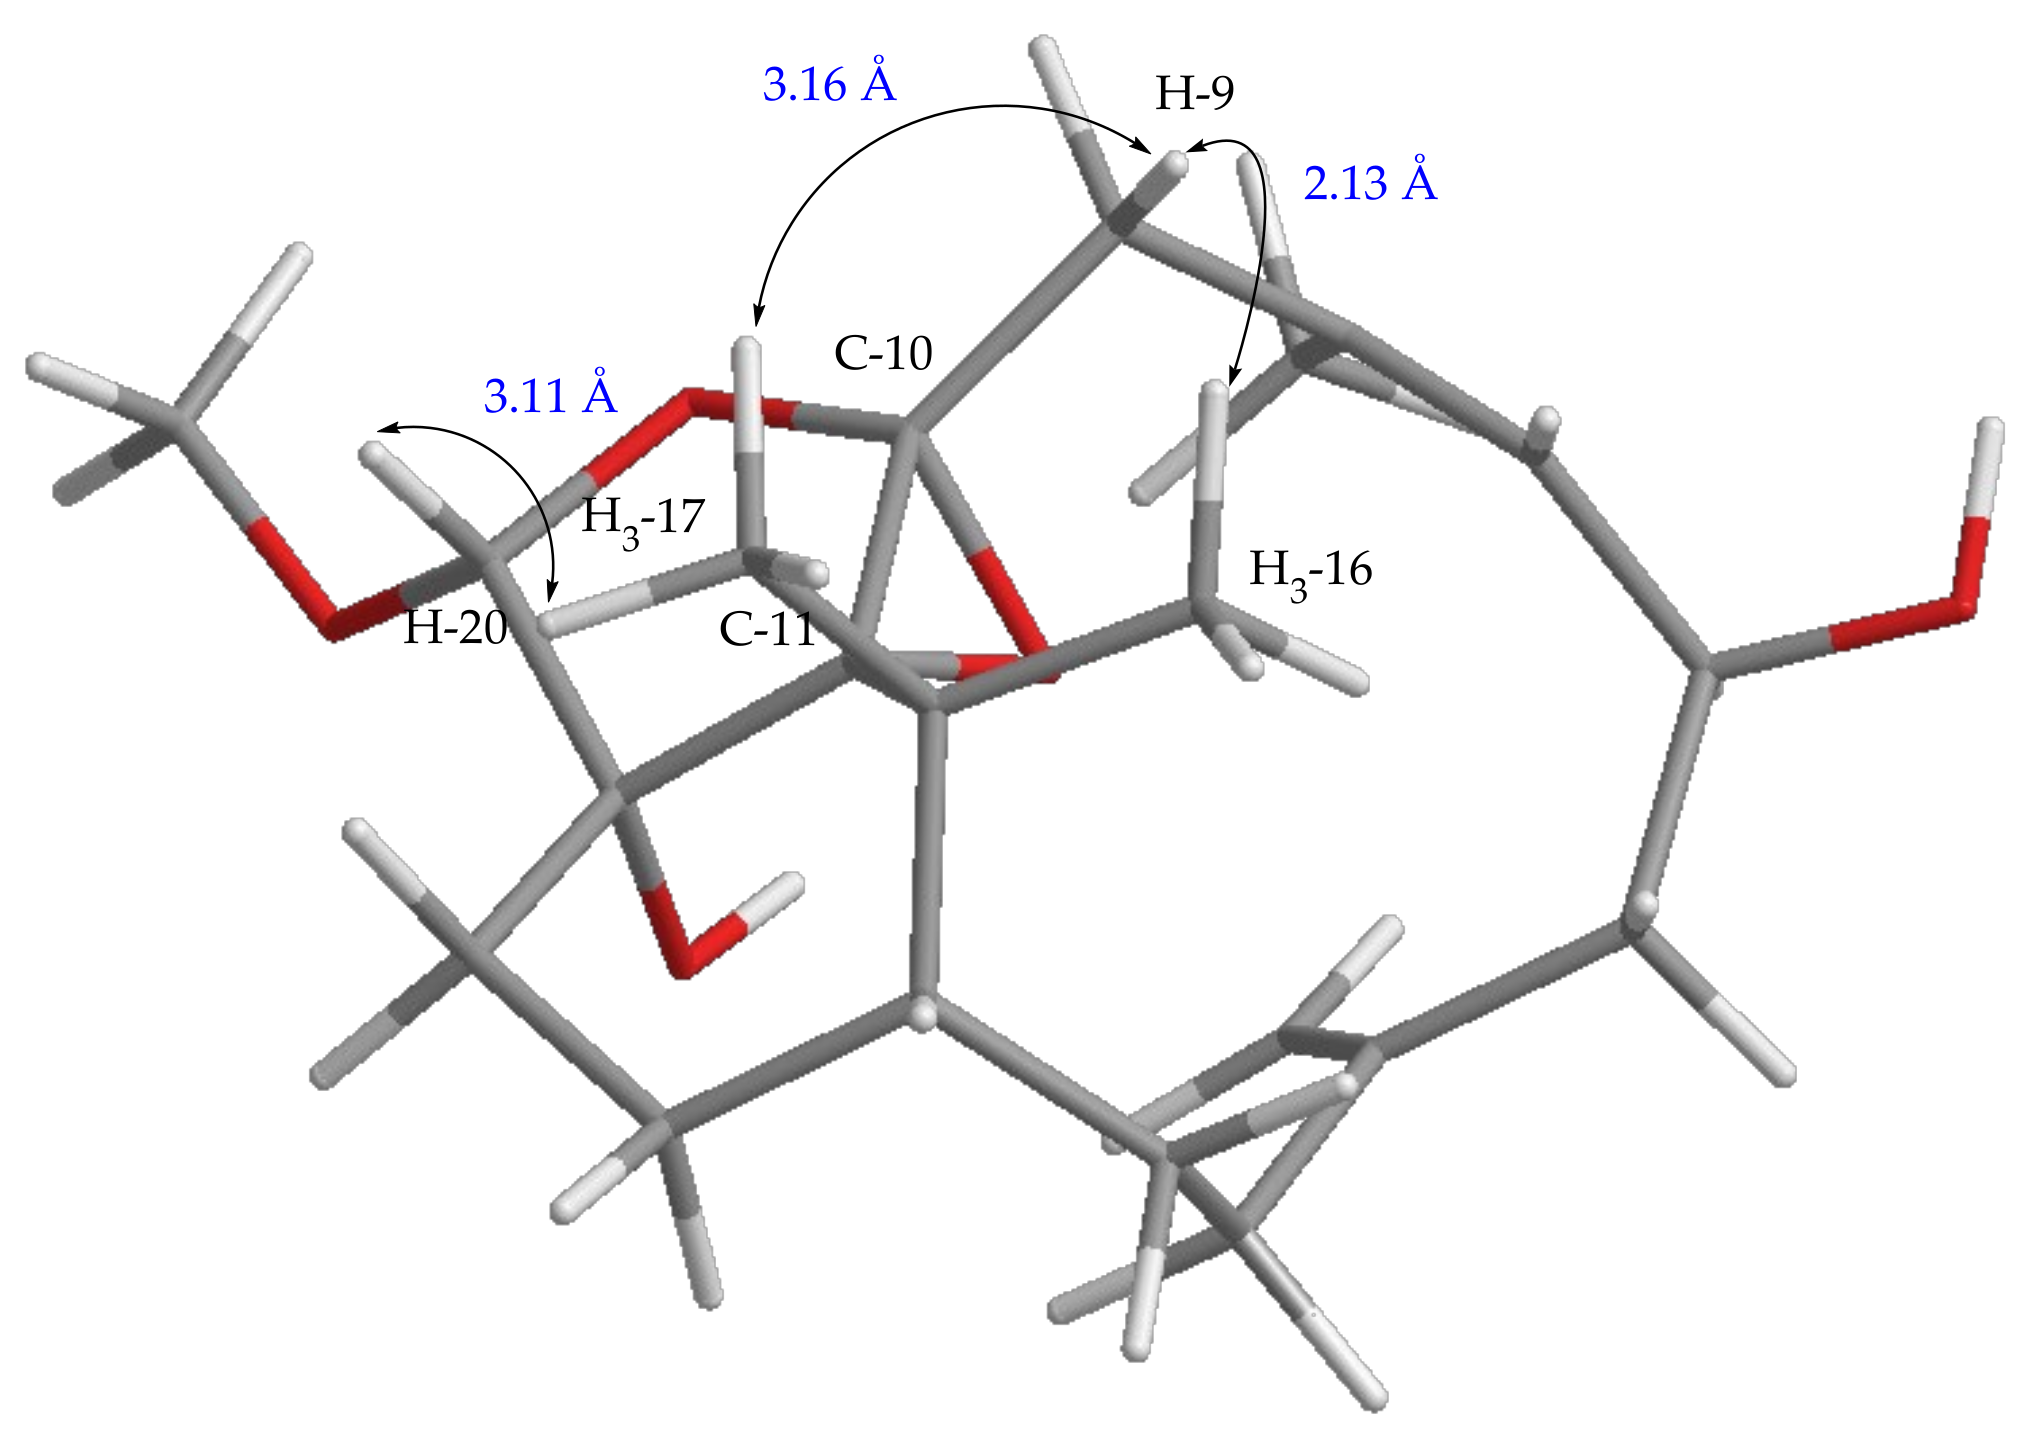
The assignment of the relative stereochemistry of the nonprotonated carbons C-10 and C-11 of the epoxy ring in compounds 1–8 was also based on the observed NOE correlations and molecular model calculation. For example, the relative configurations of C-10 and C-11 of compound 5 as shown in Figure 7 were assigned on the basis that the distance between H3-16 and one proton of H2-9 is 2.22 Å and that between H3-17 and this proton of H2-9 is 4.01 Å in the molecular model generated from MM2 calculation, which well match the NOE correlation observed between H3-16 and this proton of H2-9, and not fit the correlations between H3-17 and the same proton at C-9. Moreover, for the conformer of the isomeric 10,11-epoxide (Figure 8), the NOE correlations for H3-17/H-20, and between both H3-16 and H3-17 with this H-9 should be found as the distances of H3-17/H-20, H3-16, and H3-17 with this H-9 proton were calculated to be 3.11, 2.13, and 3.16 Å, respectively. However, only the NOE correlation between H3-16 and this specific H-9 was detected, suggesting the relative configuration of 5 and the other related compounds should be the same as those described in Figure 1.
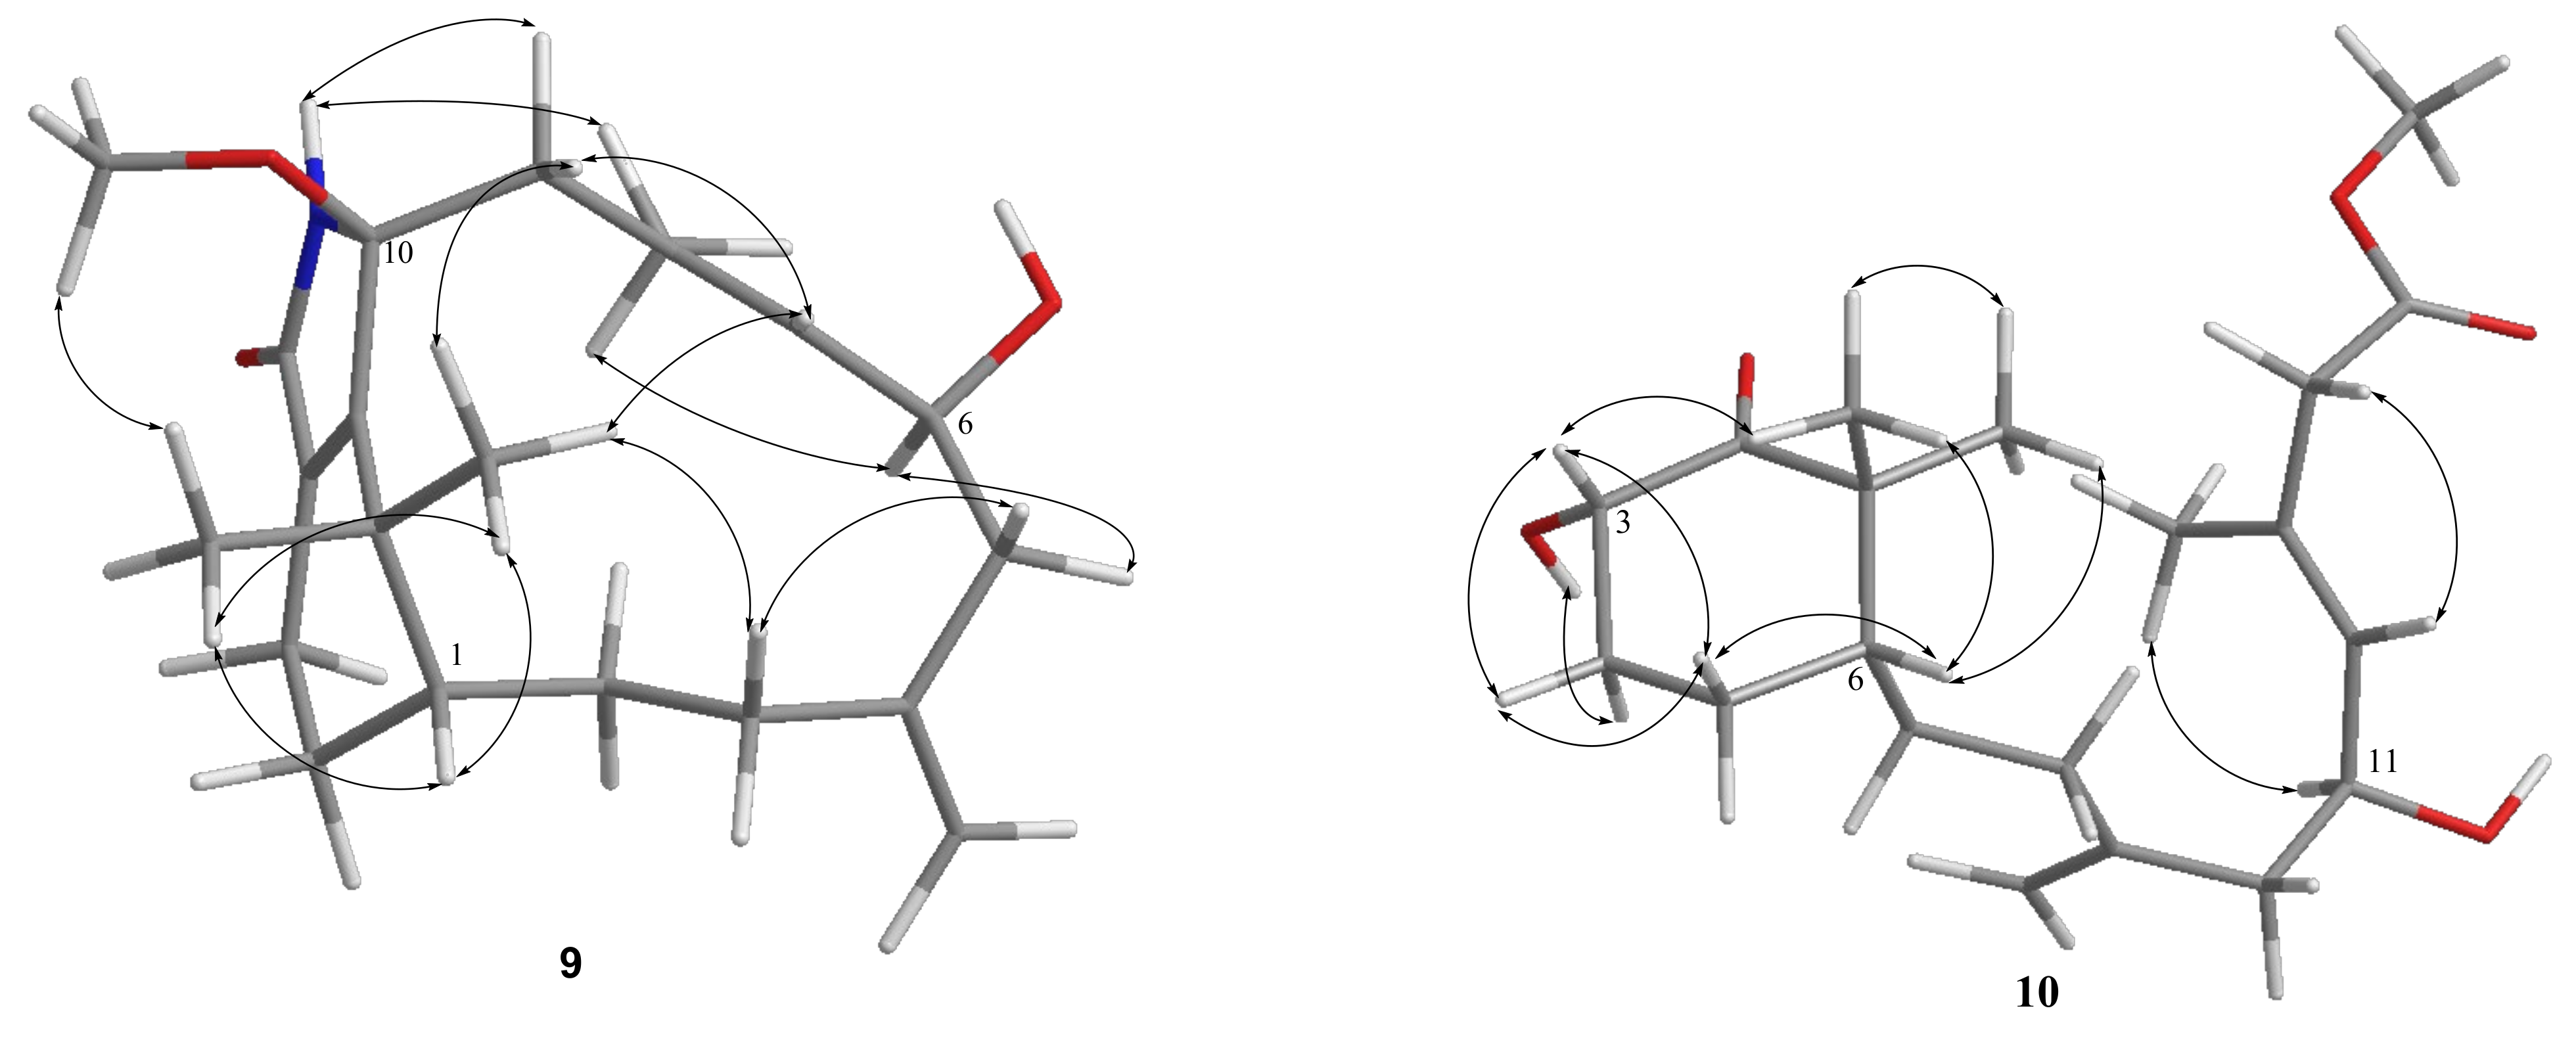
The HRESIMS data (m/z 368.2195 [M + Na]+) of cespitulactam L (9) established the molecular formula C21H31O3N, consistent with seven degrees of unsaturation. The IR spectrum suggested the presence of hydroxy and/or amide (3245 cm–1) and conjugated carbonyl (1698 cm–1) groups. Compound 9 and cespitulactam F [22] were found to have the same α,β-unsaturated lactam ring by comparison of their 1D and 2D NMR spectroscopic data. Likewise, the 1H and 13C NMR data of 9 (Table 3 and Table 4) were highly similar with those of cespitulactam F, with the difference that the presence of a methoxy group (δC 50.4, CH3; δH 3.13, s) at C-10 (δC 93.9, C) in 9 was found, instead of a hydroxy group in cespitulactam F. Cespitulactam L (9) is the 10-methoxy derivative of cespitulactam F. The relative stereochemistry of 9 was deduced from the analysis of the observed NOE correlations. The known β-oriented H3-17 (δH 1.24, s) exhibited NOE interactions with the methoxy protons (δH 3.13, s), indicating the β-orientation of 10-methoxy group. By the biogenetic consideration and other detailed NOE correlations (Figure 9), cespitulactam L (9) was found to possess the same relative configuration as that of cespitulactam F.
2.2. Structure Elucidation of a Novel Norditerpene 10 and the Verticillane-Type Norditerpenes 11 and 12
Compound 10 exhibited a sodiated ion peak at m/z 375.2141 [M + Na]+ in the HRESIMS, establishing a molecular formula C20H32O5 and implying five degrees of unsaturation. The presence of the hydroxy, ester carbonyl, and ketone groups was observed by IR absorptions at 3445, 1732, and 1715 cm–1, respectively. The 13C and 1H NMR data (Table 5) of 10 revealed that three degrees of unsaturation were contributed from a 1,1-disubstituted double bond (δC 147.1, C and 113.2, CH2; δH 4.87, s), a trisubstituted double bond (δC 131.7, CH and 122.2, C; δH 5.32, d, J = 8.5 Hz), and an ester carbonyl (δC 171.4, C). The remaining two degrees of unsaturation were arisen from a 2-hydroxy-6,6-dimethylcyclohexan-1-one moiety by inspection of 2D NMR correlations (Figure 5). The NMR spectroscopic data of 10 resemble those of known norditerpenoid cespitularin Q (17) [18,26], except for the presence of a methoxy group (δC 51.8, CH3; δH 3.69, s) at C-15 (δC 171.4, C) and a hydroxy group at C-3 (δC 71.4, CH) in 10, and also the absence of a 14-membered lactone ring linkage between C-10 (δC 169.7, C) and C-12 (δC 72.2, CH) which is present in 17, indicating that a linear terpenoidal ester 10 might be arisen from cespitularin Q by hydrolysis and further esterification. It was also found that the molecular skeleton of 10 is nearly the same as that of retinoids with missing of the methyl group at C-5, while normal retinoids are originated from the oxidative cleavage of β-carotene [38]. In the NOESY spectrum, a strong interaction between H-6β (δH 1.79, m) and H3-17 (δH 1.32, s) showed the β-orientation of H3-17. Further, H-3 (δH 4.45, m) showed NOE correlations with both H3-17 and one proton of H-4 (δH 2.31, m), as did the 3-OH (δH 3.67, br d, J = 3.5 Hz) with the other proton of H-4 (δH 1.58, m), reflecting that H-3 should be β-oriented while the hydroxy group at C-3 was assigned as α-oriented (Figure 9). By the analysis of the above NOE correlations and the biosynthetic relation of 10 and 17, the relative configuration of 10 was elucidated and named cespitulin P.
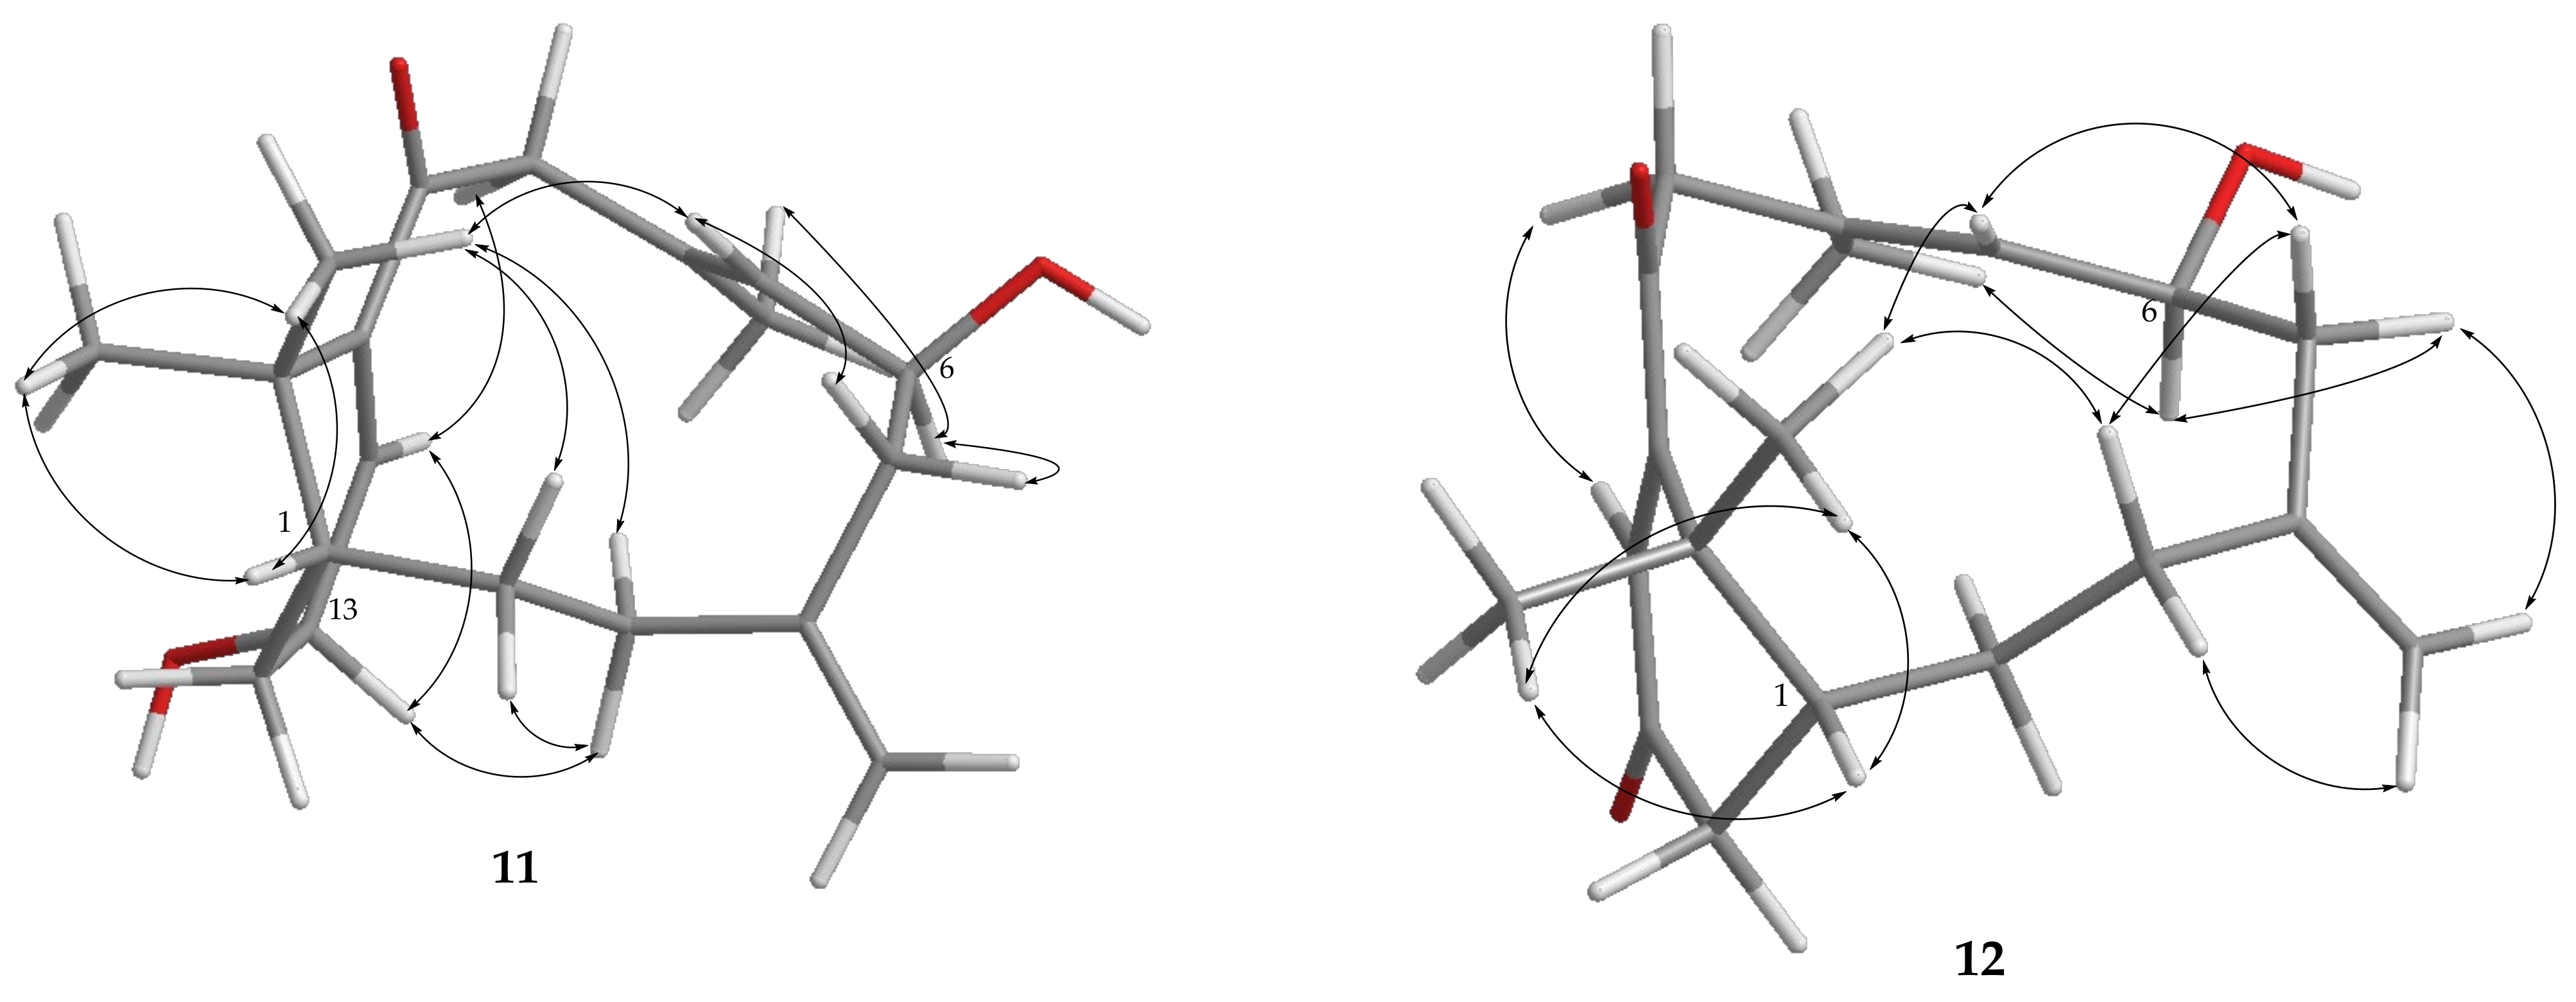
The new norditerpene cespitulin Q (11) was obtained as a colorless oil, which showed the pseudomolecular ion peak [M + H]+ at m/z 305.2108 in HRESIMS, appropriate for the molecular formula of C19H28O3 and six degrees of unsaturation. The IR absorptions at 3418 and 1699 cm–1 indicated the presence of the hydroxy and carbonyl groups, respectively. The carbon NMR signals (Table 4) at δC 202.6 (C), 150.3 (C), and 134.6 (CH), as well as the proton NMR signal (Table 3) at δH 6.10 (d, J = 3.5 Hz), were characteristic resonances for an α,β-unsaturated ketone unit in 11.
The analyses of COSY and HMBC correlations were used to establish the planar structure of 11 (Figure 5). Moreover, the NMR spectroscopic data of 11 were found to close to those of known metabolite cespitularin E (18) [17], with the exception of the carbon signal of C-13 resonating at δC 23.9 (CH2) in 18 was downfield shifted to δC 65.9 (CH) in 11, suggesting that 11 is the C-13 oxidation derivative of cespitularin E (18). From the NOE correlations (Figure 10) of 11, one of the methylene protons at C-3 (δH 2.59, dd, J = 15.0, 11.0 Hz) displayed an NOE correlation with the β-oriented H3-16 (δH 1.09, s), which correlated with the known β-oriented H-1 (δH 1.81, m), and thus was characterized as H-3β, while the other (δH 1.86, m) was assigned as H-3α. The NOE correlation between H-13 (δH 4.50, m) and H-3α determined the β-orientation of the hydroxy group at C-13. From the all NOE correlations observed, the relative configuration of 11 was thus established.
The molecular formula of cespitulin R (12) was found to be C19H26O3, as deduced by HRESIMS (m/z 325.1777 [M + Na]+). IR absorptions at 3420 and 1748 cm–1 of the corresponding hydroxy and carbonyl moieties were also confirmed. Comparison of the 1H and 13C NMR spectroscopic data (Table 3 and Table 4) of 11 and 12 suggested that both compounds are the same bicyclic verticillane-type norditerpenes, except that a hydroxy group at C-13 (δC 65.9, CH; δH 4.50, m) in 11 was replaced by a ketone (δC 199.0, C) in 12. The planar structure of 12 was further determined from analysis of the HMBC and COSY correlations, as shown in Figure 5. From the above results and on the basis of the analysis of NOE correlations (Figure 10), the relative configuration of cespitulin R (12) was established.
2.3. Structure Elucidation of the Cadinane-Type Sesquiterpenes 13–15 and the Eudesmane-Type Sesquiterpenoid 16
The molecular formula C15H26O2 of cespilin A (13) was revealed from the HRESIMS spectrum (m/z 261.1824 [M + Na]+). The IR spectrum of 13 showed the presence of the hydroxy group at 3392 cm–1. The 13C NMR (Table 6) and 1H NMR (Table 7), with the assistance of HSQC spectra, showed signals of three methyls, five methylenes (including one oxymethylene), five methines, and two nonprotonated carbons. The gross structure of 13 was determined by the analysis of COSY and HMBC correlations (Figure 5). The cadinane skeleton of 13, including placement of a hydroxy group and a hydroxymethyl group at C-6 (δC 71.2, C), was established mainly by the HMBC correlations from H3-14 (δH 0.84, d, J = 6.8 Hz) to C-1 (δC 34.7, CH), C-2 (δC 29.1, CH2), and C-9 (δC 36.6, CH); isopropyl methyls (δH 0.92 and 0.78, both d, J = 6.8 Hz) to C-4 (δC 51.1, CH); olefinic proton H-5 (δH 5.45, s) to C-4, C-7 (δC 31.1, CH2), C-9, C-10 (δC 147.0, C), and C-15 (δC 68.9, CH2), and H2-7 (δH 1.83, m, and 1.46, d, J = 9.2 Hz) to C-6.
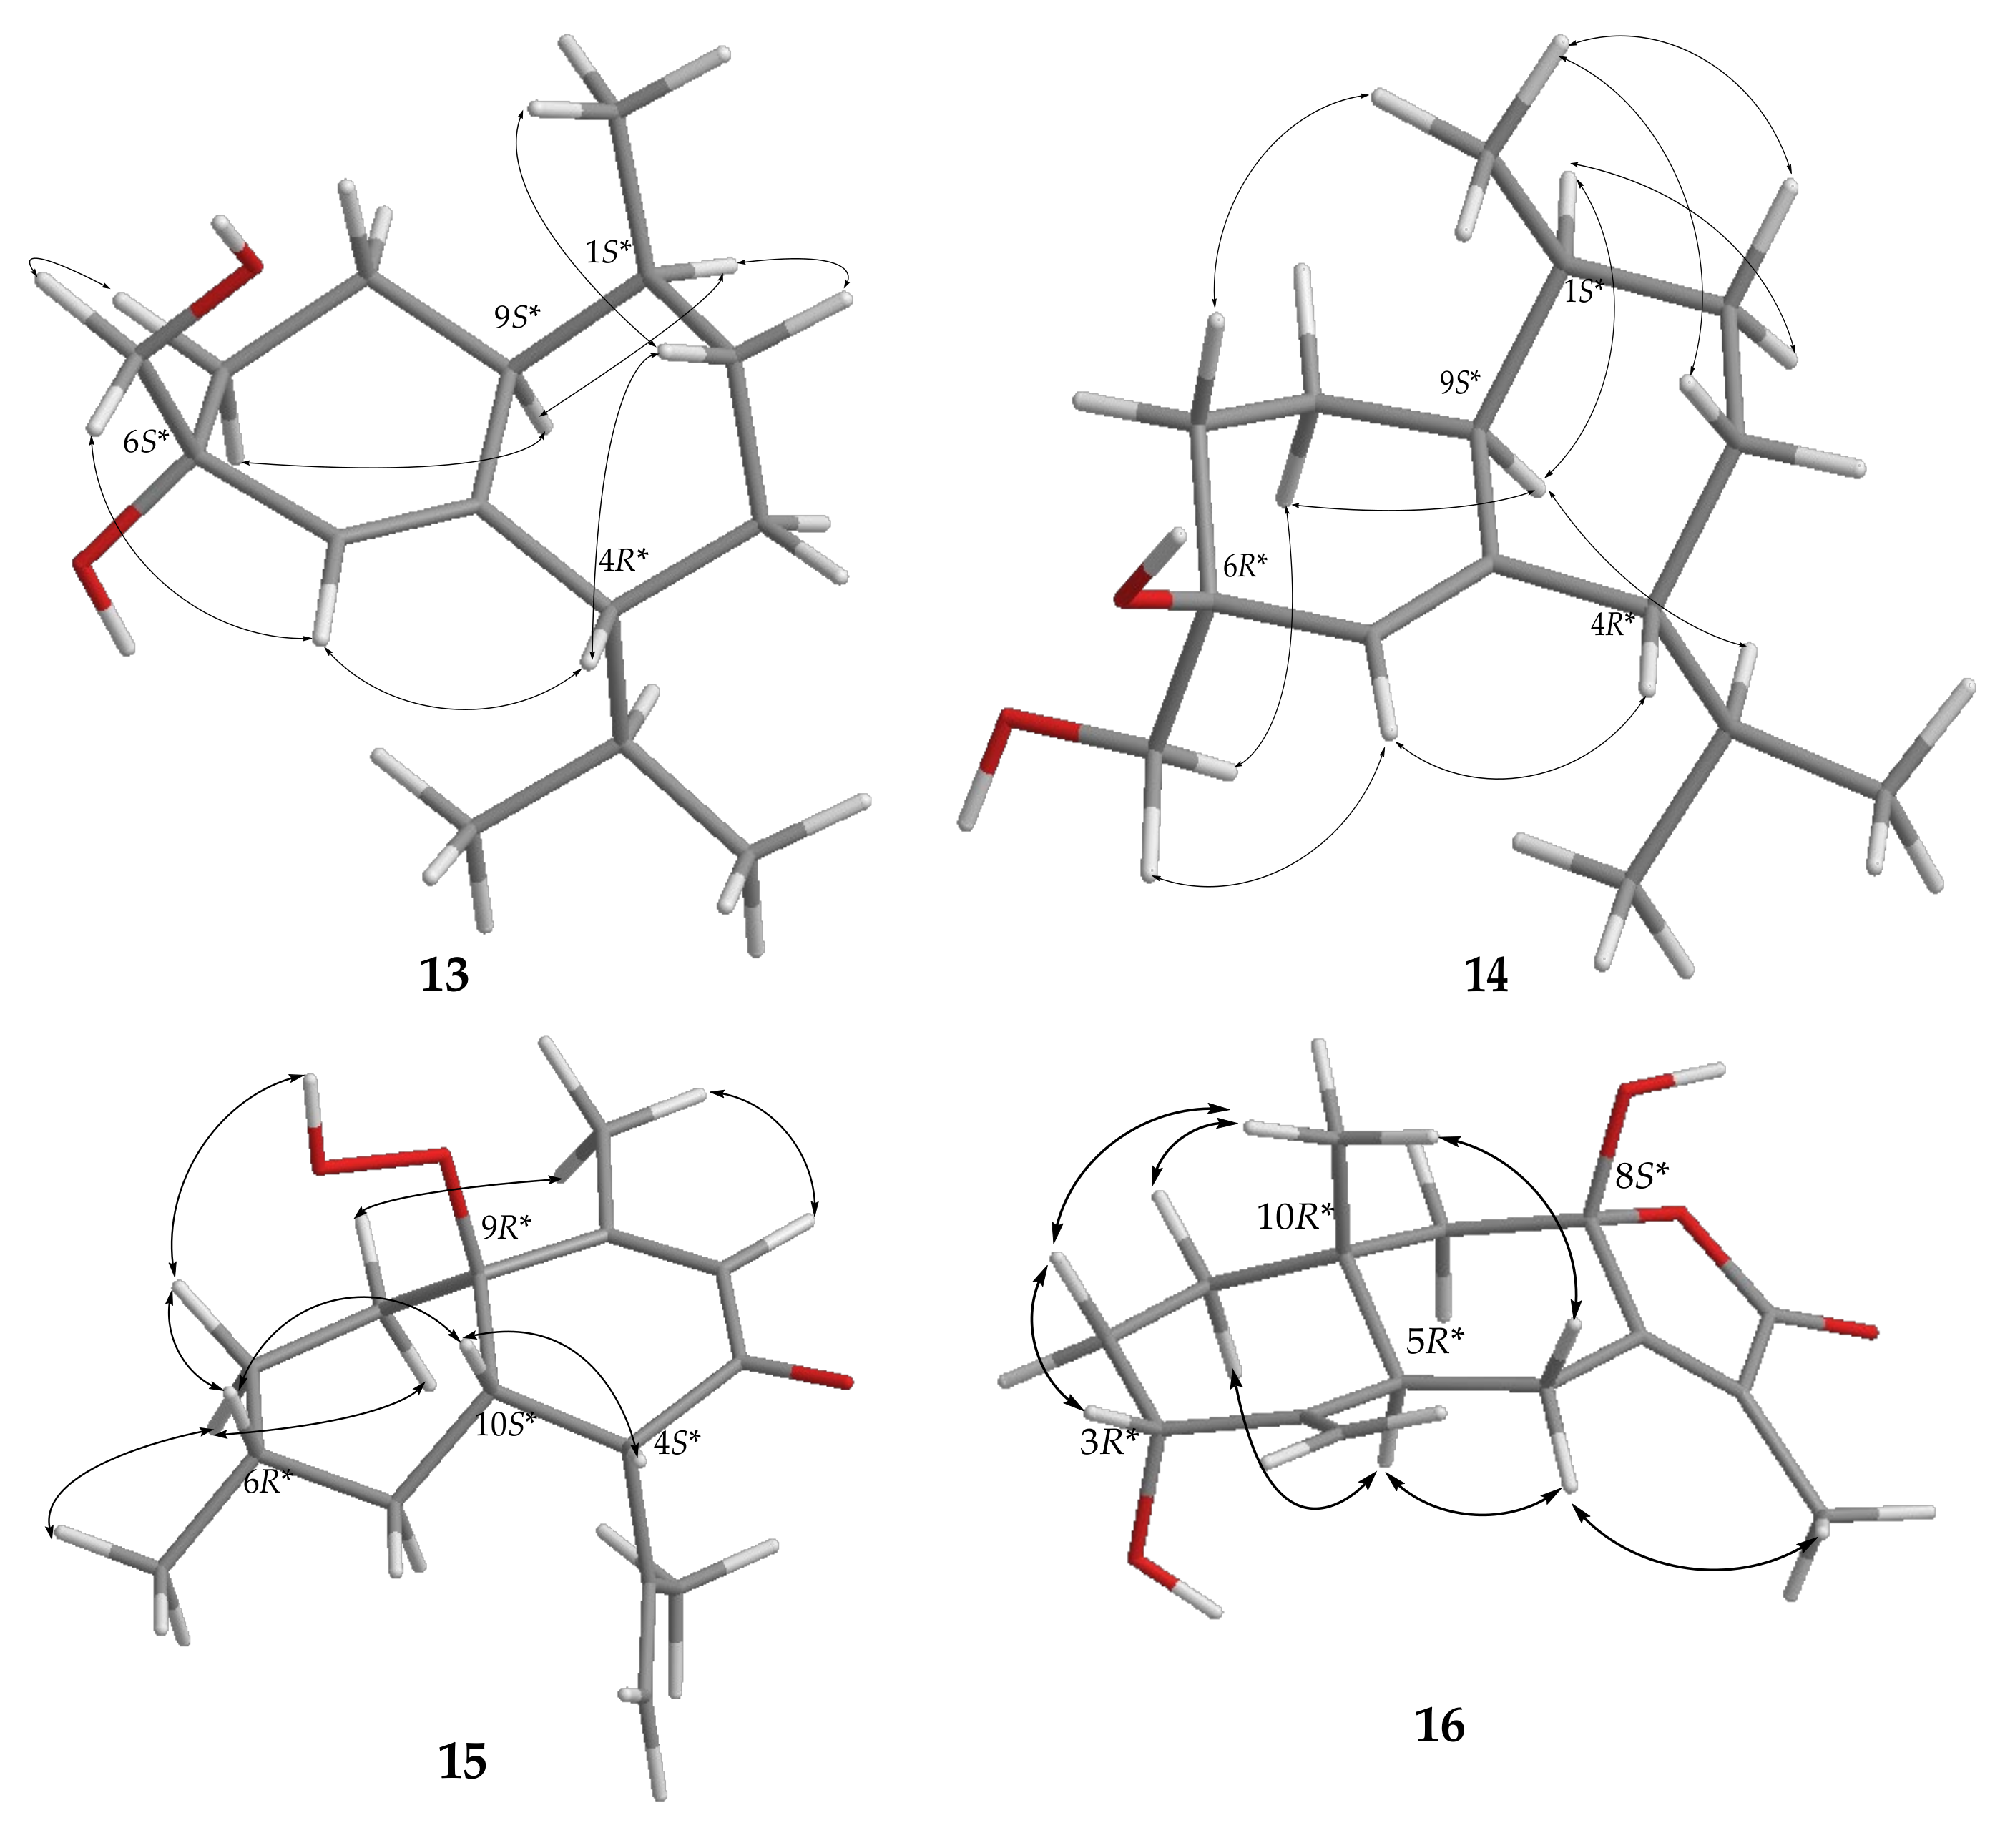
The relative stereochemistry of 13 was examined mainly with the assistance of an NOE experiment. It was found that H3-14 (δH 0.84, d, J = 6.8 Hz) showed an NOE correlation with one proton of H2-2 (δH 1.31, br t, J = 10.8 Hz), which further correlated with H-4 (δH 1.63, m); therefore, assuming the β-orientation of H3-14, the above methylene proton and H-4 should also be positioned on the β face, while H-1 (δH 1.96, m), the other proton of H2-2 (δH 1.82, m), and isopropyl group at C-4 were positioned on the α face. Furthermore, H-1 exhibited NOE correlations with both H-2α and H-9 (δH 2.31, br d, J = 4.4 Hz), revealing the α-orientation of H-9. Subsequently, H2-15 (δH 3.54 and 3.46, both dd, J = 8.4, 4.8 Hz) showed an NOE correlation with one proton of H2-7 (δH 1.46, d, J = 9.2 Hz), while the α-oriented H-9 which further correlated with another proton of H-7 (δH 1.83, m), suggesting that the 6-hydroxymethyl group should be placed on the β face, and in contrast, 6-hydroxy group should be positioned on the α face. Consequently, the relative configuration of 13 was elucidated as 1S*,4R*,6S*, and 9S* (Figure 11).
The HRESIMS data of cespilin B (14) (m/z 261.1824 [M + Na]+) established a molecular formula of C15H26O2, the same as that of 13. Analysis of 2D NMR spectroscopic data, including HSQC, COSY, and HMBC, revealed that 14 should possess the same molecular skeleton as that of 13 (Figure 5). Additionally, the NMR data (Table 6 and Table 7) of 14 were highly similar in all aspects to those of 13, implying that 14 is a structurally similar isomer of 13. Comparison of the NOE correlations of both 13 and 14 revealed that both compounds possess the same 1S*, 4R*, and 9S* relative configurations. From the NOE correlations of the α-oriented H-9 (δH 2.24, td, J = 13.2, 4.8 Hz) with H-8α (δH 1.64, m), as well as H2-15 (δH 3.49 and 3.43, both d, J = 10.8 Hz) further correlated with H-8α, the 6-hydroxymethyl group should be placed on the α face, while the hydroxy group at C-6 should be β-oriented. Compound 14 was thus found to be the C-6 epimer of 13, and the relative configuration was assigned to be 1S*, 4R*, 6R*, and 9S* (Figure 11).
Cespilin C (15) has the molecular formula C15H22O3 as shown by HRESIMS spectrum (m/z 273.1464 [M + Na]+). The IR spectrum of 15 showed the absorption of an α,β-unsaturated ketone (1683 cm–1) which was further characterized from the corresponding 13C NMR signals (Table 6) of δC 197.7 (C), 162.7 (C), and 128.6 (CH). The NMR signals at δC 84.0 (C) and δH 7.42 (1H, br s) revealed the presence of a hydroperoxy group at the sp3 nonprotonated carbon. Analysis of the COSY spectrum of 15 identified one proton sequence from H-4 to H2-8 via H-10, which assembled the major part of the planar structure of 15 with the crucial HMBC correlations as shown in Figure 5.
However, the connection of C-8/C-9 and C-9/C-10 could not be observed by COSY and HMBC correlations; instead, the two single bonds were established to fulfill the cadinane skeleton of 15 by the molecular formula and the tetrahedron nature of sp3 carbons. The relative structure of 15 was elucidated by the analysis of NOE correlations (Figure 11). Assuming the β-orientation of H-4 (δH 3.26, d, J = 13.5 Hz), NOE correlations of H-4 with H-10 (δH 2.90, br d, J = 13.5 Hz) and H-10 with H-6 (δH 1.61, m) implied the β-orientation of both H-6 and H-10, while the α-orientation of the isopropenyl group at C-4 and the methyl group (δH 0.90, d, J = 6.5 Hz) at C-6. Subsequently, one proton of H2-7 (δH 1.54, m) displayed NOE correlations with both the hydroperoxy proton (δH 7.42, s) and H-6, while the other proton of H2-7 (δH 1.22, m) correlated with H3-15, reflecting that the 9-hydroperoxy group should be situated on the β-face. Finally, the relative stereochemistry of 15 was thus established as 4S*, 6R*, 9R*, and 10S*.
Compound 16 was isolated as a white amorphous powder. The HRESIMS of 16 exhibited a sodiated pseudomolecular ion peak at m/z 287.1255 [M + Na]+ and revealed a molecular formula of C15H20O4, implying six degrees of unsaturation. The IR absorptions displayed the presence of the hydroxy (3418 cm–1) and carbonyl (1732 cm–1) groups. A comparison of the NMR data (Table 6 and Table 7) of 16 to those of a known metabolite atractylenolide III (25) [30,31,32,33], could well describe the molecular framework of 16 as eudesmane-type sesquiterpenoid. A difference was found that the methylene (H2-3) of 25 was substituted with a hydroxy group in 16 (Figure 1 and Figure 5).
The relative configuration of 16 was established by NOESY experiments and NMR spectroscopic data. H3-14 (δH 1.03, s) showed an NOE interaction with one proton of H2-1 (δH 1.38, m), while H-5 (δH 2.45, br s) displayed an NOE correlation with the other proton of H2-1 (δH 1.71, td, J = 13.8, 4.2 Hz), therefore, H-5 was suggested to be α-oriented as H3-14 was well known β-oriented for the eudesmane-type sesquiterpenoids [15,32]. In addition, NOE correlations were observed for one proton of H2-2 (δH 1.87, dt, J = 14.4, 3.6 Hz) with both H-3 (δH 4.37, br s) and H3-14, could reflect the α-orientation of the hydroxy group at C-3. Additionally, the 13C NMR signals of C-7 (δC 159.4, C), C-8 (δC 103.1, C), and C-9 (δC 51.0, CH2) in 16 were found to be similar to those of atractylenolide III (25) (δC 160.6, C, C-7; 103.2, C, C-8; 51.3, CH2, C-9), while in 8-epi-atractylenolide III C-7 (δC 157.7) and C-9 (δC 47.7) were shifted upfield and C-8 (δC 109.1) was shifted downfield, suggesting that the hydroxy group at C-8 in 16 should be positioned on the β face [33]. On the basis of the above analyses, and the other shown in Figure 11, the structure of 16 was thus elucidated to be (3R*,5R*,8S*,10R*)-3α,8β-dihydroxy-eudesma-4(15),7(11)-dien-8,12-olide and named cespitulolide (16).
2.4. Anti-Inflammatory Activities of the EtOAc Extract and the Isolated Compounds 1–28
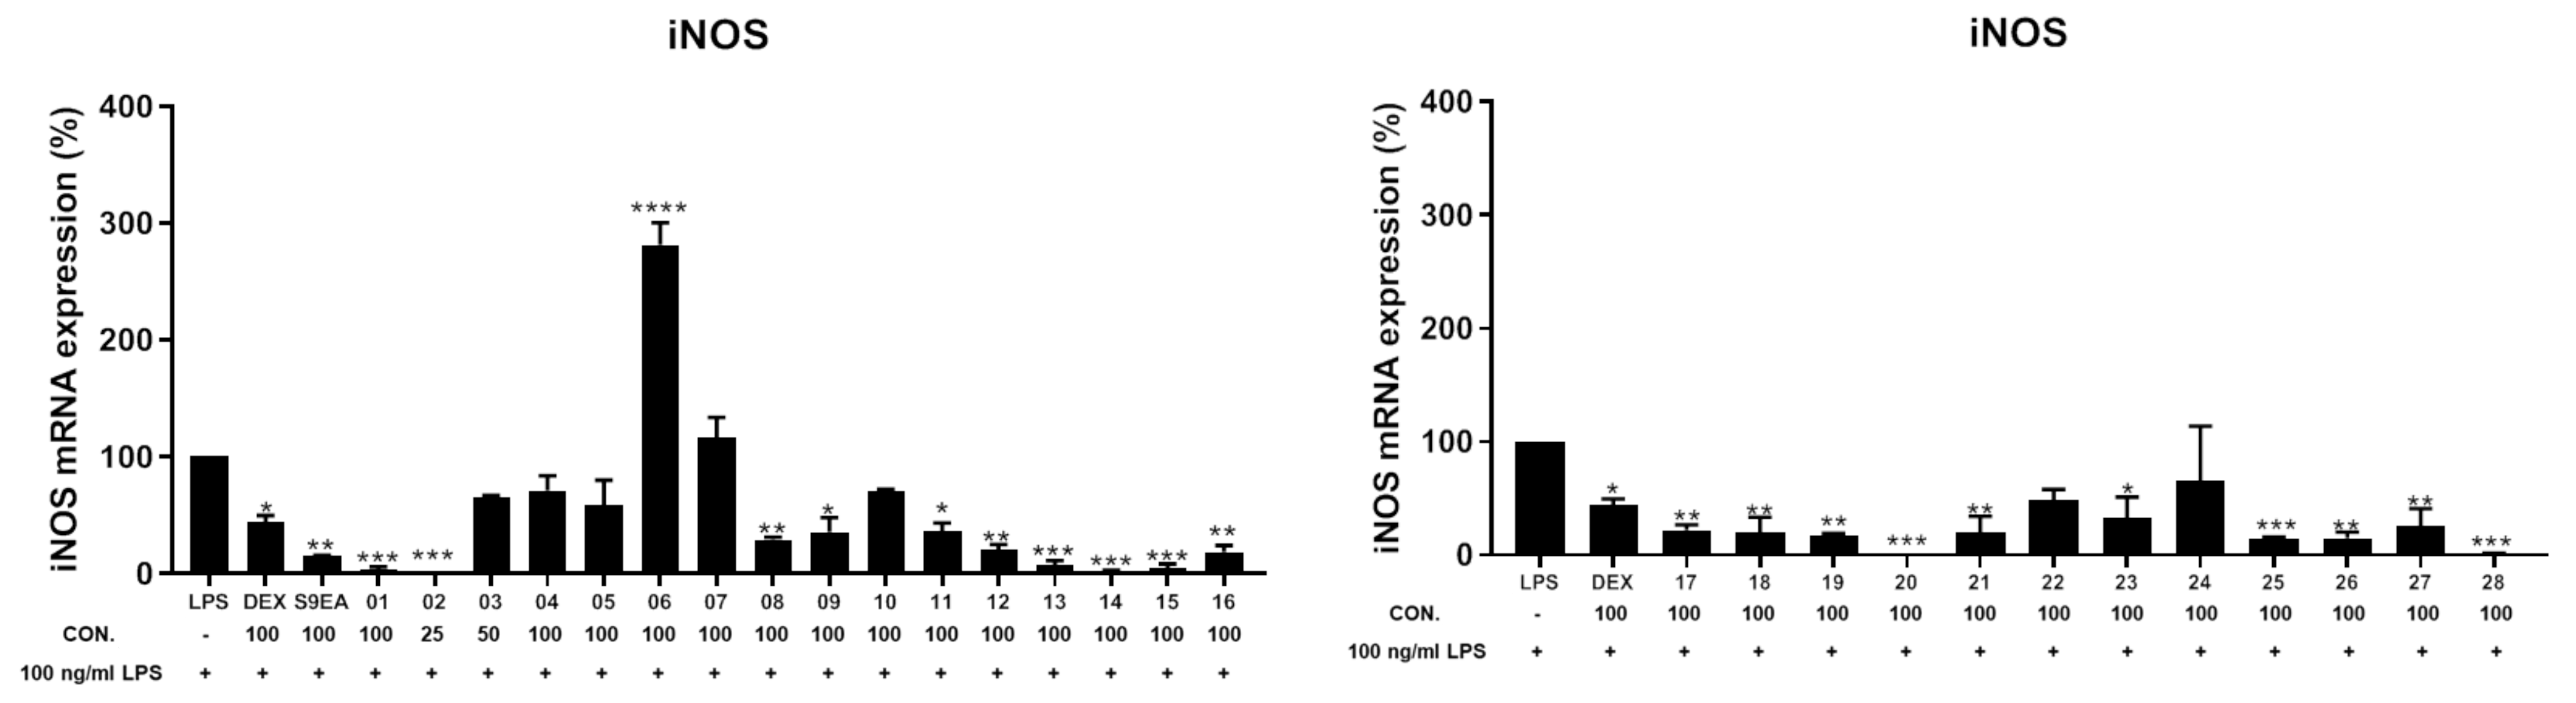
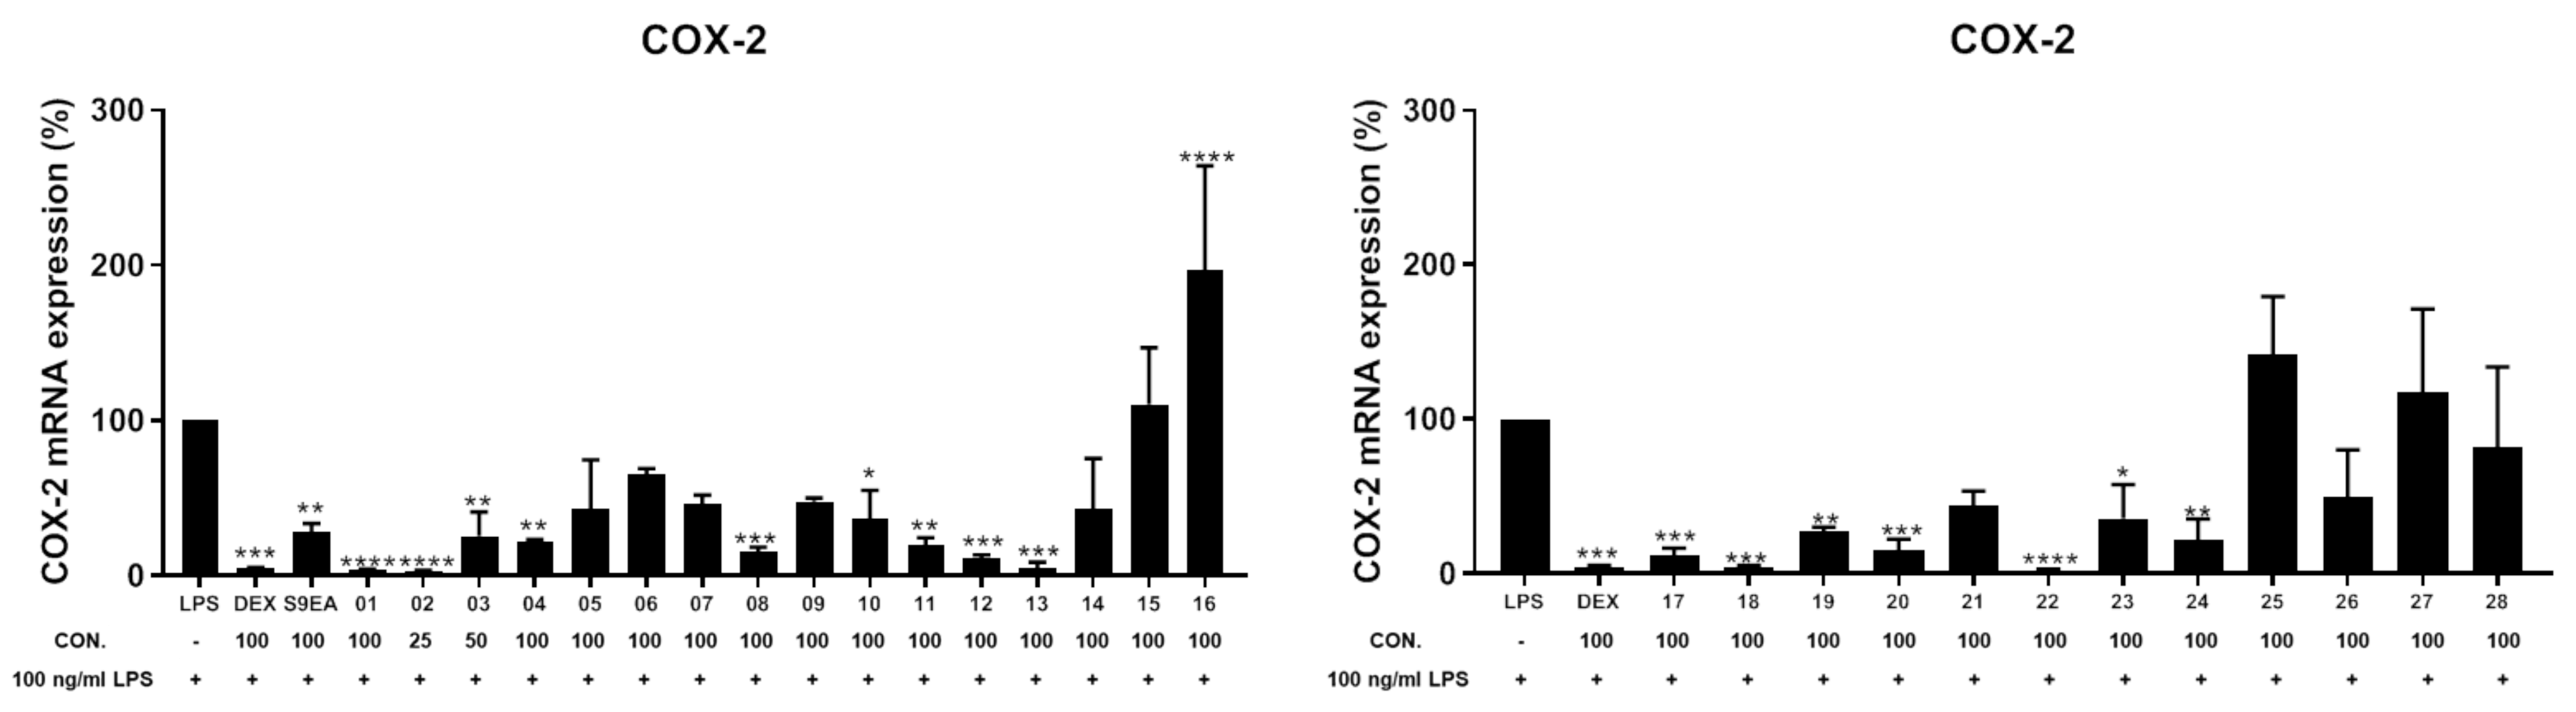
The anti-inflammatory activities of the EtOAc extract were screened in terms of the suppression of TNF-α production and NO release, as well as the inhibition of upregulation of pro-inflammatory iNOS and COX-2 gene, in LPS-induced DCs. The results of a preliminary study at a concentration of 100 μg/mL showed that the relative activities of this extract in inhibiting the production of TNF-α and NO were 84.1 ± 4.2 and 76.1 ± 1.4%, respectively, and it could reduce the levels of iNOS and COX-2 gene to 15.9 ± 0.4, and 28.6 ± 4.1%, respectively, too. For the discovery of bioactive compounds with anti-inflammatory abilities by inhibition of TNF-α and NO overproduction, 1–28 isolated from this extract were further assayed (Table 8). At a concentration of 100 μM, 1–3 could potently inhibit 95.0 ± 0.2, 95.7 ± 0.4, and 95.8 ± 0.1% TNF-α production, respectively, relative to the control cells treated with LPS only. The respective IC50 values of 1–3, 47.2, 48.6, and 41.1 μM, were further measured. Compounds 2, 12, 19, and 21 showed significant activities to inhibit NO releasing at 63.3 ± 1.6, 61.1 ± 0.5, 63.7 ± 0.8, and 61.7 ± 1.0%, respectively, at the same concentration. The IC50 values of 49.7, 51.9, and 57.4 μM, respectively, of 2, 19, and 21 in inhibiting the NO production were also measured. On the other hand, the anti-inflammatory potentials of compounds 1–28 in inhibition toward the accumulation of pro-inflammatory iNOS and COX-2 gene expression in the same LPS-induced DCs model were also evaluated (Figure 12 and Figure 13, and Table 9). At a concentration of 25 μM, 2 was found to effectively reduce the gene expression of iNOS and COX-2 to 0.3 ± 0.1 and 2.9 ± 0.6%, respectively, relative to the control cells stimulated with LPS only. Meanwhile, 1, 13–15, 20, and 28 were found to conspicuously reduce the gene expression of iNOS to 3.6 ± 1.8, 7.4 ± 2.9, 1.5 ± 0.8, 4.6 ± 2.9, 0.2 ± 0.1, and 1.2 ± 0.5%, respectively, while 1, 13, 18, and 22 could strongly reduce the COX-2 gene level to 4.2 ± 0.1, 4.4 ± 3.5, 4.5 ± 0.5, and 2.1 ± 0.4%, respectively, at a concentration of 100 μM. On the contrary, 6 significantly enhanced the gene expression of iNOS to 281.2 ± 15.4%, and 16 exhibited obvious activity of enhancing 196.9 ± 55.1% COX-2 gene expression, at the same concentration of 100 μM.
3. Discussion
The pro-inflammatory cytokine TNF-α, and reactive nitrogen species (RNS), such as NO, are shown to involve in the physiological regulation of immune responses [39,40,41]. The inducible enzymes iNOS and COX-2 are also critical regulators of inflammation [40,42]. iNOS and COX-2 are also known to express together in inflamed responses and overproduction of NO can enhance the expression of COX-2 protein [43]. Generally, the inappropriate production of TNF-α and NO, as well as high iNOS and COX-2 protein and gene expression were found to be related to the pathogenesis of many inflammatory related diseases [44,45,46,47,48,49,50,51] such as AIDS, Alzheimer’s, arthritis, cancer, diabetes, stroke, multiple sclerosis, obesity, and Parkinson’s disease. Therefore, substances with inhibitory ability toward the overproduction of these inflammatory mediators are candidates for the development of new pharmaceutics in the treatment of chronic inflammation and autoimmune diseases [52,53].
The anti-inflammatory potential of all isolated compounds revealed that compounds 1–3 and 12–15 might represent promising anti-inflammatory agents, in particular, 1 and 2 not only could significantly inhibit the production of TNF-α and NO but also displayed potent suppression to the expression of iNOS and COX-2 gene. Compound 13 might also be regarded as a promising inducible enzyme inhibitor as it can potently inhibit the expression of both iNOS and COX-2 genes.
From the structure−activity relationship (SAR), the tetracyclic verticillane-type diterpenes 1 and 2 were showing significant activities for each biological study relative to 3–8, owing to the presence of an acrylate group at C-20. Furthermore, 2 exhibited stronger anti-inflammatory abilities at lower concentrations (25 μM) than 1 at higher concentrations (100 μM). Thus, the acrylate group at C-20 and the hydroxy group at C-6 in epoxyfuranyl verticillane-type metabolites could effectively enhance the anti-inflammatory activity. The bicyclic verticillane-type norditerpene 12 displayed more effective anti-inflammatory activities than 11, suggesting that the presence of the α,β-conjugated ketone at C-13 as in 12 could strengthen activities from the allylic hydroxy group at C-13 as in 11. On the other hand, the cadinane-type squiterpenes 13–15 exhibited significant inhibition toward iNOS gene expression, however, the presence of a hydroperoxy group and/or conjugated enone group as shown in 15 might promote the COX-2 gene expression.
4. Materials and Methods
4.1. General Experimental Procedures
Values of specific optical rotation were determined on a JASCO P-1020 digital polarimeter. UV spectra were recorded on a JASCO V-650 spectrophotometer. IR spectra were measured on a JASCO FT-IR-4100 and Nicolet iS5 FT-IR infrared spectrophotometers. ESIMS and HRESIMS data were obtained with a Bruker APEX II mass spectrometer. NMR spectra were recorded on a JEOL ECZ600R FT-NMR (or a Varian Unity INOVA 500 FT-NMR, or a Varian MR 400 FT-NMR) instrument at 600 MHz (or 500 MHz, or 400 MHz) for 1H and 150 MHz (or 125 MHz, or 100 MHz) for 13C, respectively. All NMR experiments were measured using CDCl3 or benzene-d6 as the solvent. Silica gel (Merck, 230–400 mesh) and Sephadex LH-20 (GE Healthcare, 25–100 μm) were used for column chromatography. High-performance liquid chromatography (HPLC) was performed on a HiTachi L-7100 HPLC system apparatus with a Supelco C18 (250 mm × 21.2 mm, 5 μm) or Hibar 250-10 C18 (250 mm × 21.2 mm, 5 μm) column.
4.2. Animal Material
The soft coral Cespitularia sp. was collected by hand using SCUBA at Green Island, which is located off the southeastern coast of Taiwan, in June 2007, at a depth of 10–15 m, and was stored in a freezer until extraction. A voucher specimen was deposited in the Department of Marine Biotechnology, National Sun Yat-sen University, Kaohsiung, Taiwan.
4.3. Extraction and Isolation
The frozen specimens of Cespitularia sp. (87.20 g, dry weight) were sliced and exhaustively extracted with EtOAc (5 × 2 L) for 24 h. The solvent-free extract was obtained and further purified by reverse-phase HPLC to afford new compounds 1–16 (Figure 1) and known compounds 17–28 (Figure 2). The EtOAc extract (4.26 g) was subjected to silica gel open column chromatography (diameter: 8 cm; height: 30 cm) and eluted with a gradient of EtOAc in n-hexane (0–100%, stepwise), to furnish 15 fractions, A1–A15. Fraction A7, eluting with n-hexane–EtOAc (1:1), was purified over silica gel in open column (diameter: 2.5 cm; height: 50 cm) using n-hexane–EtOAc (1:1) to afford five subfractions A7-1–A7-5. Subfractions A7-3, A7-4, and A7-5 were further purified by reversed-phase (RP) HPLC using CH3CN–H2O (1:1), CH3CN–H2O (1:1.5), and MeOH–H2O (2:1), respectively, to afford 1 (1.5 mg), 15 (0.5 mg), 25 (30.1 mg), and 26 (1.0 mg) from A7-3, 7 (0.5 mg) and 19 (1.5 mg) from A7-4, and 3 (2.0 mg), 4 (0.6 mg), and 18 (1.3 mg) from A7-5. Fraction A-8, eluting with n-hexane–EtOAc (1:2), was separated by silica gel column (diameter: 2.5 cm; height: 50 cm) chromatography using n-hexane–EtOAc (1:2) to give subfractions A8-1–A8-7. RP-HPLC was further performed to purify subfraction A8-4, using MeOH–H2O (1.5:1) to afford 5 (1.4 mg) and 6 (1.1 mg), and MeOH–H2O (2:1) to afford 2 (2.2 mg), 27 (3.7 mg), and 28 (1.0 mg). Subfraction A8-5 was further separated by RP-HPLC using MeOH–H2O (1.5:1) to yield 10 (0.6 mg), 12 (1.0 mg), and 17 (6.6 mg). Subfraction A8-6 was purified by RP-HPLC using CH3CN–H2O (1:1.5) to afford 13 (1.2 mg), 14 (0.9 mg), and 20 (1.1 mg). Fraction A-9, eluting with n-hexane–EtOAc (1:4), was rechromatographed over silica gel column (diameter: 2.5 cm; height: 50 cm) using n-hexane–EtOAc (1:2) as the mobile phase to give nine subfractions, A9-1–A9-9. Subfractions A9-4 and A9-5 were purified by RP-HPLC using CH3CN–H2O (1:1.5) to afford 8 (1.0 mg) and 21 (1.4 mg), respectively. Subfraction A9-7 was further purified by RP-HPLC using CH3CN–H2O (1.5:1) to afford 22 (5.8 mg). Fraction A-10, eluting with n-hexane–EtOAc (1:8), was separated using sephadex LH-20 column (diameter: 3 cm; height: 100 cm) chromatography with 100% acetone to furnish seven subfractions (A10-1–A10-7). Subfraction A10-3 was purified by RP-HPLC (CH3CN–H2O, 1:1.5) to afford 23 (0.6 mg), and subfraction A10-5 was chromatographed using RP-HPLC (CH3CN–H2O, 1:2) to yield 9 (1.2 mg), 11 (1.1 mg), 16 (0.5 mg), and 24 (1.7 mg).
Cespitulin H (1): White amorphous powder;
+162 (c 0.43, CHCl3); UV (MeOH) λmax (log ε) 239 (3.3) and 213 (3.4); IR(neat) vmax 3480, 2925, 1741, 1685, 1617, 1456, 1386, and 1170 cm–1; 1H and 13C NMR data, see Table 1 and Table 2; ESIMS m/z 425; HRESIMS m/z 425.1932 [M + Na]+ (calcd for C23H30O6Na, 425.1935).
Cespitulin I (2): White amorphous powder; –91 (c 0.63, CHCl3); UV (MeOH) λmax (log ε) 210 (3.4); IR(neat) vmax 3440, 2925, 1740, 1715, 1634, 1455, 1386, and 1166 cm–1; 1H and 13C NMR data, see Table 1 and Table 2; ESIMS m/z 427; HRESIMS m/z 427.2089 [M + Na]+ (calcd for C23H32O6Na, 427.2091).
Cespitulin J (3): Colorless oil; +29 (c 0.57, CHCl3); IR(neat) vmax 3446, 2923, 2853, 1758, 1636, 1457, 1385, and 1164 cm–1; 1H and 13C NMR data, see Table 1 and Table 2; ESIMS m/z 611; HRESIMS m/z 611.4282 [M + Na]+ (calcd for C36H60O6Na, 611.4282).
Cespitulin K (4): Colorless oil; +38 (c 0.17, CHCl3); IR(neat) vmax 3420, 2924, 2853, 1748, 1636, 1457, 1386, and 1111 cm–1; 1H and 13C NMR data, see Table 1 and Table 2; ESIMS m/z 637; HRESIMS m/z 637.4440 [M + Na]+ (calcd for C38H62O6Na, 637.4439).
Cespitulin L (5): White amorphous powder; +35 (c 0.40, CHCl3); IR(neat) vmax 3445, 2920, 1683, 1652, 1455, 1385, and 1187 cm–1; 1H and 13C NMR data, see Table 1 and Table 2; ESIMS m/z 365; HRESIMS m/z 365.2315 [M + H]+ (calcd for C21H33O5, 365.2323).
Cespitulin M (6): White amorphous powder; –23 (c 0.31, CHCl3); IR(neat) vmax 3446, 2917, 1683, 1652, 1456, 1386, and 1209 cm–1; 1H and 13C NMR data, see Table 1 and Table 3; ESIMS m/z 387; HRESIMS m/z 387.2142 [M + Na]+ (calcd for C21H32O5Na, 387.2142).
Cespitulin N (7): White amorphous powder; +102 (c 0.14, CHCl3); IR(neat) vmax 3446, 2917, 1733, 1652, 1456, 1386, and 1239 cm–1; 1H and 13C NMR data, see Table 3 and Table 4; ESIMS m/z 399; HRESIMS m/z 399.2142 [M + Na]+ (calcd for C22H32O5Na, 399.2142).
Cespitulin O (8): Colorless oil; –63 (c 0.29, CHCl3); IR(neat) vmax 3419, 2922, 1733, 1652, 1456, 1386, and 1224 cm–1; 1H and 13C NMR data, see Table 3 and Table 4; ESIMS m/z 393; HRESIMS m/z 393.2267 [M + H]+ (calcd for C22H33O6, 393.2272).
Cespitulactam L (9): Colorless oil; –132 (c 0.34, CHCl3); UV (MeOH) λmax (log ε) 221 (3.4); IR(neat) vmax 3245, 2919, 1698, 1647, 1457, 1387, and 1204 cm–1; 1H and 13C NMR data, see Table 3 and Table 4; ESIMS m/z 368; HRESIMS m/z 368.2195 [M + Na]+ (calcd for C21H31O3NNa, 368.2196).
Cespitulin P (10): Colorless oil; +68 (c 0.17, CHCl3); IR(neat) vmax 3445, 2917, 1732, 1715, 1651, 1455, 1385, and 1219 cm–1; 1H and 13C NMR data, see Table 5; ESIMS m/z 375; HRESIMS m/z 375.2141 [M + Na]+ (calcd for C20H32O5Na, 375.2142).
Cespitulin Q (11): Colorless oil; +176 (c 0.31, CHCl3); UV (MeOH) λmax (log ε) 212 (3.3); IR(neat) vmax 3418, 2917, 1699, 1652, 1456, 1386, and 1232 cm–1; 1H and 13C NMR data, see Table 3 and Table 4; ESIMS m/z 305; HRESIMS m/z 305.2108 [M + H]+ (calcd for C19H29O3, 305.2111).
Cespitulin R (12): White amorphous powder; +46 (c 0.29, CHCl3); UV (MeOH) λmax (log ε) 225 (3.2); IR(neat) vmax 3420, 2919, 1748, 1684, 1653, 1457, 1387, and 1223 cm–1; 1H and 13C NMR data, see Table 3 and Table 4; ESIMS m/z 325; HRESIMS m/z 325.1777 [M + Na]+ (calcd for C19H26O3Na, 325.1774).
Cespilin A (13): Colorless oil; +56 (c 0.34, CHCl3); IR(neat) vmax 3392, 2926, 2870, 1652, 1456, 1380, and 1050 cm–1; 1H and 13C NMR data, see Table 6 and Table 7; ESIMS m/z 261; HRESIMS m/z 261.1824 [M + Na]+ (calcd for C15H26O2Na, 261.1825).
Cespilin B (14): Colorless oil; +60 (c 0.26, CHCl3); IR(neat) vmax 3357, 2925, 2869, 1652, 1456, 1381, 1060 cm–1; 1H and 13C NMR data, see Table 6 and Table 7; ESIMS m/z 261; HRESIMS m/z 261.1824 [M + Na]+ (calcd for C15H26O2Na, 261.1825).
4.4. In Vitro Anti-Inflammatory Assay
4.4.1. Measurement of Cytokine Production by Dendritic Cells (DCs)
The experiment for measuring cytokine was tested by enzyme-link immunosorbent assay (ELISA) from the previously reported method [6,7]. The DCs were manipulated with lipopolysaccharide (LPS, 100 ng/mL) from Escherichia coli 055:B5, and the following treatment with the isolated compounds for 24 h. The optical density of the production of TNF-α was measured at 450 nm using the ELISA reader.
4.4.2. Measurement of Nitric Oxide (NO) Production by DCs
DC cells were seeded in 24-well plates at a density of 1 × 10⁶/mL. DCs were treated with each compound for 1 h and then stimulated with 100 ng/mL LPS for 24 h. The nitrite concentration in the medium was measured as an indicator of NO production through the Griess reaction. Briefly, 100 μL of cell culture supernatant was reacted with 100 μL of Griess reagent (1:1 mixture of 2% sulfanilamide and 0.2% N-(1-naphthyl-)ethylenediamine dihydrochloride in water) in 96-well plate at room temperature for 10 min, and absorbance at 540 nm was recorded using sandwich ELISA assays [6,7].
4.4.3. Measurement of Pro-Inflammatory Inducible NO Synthase (iNOS) and Cyclooxygenase-2 (COX-2) Gene Expression by DCs
The suppression activities of compounds were measured by the examining suppression of LPS-induced upregulation of pro-inflammatory iNOS and COX-2 gene expression in DCs using real-time polymerase chain reaction (PCR) [14]. Briefly, DCs (1 × 10⁶/mL) were incubated in 6-well plates and treated with each compound for 1 h, and then were added the LPS (100 ng/mL), stimulating for 24 h. Subsequently, cells were harvested and isolated total RNA using Trizol reagent. A total of 2 μg RNA was reverse-transcribed using M-MLV Reverse Transcriptase to synthesize cDNA (Applied Biosystems). Gene expression levels of iNOS and COX-2 were analyzed using SYBR-Green PCR Master Mix with StepOne PCR System (Applied Biosystems; Thermo Fisher Scientific). Relative gene expression levels were calculated using the 2−ΔΔCt method and normalized to GAPDH; all the primers which were used are listed in Table 10 [54].
4.5. Statistical Analysis
The results are expressed as the mean ± SEM, and comparisons were made using one-way ANOVA by Tukey’s post hoc test (Graphpad Prism 5.0, GraphPad Software, San Diego, CA, USA). A probability value of 0.05 or less was considered significant. The software Sigma Plot was used for the statistical analysis.
5. Conclusions
In conclusion, our chemical investigation demonstrated that the soft coral Cespitularia sp. could be a good source of bioactive substances. Eight new tricyclic verticillane-type diterpenes 1–9, one novel norditerpene 10, two new dicyclic verticillane-type norditerpenes 11 and 12, three cadinane-type sesquiterpenes 13–15, and one eudesmane-type sesquiterpenoid 16, along with twelve known metabolites 17–28, were isolated from this investigation. The structural framework of verticillane-type derivatives was found to be close to the tricyclic taxane skeleton [55] and obtained from marine organisms only in the soft coral genus Cespitularia [15]. Furthermore, the cadinane-type sesquiterpenes 13–15 were isolated from the soft coral genus Cespitularia for the first time. From the results of the evaluated biological activities, it appears that compounds 1, 2, and 13 might be promising compounds for further marine anti-inflammatory drug development.
Supplementary Materials
The following are available online at https://www.mdpi.com/article/10.3390/ph14121252/s1, Figure S1: HRESIMS spectrum of 1, Figure S2: 1H NMR spectrum of 1 in C6D6 at 500 MHz, Figure S3: 13C NMR spectrum of 1 in C6D6 at 125 MHz, Figure S4: HSQC spectrum of 1 in C6D6, Figure S5: COSY spectrum of 1 in C6D6, Figure S6: HMBC spectrum of 1 in C6D6, Figure S7: NOESY spectrum of 1 in C6D6, Figure S8: HRESIMS spectrum of 2, Figure S9: 1H NMR spectrum of 2 in CDCl3 at 400 MHz, Figure S10: 13C NMR spectrum of 2 in CDCl3 at 100 MHz, Figure S11: HSQC spectrum of 2 in CDCl3, Figure S12: COSY spectrum of 2 in CDCl3, Figure S13: HMBC spectrum of 2 in CDCl3, Figure S14: NOESY spectrum of 2 in CDCl3, Figure S15: HRESIMS spectrum of 3, Figure S16: 1H NMR spectrum of 3 in CDCl3 at 500 MHz, Figure S17: 13C NMR spectrum of 3 in CDCl3 at 125 MHz, Figure S18: HSQC spectrum of 3 in CDCl3, Figure S19: COSY spectrum of 3 in CDCl3, Figure S20: HMBC spectrum of 3 in CDCl3, Figure S21: NOESY spectrum of 3 in CDCl3, Figure S22: HRESIMS spectrum of 4, Figure S23: 1H NMR spectrum of 4 in CDCl3 at 500 MHz, Figure S24: 13C NMR spectrum of 4 in CDCl3 at 125 MHz, Figure S25: HSQC spectrum of 4 in CDCl3, Figure S26: COSY spectrum of 4 in CDCl3, Figure S27: HMBC spectrum of 4 in CDCl3, Figure S28: NOESY spectrum of 4 in CDCl3, Figure S29: HRESIMS spectrum of 5, Figure S30: 1H NMR spectrum of 5 in CDCl3 at 500 MHz, Figure S31: 13C NMR spectrum of 5 in CDCl3 at 125 MHz, Figure S32: HSQC spectrum of 5 in CDCl3, Figure S33: COSY spectrum of 5 in CDCl3, Figure S34: HMBC spectrum of 5 in CDCl3, Figure S35: NOESY spectrum of 5 in CDCl3, Figure S36: HRESIMS spectrum of 6, Figure S37: 1H NMR spectrum of 6 CDCl3 at 500 MHz, Figure S38: 13C NMR spectrum of 6 in CDCl3 at 125 MHz, Figure S39: HSQC spectrum of 6 in CDCl3, Figure S40: COSY spectrum of 6 in CDCl3, Figure S41: HMBC spectrum of 6 in CDCl3, Figure S42: NOESY spectrum of 6 in CDCl3, Figure S43: HRESIMS spectrum of 7, Figure S44: 1H NMR spectrum of 7 in CDCl3 at 500 MHz, Figure S45: 13C NMR spectrum of 7 in CDCl3 at 125 MHz, Figure S46: HSQC spectrum of 7 in CDCl3, Figure S47: COSY spectrum of 7 in CDCl3, Figure S48: HMBC spectrum of 7 in CDCl3, Figure S49: NOESY spectrum of 7 in CDCl3, Figure S50: HRESIMS spectrum of 8, Figure S51: 1H NMR spectrum of 8 in CDCl3 at 500 MHz, Figure S52: 13C NMR spectrum of 8 in CDCl3 at 125 MHz, Figure S53: HSQC spectrum of 8 in CDCl3, Figure S54: COSY spectrum of 8 in CDCl3, Figure S55: HMBC spectrum of 8 in CDCl3, Figure S56: NOESY spectrum of 8 in CDCl3, Figure S57: HRESIMS spectrum of 9, Figure S58: 1H NMR spectrum of 9 in CDCl3 at 500 MHz, Figure S59: 13C NMR spectrum of 9 in CDCl3 at 125 MHz, Figure S60: HSQC spectrum of 9 in CDCl3, Figure S61: COSY spectrum of 9 in CDCl3, Figure S62: HMBC spectrum of 9 in CDCl3, Figure S63: NOESY spectrum of 9 in CDCl3, Figure S64: HRESIMS spectrum of 10, Figure S65: 1H NMR spectrum of 10 in CDCl3 at 500 MHz, Figure S66: 13C NMR spectrum of 10 in CDCl3 at 125 MHz, Figure S67: HSQC spectrum of 10 in CDCl3, Figure S68: COSY spectrum of 10 in CDCl3, Figure S69: HMBC spectrum of 10 in CDCl3, Figure S70: NOESY spectrum of 10 in CDCl3, Figure S71: HRESIMS spectrum of 11, Figure S72: 1H NMR spectrum of 11 in CDCl3 at 500 MHz, Figure S73: 13C NMR spectrum of 11 in CDCl3 at 125 MHz, Figure S74: HSQC spectrum of 11 in CDCl3, Figure S75: COSY spectrum of 11 in CDCl3, Figure S76: HMBC spectrum of 11 in CDCl3, Figure S77: NOESY spectrum of 11 in CDCl3, Figure S78: HRESIMS spectrum of 12, Figure S79: 1H NMR spectrum of 12 in CDCl3 at 500 MHz, Figure S80: 13C NMR spectrum of 12 in CDCl3 at 125 MHz, Figure S81: HSQC spectrum of 12 in CDCl3, Figure S82: COSY spectrum of 12 in CDCl3, Figure S83: HMBC spectrum of 12 in CDCl3, Figure S84: NOESY spectrum of 12 in CDCl3, Figure S85: HRESIMS spectrum of 13, Figure S86: 1H NMR spectrum of 13 in CDCl3 at 400 MHz, Figure S87: 13C NMR spectrum of 13 in CDCl3 at 100 MHz, Figure S88: HSQC spectrum of 13 in CDCl3, Figure S89: COSY spectrum of 13 in CDCl3, Figure S90: HMBC spectrum of 13 in CDCl3, Figure S91: NOESY spectrum of 13 in CDCl3, Figure S92: HRESIMS spectrum of 14, Figure S93: 1H NMR spectrum of 14 in CDCl3 at 600 MHz, Figure S94: 13C NMR spectrum of 14 in CDCl3 at 150 MHz, Figure S95: HSQC spectrum of 14 in CDCl3, Figure S96: COSY spectrum of 14 in CDCl3, Figure S97: HMBC spectrum of 14 in CDCl3, Figure S98: NOESY spectrum of 14 in CDCl3, Figure S99: HRESIMS spectrum of 15, Figure S100: 1H NMR spectrum of 15 in CDCl3 at 500 MHz, Figure S101: 13C NMR spectrum of 15 in CDCl3 at 125 MHz, Figure S102: HSQC spectrum of 15 in CDCl3, Figure S103: COSY spectrum of 15 in CDCl3, Figure S104: HMBC spectrum of 15 in CDCl3, Figure S105: NOESY spectrum of 15 in CDCl3, Figure S106: HRESIMS spectrum of 16, Figure S107: 1H NMR spectrum of 16 in CDCl3 at 600 MHz, Figure S108: 13C NMR spectrum of 16 in CDCl3 at 150 MHz, Figure S109: HSQC spectrum of 16 in CDCl3, Figure S110: COSY spectrum of 16 in CDCl3, Figure S111: HMBC spectrum of 16 in CDCl3, Figure S112: NOESY spectrum of 16 in CDCl3, Figure S113: MMFF lowest energy conformers for 1, Figure S114: MMFF lowest energy conformers for 2, Table S1: 1H and 13C NMR spectroscopic data of compounds 17 and 18, Table S2: Energy analysis for MMFF conformational searching of compounds 1 and 2.
Author Contributions
J.-H.S. designed and guided the whole experiment. C.-C.L. and Y.-C.C. evaluated the anti-inflammatory activity. Y.-C.L. and C.-W.F. isolated the compounds and performed structure elucidation. J.-H.S. and Y.-C.L. carried out manuscript preparation. All authors have read and agreed to the published version of the manuscript.
Funding
This work was supported by grants from the Ministry of Science and Technology, Taiwan (MOST 107-2320-B-110-001-MY3 and 108-2320-B-110-003-MY2).
Institutional Review Board Statement
Not applicable.
Informed Consent Statement
Not applicable.
Data Availability Statement
Data is contained within the article and Supplementary Material.
Acknowledgments
The authors thank the assistance of the Instrumentation Center at National Sun Yat-sen University (MOST 110-2731-M-110-001) for measurement of NMR and MS data, and the technical assistance of Yu-Chi Lin on conformational searching.
Conflicts of Interest
The authors declare no conflict of interest.
References
- Parameswaran, N.; Patial, S. Tumor Necrosis Factor-α Signaling in Macrophages. Crit. Rev. Eukaryot. Gene Expr. 2010, 20, 87–103. [Google Scholar] [CrossRef]
- Tang, T.; Scambler, T.E.; Smallie, T.; Cunliffe, H.E.; Ross, E.A.; Rosner, D.R.; O’Neil, J.D.; Clark, A.R. Macrophage responses to lipopolysaccharide are modulated by a feedback loop involving prostaglandin E2, dual specificity phosphatase 1 and tristetraprolin. Sci. Rep. 2017, 7, 4350. [Google Scholar] [CrossRef]
- Ling-Chien, H.; Wang, W.-H.; Chen, S.-H.; Chang, Y.-W.; Hung, L.-C.; Chen, C.-Y.; Chen, Y.-H. Lipopolysaccharide-Induced Nitric Oxide, Prostaglandin E2, and Cytokine Production of Mouse and Human Macrophages Are Suppressed by Pheophytin-b. Int. J. Mol. Sci. 2017, 18, 2637. [Google Scholar] [CrossRef] [Green Version]
- Wei, W.-C.; Su, Y.-H.; Chen, S.-S.; Sheu, J.-H.; Yang, N.-S. GM-CSF plays a key role in zymosan-stimulated human dendritic cells for activation of Th1 and Th17 cells. Cytokine 2011, 55, 79–89. [Google Scholar] [CrossRef] [PubMed]
- Si, C.; Zhang, R.; Wu, T.; Lu, G.; Hu, Y.; Zhang, H.; Xu, F.; Wei, P.; Chen, K.; Tang, H.; et al. Dendritic cell-derived nitric oxide inhibits the differentiation of effector dendritic cells. Oncotarget 2016, 7, 74834–74845. [Google Scholar] [CrossRef] [Green Version]
- Lin, M.K.; Yu, Y.L.; Chen, K.C.; Chang, W.T.; Lee, M.S.; Yang, M.J.; Cheng, H.C.; Liu, C.H.; Chen, D.C.; Chu, C.L. Kaempferol from Semen cuscutae Attenuates the Immune Function of Dendritic Cells. Immunobiology 2011, 216, 1103–1109. [Google Scholar] [CrossRef] [PubMed]
- Lai, K.-H.; You, W.-J.; Lin, C.-C.; El-Shazly, M.; Liao, Z.-J.; Su, J.-H. Anti-Inflammatory Cembranoids from the Soft Coral Lobophytum crassum. Mar. Drugs 2017, 15, 327. [Google Scholar] [CrossRef] [Green Version]
- Ahmed, A.F.; Chen, Y.-W.; Huang, C.-Y.; Tseng, Y.-J.; Lin, C.-C.; Dai, C.-F.; Wu, Y.-C.; Sheu, J.-H. Isolation and Structure Elucidation of Cembranoids from a Dongsha Atoll Soft Coral Sarcophyton stellatum. Mar. Drugs 2018, 16, 210. [Google Scholar] [CrossRef] [PubMed] [Green Version]
- Huang, C.-Y.; Sung, P.-J.; Uvarani, C.; Su, J.-H.; Lu, M.-C.; Hwang, T.-L.; Dai, C.-F.; Wu, S.-L.; Sheu, J.-H. Glaucumolides A and B, Biscembranoids with New Structural Type from a Cultured Soft Coral Sarcophyton glaucum. Sci. Rep. 2015, 5, 15624. [Google Scholar] [CrossRef] [PubMed]
- Li, J.; Zhang, H.B.; Hung, W.L.; Qian, H.; Li, Y. TNF-α Inhibitors with Anti-Oxidative Stress Activity from Natural Products. Curr. Top. Med. Chem. 2012, 12, 1408–1421. [Google Scholar] [CrossRef]
- Azab, A.; Nassar, A.; Azab, A.N. Anti-Inflammatory Activity of Natural Products. Molecules 2016, 21, 1321. [Google Scholar] [CrossRef]
- Kiemer, A.K.; Hartung, T.; Huber, C.; Vollmar, A.M. Phyllanthus amarus has Anti-Inflammatory Potential by Inhibition of iNOS, COX-2, and Cytokines via the NF-kB Pathway. J. Hepatol. 2003, 38, 289–297. [Google Scholar] [CrossRef]
- Kim, D.H.; Li, H.; Han, Y.E.; Jeong, J.H.; Lee, H.J.; Ryu, J.-H. Modulation of Inducible Nitric Oxide Synthase Expression in LPS-Stimulated BV-2 Microglia by Prenylated Chalcones from Cullen corylifolium (L.) Medik. through Inhibition of I-κBα Degradation. Molecules 2018, 23, 109. [Google Scholar] [CrossRef] [Green Version]
- Chen, Y.C.; Yang, L.L.; Lee, T.J.F. Oroxylin A Inhibition of Lipopolysaccharide-Induced iNOS and COX-2 Gene Expression via Suppression of Nuclear Factor-kB Activation. Biochem. Pharmacol. 2000, 59, 1445–1457. [Google Scholar] [CrossRef]
- Elshamy, A.I.; Nassar, M.I.; Mohamed, T.A.; Hegazy, M.-E.F. Chemical and biological profile of Cespitularia species: A mini review. J. Adv. Res. 2016, 7, 209–224. [Google Scholar] [CrossRef] [PubMed] [Green Version]
- Shen, Y.-C.; Lo, K.-L.; Kuo, Y.-H.; Kuo, Y.-C.; Chen, C.-H.; Khalil, A.T. Cespihypotins Q−V, Verticillene Diterpenoids from Cespitularia hypotentaculata. J. Nat. Prod. 2008, 71, 1993–1997. [Google Scholar] [CrossRef]
- Duh, C.-Y.; El-Gamal, A.A.H.; Wang, S.-K.; Dai, C.-F. Novel Terpenoids from the Formosan Soft Coral Cespitularia hypotentaculata. J. Nat. Prod. 2002, 65, 1429–1433. [Google Scholar] [CrossRef]
- Duh, C.-Y.; Li, C.-H.; Wang, S.-K.; Dai, C.-F. Diterpenoids, Norditerpenoids, and Secosteroids from the Formosan Soft Coral Cespitularia hypotentaculata. J. Nat. Prod. 2006, 69, 1188–1192. [Google Scholar] [CrossRef] [PubMed]
- Lin, Y.-C.; Wang, S.-S.; Chen, C.-H.; Kuo, Y.-H.; Shen, Y.-C. Cespitulones A and B, Cytotoxic Diterpenoids of a New Structure Class from the Soft Coral Cespitularia taeniata. Mar. Drugs 2014, 12, 3477–3486. [Google Scholar] [CrossRef] [Green Version]
- Shen, Y.-C.; Ho, C.-J.; Kuo, Y.-H.; Lin, Y.-S. Cespitulactones A and B, new diterpenoids from Cespitularia taeniata. Bioorganic Med. Chem. Lett. 2006, 16, 2369–2372. [Google Scholar] [CrossRef] [PubMed]
- Shen, Y.-C.; Lin, Y.-S.; Kuo, Y.-H.; Cheng, Y.-B. Cespitulactams A, B, and C, three new nitrogen-containing diterpenes from Cespitularia taeniata May. Tetrahedron Lett. 2005, 46, 7893–7897. [Google Scholar] [CrossRef]
- Shen, Y.-C.; Cheng, Y.-B.; Kobayashi, J.; Kubota, T.; Takahashi, Y.; Mikami, Y.; Ito, J.; Lin, Y.-S. Nitrogen-Containing Verticillene Diterpenoids from the Taiwanese Soft Coral Cespitularia taeniata. J. Nat. Prod. 2007, 70, 1961–1965. [Google Scholar] [CrossRef] [PubMed]
- Roy, P.K.; Maarisit, W.; Roy, M.C.; Taira, J.; Ueda, K. Five New Diterpenoids from an Okinawan Soft Coral, Cespitularia sp. Mar. Drugs 2012, 10, 2741–2748. [Google Scholar] [CrossRef]
- Cheng, Y.-B.; Chen, C.-Y.; Kuo, Y.-H.; Shen, Y.-C. New Nitrogen-Containing Sesquiterpenoids from the Taiwanese Soft Coral Cespitularia taeniata May. Chem. Biodivers. 2009, 6, 1266–1272. [Google Scholar] [CrossRef]
- Roy, P.K.; Roy, M.C.; Taira, J.; Ueda, K. Structure and bioactivity of a trisnorditerpenoid and a diterpenoid from an Okinawan soft coral, Cespitularia sp. Tetrahedron Lett. 2014, 55, 1421–1423. [Google Scholar] [CrossRef]
- Cheng, S.-Y.; Lin, E.-H.; Wen, Z.-H.; Chiang, M.Y.-N.; Duh, C.-Y. Two New Verticillane-Type Diterpenoids from the Formosan Soft Coral Cespitularia hypotentaculata. Chem. Pharm. Bull. 2010, 58, 848–851. [Google Scholar] [CrossRef] [PubMed] [Green Version]
- Chang, J.-Y.; Fazary, A.; Lin, Y.-C.; Hwang, T.-L.; Shen, Y.-C. New Verticillane Diterpenoids from Cespitularia taeniata. Chem. Biodivers. 2012, 9, 654–661. [Google Scholar] [CrossRef]
- Shen, Y.-C.; Wu, Y.-R.; Lin, J.-J.; Lo, K.-L.; Kuo, Y.-C.; Khalil, A.T. Eight new diterpenoids from soft coral Cespitularia hypotentaculata. Tetrahedron 2007, 63, 10914–10920. [Google Scholar] [CrossRef]
- Shen, Y.-C.; Lin, J.-J.; Wu, Y.-R.; Chang, J.-Y.; Duh, C.-Y.; Lo, K.L. New norditerpenoids from Cespitularia hypotentaculata. Tetrahedron Lett. 2006, 47, 6651–6655. [Google Scholar] [CrossRef]
- Duan, J.-A.; Wang, L.; Qian, S.; Su, S.; Tang, Y. A new cytotoxic prenylated dihydrobenzofuran derivative and other chemical constituents from the rhizomes of Atractylodes lancea DC. Arch. Pharmacal Res. 2008, 31, 965–969. [Google Scholar] [CrossRef] [PubMed]
- Bohlmann, F.; Dutta, L.N.; Knauf, W.; Robinson, H.; King, R.M. Neue sesquiterpenlactone aus Aster umbellatus. Phytochemistry 1980, 19, 433–436. [Google Scholar] [CrossRef]
- Hoang, L.S.; Tran, M.H.; Lee, J.-S.; Ngo, Q.M.T.; Woo, M.H.; Min, B.S. Inflammatory Inhibitory Activity of Sesquiterpenoids from Atractylodes macrocephala Rhizomes. Chem. Pharm. Bull. 2016, 64, 507–511. [Google Scholar] [CrossRef] [Green Version]
- Li, Y.; Yang, X.-W. New eudesmane-type sesquiterpenoids from the processed rhizomes of Atractylodes macrocephala. J. Asian Nat. Prod. Res. 2014, 16, 123–128. [Google Scholar] [CrossRef] [PubMed]
- Chen, L.; Izumi, S.; Ito, D.I.; Iwaeda, T.; Utsumi, R.; Hirata, T. Secretion of Allelochemicals from the Cultured Suspension Cells of Marchantia polymorpha. Chem. Lett. 1996, 3, 205–206. [Google Scholar] [CrossRef]
- Halgren, T.A.; Nachbar, R.B. Merck molecular force field. IV. conformational energies and geometries for MMFF94. J. Comput. Chem. 1996, 17, 587–615. [Google Scholar] [CrossRef]
- Lainer, J.; Dawid, C.; Dunkel, A.; Gläser, P.; Wittl, S.; Hofmann, T. Characterization of Bitter-Tasting Oxylipins in Poppy Seeds (Papaver somniferum L.). J. Agric. Food Chem. 2020, 68, 10361–10373. [Google Scholar] [CrossRef] [PubMed]
- Chen, C.-T.; Munot, Y.S. Direct Atom-Efficient Esterification between Carboxylic Acids and Alcohols Catalyzed by Amphoteric, Water-Tolerant TiO(acac)2. J. Org. Chem. 2005, 70, 8625–8627. [Google Scholar] [CrossRef]
- Leuenberger, M.G.; Engeloch-Jarret, C.; Woggon, W.D. The Reaction Mechanism of the Enzyme-Catalyzed Cleavage of β-Carotene to Retinal. Angew. Chem. Int. Ed. 2001, 40, 2613–2617. [Google Scholar] [CrossRef]
- Jang, D.-I.; Lee, A.-H.; Shin, H.-Y.; Song, H.-R.; Park, J.-H.; Kang, T.-B.; Lee, S.-R.; Yang, S.-H. The Role of Tumor Necrosis Factor Alpha (TNF-α) in Autoimmune Disease and Current TNF-α Inhibitors in Therapeutics. Int. J. Mol. Sci. 2021, 22, 2719. [Google Scholar] [CrossRef] [PubMed]
- Kurach, Ł.; Kulczycka-Mamona, S.; Kowalczyk, J.; Skalicka-Woźniak, K.; Boguszewska-Czubara, A.; El Sayed, N.; Osmani, M.; Iwaniak, K.; Budzyńska, B. Mechanisms of the Procognitive Effects of Xanthotoxin and Umbelliferone on LPS-Induced Amnesia in Mice. Int. J. Mol. Sci. 2021, 22, 1779. [Google Scholar] [CrossRef]
- Król, M.; Kepinska, M. Human Nitric Oxide Synthase—Its Functions, Polymorphisms, and Inhibitors in the Context of Inflammation, Diabetes and Cardiovascular Diseases. Int. J. Mol. Sci. 2020, 22, 56. [Google Scholar] [CrossRef] [PubMed]
- Lin, C.-Y.; Kao, S.-H.; Hung, L.-C.; Chien, H.-J.; Wang, W.-H.; Chang, Y.-W.; Chen, Y.-H. Lipopolysaccharide-Induced Nitric Oxide and Prostaglandin E2 Production Is Inhibited by Tellimagrandin II in Mouse and Human Macrophages. Life 2021, 11, 411. [Google Scholar] [CrossRef] [PubMed]
- Needleman, P.; Manning, P. Interactions between the inducible cyclooxygenase (COX-2) and nitric oxide synthase (iNOS) pathways: Implications for therapeutic intervention in osteoarthritis. Osteoarthr. Cartil. 1999, 7, 367–370. [Google Scholar] [CrossRef] [PubMed] [Green Version]
- Zhao, Y.; Joshi-Barve, S.; Barve, S.; Chen, L.H. Eicosapentaenoic Acid Prevents LPS-Induced TNF-α Expression by Preventing NF-kB Activation. J. Am. Coll. Nutr. 2004, 23, 71–78. [Google Scholar] [CrossRef]
- Singh, V.K.; Mehrotra, S.; Narayan, P.; Pandey, C.M.; Agarwal, S.S. Modulation of Autoimmune Diseases by Nitric Oxide. Immunol. Res. 2000, 22, 1–19. [Google Scholar] [CrossRef]
- Sonar, S.A.; Lal, G. The iNOS Activity During an Immune Response Controls the CNS Pathology in Experimental Autoimmune Encephalomyelitis. Front. Immunol. 2019, 10, 710. [Google Scholar] [CrossRef] [PubMed] [Green Version]
- Chatzantoni, K.; Mouzaki, A. Anti-TNF-α Antibody Therapies in Autoimmune Diseases. Curr. Top. Med. Chem. 2006, 6, 1707–1714. [Google Scholar] [CrossRef] [PubMed]
- Ferrer, M.D.; Busquets-Cortés, C.; Capó, X.; Tejada, S.; Tur, J.A.; Pons, A.; Sureda, A. Cyclooxygenase-2 Inhibitors as a Therapeutic Target in Inflammatory Diseases. Curr. Med. Chem. 2019, 26, 3225–3241. [Google Scholar] [CrossRef] [PubMed]
- Kröncke, K.D.; Fehsel, K.; Kolb-Bachofen, V. Inducible nitric oxide synthase in human diseases. Clin. Exp. Immunol. 1998, 113, 147–156. [Google Scholar] [CrossRef]
- Minghetti, L. Cyclooxygenase-2 (COX-2) in Inflammatory and Degenerative Brain Diseases. J. Neuropathol. Exp. Neurol. 2004, 63, 901–910. [Google Scholar] [CrossRef] [PubMed] [Green Version]
- Hori, M.; Kita, M.; Torihashi, S.; Miyamoto, S.; Won, K.-J.; Sato, K.; Ozaki, H.; Karaki, H. Upregulation of iNOS by COX-2 in muscularis resident macrophage of rat intestine stimulated with LPS. Am. J. Physiol. Gastrointest. Liver Physiol. 2001, 280, G930–G938. [Google Scholar] [CrossRef] [PubMed]
- Johnston, B.L.; Conly, J.M. Tumour Necrosis Factor Inhibitors and Infection: What is there to Know for Infectious Diseases Physicians? Can. J. Infect. Dis. Med. Microbiol. 2006, 17, 209–212. [Google Scholar] [CrossRef] [PubMed] [Green Version]
- Smallwood, M.J.; Nissim, A.; Knight, A.R.; Whiteman, M.; Haigh, R.; Winyard, P.G. Oxidative stress in autoimmune rheumatic diseases. Free. Radic. Biol. Med. 2018, 125, 3–14. [Google Scholar] [CrossRef]
- Liou, C.-J.; Lai, Y.-R.; Chen, Y.-L.; Chang, Y.-H.; Li, Z.-Y.; Huang, W.-C. Matrine Attenuates COX-2 and ICAM-1 Expressions in Human Lung Epithelial Cells and Prevents Acute Lung Injury in LPS-Induced Mice. Mediat. Inflamm. 2016, 2016, 3630485. [Google Scholar] [CrossRef] [PubMed] [Green Version]
- Wang, Y.-F.; Su, X.-H.; Li, L.-G.; Wang, W.; Zhang, M.-L.; Huo, C.-H.; Shi, Q.-W. Verticillane Derivatives from Natural Sources. Chem. Biodivers. 2009, 6, 1661–1673. [Google Scholar] [CrossRef]
Figure 1.
Structures of new compounds 1–16.

Figure 2.
Structures of known compounds 17–28.

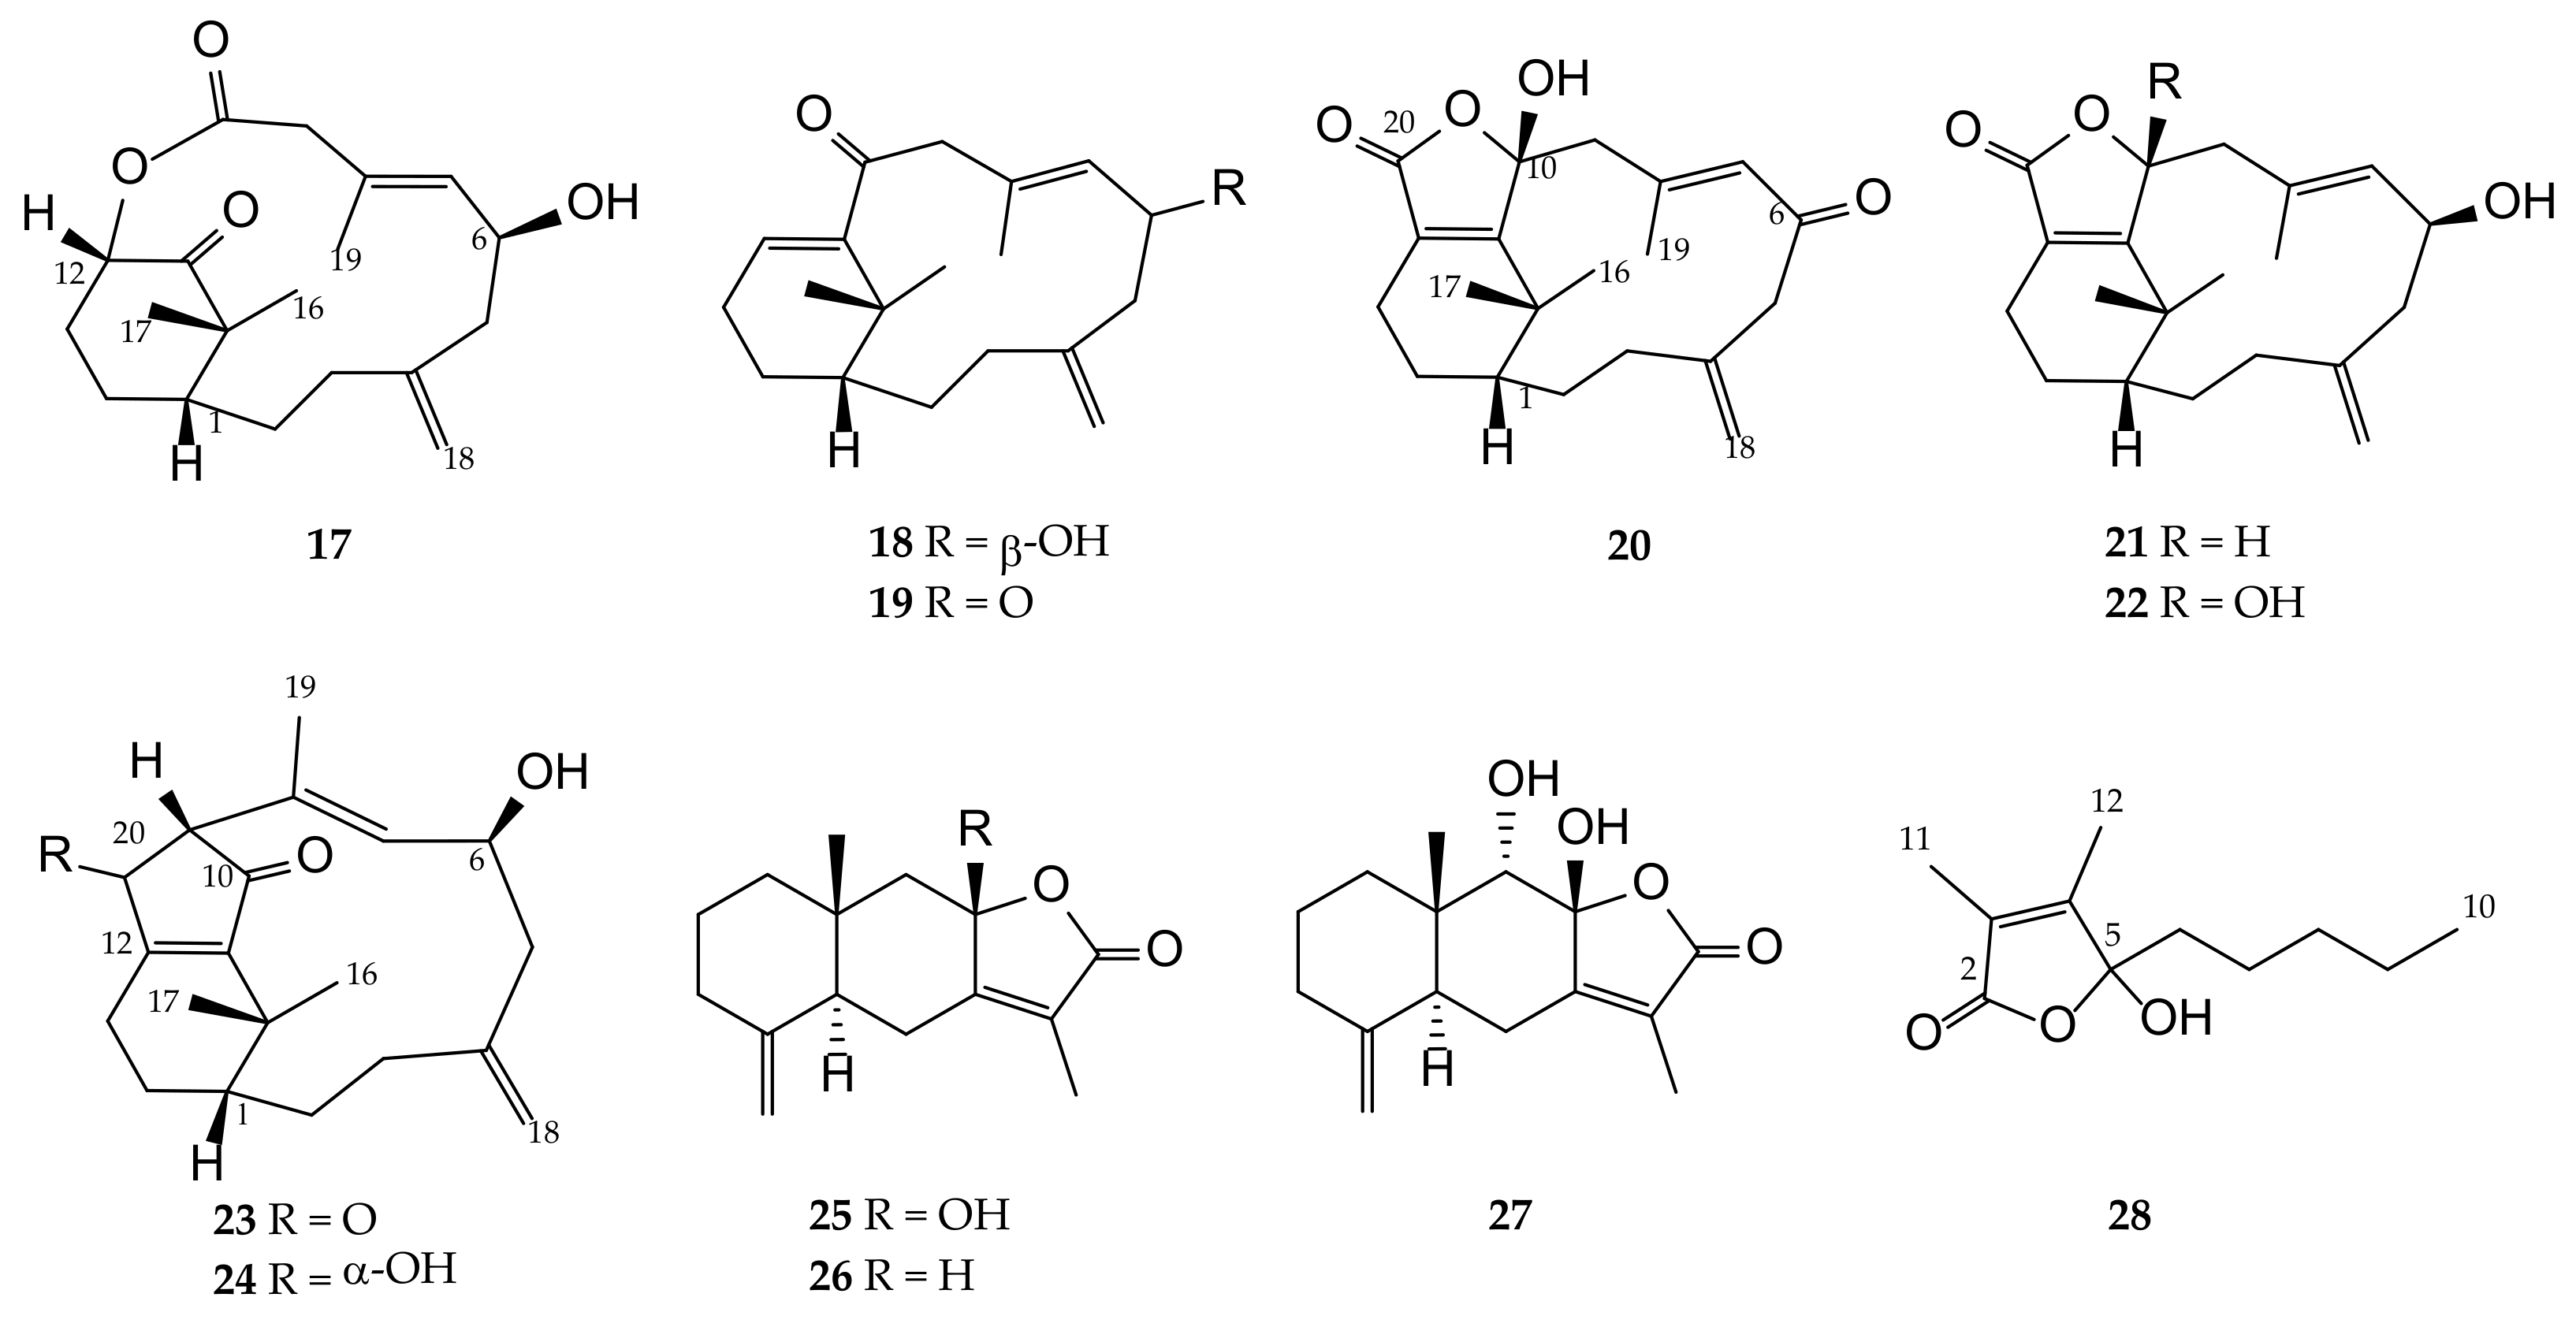
Figure 3.
Selected COSY and HMBC correlations of 1–7.

Figure 4.
Selected NOE correlations of compounds 1, 2, 5, and 6.

Figure 5.
Selected COSY and HMBC correlations of 8–16.

Figure 6.
Selected NOE correlations of compound 8.

Figure 7.
The distance H3-16/H-9, H3-17/H-9, and H3-17/H-20 of the relative configuration of C-10 and C-11 in compound 5.
Figure 7.
The distance H3-16/H-9, H3-17/H-9, and H3-17/H-20 of the relative configuration of C-10 and C-11 in compound 5.

Figure 8.
The distance H3-16/H-9, H3-17/H-9, and H3-17/H-20 of the relative configuration of C-10 and C-11 in isomeric compound 5.
Figure 8.
The distance H3-16/H-9, H3-17/H-9, and H3-17/H-20 of the relative configuration of C-10 and C-11 in isomeric compound 5.

Figure 9.
Selected NOE correlations of compounds 9 and 10.

Figure 10.
Selected NOE correlations of compounds 11 and 12.

Figure 11.
Selected NOE correlations of compounds 13–16.

Figure 12.
The inhibitory effect of 1–28 on LPS-induced iNOS mRNA expression in dendritic cells by the RT-PCR analysis. The values are mean SEM (n = 3); * p < 0.05, ** p < 0.01, *** p < 0.001, **** p < 0.0001 compared with the LPS alone stimulated group. The relative intensity of the LPS alone stimulated group was taken as 100%. The bar chart shows the results of the EtOAc extract of soft coral Cespitularia sp. (S9-EA) at 100 μg/mL and compounds 1–28 (25–100 μM) toward iNOS mRNA expression.

Figure 13.
The inhibitory effect of 1–28 on LPS-induced COX-2 mRNA expression in dendritic cells by the RT-PCR analysis. The values are mean SEM (n = 3); * p < 0.05, ** p < 0.01, *** p < 0.001, **** p < 0.0001 compared with the LPS alone stimulated group. The relative intensity of the LPS alone stimulated group was taken as 100%. The bar chart shows the results of the EtOAc extract of soft coral Cespitularia sp. (S9-EA) at 100 μg/mL and compounds 1–28 (25–100 μM) toward COX-2 mRNA expression.


Table 1.
13C NMR spectroscopic data of compounds 1–6.
| No. | 1 1 | 2 2 | 3 3 | 4 3 | 5 3 | 6 3 |
|---|---|---|---|---|---|---|
| 1 | 44.1, CH 4 | 44.0, CH | 44.1, CH | 44.1, CH | 44.2, CH | 44.2, CH |
| 2 | 34.4, CH2 | 33.8, CH2 | 33.8, CH2 | 33.8, CH2 | 34.0, CH2 | 33.6, CH2 |
| 3 | 38.7, CH2 | 37.7, CH2 | 37.7, CH2 | 37.7, CH2 | 37.8, CH2 | 37.8, CH2 |
| 4 | 144.1, C | 145.7, C | 145.7, C | 145.7, C | 145.8, C | 145.7, C |
| 5 | 55.2, CH2 | 45.8, CH2 | 45.8, CH2 | 47.5, CH2 | 45.9, CH2 | 45.6, CH2 |
| 6 | 197.7, C | 69.2, CH | 69.2, CH | 69.2, CH | 69.3, CH | 69.1, CH |
| 7 | 129.4, CH | 133.5, CH | 133.5, CH | 133.5, CH | 133.3, CH | 133.2, CH |
| 8 | 148.5, C | 132.4, C | 132.0, C | 132.4, C | 132.8, C | 132.8, C |
| 9 | 41.0, CH2 | 40.7, CH2 | 40.7, CH2 | 40.7, CH2 | 41.0, CH2 | 41.0, CH2 |
| 10 | 94.6, C | 94.7, C | 94.7, C | 94.6, C | 94.3, C | 94.4, C |
| 11 | 72.8, C | 72.4, C | 72.4, C | 72.4, C | 72.8, C | 72.9, C |
| 12 | 80.0, C | 79.8, C | 79.7, C | 79.7, C | 78.3, C | 79.9, C |
| 13 | 26.8, CH2 | 26.2, CH2 | 26.2, CH2 | 26.2, CH2 | 31.6, CH2 | 25.2, CH2 |
| 14 | 23.8, CH2 | 25.4, CH2 | 25.4, CH2 | 25.4, CH2 | 26.2, CH2 | 25.5, CH2 |
| 15 | 38.1, C | 37.6, C | 37.6, C | 37.6, C | 37.6, C | 37.7, C |
| 16 | 24.9, CH3 | 25.1, CH3 | 25.2, CH3 | 25.2, CH3 | 25.1, CH3 | 25.3, CH3 |
| 17 | 26.8, CH3 | 26.4, CH3 | 26.4, CH3 | 26.4, CH3 | 26.0, CH3 | 26.4, CH3 |
| 18 | 116.5, CH2 | 115.8, CH2 | 115.8, CH2 | 115.8, CH2 | 115.7, CH2 | 115.7, CH2 |
| 19 | 19.2, CH3 | 17.2, CH3 | 17.4, CH3 | 17.2, CH3 | 17.4, CH3 | 17.4, CH3 |
| 20 | 101.8, CH | 101.3, CH | 100.8, CH | 100.8, CH | 104.6, CH | 109.1, CH |
| 21 | 164.9, C | 164.8, C | 56.6, CH3 | 57.5, CH3 | ||
| 22 | 127.6, CH | 127.3, CH | ||||
| 23 | 132.6, CH2 | 132.7, CH2 | ||||
| 1′ | 172.8, C | 172.8, C | ||||
| 2′ | 34.1, CH2 | 34.1, CH2 | ||||
| 3′ | 24.7, CH2 | 24.7, CH2 | ||||
| 4′-13′ | 29.7 × 2, 29.6 × 3, 29.4 × 3, 29.2, 29.0, each CH2 | |||||
| 4′-7′/12′-15′ | 29.8, 29.7, 29.5, 29.3 × 2, 29.2 × 2, 29.0, each CH2 | |||||
| 8′/11′ | 27.2/27.1, each CH2 | |||||
| 9′-10′ | 130.1/129.7, each CH | |||||
| 14′ | 31.9, CH2 | |||||
| 15′ | 22.7, CH2 | |||||
| 16′ | 14.1, CH3 | 31.9, CH2 | ||||
| 17′ | 22.7, CH2 | |||||
| 18′ | 14.1, CH3 |
1 Spectrum recorded at 500 MHz in benzene-d6. 2 Spectrum recorded at 400 MHz in CDCl3. 3 Spectrum recorded at 500 MHz in CDCl3. 4 Multiplicities deduced by the HSQC experiment.
Table 2.
1H NMR spectroscopic data of compounds 1–5.
| No. | 1 1 | 2 2 | 3 3 | 4 3 | 5 3 |
|---|---|---|---|---|---|
| 1 | 1.19, m | 1.48, m | 1.49, m | 1.49, m | 1.46, m |
| 2 | 1.66, m | 1.82, m | 1.81, m | 1.81, m | 1.84, m |
| 1.38, m | 1.11, td (14.0, 5.0) | 1.11, td (14.5, 5.0) | 1.11, td (14.0, 5.5) | 1.09, td (14.5, 4.5) | |
| 3 | 1.94, td (13.0, 4.0) 4 | 2.22, m | 2.22 m | 2.22, m | 2.20, td (14.0, 4.5) |
| 1.82, td (13.0, 4.0) | 2.08, td (14.0, 3.2) | 2.08, td (14.0, 4.0) | 2.08, m | 2.08, dd (14.0, 4.5) | |
| 5 | 2.94, d (11.0) | 2.65, dd (12.5, 3.2) | 2.66, dd (13.0, 3.0) | 2.66, dd (12.5, 2.5) | 2.65, dd (13.0, 3.0) |
| 2.85, d (11.0) | 2.24, m | 2.25, m | 2.25, m | 2.22, m | |
| 6 | 4.49, t (8.0) | 4.50, quint (3.0) | 4.50, m | 4.50, br t (8.5) | |
| 7 | 6.13, s | 5.47, d (8.0) | 5.47, d (8.5) | 5.47, d (8.0) | 5.46, d (8.0) |
| 9 | 3.00, d (16.0) | 3.10, d (14.4) | 3.09, d (14.5) | 3.09, d (14.0) | 3.03, d (14.5) |
| 2.21, d (16.0) | 2.55, d (14.4) | 2.54, d (14.5) | 2.54, d (14.0) | 2.52, d (14.5) | |
| 13 | 1.57, td (14.0, 3.5) | 1.71, td (14.0, 3.6) | 1.67, m | 1.66, m | 1.70, br d (14.0) |
| 1.46, m | 1.58, m | 1.50, m | 1.50, m | 1.58, m | |
| 14 | 2.16, m | 2.28, m | 2.28, m | 2.27, m | 2.31, tt (17.5, 3.5) |
| 1.11, ddd (14.0, 6.0, 3.5) | 1.37, m | 1.37, m | 1.37, m | 1.33, m | |
| 16 | 0.72, 3H, s | 0.94, 3H, s | 0.98, 3H, s | 0.98, 3H, s | 0.95, 3H, s |
| 17 | 1.35, 3H, s | 1.34, 3H, s | 1.33, 3H, s | 1.33, 3H, s | 1.31, 3H, s |
| 18 | 5.09, 4.77, both s | 4.93, 2H, s | 4.94, 2H, s | 4.94, 2H, s | 4.93, 2H, s |
| 19 | 2.11, 3H, s | 1.81, 3H, s | 1.81, 3H, s | 1.81, 3H, s | 1.83, 3H, s |
| 20 | 5.96, s | 5.70, s | 5.63, s | 5.63, s | 4.36, s |
| 21 | 3.47, 3H, s | ||||
| 22 | 5.77, dd (17.5, 10.5) | 6.14, dd (17.2, 10.4) | |||
| 23 | 6.15, br d (17.5) | 6.47, d (17.2) | |||
| 5.16, dd (10.5, 1.0) | 5.94, d (10.4) | ||||
| 2′ | 2.36, t (7.5) | 2.36, t (7.5) | |||
| 3′ | 1.62, 2H, m | 1.63, 2H, m | |||
| 4′-15′ | 1.20–1.31, 20H, m | ||||
| 4′-7′/12′-17′ | 1.25–1.34, 20H, m | ||||
| 8′/11′ | 2.01, H, m | ||||
| 9′/10′ | 5.34, dd (10.5, 6.5) | ||||
| 16′ | 0.88, 3H, t (7.0) | ||||
| 18′ | 0.88, 3H, t (7.0) | ||||
| 12-OH | 2.25, br s | 2.64, br s | 2.52, br s | 2.53, br s | 3.29, br s |
1 Spectrum recorded at 500 MHz in benzene-d6. 2 Spectrum recorded at 400 MHz in CDCl3. 3 Spectrum recorded at 500 MHz in CDCl3. 4 J values are in Hz.
Table 3.
1H NMR spectroscopic data of compounds 6–9, 11, and 12.
| No. | 6 1 | 7 1 | 8 1 | 9 1 | 11 1 | 12 1 |
|---|---|---|---|---|---|---|
| 1 | 1.45, m | 1.46, m | 1.49, m | 1.54, m | 1.81, m | 2.15, m |
| 2 | 1.79, m | 1.79, m | 1.84, m | 1.55, m | 1.92, m | 2.46, m |
| 1.11, td (14.0, 5.0) 2 | 1.11, m | 1.11, td (14.0, 5.0) | 1.36, m | 1.52, m | 1.73, m | |
| 3 | 2.20, m | 2.23, m | 2.22, m | 2.27, m | 2.59, dd | 1.94, m |
| (15.0, 11.0) | ||||||
| 2.09, m | 2.01, m | 2.08, m | 2.13, m | 1.86, m | 1.56, m | |
| 5 | 2.64, dd | 2.60, dd | 2.65, dd | 2.44, dd | 2.48, dd | 2.43, m |
| (13.0, 3.0) | (13.0, 3.5) | (13.0, 3.0) | (13.5, 2.5) | (13.0, 7.0) | ||
| 2.23, m | 2.30, d (13.0) | 2.24, m | 2.33, m | 2.28, dd (13.0, 2.5) | 2.34, dd (13.5, 3.0) | |
| 6 | 4.51, m | 5.49, td (9.0, 3.5) | 4.50, br t (8.0) | 4.38, m | 4.49, m | 4.44, m |
| 7 | 5.46, d (8.0) | 5.41, d (9.0) | 5.48, d (9.0) | 5.55, d (8.0) | 5.15, d (6.5) | 5.28, d (7.0) |
| 9 | 3.03, d (14.5) | 3.04, d (14.5) | 3.05, d (14.5) | 3.00, d (14.5) | 3.43, d (15.0) | 3.43, d (15.5) |
| 2.54, d (14.5) | 2.55, d (14.5) | 2.54, d (14.5) | 2.66, d (14.5) | 3.08, d (15.0) | 3.24, d (15.5) | |
| 12 | 6.10, d (3.5) | 6.07, s | ||||
| 13 | 1.67, m | 1.76, m | 1.81, m | 2.34, m | 4.50, m | |
| 1.56, m | 1.63, m | 1.62, m | 2.18, m | |||
| 14 | 2.21, m | 2.25, m | 2.30, tt | 2.19, m | 2.13, 2H, m | 3.02, dd |
| (14.5, 4.0) | (18.5, 7.0) | |||||
| 1.35, m | 1.33, m | 1.40, m | 1.63, m | 2.45, m | ||
| 16 | 0.98, 3H, s | 1.00, 3H, s | 0.98, 3H, s | 1.47, 3H, s | 1.09, 3H, s | 1.23, 3H, s |
| 17 | 1.31, 3H, s | 1.33, 3H, s | 1.33, 3H, s | 1.24, 3H, s | 1.40, 3H, s | 1.51, 3H, s |
| 18 | 4.92, 2H, s | 4.96, 4.92, both s | 4.94, 2H, s | 4.84, 2H, s | 4.87, 4.83, both s | 4.84, 4.78, both s |
| 19 | 1.84, 3H, s | 1.88, 3H, s | 1.83, 3H, s | 1.58, 3H, s | 1.76, 3H, s | 1.78, 3H, s |
| 20 | 4.47, s | 3.59, 3.43, both d (9.0) | 5.76, s | |||
| 21 | 3.46, 3H, s | 3.13, 3H, s | ||||
| 22 | 2.02, 3H, s | 2.14, 3H, s | ||||
| 12-OH | 2.63, br s | 1.96, br d (2.0) | 2.68, br s | |||
| N-H | 5.46, br s |
1 Spectrum recorded at 500 MHz in CDCl3. 2 J values are in Hz.
Table 4.
13C NMR spectroscopic data of compounds 7–9, 11, and 12.
| No. | 7 1 | 8 1 | 9 1 | 11 1 | 12 1 |
|---|---|---|---|---|---|
| 1 | 44.3, CH 2 | 44.1, CH | 44.8, CH | 45.8, CH | 45.4, CH |
| 2 | 34.2, CH2 | 33.7, CH2 | 32.4, CH2 | 29.5, CH2 | 30.7, CH2 |
| 3 | 37.8, CH2 | 37.7, CH2 | 34.4, CH2 | 31.0, CH2 | 30.6, CH2 |
| 4 | 145.3, C | 145.5, C | 146.1, C | 146.0, C | 145.4, C |
| 5 | 43.4, CH2 | 45.8, CH2 | 43.9, CH2 | 44.8, CH2 | 44.2, CH2 |
| 6 | 72.2, CH | 69.2, CH | 68.3, CH | 69.0, CH | 69.5, CH |
| 7 | 128.7, CH | 133.7, CH | 135.7, CH | 133.6, CH | 135.3, CH |
| 8 | 134.5, C | 132.5, C | 131.3, C | 130.0, C | 129.1, C |
| 9 | 41.3, CH2 | 40.6, CH2 | 48.5, CH2 | 51.9, CH2 | 52.4, CH2 |
| 10 | 95.9, C | 95.1, C | 93.9, C | 202.6, C | 202.2, C |
| 11 | 74.0, C | 73.0, C | 160.1, C | 150.3, C | 166.0, C |
| 12 | 78.7, C | 78.5, C | 133.8, CH | 134.6, CH | 128.6, CH |
| 13 | 31.1, CH2 | 30.6, CH2 | 17.5, CH2 | 65.9, CH | 199.0, C |
| 14 | 26.2, CH2 | 26.0, CH2 | 24.8, CH2 | 34.9, CH2 | 40.0, CH2 |
| 15 | 37.5, C | 37.4, C | 37.7, C | 35.8, C | 37.0, C |
| 16 | 25.2, CH3 | 25.0, CH3 | 24.8, CH3 | 23.8, CH3 | 23.6, CH3 |
| 17 | 26.3, CH3 | 26.0, CH3 | 34.1, CH3 | 33.4, CH3 | 32.3, CH3 |
| 18 | 115.8, CH2 | 115.9, CH2 | 114.8, CH2 | 112.6, CH2 | 113.4, CH2 |
| 19 | 17.5, CH3 | 17.4, CH3 | 17.6, CH3 | 18.8, CH3 | 18.9, CH3 |
| 20 | 75.5, CH2 | 96.1, CH | 171.6, C | ||
| 21 | 170.2, C | 169.7, C | 50.4, CH3 | ||
| 22 | 21.3, CH3 | 21.2, CH3 |
1 Spectrum recorded at 500 MHz in CDCl3. 2 Multiplicities deduced by the HSQC experiment.
Table 5.
1H and 13C NMR spectroscopic data of compound 10.
| No. | 10 | |
|---|---|---|
| 1H 1 | 13C 2 | |
| 1 | 48.4, C | |
| 2 | 214.6, C | |
| 3 | 4.45, m | 71.4, CH 4 |
| 4 | 2.31, m | 31.6, CH2 |
| 1.58, m | ||
| 5 | 2.13, m | 21.0, CH2 |
| 1.68, m | ||
| 6 | 1.79, m | 46.9, CH |
| 7 | 1.64, m | 25.7, CH2 |
| 1.13, m | ||
| 8 | 2.11, m | 33.8, CH2 |
| 1.92, m | ||
| 9 | 147.1, C | |
| 10 | 2.20, 2H, m | 43.9, CH2 |
| 11 | 4.47, m | 66.1, CH |
| 12 | 5.32, br d (8.5) 3 | 131.7, CH |
| 13 | 122.2, C | |
| 14 | 3.02, 2H, br s | 44.6, CH2 |
| 15 | 171.4, C | |
| 16 | 1.11, 3H, s | 21.8, CH3 |
| 17 | 1.32, 3H, s | 27.0, CH3 |
| 18 | 4.87, 2H, s | 113.2, CH2 |
| 19 | 1.77, 3H, s | 16.9, CH3 |
| 20 | 3.69, 3H, s | 51.8, CH3 |
1 Spectrum recorded at 500 MHz in CDCl3. 2 Spectrum recorded at 125 MHz in CDCl3. 3 J values are in Hz. 4 Multiplicities deduced by the HSQC experiment.
Table 6.
13C NMR spectroscopic data of compounds 13–16.
| No. | 13 1 | 14 2 | 15 3 | 16 2 |
|---|---|---|---|---|
| 1 | 34.7, CH 4 | 33.6, CH | 162.7, C | 35.2, CH2 |
| 2 | 29.1, CH2 | 28.8, CH2 | 128.6, CH | 29.0, CH2 |
| 3 | 22.7, CH2 | 22.5, CH2 | 197.7, C | 72.7, CH |
| 4 | 51.1, CH | 50.9, CH | 57.1, CH | 149.8, C |
| 5 | 125.8, CH | 125.4, CH | 31.7, CH2 | 45.6, CH |
| 6 | 71.2, CH | 70.8, CH | 25.1, CH | 24.0, CH2 |
| 7 | 31.1, CH2 | 31.4, CH2 | 29.1, CH2 | 159.4, C |
| 8 | 23.2, CH2 | 22.3, CH2 | 29.8, CH2 | 103.1, C |
| 9 | 36.6, CH | 37.5, CH | 84.0, C | 51.0, CH2 |
| 10 | 147.0, C | 146.1, C | 36.8, CH | 36.6, C |
| 11 | 26.6, CH | 26.8, CH | 140.5, C | 123.8, C |
| 12 | 21.2, CH3 | 21.3, CH3 | 18.3, CH3 | 174.7, C |
| 13 | 21.7, CH3 | 21.6, CH3 | 117.1, CH2 | 8.34, CH3 |
| 14 | 14.4, CH3 | 14.4, CH3 | 18.0, CH3 | 15.9, CH3 |
| 15 | 68.9, CH2 | 69.9, CH2 | 22.1, CH3 | 110.1, CH2 |
1 Spectrum recorded at 400 MHz in CDCl3. 2 Spectrum recorded at 600 MHz in CDCl3. 3 Spectrum recorded at 500 MHz in CDCl3 4 Multiplicities deduced by the HSQC experiment.
Table 7.
1H NMR spectroscopic data of compounds 13–16.
| No. | 13 1 | 14 2 | 15 3 | 16 2 |
|---|---|---|---|---|
| 1 | 1.96, m | 1.97, m | 1.71 td (13.8, 4.2) | |
| 1.38, m | ||||
| 2 | 1.82, m | 1.82, m | 5.95, d (1.0) | 1.87 dt (14.4, 3.6) |
| 1.31, br t (10.8) 4 | 1.35, dd (10.8, 4.8) | 1.78 dtd (14.4, 4.2, 2.4) | ||
| 3 | 1.70, m | 1.70, m | 4.37, br s | |
| 1.66, m | 1.65, m | |||
| 4 | 1.63, m | 1.64, m | 3.26, d (13.5) | |
| 5 | 5.45, s | 5.50, s | 1.46, m | 2.45, br s |
| 6 | 1.61, m | 2.60, d (10.2) | ||
| 2.44, d (10.2) | ||||
| 7 | 1.83, m | 1.67, m | 1.54, m | |
| 1.46, d (9.2) | 1.46, dd (3.6, 1.8) | 1.22, m | ||
| 8 | 1.80, m | 1.64, m | 1.91, br d (14.5) | |
| 1.46, d (9.2) | 1.50, m | 1.71, td (14.5, 5.0) | ||
| 9 | 2.31, br d (4.4) | 2.24, td (13.2, 4.8) | 2.26, d (13.8) | |
| 1.65, d (13.8) | ||||
| 10 | 2.90, br d (13.5) | |||
| 11 | 1.84, m | 1.81, m | ||
| 12 | 0.92, 3H, d (6.8) | 0.92, 3H, d (6.6) | 1.66, 3H, s | |
| 13 | 0.78, 3H, d (6.8) | 0.70, 3H, d (6.6) | 5.08, 4.87, both s | 1.84, 3H, s |
| 14 | 0.84, 3H, d (6.8) | 0.90, 3H, d (6.6) | 2.05, 3H, s | 1.03, 3H, s |
| 15 | 3.49, 2H, qd (10.8, 4.8) | 3.49, d (10.8) | 0.90, d (6.5) | 5.11, s |
| 3.43, d (10.8) | 4.77, s | |||
| 9-OOH | 7.42, br s |
1 Spectrum recorded at 400 MHz in CDCl3. 2 Spectrum recorded at 600 MHz in CDCl3. 3 Spectrum recorded at 500 MHz in CDCl3. 4 J values are in Hz.
Table 8.
Inhibitory effects of compounds 1–28 on TNF-α expression and NO production in LPS-induced dendritic cells.
Table 8.
Inhibitory effects of compounds 1–28 on TNF-α expression and NO production in LPS-induced dendritic cells.
| No. | TNF-α Expression | NO Production | ||
|---|---|---|---|---|
| Inh % 1 | Inh % | |||
| S9-EA2 | 84.1 ± 4.2 | **** | 76.1 ± 1.4 | **** |
| 1 | 95.0 ± 0.2 | **** | 39.8 ± 0.6 | **** |
| 2 | 95.7 ± 0.4 | **** | 63.3 ± 1.6 | **** |
| 3 | 95.8 ± 0.1 | **** | 44.0 ± 0.9 | **** |
| 4 | 32.6 ± 11.6 | * | 51.1 ± 0.1 | **** |
| 5 | 39.5 ± 7.8 | ** | 56.8 ± 0.2 | **** |
| 6 | 29.8 ± 6.7 | 43.3 ± 2.0 | **** | |
| 7 | 48.4 ± 10.9 | *** | 48.6 ± 1.5 | **** |
| 8 | 29.7 ± 17.9 | 55.6 ± 1.4 | **** | |
| 9 | 46.6 ± 2.6 | *** | 50.7 ± 0.6 | **** |
| 10 | 44.1 ± 7.1 | ** | 46.7 ± 0.6 | **** |
| 11 | 34.3 ± 1.7 | * | 50.8 ± 0.6 | **** |
| 12 | 44.4 ± 2.7 | ** | 61.1 ± 0.5 | **** |
| 13 | 48.3 ± 12.6 | *** | 44.5 ± 0.1 | **** |
| 14 | 33.3 ± 4.8 | * | 55.6 ± 1.3 | **** |
| 15 | 19.5 ± 2.9 | 49.6 ± 0.4 | **** | |
| 16 | 42.2 ± 4.1 | ** | 41.9 ± 1.5 | **** |
| 17 | 36.1 ± 0.6 | **** | 58.6 ± 0.9 | **** |
| 18 | 52.3 ± 6.1 | **** | 58.5 ± 1.1 | **** |
| 19 | 46.3 ± 4.4 | **** | 63.7 ± 0.8 | **** |
| 20 | 42.7 ± 5.1 | **** | 56.3 ± 0.6 | **** |
| 21 | 41.9 ± 3.2 | **** | 61.7 ± 1.0 | **** |
| 22 | 4.9 ± 7.7 | 38.2 ± 1.1 | **** | |
| 23 | 5.3 ± 8.8 | 59.3 ± 9.4 | **** | |
| 24 | −0.6 ± 2.0 | 30.4 ± 2.9 | **** | |
| 25 | −4.7 ± 0.9 | 29.6 ± 8.9 | **** | |
| 26 | 3.8 ± 6.2 | 9.5 ± 4.3 | **** | |
| 27 | 5.8 ± 3.5 | 15.3 ± 2.5 | ||
| 28 | −3.5 ± 7.4 | 6.3 ± 6.0 | ||
| DEX 3 | 85.6 ± 3.4 | **** | 73.4 ± 1.3 | **** |
1 Percentage of inhibition (Inh %) at a concentration 100 μM for 1–28 and 100 μg/mL for S9-EA compared with the control group (100 % for stimulated LPS alone). Results are presented as mean ± SEM. (n = 3–4). * p < 0.05, ** p < 0.01, *** p < 0.001, **** p < 0.0001. 2 S9 EA: the EtOAc extract of soft coral Cespitularia sp. 3 Positive control: dexamethasone (DEX) at 100 μM.
Table 9.
Inhibitory effects of compounds 1–28 on iNOS and COX-2 mRNA expression in LPS-induced dendritic cells.
Table 9.
Inhibitory effects of compounds 1–28 on iNOS and COX-2 mRNA expression in LPS-induced dendritic cells.
| No. | iNOS mRNA | COX-2 mRNA | ||
|---|---|---|---|---|
| Exp % 1 | Exp % | |||
| S9-EA2 | 15.9 ± 0.4 | ** | 28.6 ± 4.1 | ** |
| 1 | 3.6 ± 1.8 | *** | 4.2 ± 0.1 | **** |
| 2 | 0.3 ± 0.1 | *** | 2.9 ± 0.6 | **** |
| 3 | 64.6 ± 1.8 | 25.6 ± 12.7 | ** | |
| 4 | 67.4 ± 11.6 | 21.8 ± 1.1 | ** | |
| 5 | 71.0 ± 10.2 | 43.1 ± 25.8 | ||
| 6 | 281.2 ± 15.4 | **** | 65.4 ± 3.1 | |
| 7 | 115.9 ± 14.3 | 46.7 ± 4.4 | ||
| 8 | 29.0 ± 1.7 | ** | 15.5 ± 2.4 | *** |
| 9 | 35.2 ± 10.1 | * | 47.9 ± 1.8 | |
| 10 | 70.0 ± 1.8 | 36.9 ± 14.7 | * | |
| 11 | 36.0 ± 5.8 | * | 19.6 ± 4.1 | ** |
| 12 | 20.5 ± 3.4 | ** | 11.2 ± 1.7 | *** |
| 13 | 7.4 ± 2.9 | *** | 4.4 ± 3.5 | *** |
| 14 | 1.5 ± 0.8 | *** | 43.4 ± 26.2 | |
| 15 | 4.6 ± 2.9 | *** | 110.5 ± 29.7 | |
| 16 | 18.4 ± 4.4 | ** | 196.9 ± 55.1 | **** |
| 17 | 22.0 ± 3.8 | ** | 11.9 ± 3.7 | *** |
| 18 | 19.7 ± 11.3 | ** | 4.5 ± 0.5 | *** |
| 19 | 17.7 ± 1.3 | ** | 27.6 ± 1.9 | ** |
| 20 | 0.2 ± 0.1 | *** | 14.8 ± 6.1 | *** |
| 21 | 19.8 ± 11.6 | ** | 43.8 ± 7.9 | |
| 22 | 48.2 ± 7.9 | 2.1 ± 0.4 | **** | |
| 23 | 32.7 ± 14.9 | * | 35.4 ± 18.0 | * |
| 24 | 66.0 ± 38.8 | 21.7 ± 11.1 | ** | |
| 25 | 13.7 ± 1.9 | *** | 141.5 ± 30.1 | |
| 26 | 15.0 ± 4.1 | ** | 49.3 ± 25.0 | |
| 27 | 25.4 ± 12.6 | ** | 117.6 ± 43.8 | |
| 28 | 1.2 ± 0.5 | *** | 81.8 ± 42.4 | |
| DEX 3 | 44.3 ± 4.3 | * | 4.5 ± 0.5 | *** |
1 Percentage of expression (Exp %) at a concentration 100 μM (except for 2:25 μM, 3:50 μM, and S9-EA: 100 μg/mL) compared with the control group (100 % for stimulated LPS alone). Results are presented as mean ± SEM. (n = 3–4). * p < 0.05, ** p < 0.01, *** p < 0.001, **** p < 0.0001. 2 S9 EA: the EtOAc extract of soft coral Cespitularia sp. 3 Positive control: dexamethasone (DEX) at 100 μM.
Table 10.
Primers of quantitative RT-PCR.
| Gene | Reverse Primer | Forward Primer |
|---|---|---|
| iNOS | 5′-CCAATGTTTCCCTGACTTTCCCA-3′ | 5′-CAGAGGGGTAGGCTTGTCTC-3′ |
| COX-2 | 5′-CAGGAGGATGGAGTTGTTGTAG-3′ | 5′-ACCAGCAGTTCCAGTATCAGA-3′ |
| GAPDH | 5′-TGTCATCATACTTGGCAGGTTTCT-3′ | 5′-CGTGTTCCTACCCCCAATGT-3′ |
Publisher’s Note: MDPI stays neutral with regard to jurisdictional claims in published maps and institutional affiliations. |
© 2021 by the authors. Licensee MDPI, Basel, Switzerland. This article is an open access article distributed under the terms and conditions of the Creative Commons Attribution (CC BY) license (https://creativecommons.org/licenses/by/4.0/).
Share and Cite
MDPI and ACS Style
Lin, Y.-C.; Lin, C.-C.; Chu, Y.-C.; Fu, C.-W.; Sheu, J.-H. Bioactive Diterpenes, Norditerpenes, and Sesquiterpenes from a Formosan Soft Coral Cespitularia sp. Pharmaceuticals 2021, 14, 1252. https://doi.org/10.3390/ph14121252
AMA Style
Lin Y-C, Lin C-C, Chu Y-C, Fu C-W, Sheu J-H. Bioactive Diterpenes, Norditerpenes, and Sesquiterpenes from a Formosan Soft Coral Cespitularia sp. Pharmaceuticals. 2021; 14(12):1252. https://doi.org/10.3390/ph14121252
Chicago/Turabian StyleLin, You-Cheng, Chi-Chien Lin, Yi-Chia Chu, Chung-Wei Fu, and Jyh-Horng Sheu. 2021. "Bioactive Diterpenes, Norditerpenes, and Sesquiterpenes from a Formosan Soft Coral Cespitularia sp." Pharmaceuticals 14, no. 12: 1252. https://doi.org/10.3390/ph14121252
Note that from the first issue of 2016, this journal uses article numbers instead of page numbers. See further details here.