Article

Genotype-Specific Antioxidant Responses and Assessment of Resistance Against Sclerotinia sclerotiorum Causing Sclerotinia Rot in Indian Mustard

1
Department of Genetics and Plant Breeding, Oilseed Section, CCS Haryana Agricultural University, Hisar, Haryana 125004, India
2
Biochemistry Laboratory, Department of Genetics and Plant Breeding, Cotton Section, CCS Haryana Agricultural University, Hisar, Haryana 125004, India
3
Department of Biochemistry, College of Basic Sciences and Humanities, CCS Haryana Agricultural University, Hisar, Haryana 125004, India
4
Department of Botany, Maharshi Dayanand University, Rohtak, Haryana 124001, India
*
Authors to whom correspondence should be addressed.
Pathogens 2020, 9(11), 892; https://doi.org/10.3390/pathogens9110892
Submission received: 2 September 2020 / Revised: 12 October 2020 / Accepted: 22 October 2020 / Published: 27 October 2020
(This article belongs to the Special Issue Soil-Borne Plant Pathogenic Fungi)

Abstract

:
Productivity of Indian mustard, an important oilseed crop of India, is affected by several pathogens. Among them, the hemibiotroph Sclerotinia sclerotiorum, which causes sclerotinia rot disease, is the most devastating fungal pathogen causing up to 90% yield losses. The availability of host resistance is the only efficient approach to control and understand the host–pathogen interaction. Therefore, the present investigation was carried out using six Indian mustard genotypes with contrasting behavior towards sclerotinia rot to study the antioxidant resistance mechanism against S. sclerotiorum. The plants at post-flowering stage were inoculated with five-day-old pure culture of S. sclerotiorum using artificial stem inoculation method. Disease evaluation revealed significant genotypic differences for mean lesion length among the tested genotypes, where genotype DRMR 2035 was found highly resistant, while genotypes RH 1569 and RH 1633 were found highly susceptible. The resistant genotypes had more phenolics and higher activities of peroxidase, catalase and polyphenol oxidase which provide them more efficient and strong antioxidant systems as compared with susceptible genotypes. Studies of antioxidative mechanisms validate the results of disease responses.

1. Introduction

Oilseed crops play a crucial role in the agricultural-based economy of India [1]. Among the nine major oilseed crops widely cultivated in India, rapeseed-mustard occupies the foremost position because of its greater sustainability under varied agro-ecological situations. India is ranked 3rd in world after China and Canada both in acreage (19.3%) and production (11.3%) of brassica oilseeds. Despite this, India meets ~57% of its interior comestible oil requirements through import from other countries [2]. Productivity of brassica oilseed is mainly hampered by various fungal diseases viz. white rust, Alternaria blight, sclerotinia rot, and downy mildew [3]. Among these, sclerotinia rot caused by Sclerotinia sclerotiorum (Lib.) de Bary, a cosmopolitan soilborne fungal pathogen, is the utmost devastating disease in the present climate [4]. This pathogen does not have any specific host and causes disease in >600 plant species including important oilseed crops viz. soybean, groundnut, sunflower, and brassica oilseeds including Indian mustard (Brassica juncea (L.) Czern & Coss) [5,6]. It causes up to 90% yield losses in Indian mustard besides affecting oil quality [7]. S. sclerotiorum shows bimodal infection in their hosts by carpogenic and myceliogenic means (Figure 1). The sclerotia overwinter inside the soil and either germinate myceliogenically to form mycelia which infect basal stems (soilborne infection) or germinate carpogenically to form apothecia to infect any part via appressoria formation (air borne infection) [8]. Sclerotinia rot symptoms, particularly those due to carpogenic infection, are visible after flowering stage. It causes infection in plant parts including stem with typical symptoms of initially soft and white-grayish lesions which then extend throughout the stem and lead to plant collapse [6]. S. sclerotiorum has a typical hemibiotrophic lifestyle [9] and shows a triphasic model for infection on host plants. This infection process includes the (i) opportunistic–saprophytic phase in which the pathogen makes contact and penetrates the host tissue, (ii) pathogenic phase in which it releases chief virulence factor (oxalic acid) and cell wall-degrading enzymes like pectinases which cause necrosis in host tissue, and (iii) saprophytic phase in which a pathogen takes nutrients from the host necrotic tissue for completing its life cycle and develops sclerotia which completely collapse the infected tissue [10]. Stems are most affected by this devastating disease and damage to stems is directly related to major field losses. The fungal infection generally leads to the development of lesions on stems which consistently extend longitudinally throughout the stem as the disease progresses. Resistant host restricts the lesion extension on stems over time with the help of callose development, lignification, and cambium formation at the edge of lesion for delaying growth of a pathogen [11,12]. Therefore, stem lesion length, rate of lesion development over time, and Area Under Disease Progression Curve (AUDPC) are very good parameters for assessing resistance and disease progression over time.
Metabolism of the host plant also gets modulated post-pathogen attack which leads to elevated levels of reactive oxygen species (ROS) viz. hydrogen peroxide (H2O2), superoxide radicals (O2), hydroxyl radicals (OH), and singlet oxygen (O) near the pathogen infection site. These molecules are essential for plants to combat against phytopathogens [13].
However, production of ROS above its threshold level is deleterious for both the pathogen and host cells and causes oxidative stress [14]. Plants have very complex antioxidant defense mechanisms and systems to circumvent the oxidative stress [15,16]. They comprise antioxidative and defense enzymes as well as some non-enzymatic components. This system maintains cellular homeostasis, helps in exploiting its favorable role to plants against pathogenic infection and is very useful biochemical indicator for disease resistance [17,18,19,20,21]. The host plant illustrates a unique defense response during a different phase of hemibiotrophs infection. This response supported by host-hemibiotrophs interaction suggests that high ROS accumulation in host during initial phase of infection is inhibitory to pathogen while it is beneficial for pathogen during the later phase [22]. Therefore, timing and strength of defense response activation determine host plant resistance level against hemibiotrophs. However, understanding of the host-pathogen interaction and resistance mechanism involved in Indian mustard against S. sclerotiorum is still very scanty and needs further elucidation. Therefore, present study was designed and executed to evaluate the antioxidative response and resistance behavior at early, mid, and later stages of S. sclerotiorum infection in contrasting Indian mustard genotypes.

2. Results

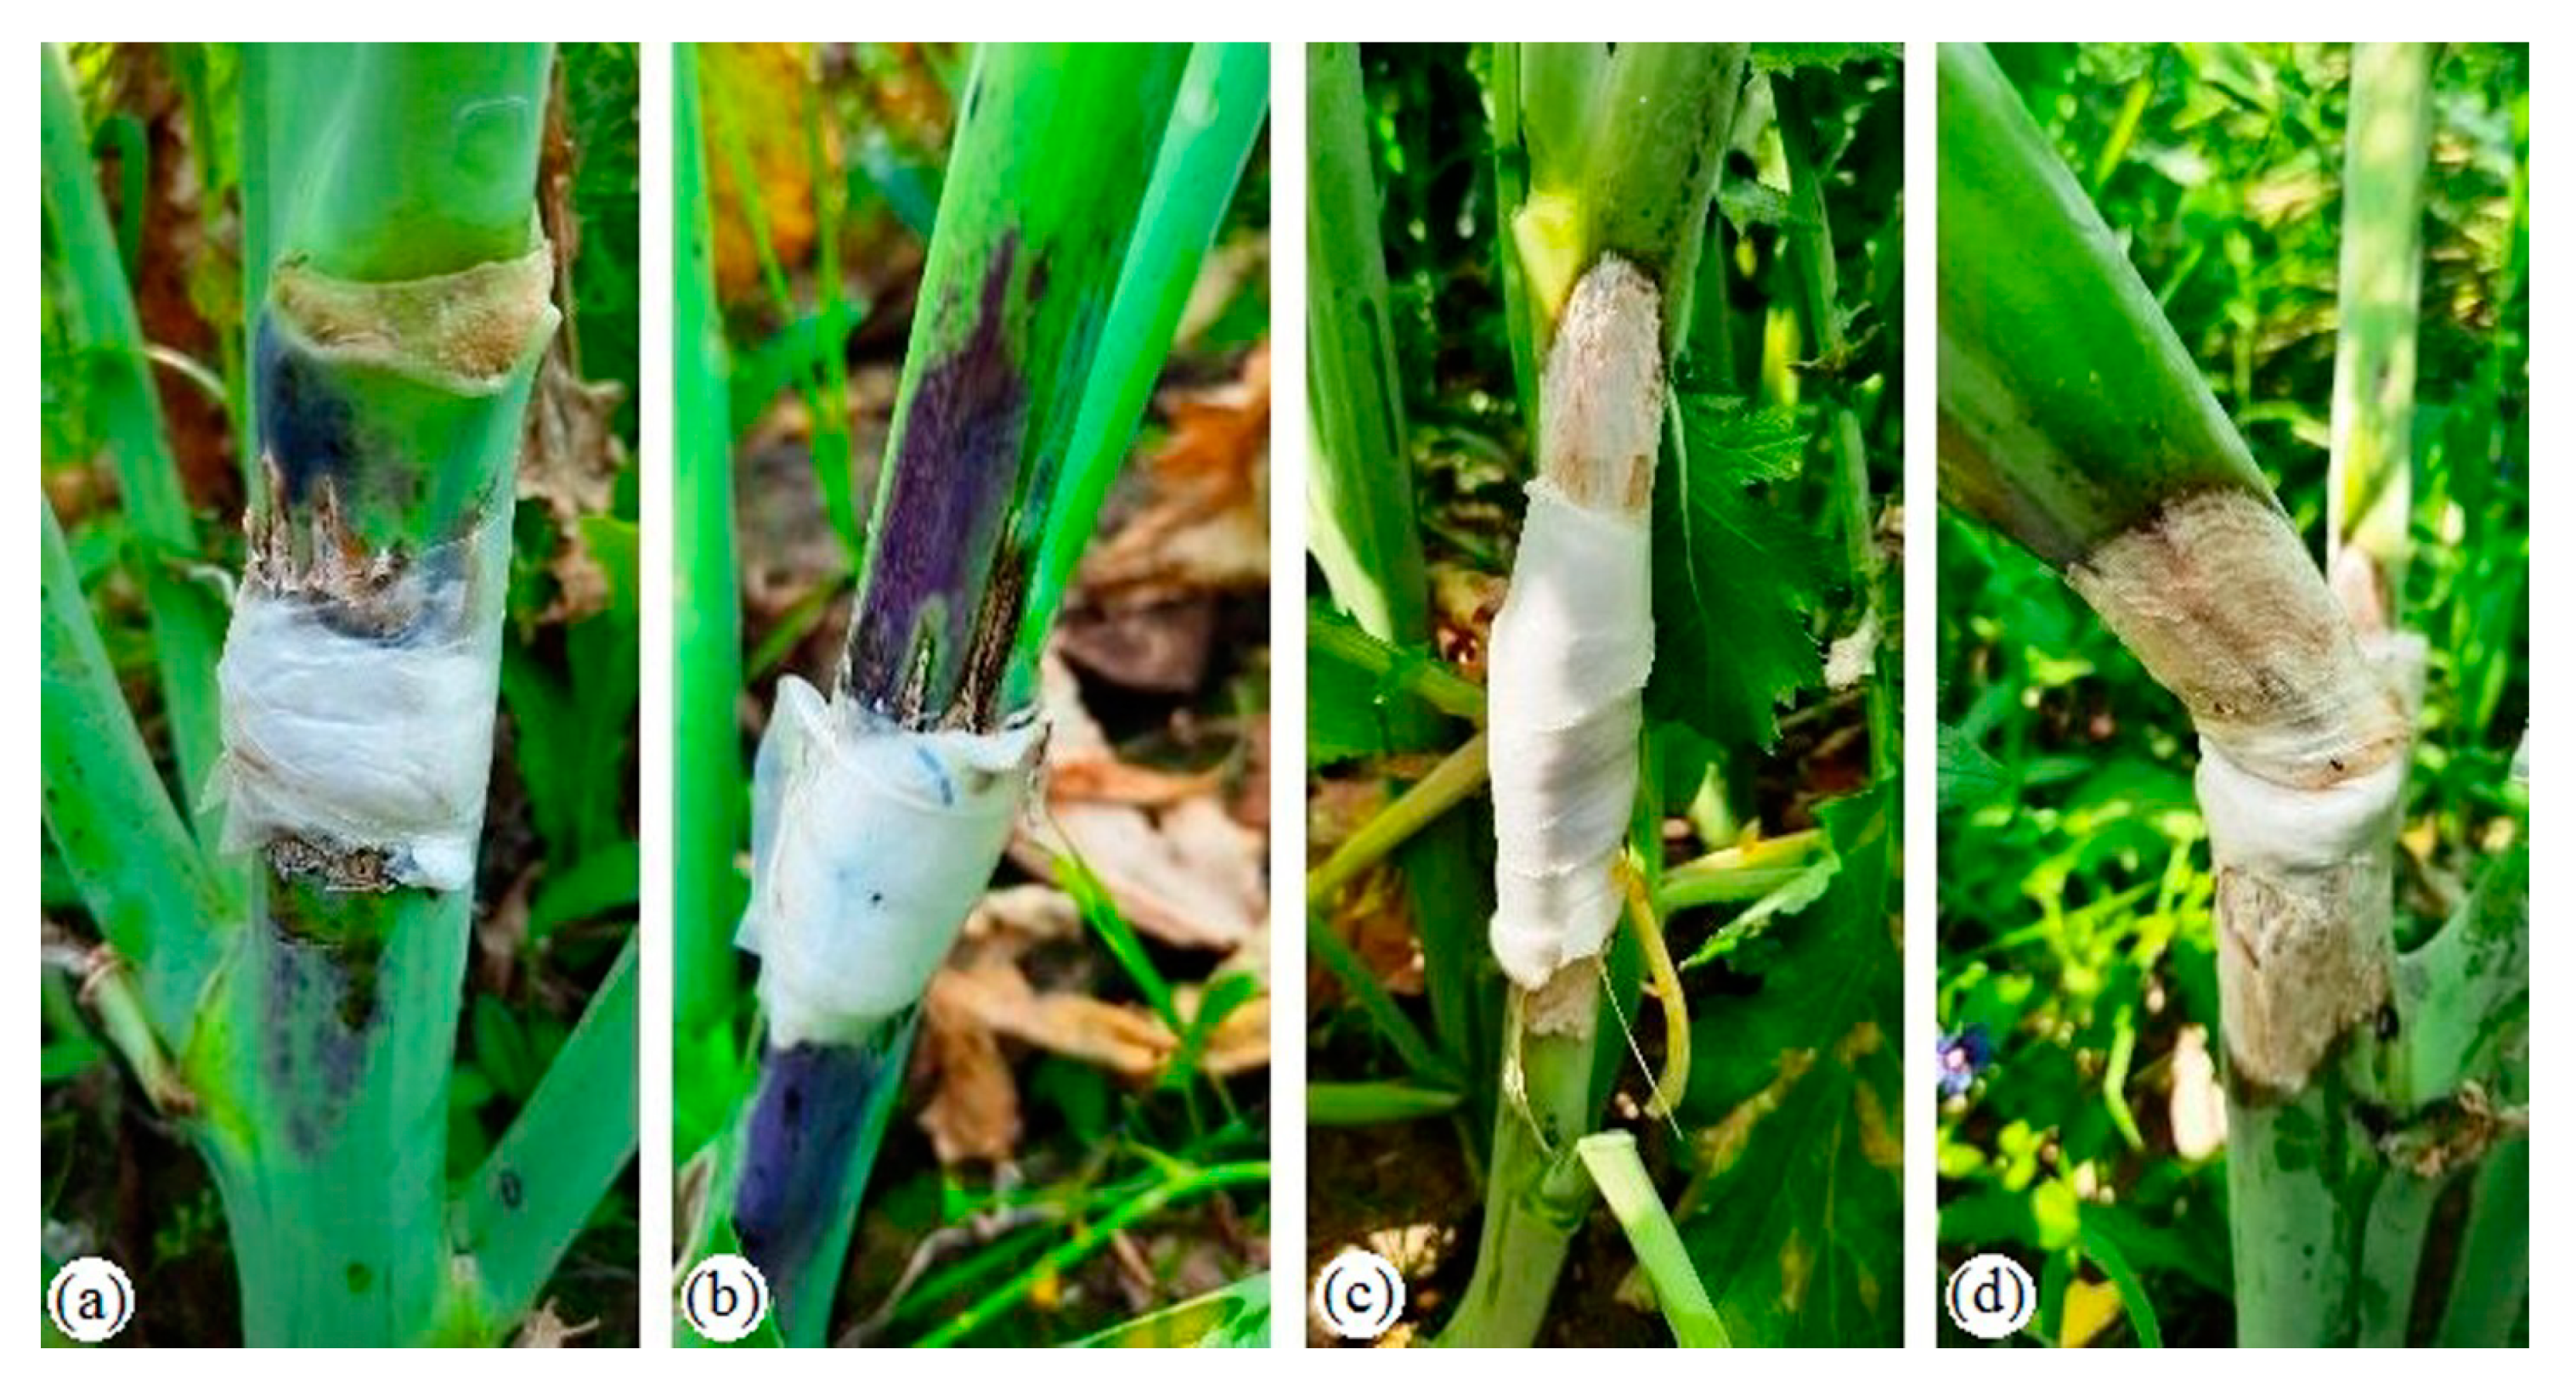
2.1. Disease Assessment

Inoculated plants showed characteristics symptoms of sclerotinia rot as white-greyish lesions on stems while uninoculated plants were healthy with no symptoms. Statistical analysis showed significant genotypic differences for mean stem lesion length at 6, 12, and 18 days after inoculation (DAI) (Table 1). Based on mean lesion length at 18 DAI, genotype DRMR 2035 showed highly resistant response with <2.5 cm mean lesion length while the genotypes viz. RH 1222-28 and EC 597328 showed resistant response with mean lesion length between 2.5 to 5.0 cm. However, majority of the plants of resistant genotypes (DRMR 2035 and RH 1222-28) were asymptomatic at 6 DAI and showed slow resistance phenomenon. Among susceptible genotypes, RH 1566 was found susceptible with mean lesion length between 7.5 and 10.0 cm, while the other two genotypes viz. RH 1569 and RH 1633 exhibited highly susceptible response with >10.0 cm mean lesion length. AUDPC varied from 25.26 to 113.37 with lowest (25.26) in DRMR 2035 and highest (113.37) in RH 1569. Rate of increase per day in lesion length varied from 0.07 to 0.87 cm day−1 with maximum (0.87 cm day−1) in RH 1566 at 6 DAI and minimum (0.07 cm day−1) in DRMR 2035 at 18 DAI (Table 2).

2.2. Biochemical Analysis

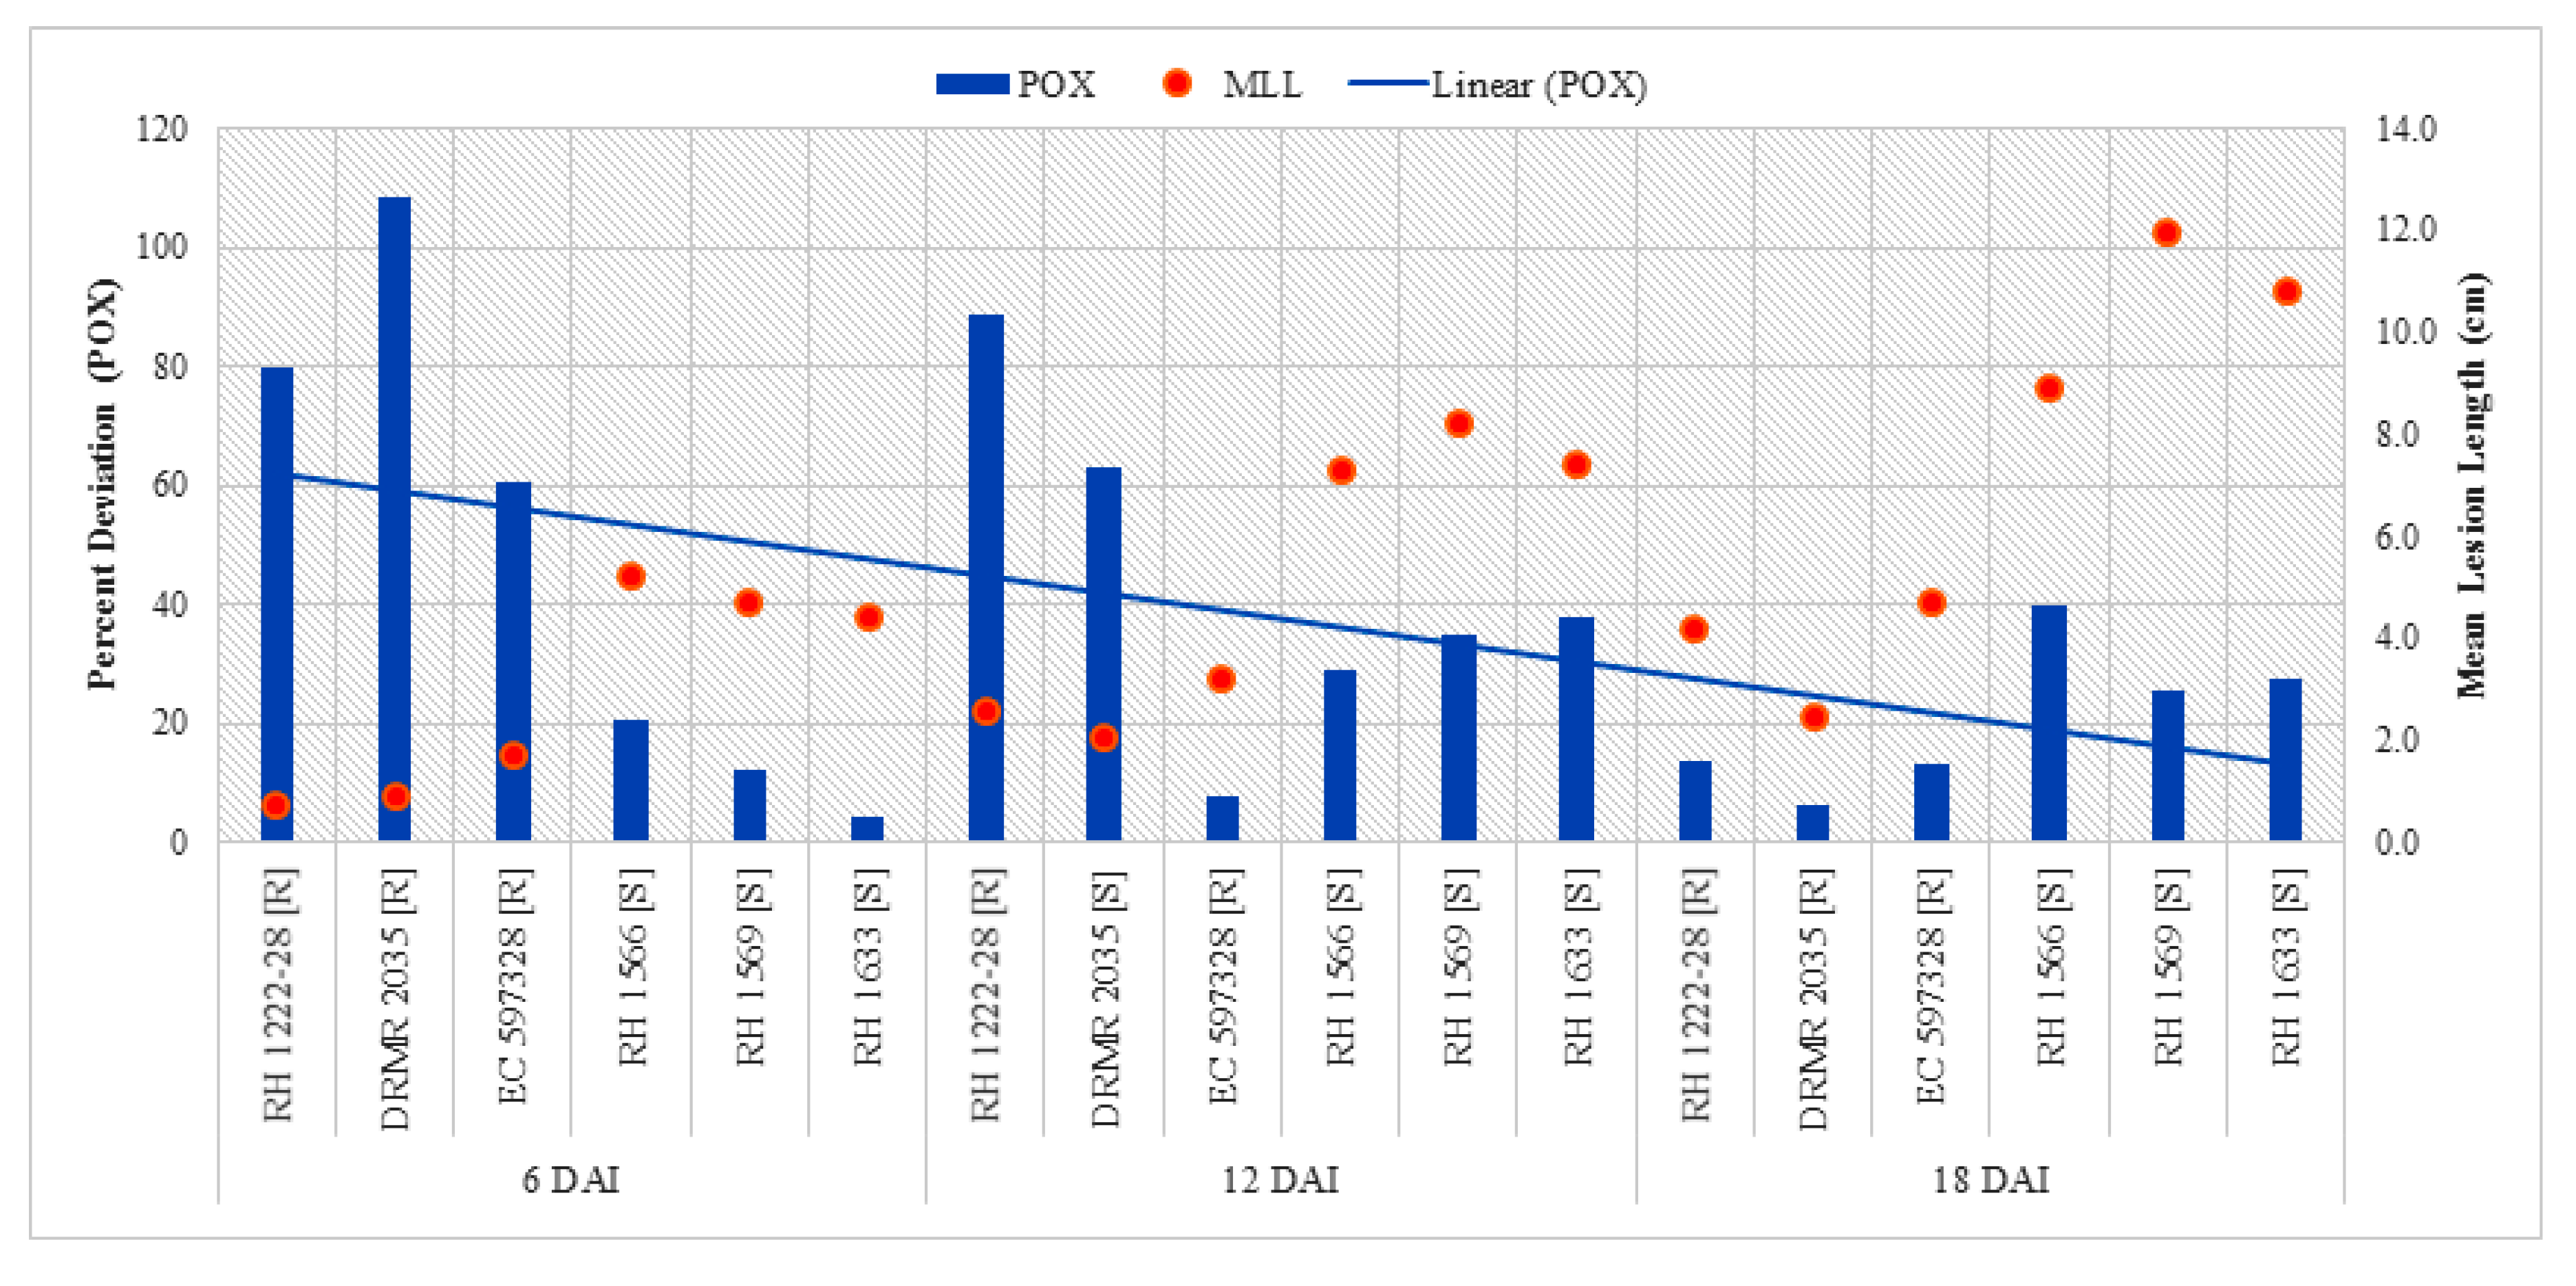
2.2.1. Peroxidase (POX) Activity

Analysis of variance (ANOVA) revealed highly significant interactions for POX activity among variables viz. sampling times (ST), plant inoculation (PI), and genotypes with different responses to sclerotinia rot (G) (Table 3). Data presented in Table 4 show the highest POX activity (5.98 µmol min−1 mg−1 protein) in DRMR 2035 inoculated with S. sclerotiorum at 6 DAI (6DAI/I/R2) and lowest (2.19 µmol min−1 mg−1 protein) in RH 1566 at 18 DAI (18DAI/UI/S1). There was no significant difference for POX activity in uninoculated plants of all genotypes, but activity increased in all the genotypes after pathogen inoculation at all duration (6, 12, and 18 DAI). However, it was significantly higher in resistant genotypes as compared with susceptible genotypes at 6 DAI while significantly higher in susceptible genotypes at 18 DAI (Table 4). The increase in POX activity after inoculation was manifold higher in resistant genotypes at 6 and 12 DAI, whereas at 18 DAI it was higher in susceptible genotypes (Figure 2). Pearson correlation between percent increase in POX activity and mean lesion length (Table 5) showed significantly negative association (p < 0.05) at 6 DAI.

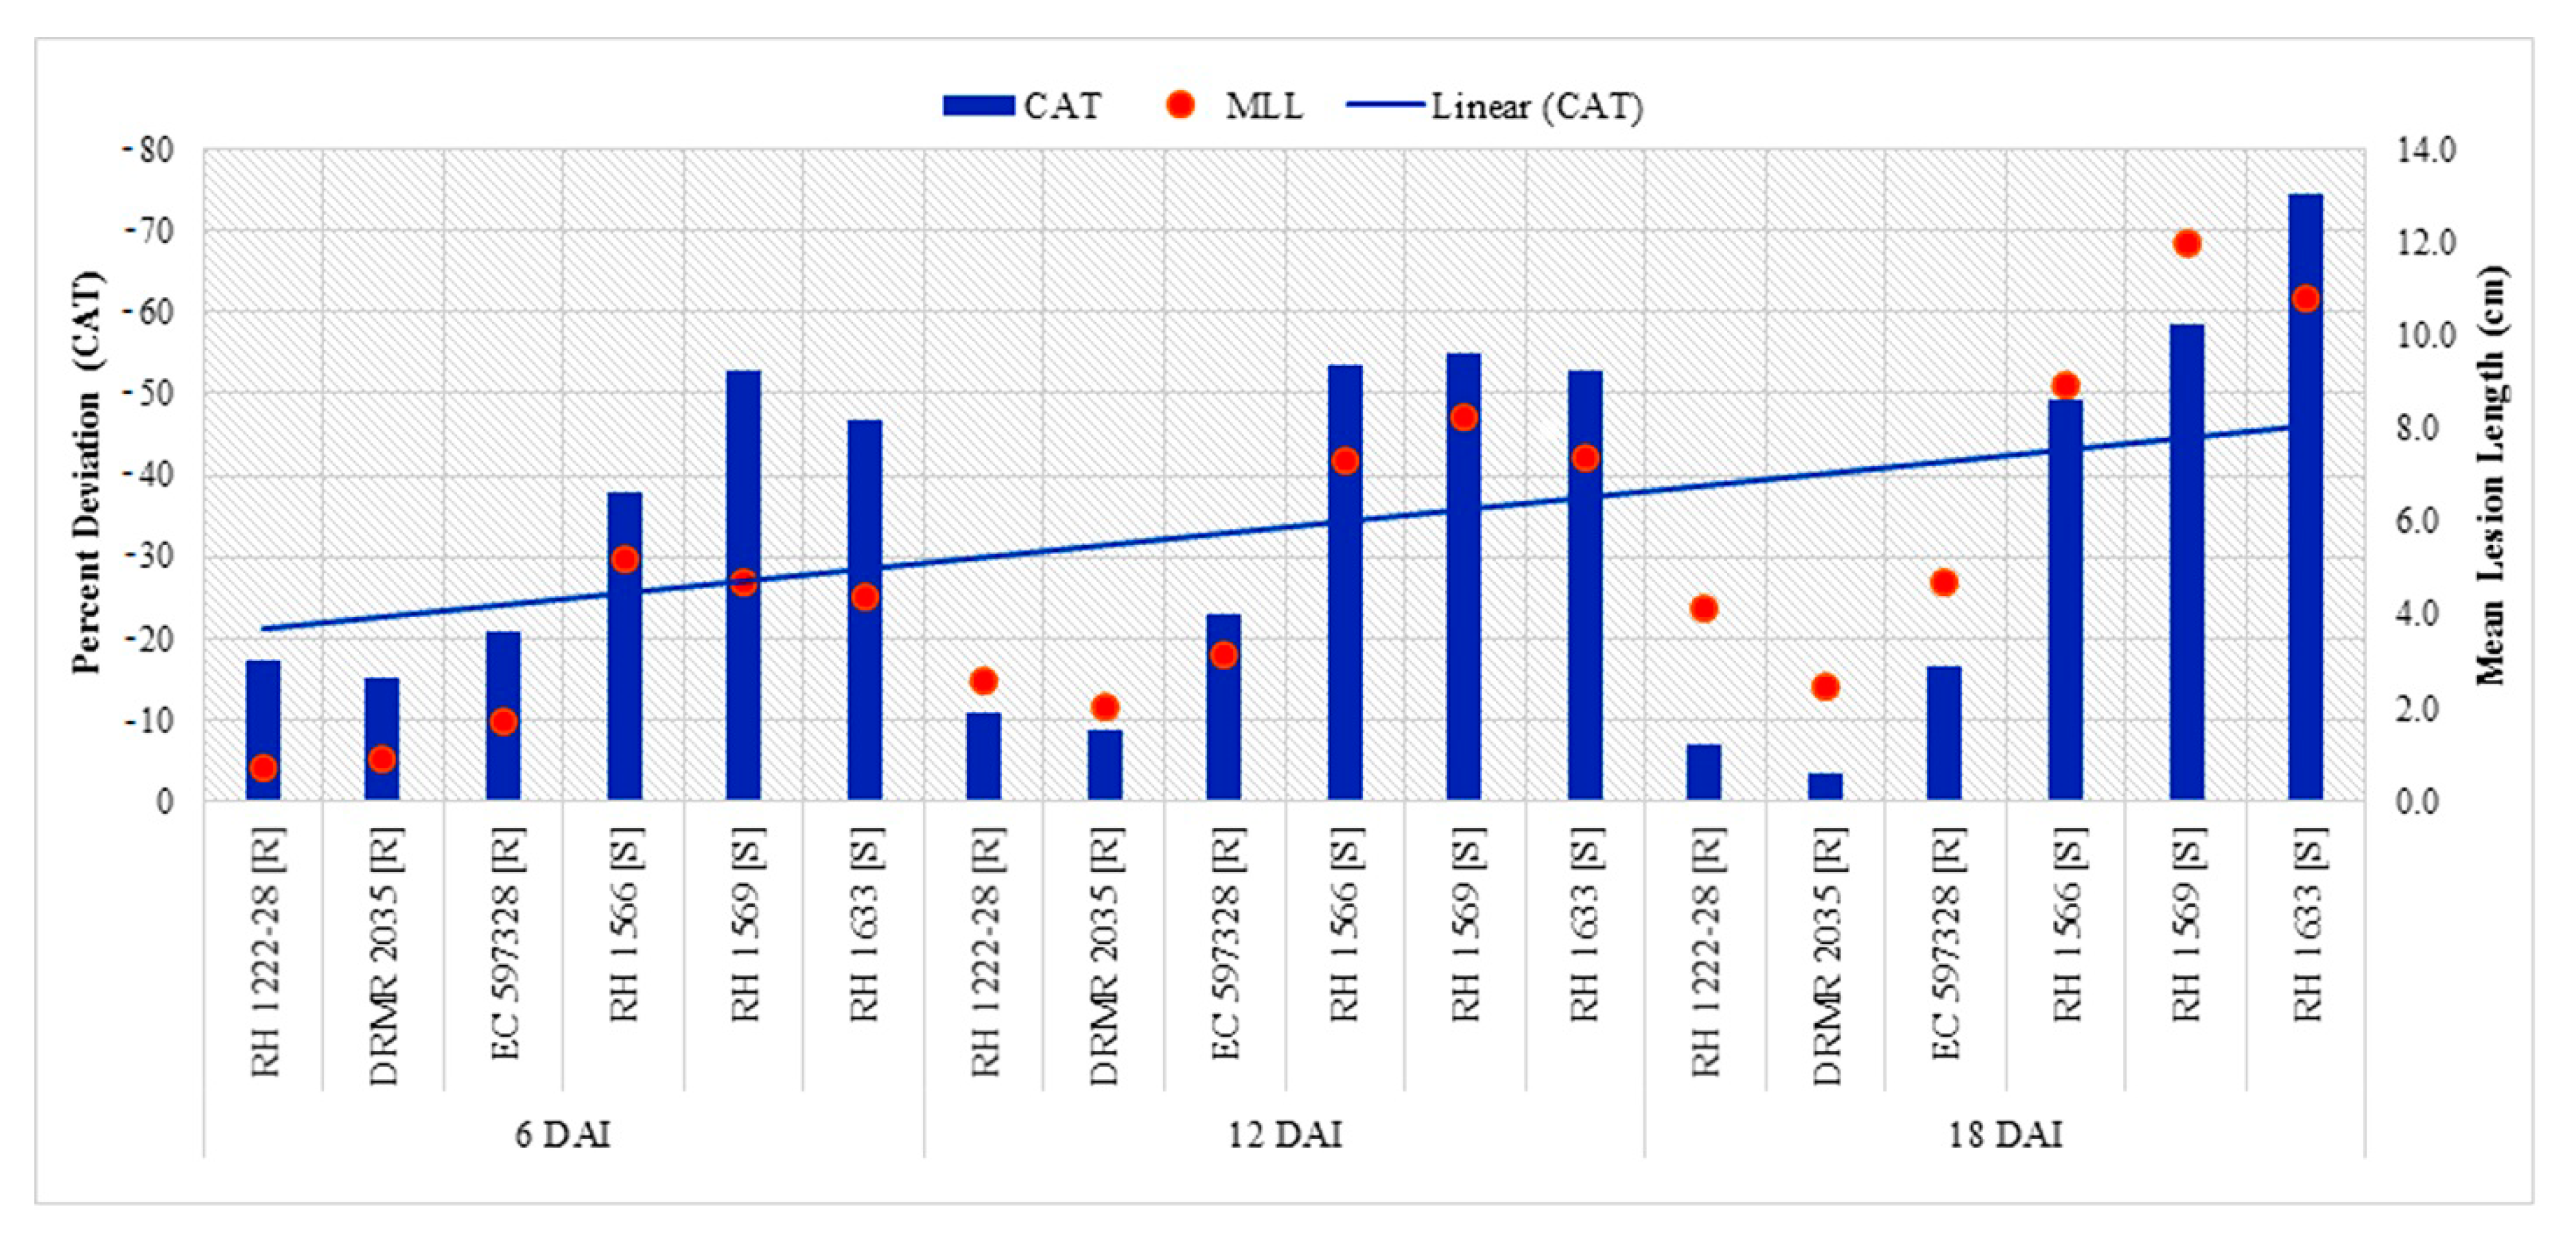
2.2.2. Catalase (CAT) Activity

Resistant genotypes had higher CAT activity as compared with susceptible genotypes at both inoculation treatments and all sampling times, but it significantly decreased after pathogen inoculation in a genotype-specific manner (Table 4). Percent decrease in CAT activity after inoculation was significantly higher in susceptible genotypes than resistant genotypes, and became linearly pronounced with disease progression (Figure 3). Highest CAT activity (7.08 µmol min−1 mg−1 protein) was observed in uninoculated plants of DRMR 2035 at 6DAI/UI/G2 while the lowest (1.23 µmol min−1 mg−1 protein) was observed in RH 1633 at 18DAI/I/S3. Activity decreased at later stages in all genotypes and in both treatments (Table 4). Percent decrease in CAT activity after inoculation also showed significantly positive correlation (p < 0.05) with mean lesion length at 6, 12, and 18 DAI (Table 5).

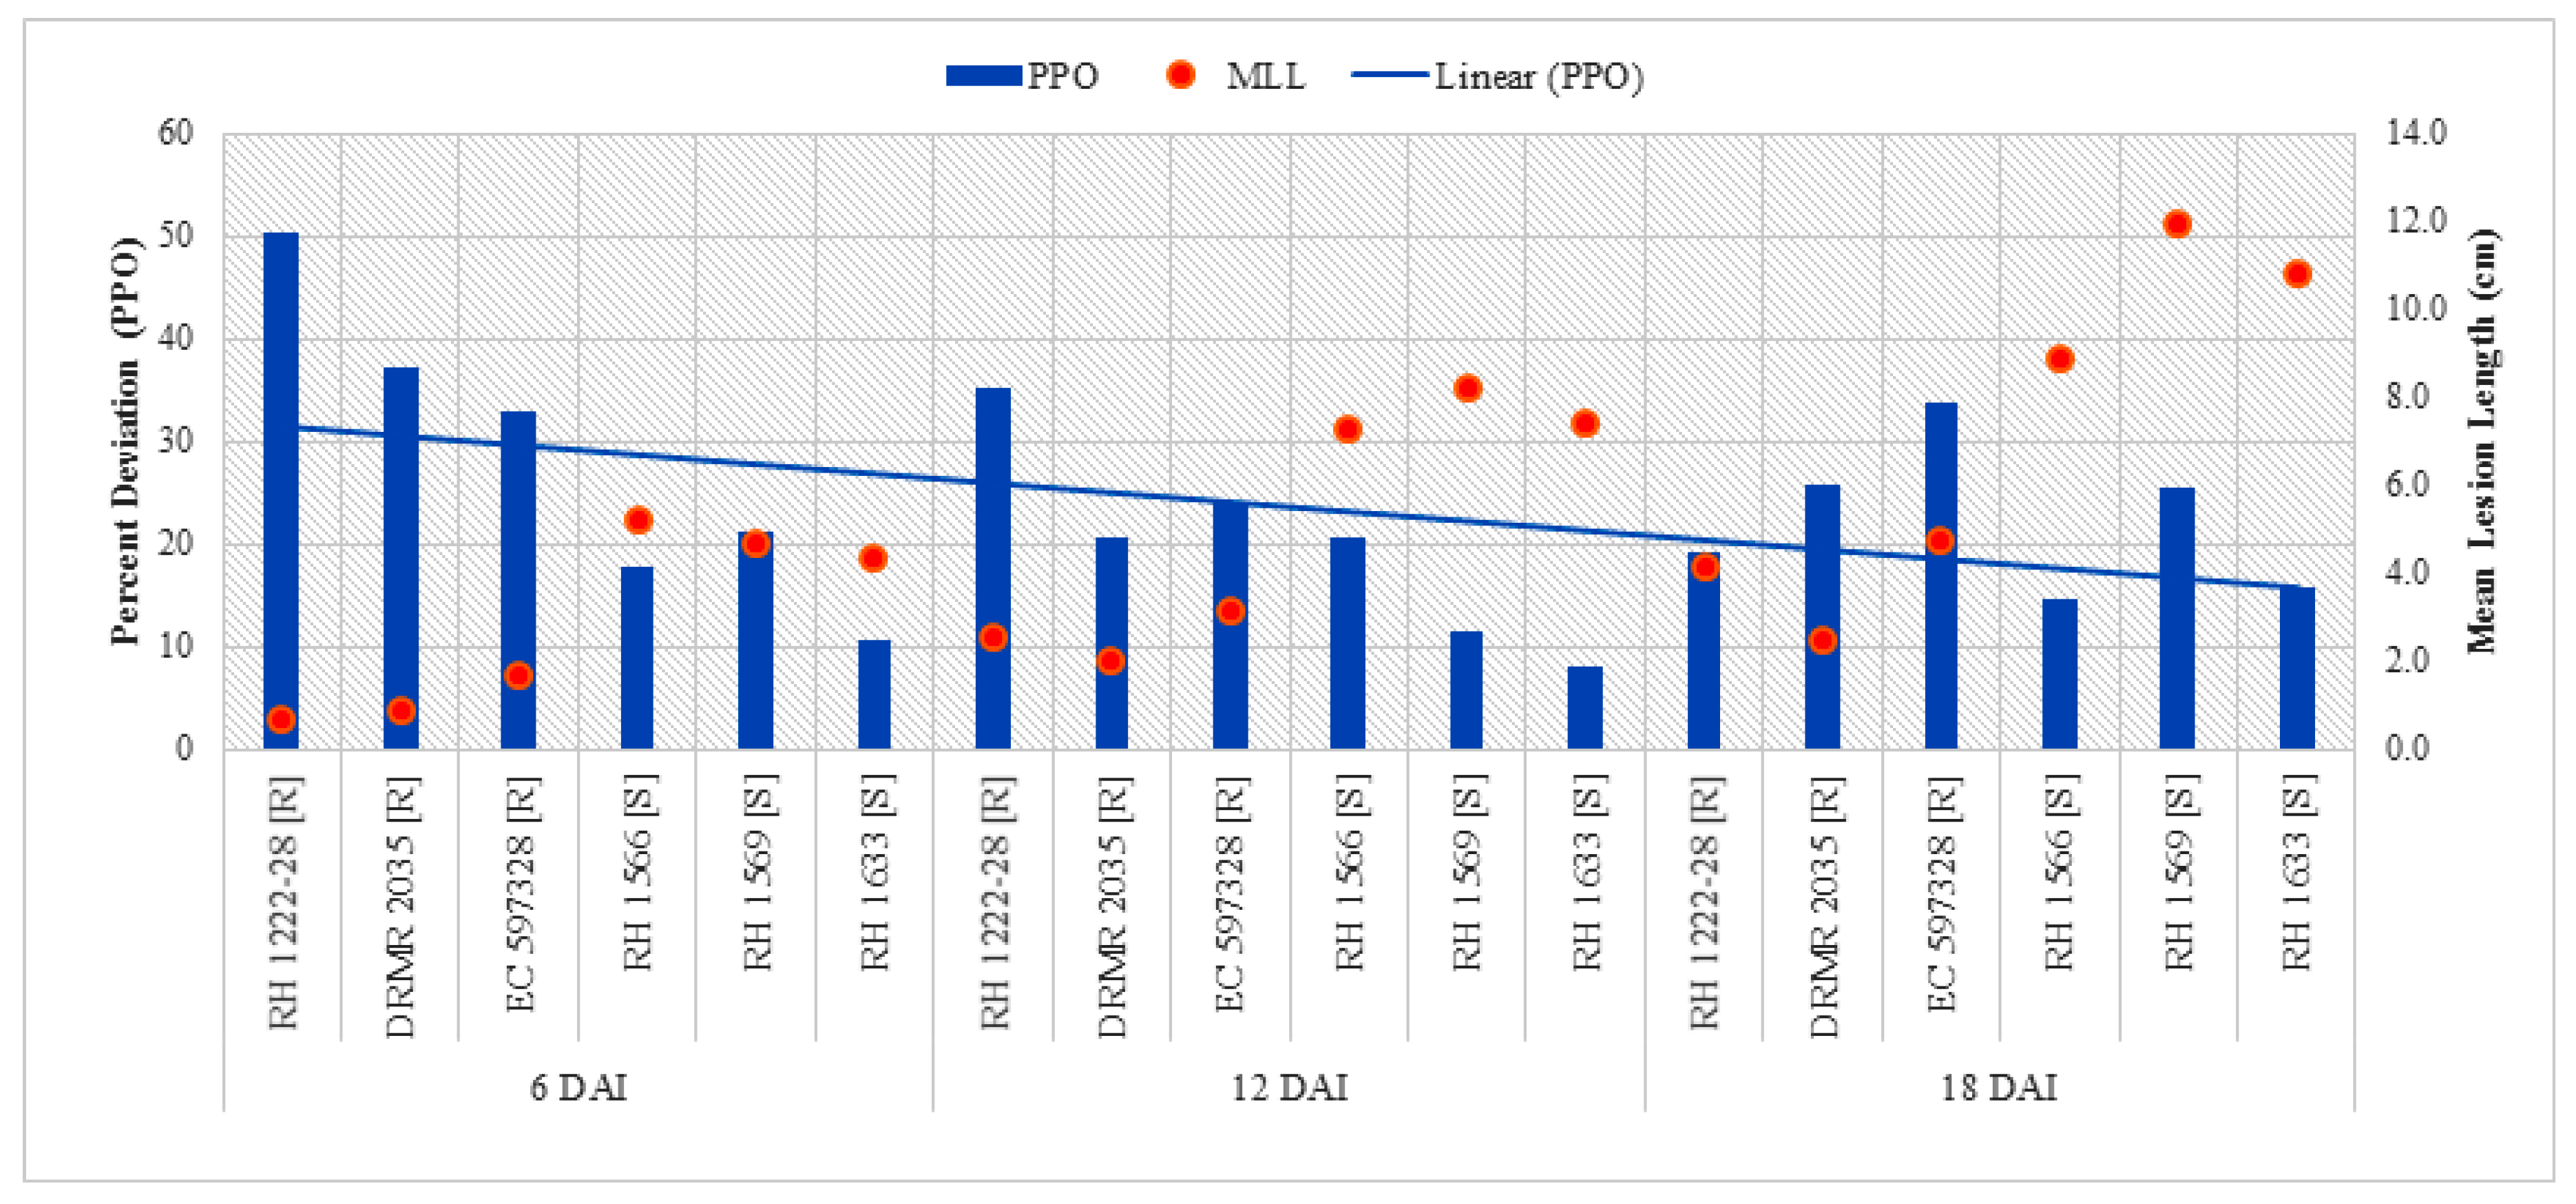
2.2.3. Polyphenol Oxidase (PPO) Activity

Analysis of variance (ANOVA) showed that all interactions except sampling times by genotypes with different response to sclerotinia rot (ST X G) were not significant but all the variables viz. sampling times (ST), plant inoculation (PI), and genotypes with contrasting behavior to sclerotinia rot (G) were highly significant for PPO activity (Table 3). Data shows that PPO activity significantly increased after inoculation (Table 4). The highest activity (1.90 µmol min−1 mg−1 protein) was observed in resistant genotype (DRMR 2035) at 6DAI/I/R2 and thereafter it decreased in all genotypes and treatments. Increase in PPO activity after inoculation was ~2.4- and ~2.0-fold higher in resistant genotypes as compared with susceptible genotypes at 6 and 12 DAI, respectively. The linear curve shows a decrease in PPO activity as the plants matured after inoculation (Figure 4) and also reflects significantly negative association (p < 0.05) with mean lesion length at 6 DAI (Table 5).

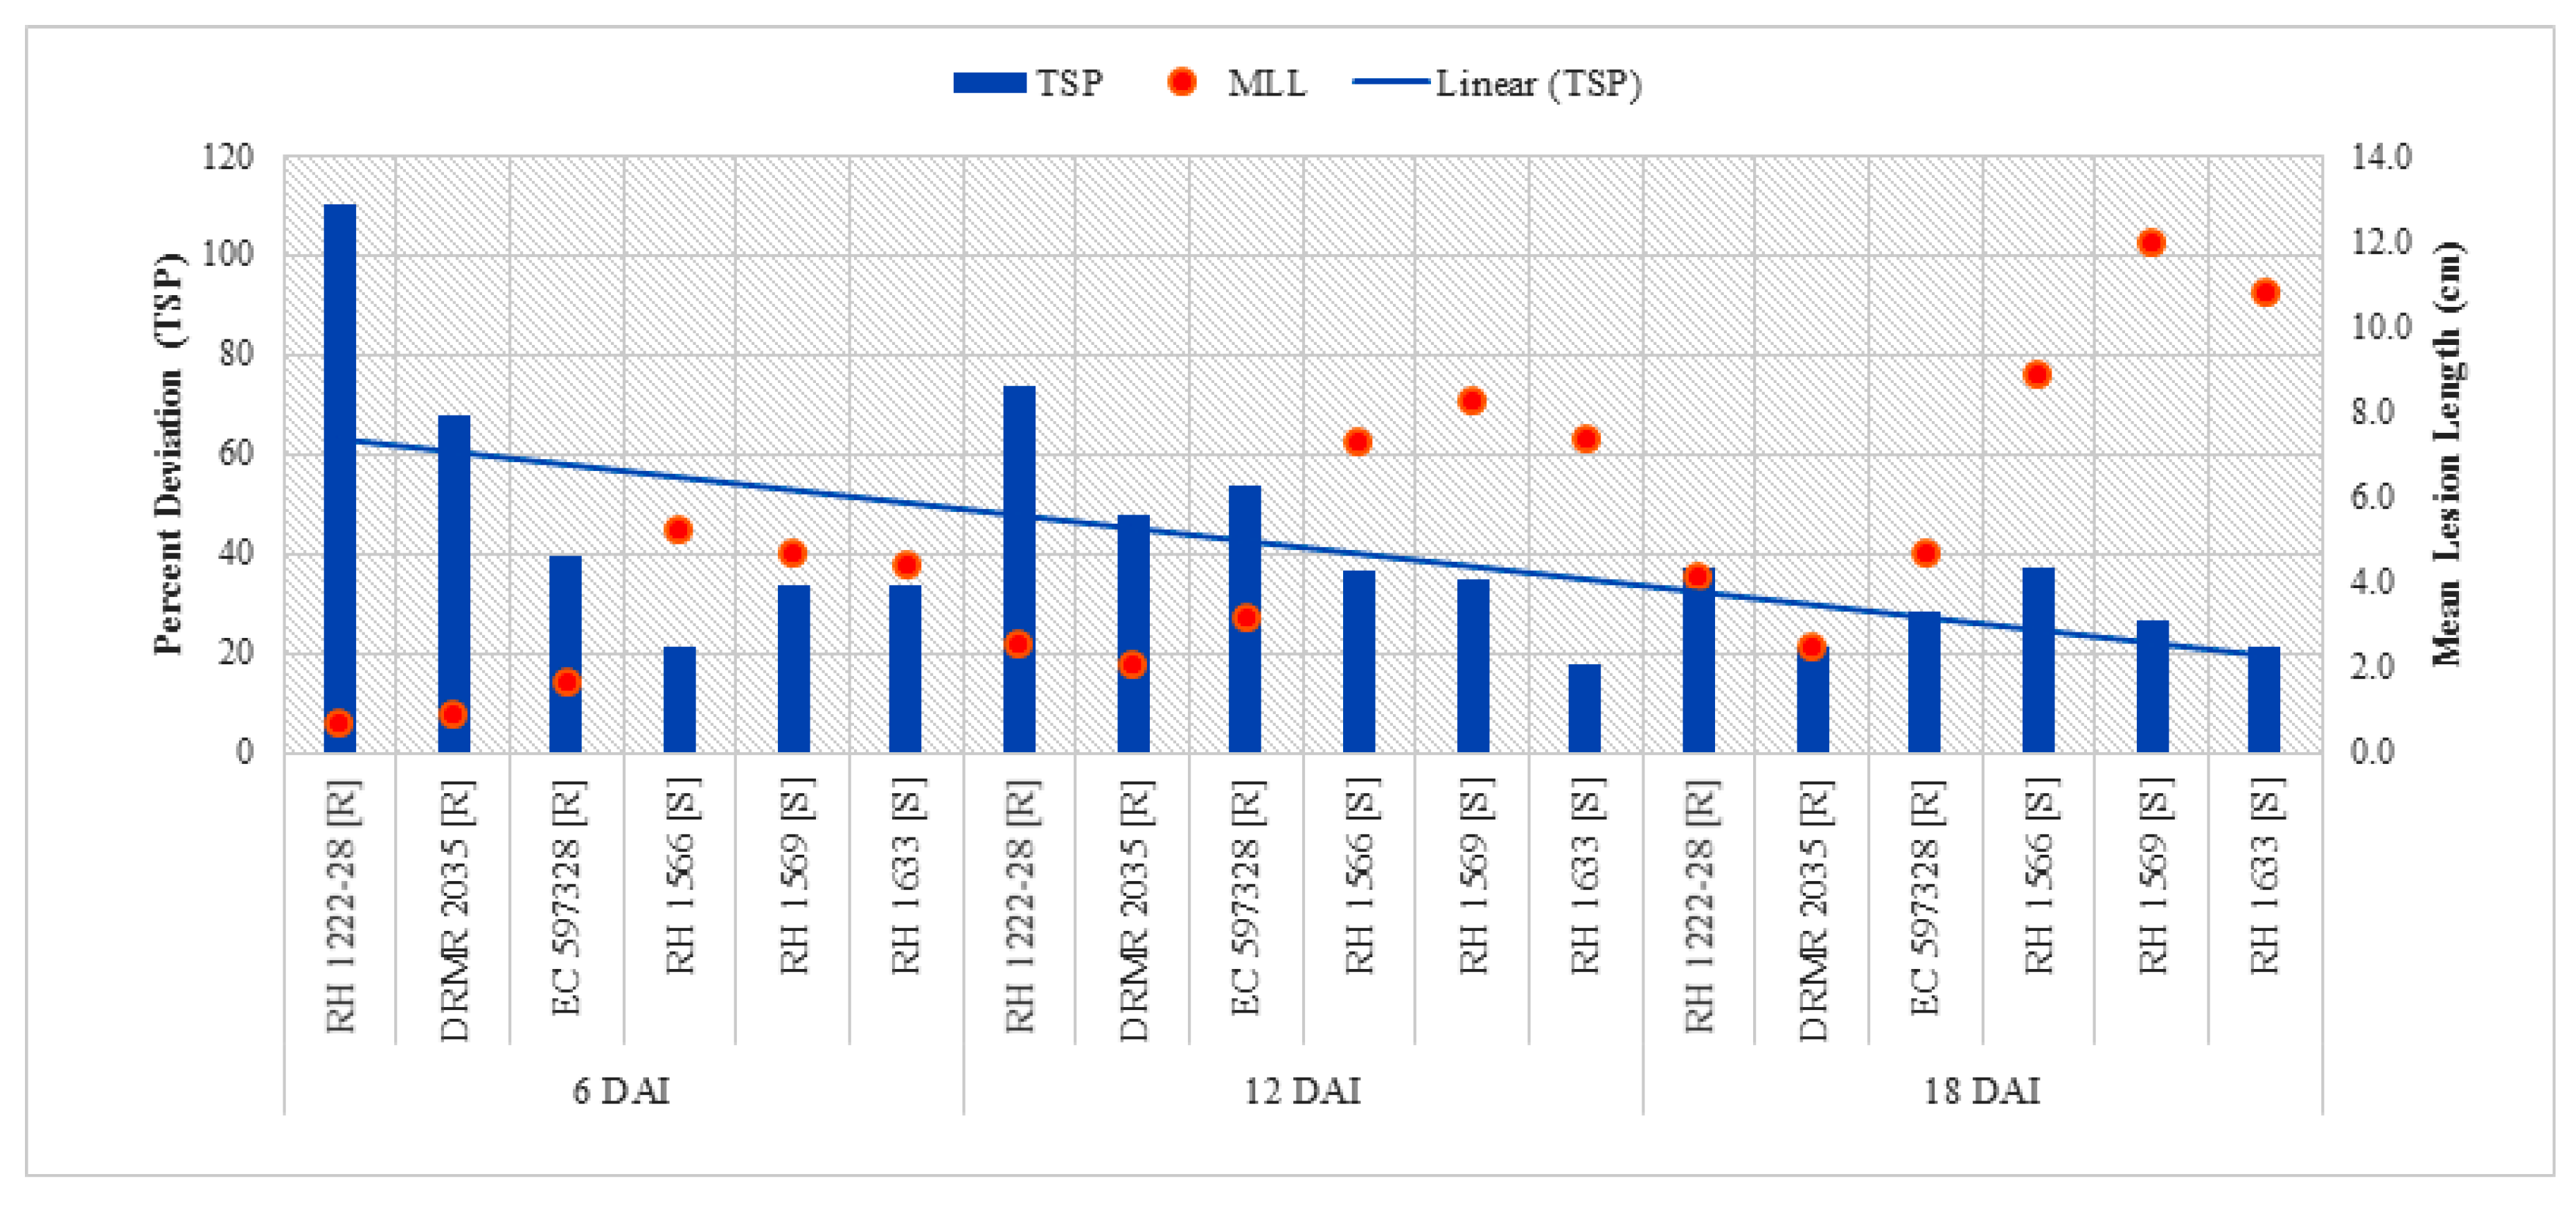
2.2.4. Total Soluble Phenolics (TSP)

Total soluble phenolics in resistant and susceptible genotypes significantly varied with respect to plant inoculation (Table 3). Resistant genotypes had significantly higher TSP as compared with susceptible genotypes in both the treatments along with all sampling times, and it increased with age of the plant (Table 4). Maximum TSP content (2.06 CE mg g−1 DW) was observed in resistant genotype (RH 1222-28) in treatment 6DAI/I/R1, while minimum (0.63 mg CE g−1 DW) in susceptible genotype (RH 1633) in treatment 6DAI/UI/S3 (Table 4). The overall increase in TSP after inoculation was higher in resistant genotypes as compared with susceptible genotypes, but it accumulated by ~2.4-fold in resistant genotypes as compared with susceptible genotypes at 6 DAI. Figure 5 depicts a declined per cent increase in TSP after 6 DAI.

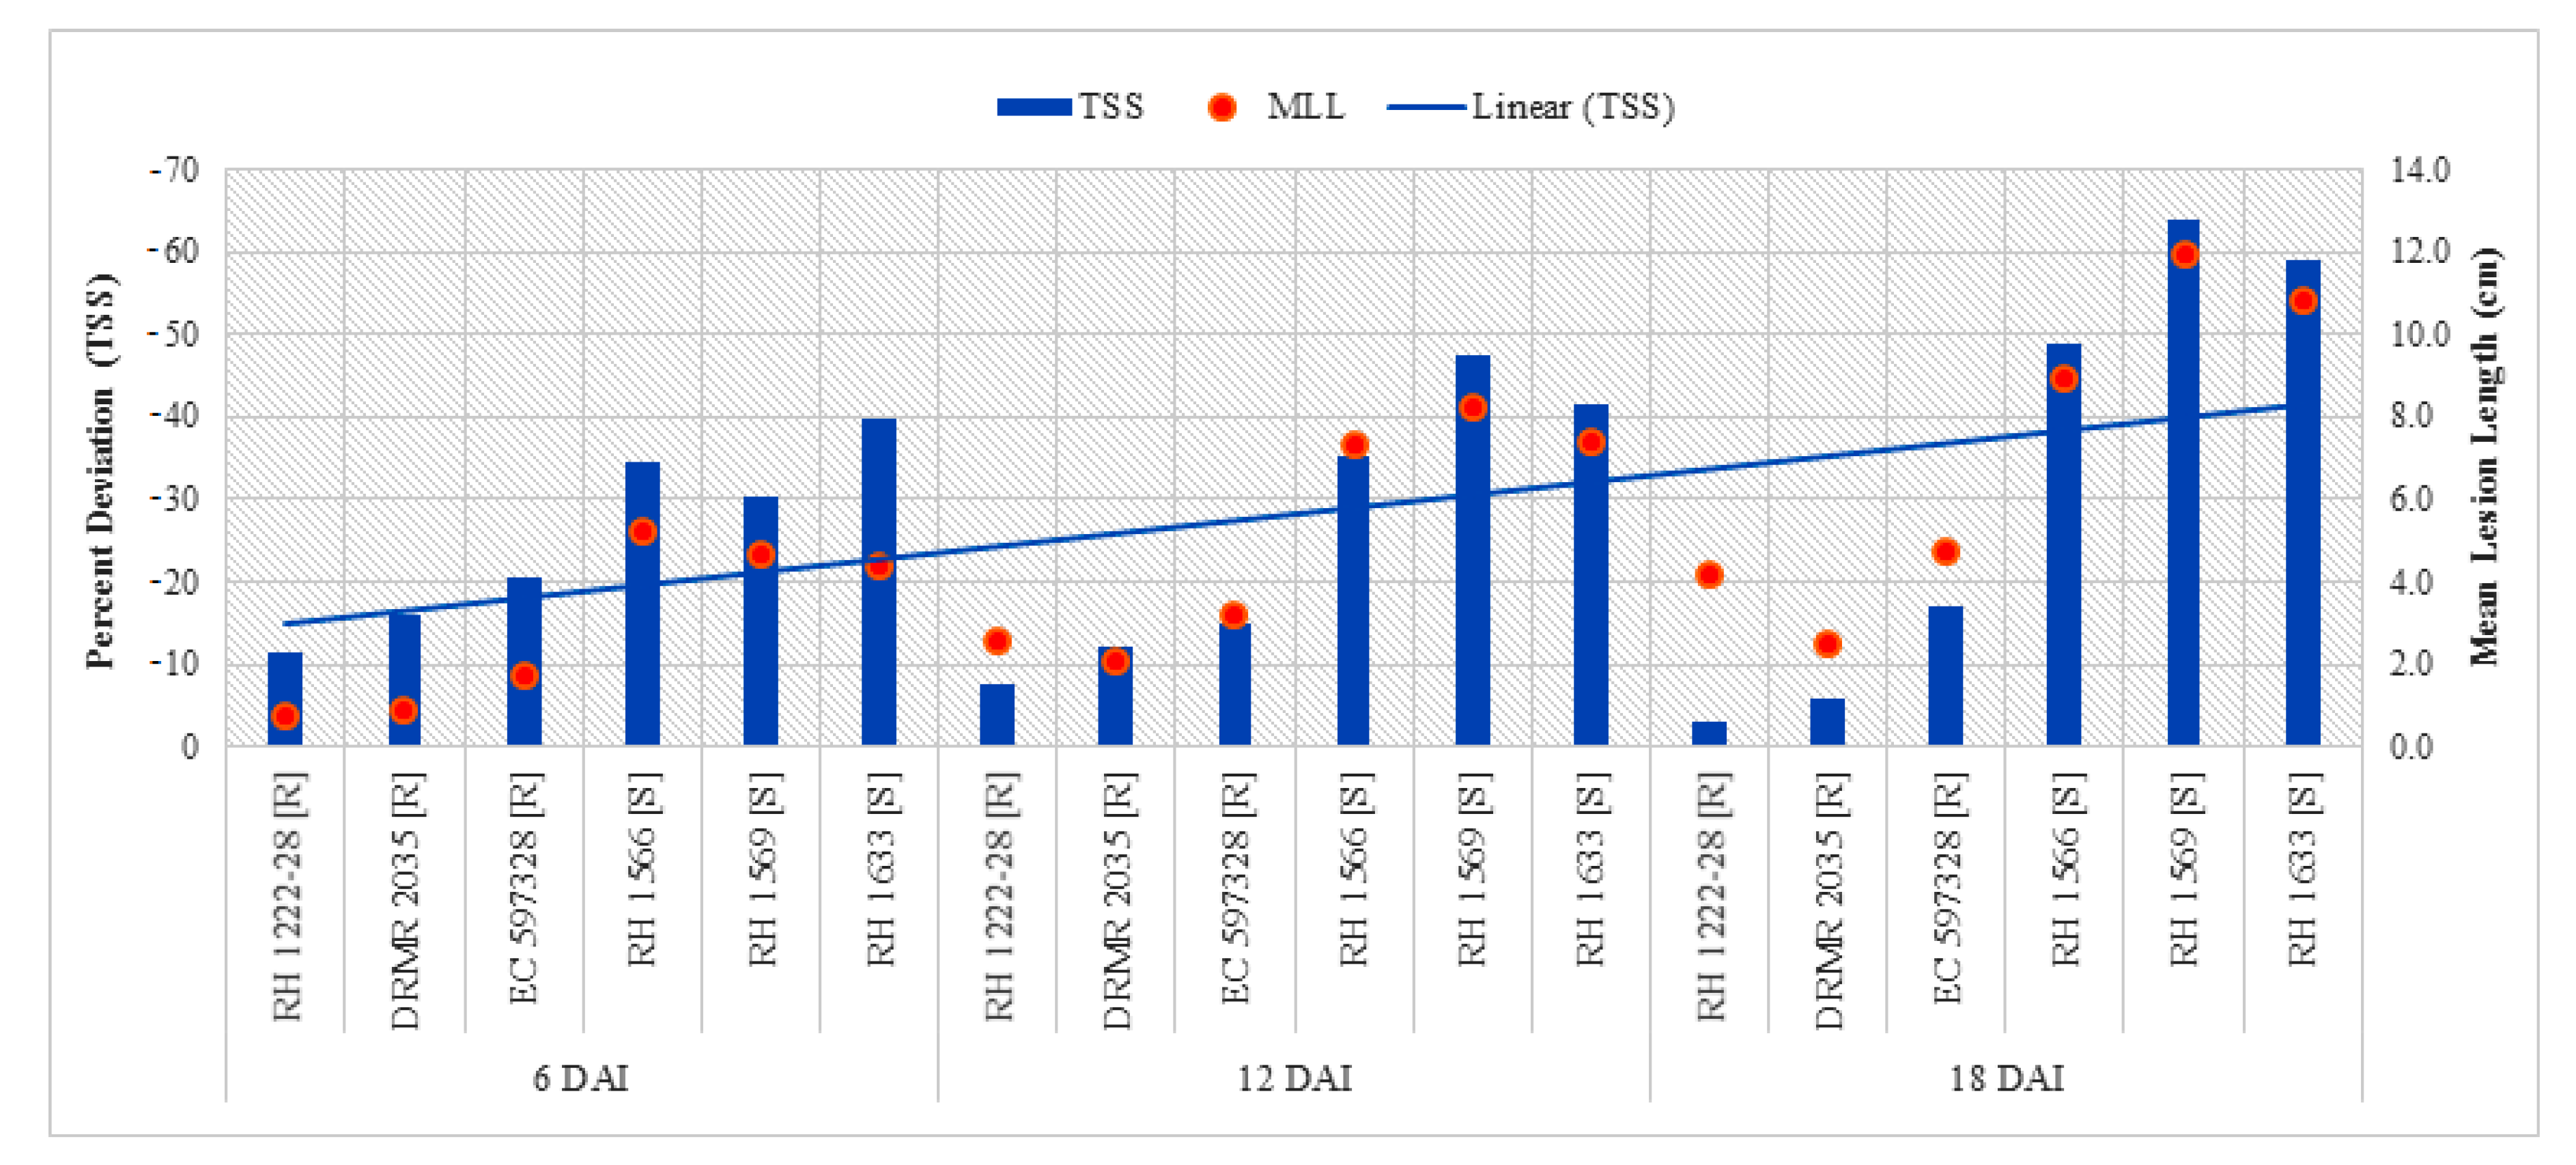
2.2.5. Total Soluble Sugar (TSS)

Analysis of variance (ANOVA) shows that interactions of sampling times and plant inoculation by genotypes with contrasting behavior to sclerotinia rot (ST X G; PI X G) along with individual variables like sampling times (ST), plant inoculation (PI) and genotypes with contrasting behavior to sclerotinia rot (G) were significant (Table 3). There was no significant difference between resistant and susceptible genotypes for TSS in uninoculated plants but there was a significant reduction in TSS in susceptible genotypes as compared with resistant genotypes after inoculation at all sampling stages (Table 4). Maximum TSS (49.74 mg GE g−1 DW) was found in resistant genotype EC 597328 in treatment 6DAI/I/R2 while minimum (12.43 mg g−1 DW) was recorded in susceptible genotypes RH 1569 at 18 DAI (18DA/I/S2). TSS declined 6 DAI in all genotypes, with more decrease in susceptible genotypes and highest difference was observed at 18 DAI (Table 4). Linear curve shows that percent decrease in TSS was more pronounced with post-inoculation passage of time (Figure 6) and it exhibited significantly positive correlation (p < 0.05) with mean lesion length at 6, 12, and 18 DAI (Table 5).

3. Discussion

Disease resistance and susceptibility are governed by genetics of host plants and fungal pathogens and depend on the exchange of multifaceted signals and the responses among them [24]. One of the major genotypic differences between disease resistant and susceptible plants is quick identification of infection and immediate activation of defense mechanisms [25]. Therefore, in the present study, we have investigated the activities of antioxidant enzymes viz. POX, CAT, and PPO as well as contents of non-enzymatic metabolites viz. TSP and TSS in six Indian mustard genotypes with contrasting behavior to sclerotinia rot for unraveling the biochemical basis of B. junceaS. sclerotiorum interaction and antioxidant defense mechanism in Indian mustard against S. sclerotiorum.
High relative humidity (>80%); maximum and minimum temperatures of ~25 and 5–12 °C, respectively; and high soil moisture represent ideal conditions for S. sclerotiorum infection and disease progression in rapeseed-mustard crops [26]. Similar weather conditions were favorable for pathogenic infection on host during current field study (Table S1). Present investigation shows significant genotypic differences for mean lesion length at different DAI which revealed it a host genotype-dependent trait. Lesion length and size during initial appearance to subsequent expansion have been used by crop scientists to categorize genotypic resistance against pathogens for a long time [27]. Therefore, we categorized our genotypes based on mean lesion length at 18 DAI where genotype DRMR 2035 was found highly resistant (<2.5 cm mean lesion length) while genotypes viz. RH 1222-28 and EC 597328 (<5.0 cm mean lesion length) were found resistant. This study also validates the results of Sharma et al. [28], where they tested these genotypes using stem inoculation techniques and found resistant against sclerotinia rot. Rate of increase in lesion length (cm day−1) is often used to observe pathogen aggression against host. It significantly affects the shape of disease progress curve (AUDPC values) and severity of disease [27]. During the present study, comparatively lower pace of lesion length (cm day−1) was shown by resistant genotypes which reveals a slow infection rate and lesser aggression of S. sclerotiorum against resistant genotypes as compared with susceptible genotypes. These genotypes were also differentiated based on AUDPC values which are very useful to summarize disease progression over time and to determine quantitative resistant phenotypes. Lower AUDPC values (<50) represent slower disease progression over time with greater resistance whereas higher AUDPC values (>100) represent faster disease progression and higher susceptibility against pathogens. Our study also revealed an interesting fact that some plants of resistant genotypes viz. DRMR 2035 and RH 1222-28 also showed purple coloration on stems near inoculation site which often extended up to 10 cm (Figure 7). It has earlier also been reported in resistant genotypes of Brassica carinata against this disease [29]. This observed variation for purple coloration and lesion length within the genotypes might be due to partial resistant nature of host. The genetic system controlling partial resistance is as diverse as phenotypes and there is no single genetic and phenotypic model to explain it. It is believed to be a blend of plant architecture escape and functional resistance. Partial resistance mechanism against S. sclerotiorum has earlier been reported in many oilseeds crops viz. oilseed rape [30,31], soybean [32,33,34], and sunflower [35,36]. The appearance of purple coloration near the infection site in resistant genotypes might be due to deposition of anthocyanin and comparatively higher TSS content as recently explained by Liu et al. [37] in oilseed brassica. Anthocyanin is a potent secondary metabolite and robust non-enzymatic antioxidant in plants which not only directly inhibits a pathogen but also protects the plants from elevated ROS accumulation in response to biotic stresses [38,39]. Inhibitory effect of anthocyanin against S. sclerotiorum has been well documented in soybean [40] and oilseed rape [37]. In present study, purple coloration in resistant genotypes after inoculation might be responsible for delaying S. sclerotiorum infection by inhibiting mycelial expansion.
One of the earliest responses of plants against pathogenic exposure is production of massive ROS in infected tissue [19], and although it seems to be the most efficient approach by a resistant host against biotrophs [41], it creates a dilemma for host plants infected by hemibiotrophs. The elevated ROS is not only injurious to the biotrophy to necrotrophy transition phase of hemibiotrophs but also equally destructive to host cells near infection site. It further benefits the necrotrophic phase because elevated ROS kills host cells which in turn are often fit for survival of hemibiotrophs during necrotrophic phase [42]. To maintain the ROS homeostasis, resistant hosts must have proper, efficient and timely regulated antioxidant machinery to utilize the ROS in their own beneficial way against the hemibiotrophs. Therefore, strength and timing of enzymatic antioxidant components viz. POX, CAT, PPO, and non-enzymatic components viz. phenolics and soluble sugar are vital in plant-pathogen interaction, especially in the case of pathogen having a hemibiotrophic lifestyle.
Analysis of variance showed significant effects of genotypes (p = 0.0002), plant inoculation (p < 0.0001), sampling times (p < 0.0001) and their interactions (p < 0.0001) on POX activity indicating it a host/genotype-dependent pathogen-mediated trait. Effect of genotypes and pathogen on its change with time is possibly because of dual feeding nature (biotrophy to necrotrophy) of a pathogen. POX is a well-recognized class of pathogenesis related (PR) protein and a potent plant protective enzyme against fungal pathogens. It is quick responsive and induce immediately near the infection site to catalyze detoxification of elevated H2O2 to protect the adjacent living cells from oxidative damage. Additionally, POX also causes lignification and suberization of cell wall to create a physical barrier against invading pathogens to locally restrict them. It also oxidizes the phenolic compounds to generate antifungal intermediates like phytoalexins and iso-flavonoids [43,44]. We observed an elevation of POX activity after S. sclerotiorum inoculation both in resistant and susceptible genotypes, but significantly higher in resistant genotypes especially during early infection stage. Percent deviation in POX activity after inoculation in resistant genotypes was significantly negative correlated with mean lesion length indicating its role in delaying S. sclerotiorum mediated lesion development by reducing mycelium expansion rate. It might be due to delay of transition from biotrophy to necrotrophy phase. However, at 18 DAI, POX activity was significantly higher in susceptible genotypes as compared with resistant genotypes. Therefore, it can be postulated that susceptible genotypes also evolve strategy of POX elevation to cope up with a pathogen and only difference between resistance and susceptible mechanism is the temporal activation of defense responses. It can also be linked with hemibiotrophic nature of a pathogen. ROS elevation during early stages is inhibitory to transition from biotrophy to necrotrophy phase while at later stage beneficial to necrotrophic phase as they survive and get their food from dead cells during necrotrophy. Our results reveal a strong link of POX activity with resistance and corroborate with previous reports on many important crops including soybean [45,46], common bean [47], sunflower [48,49,50,51], and oilseed rape [52,53].
CAT is another key enzyme which protects living cells by detoxifying H2O2 into water and molecular oxygen near pathogenic infection site. Its activity significantly changed depending on genotypic variation (p < 0.0001), plant inoculation (p < 0.0001) and their interaction (p < 0.0001) indicating it a genotype-specific and pathogen-dependent trait. Hydrogen peroxide, the chief substrate of CAT, is known to inhibit biotrophic but favor necrotrophic pathogens during host-pathogen interaction. The higher CAT activity observed in resistant genotypes as compared with susceptible genotypes before inoculation stipulates their higher H2O2 detoxifying capability. After inoculation, the decrease in CAT activity in inoculated plants over uninoculated plants was more pronounced in susceptible genotypes (Figure 3). It is apparent that there is a lesser decrease in resistant genotypes as compared with susceptible genotypes and elevated H2O2 might have helped in delaying infection during biotrophic phase. Shetty et al. [54] also found that hemibiotrophic phytopathogens are highly sensitive to H2O2 just after inoculation. In the case of susceptible genotypes, comparatively higher decrease in CAT activity and elevated H2O2 level cause oxidative burst in living cells adjoining the infection site and finally cell death to benefit the necrotrophic phase of S. sclerotiorum. Previous reports also demonstrate the role of CAT in resistance against S. sclerotiorum in important crops viz. sunflower [49,50,51,55], oilseed rape [52] and non-heading Chinese cabbage [56].
Analysis of variance revealed significant effects of genotype (p < 0.0001), sampling times (p < 0.0001) and their interaction (p = 0.0077) on PPO activity and showed it a genotype and duration specific traits. PPO catalyzes oxidation of phenolics compounds to highly reactive antimicrobial compounds like o-quinones and also takes part in defense mechanism against phytopathogens through several ways. Direct toxicity of o-quinones against phytopathogens, alkylation of plant cellular proteins, cross-linking of quinones with proteins and other phenolic compounds ultimately form a physical barrier against pathogens [57,58]. PPO activity in present study was significantly higher in resistant genotypes as compared with susceptible ones at 6, 12, and 18 DAI (Figure 4). Observation reveals that its increased activity causes higher production of toxic products (o-quinones and H2O2) and induces cell wall lignification after S. sclerotiorum infection and therefore, provides greater resistance. Increase in PPO activity after inoculation showed a significant negative correlation with mean lesion length at 6 DAI which reveals its impact in delaying biotrophy to necrotrophy transition phase of a pathogen. It can be suggested that high PPO activity is involved in constitutive resistance mechanism against a pathogen which is in agreement with previous reports on various important crops including oilseed rape [53,59,60], non-heading Chinese cabbage [56], sunflower [48] and soybean [46,61].
In this study, we found that TSP is also a host genotype-specific and pathogen mediated trait (Table 3). Its accumulation was significantly higher in resistant genotypes as compared with susceptible genotypes in both uninoculated and inoculated conditions. These phenolic compounds provide resistance to hosts by neutralizing elevated ROS produced after a pathogenic attack. Being structural components of cell wall to provide rigidity (lignin and suberin), TSP retards the activity of cell wall degrading enzymes of fungal pathogens during pathogenesis [62,63,64,65,66,67,68,69]. Increase in TSP after inoculation was higher in resistant genotypes than susceptible genotypes especially at 6 and 12 DAI. It provides the plant enough time for adoption of secondary strategies like phytoalexins synthesis and lignin depositions which might further restrict the invasion of S. sclerotiorum and spread to uninfected cells. It can be predicted that TSP are key metabolites for genotypic resistance in Indian mustard. Relatively higher phenolics content associated with S. sclerotiorum resistance in sunflower and Phytophthora infestans resistance in potatoes have been reported [70,71,72,73].
Sugars, besides their typical role as carbon and energy source, also take part in many metabolic and signaling pathways in plants [74]. They act both as oxidant and antioxidant and have capability to maintain ROS homeostasis in cells under stressful conditions. Sugars not only participate in ROS production, but are also involved in NADPH-producing pathways like oxidative pentose phosphate pathway to detoxify them [20]. The present study shows insignificant genotypic difference for TSS in uninoculated plants, but it decreased after a pathogen infection which was higher in susceptible genotypes at all stages. Decrease in TSS content in inoculated plants over uninoculated plants was also significantly higher in susceptible genotypes at 6 DAI and continued to be higher as disease progressed. Decline in TSS content at inoculation site might be either due to their utilization by a pathogen or due to diminished photosynthetic rate. A comparatively higher TSS level under diseased conditions in resistant genotypes shows better sugar resistance mechanism as it stimulates flavonoids and PR proteins synthesis against a pathogen [75]. A significant positive correlation between percent deviation of TSS content and mean lesion length reveals that TSS variation significantly affects mean lesion length (disease amount) as high sugar reduction is associated with susceptibility (high mean lesion length) and vice versa. Similar findings against S. sclerotiorum in sunflower [50], Colletotrichum higginsianum in thale cress [76], Phomopsis theae in tea [77], Macrophomina phaseolina and Fusarium moniliforme in sorghum [78], and Plasmopara viticola in grapes [79] have previously been reported.
Biological processes are very complex and metabolic pathways are often interlinked together. Therefore, it is worthy to discuss all above parameters together because they are highly linked with each other to provide resistance against S. sclerotiorum. Cell wall reinforcement through lignification and suberization is a H2O2-dependent POX-mediated mechanism, and phenolics and sugars are involved at least partially in both. Besides, CAT is a chief competitor of POX for H2O2 scavenging and PPO is involved in phenolics oxidation. Therefore, we can suggest that above biochemical indices are inter-linked together and a combination of these mechanisms is possibly associated with resistance against S. sclerotiorum in Indian mustard.

4. Materials and Methods

4.1. Plant Materials

Six Indian mustard genotypes with contrasting response to sclerotinia rot were used in present study. Three resistant genotypes viz. RH 1222-28, DRMR 2035, and EC 597328 and three susceptible genotypes viz. RH 1566, RH 1569, and RH 1633 were obtained from Directorate of Rapeseed-Mustard Research, Bharatpur (Rajasthan) and Oilseeds Section, Department of Genetics and Plant Breeding, CCS Haryana Agricultural University, Hisar (Haryana), respectively [28]. All genotypes were raised in Randomized Complete Block Design (RCBD) during Rabi season of 2019–2020 with plot size of 4 rows of 5 m length in three replications having row to row spacing of 30 cm. Crops were raised at the research farm of Oilseed Section, Department of Genetics and Plant Breeding, CCS Haryana Agricultural University, Hisar.

4.2. Sclerotinia Sclerotiorum Inoculum Preparation and Disease Assessment

Sclerotia of S. sclerotiorum (Hisar isolate) were collected from sclerotinia rot-infected plants of Indian mustard, rigorously washed in tap water, and surface sanitized by immersing in 0.1% HgCl2 solution for 80–90 s. They were then rinsed 3–4 times with sterilized water to remove traces of disinfectant and aseptically transferred into Potato Dextrose Agar (PDA) containing Petri plates. Plates were incubated for seven days in BOD incubator at 25 ± 1 °C. PDA slants were used for maintenance of sclertoia’s mycelium pure culture. Five-day-old cultures of S. sclerotiorum were artificially inoculated on stems of ten randomly selected plants from middle of each row at post-flowering stage as per method followed by Li et al. [80]. Stem lesion length (cm) was recorded at 6, 12, and 18 days after inoculation (DAI) using a linear ruler. The genotypes were classified into five different groups based on mean lesion length (cm) on stems at 18 DAI as per scale suggested by Garg et al. [23]. The groups were highly resistant (mean lesion length <2.5), resistant (2.5–5.0), moderately resistant (5.0–7.5), susceptible (7.5–10.0), and highly susceptible (≥10.0) with their respective rating 0, 1, 2, 3, and 4, respectively.

4.3. Sample Collection and Biochemical Analysis

Samples were collected from stems immediately next to infection sites at 6, 12, and 18 DAI. The collected samples were immediately frozen in dry ice box and stored in liquid nitrogen until further biochemical studies.

4.4. Determination of Defense-Related Antioxidant Enzymatic Activities

Stem tissue (0.2 g) was homogenized in 3 mL of 0.1 M potassium phosphate buffer (pH 7.0) and centrifuged for 15 min at 10,000 rpm (4 °C). Supernatant was used for assaying peroxidase (POX), catalase (CAT), polyphenol oxidase (PPO), and total soluble protein [81]. Total soluble protein was assayed as per standard protocol of Lowry et al. [82] using bovine serum albumin (BSA) as standard. POX activity (EC 1.11.1.7) was assayed as per method of Maehly [83] with slight modifications. Reaction mixture (3.25 mL) contained 50 µL enzyme extract, 0.1 M potassium phosphate buffer (pH 7.0), 0.5 M H2O2, and 0.9 M guaiacol. Increase in absorbance was recorded at 470 nm after every 15 s interval for 2 min. Enzyme activity was calculated by employing molar extinction coefficient (26.6 mM−1 cm−1) and expressed as µmol of tetra guaiacol formed per min per mg protein. CAT activity (EC 1.11.1.6) was assayed as per method given by Aebi [84]. The reaction mixture (3.55 mL) contained 50 µL enzyme extract, 0.1 M potassium phosphate buffer (pH 7.0), and 0.1 M H2O2. Decrease in absorbance was recorded at 240 nm for 2 min after every 15s interval. Enzyme activity was calculated using molar extinction coefficient (39.4 mM−1 cm−1) and expressed as µmol of H2O2 oxidized per min per mg protein. PPO activity (EC 1.10.3.2) was calculated according to method described by Gauillard et al. [85] with minor modifications. Reaction mixture contained 100 µL enzyme extract, 0.1 M potassium phosphate buffer (pH 7.0) and 0.025 M catechol. Increase in absorbance was recorded at 410 nm for 2 min after every 15 s interval. Enzyme activity was estimated using molar extinction coefficient (2.9 mM−1 cm−1) and expressed as µmol of quinone produced per min per mg protein.

4.5. Quantification of Total Soluble Phenolics (TSP) and Total Soluble Sugar (TSS)

Stem tissue (0.2 g) was extracted with 5 mL of 80% methanol (v/v) at 80 °C for one hour and centrifuged at 10,000 rpm for 10 min. Procedure was repeated twice. Supernatants were pooled, concentrated to 1 mL using vacuum evaporator and used for quantification of TSP and TSS. TSP was estimated following the method of Bray and Thorpe [86] using catechol as standard and expressed as mg catechol equivalent per gram tissue on dry weight basis (mg CE g−1 DW). TSS was estimated following the method of Dubois et al. [87] and expressed as mg glucose equivalent per gram tissue on dry weight basis (mg GE g−1 DW).

4.6. Statistical Analysis

Mean lesion length (cm) was measured by taking sum of each lesion length divided by number. Data was subjected to analysis of variance (ANOVA). For analysis of biochemical parameters, experiment was conducted under factorial design (3 × 2 × 6) consisting of three sampling times (ST) (6, 12, and 18 DAI), two inoculation treatments (PI) [uninoculated (UI) and inoculated plants (I)] and six Indian mustard genotypes with contrasting behavior to sclerotinia rot (G) (three resistant (R1, R2, and R3) and three susceptible genotypes (S1, S2, and S3)). The Duncan Multiple Range Test (DMRT) was used for multiple comparisons of means. Additionally, Pearson product-moment correlation analysis was performed to assess correlation between mean lesion length and percent deviation for biochemical parameters in inoculated plants over uninoculated plants. All data were analyzed using SAS version 9.4 Statistical Package (SAS Institute Inc., Cary, NC, USA). AUDPC was calculated by using mean lesion length at 6, 12, and 18 DAI. Percent deviation for biochemical parameters in inoculated plants over uninoculated plants was calculated using the formula given below.
Percent   Deviation = Mean   values   in   inoculated   plants   mean   values   in   uninoculated   plants Mean   values   in   uninoculated   plants × 100

5. Conclusions

The findings from this study reveal that resistant genotypes have comparatively quicker, timely regulated, and strong antioxidant systems. They could restrict disease progression by higher activities of antioxidant enzymes and accumulating pigments after S. sclerotiorum infection. Higher TSP and highly induced POX activity especially during early infection and lesser depletion in TSS might be responsible for sclerotinia rot resistance in Indian mustard. This study improves upon the existing knowledge on antioxidant defense mechanisms; however, the transcriptomic profiling will be further line of research to confirm it.

Supplementary Materials

The following are available online at https://www.mdpi.com/2076-0817/9/11/892/s1. Table S1: Data on weather-related parameters viz. temperature, relative humidity and rainfall from the date of inoculation (20th January 2020) to date of last observation (6th February 2020).

Author Contributions

Conceptualization, R.A. and S.M.; methodology, R.A., S.M. and R.P.; software, M.S. and R.R.C.; validation, M.S., V.K.S., and M.B.; formal analysis, M.S. and A.S.; investigation, M.S.; writing—original draft, M.S.; writing—review and editing, S.M., R.A., and A.P.; visualization, M.S.; supervision, R.A. and S.M.; project administration, R.A. and funding acquisition, R.A. All authors have read and agreed to the published version of the manuscript.

Funding

This work was supported by the Indian Council of Agricultural Research (ICAR) (Research Scheme: C(b)PB-170-ICAR).

Acknowledgments

The authors are highly thankful to Rathi, A.S. (Principal Plant Pathologist), CCS Haryana Agricultural University, Hisar for his valuable suggestion for conducting this experiment.

Conflicts of Interest

The authors declare no conflict of interest.

References

  1. Renjini, V.R.; Jha, G.K. Oilseeds sector in India: A trade policy perspective. Indian J. Agric. Sci. 2019, 89, 73–80. [Google Scholar]
  2. Jat, R.S.; Singh, V.V.; Sharma, P.; Rai, P.K. Oilseed brassica in India: Demand, supply, policy perspective and future potential. OCL 2019, 26, 8. [Google Scholar] [CrossRef] [Green Version]
  3. Chattopadhyay, C.; Kolte, S.J. Diseases. In Brassica Oilseeds: Breeding and Management; Kumar, A., Banga, S.S., Meena, P.D., Kumar, P.R., Eds.; CABI: Croydon, UK, 2015; pp. 115–147. [Google Scholar]
  4. Rana, K.; Atri, C.; Gupta, M.; Akhatar, J.; Sandhu, P.S.; Kumar, N.; Jaswal, R.; Barbetti, M.J.; Banga, S.S. Mapping resistance responses to Sclerotinia infestation in introgression lines of Brassica juncea carrying genomic segments from wild Brassicaceae B. fruticulosa. Sci. Rep. 2017, 7, 1–12. [Google Scholar] [CrossRef]
  5. Mahalingam, T.; Chen, W.; Rajapakse, C.S.; Somachandra, K.P.; Attanayake, R.N. Genetic Diversity and Recombination in the Plant Pathogen Sclerotinia sclerotiorum Detected in Sri Lanka. Pathogens 2020, 9, 306. [Google Scholar] [CrossRef] [PubMed]
  6. Saharan, G.S.; Mehta, N. The disease and symptoms. In Sclerotinia Diseases of Crop Plants: Biology, Ecology and Disease Management, 1st ed.; Springer: Dordrecht, The Netherlands, 2008; pp. 47–70. [Google Scholar]
  7. Sharma, P.; Samkumar, A.; Rao, M.; Singh, V.V.; Prasad, L.; Mishra, D.C.; Bhattacharya, R.; Gupta, N.C. Genetic diversity studies based on morphological variability, pathogenicity and molecular phylogeny of the Sclerotinia sclerotiorum population from Indian mustard (Brassica juncea). Front. Microbiol. 2018, 9, 1169. [Google Scholar] [CrossRef] [PubMed]
  8. Xia, S.; Xu, Y.; Hoy, R.; Zhang, J.; Qin, L.; Li, X. The Notorious Soilborne Pathogenic Fungus Sclerotinia sclerotiorum: An Update on Genes Studied with Mutant Analysis. Pathogens 2020, 9, 27. [Google Scholar] [CrossRef] [PubMed] [Green Version]
  9. Kabbage, M.; Yarden, O.; Dickman, M.B. Pathogenic attributes of Sclerotinia sclerotiorum: Switching from a biotrophic to necrotrophic lifestyle. Plant Sci. 2015, 233, 53–60. [Google Scholar] [CrossRef]
  10. Hegedus, D.D.; Rimmer, S.R. Sclerotinia sclerotiorum: When “to be or not to be” a pathogen? FEMS Microbiol. Lett. 2005, 251, 177–184. [Google Scholar] [CrossRef] [Green Version]
  11. Uloth, M.B.; Clode, P.L.; You, M.P.; Barbetti, M.J. Attack modes and defence reactions in pathosystems involving Sclerotinia sclerotiorum, Brassica carinata, B. juncea and B. napus. Ann. Bot. 2016, 117, 79–95. [Google Scholar] [CrossRef] [Green Version]
  12. Peltier, A.J.; Hatfield, R.D.; Grau, C.R. Soybean stem lignin concentration relates to resistance to Sclerotinia sclerotiorum. Plant Dis. 2009, 93, 149–154. [Google Scholar] [CrossRef] [Green Version]
  13. Sharma, P.; Jha, A.B.; Dubey, R.S.; Pessarakli, M. Reactive oxygen species, oxidative damage, and antioxidative defense mechanism in plants under stressful conditions. J. Bot. 2012, 2012, 1–26. [Google Scholar] [CrossRef] [Green Version]
  14. Paiva, C.N.; Bozza, M.T. Are reactive oxygen species always detrimental to pathogens? Antioxid. Redox Signal. 2014, 20, 1000–1037. [Google Scholar] [CrossRef] [PubMed] [Green Version]
  15. Xie, X.; He, Z.; Chen, N.; Tang, Z.; Wang, Q.; Cai, Y. The roles of environmental factors in regulation of oxidative stress in plant. Biomed. Res. Int. 2019, 2019, 1–15. [Google Scholar] [CrossRef]
  16. Caverzan, A.; Casassola, A.; Brammer, S.P. Reactive oxygen species and antioxidant enzymes involved in plant tolerance to stress. In Abiotic and Biotic Stress in Plants-Recent Advances and Future Perspectives; Shanker, A.K., Shanker, C., Eds.; InTechOpen: Rijeka, Croatia, 2016; pp. 463–480. [Google Scholar]
  17. Ali, M.; Cheng, Z.; Ahmad, H.; Hayat, S. Reactive oxygen species (ROS) as defenses against a broad range of plant fungal infections and case study on ROS employed by crops against Verticillium dahliae wilts. J. Plant Interact. 2018, 13, 353–363. [Google Scholar] [CrossRef] [Green Version]
  18. Boeckx, T.; Winters, A.L.; Webb, K.J.; Kingston-Smith, A.H. Polyphenol oxidase in leaves: Is there any significance to the chloroplastic localization? J. Exp. Bot. 2015, 66, 3571–3579. [Google Scholar] [CrossRef] [Green Version]
  19. Taheri, P.; Kakooee, T. Reactive oxygen species accumulation and homeostasis are involved in plant immunity to an opportunistic fungal pathogen. J. Plant Physiol. 2017, 216, 152–163. [Google Scholar] [CrossRef]
  20. Couee, I.; Sulmon, C.; Gouesbet, G.; and El Amrani, A. Involvement of soluble sugars in reactive oxygen species balance and responses to oxidative stress in plants. J. Exp. Bot. 2006, 57, 449–459. [Google Scholar] [CrossRef]
  21. Jiang, S.; Han, S.; He, D.; Cao, G.; Fang, K.; Xiao, X.; Yi, J.; Wan, X. The accumulation of phenolic compounds and increased activities of related enzymes contribute to early defense against walnut blight. Physiol. Mol. Plant Pathol. 2019, 108, 101433. [Google Scholar] [CrossRef]
  22. Wen, L. Cell death in plant immune response to necrotrophs. J. Plant Biochem. Physiol. 2013, 1, 1–3. [Google Scholar] [CrossRef] [Green Version]
  23. Garg, H.; Atri, C.; Sandhu, P.S.; Kaur, B.; Renton, M.; Banga, S.K.; Singh, H.; Singh, C.; Barbetti, M.J.; Banga, S.S. High level of resistance to Sclerotinia sclerotiorum in introgression lines derived from hybridization between wild crucifers and the crop Brassica species B. napus and B. juncea. Field Crops Res. 2010, 117, 51–58. [Google Scholar] [CrossRef]
  24. Andersen, E.J.; Ali, S.; Byamukama, E.; Yen, Y.; Nepal, M.P. Disease resistance mechanisms in plants. Genes 2018, 9, 339. [Google Scholar] [CrossRef] [PubMed] [Green Version]
  25. Sun, J.; Cao, L.; Li, H.; Wang, G.; Wang, S.; Li, F.; Zou, X.; Wang, J. Early responses given distinct tactics to infection of Peronophythora litchii in susceptible and resistant litchi cultivar. Sci. Rep. 2019, 9, 1–14. [Google Scholar] [CrossRef] [PubMed] [Green Version]
  26. Mehta, N. Epidemiology and forecasting for the management of rapeseed-mustard diseases. J. Mycol. Plant Pathol. 2014, 44, 131–147. [Google Scholar]
  27. Berger, R.D.; Filho, A.B.; Amorim, L. Lesion expansion as an epidemic component. Phytopathology 1997, 87, 1005–1013. [Google Scholar] [CrossRef] [PubMed]
  28. Sharma, P.; Singh, S.; Singh, V.V.; Gupta, N.C.; Prasad, L.; Meena, P.D.; Ambawat, S.; Rai, P.K. Identification and characterization of new resistance sources against Sclerotinia stem rot (Sclerotinia sclerotiorum) in oilseed brassica. Indian J. Mycol. Plant Pathol. 2018, 48, 35–44. [Google Scholar]
  29. Uloth, M.B.; You, M.P.; Cawthray, G.; Barbetti, M.J. Temperature adaptation in isolates of Sclerotinia sclerotiorum affects their ability to infect Brassica carinata. Plant Pathol. 2015, 64, 1140–1148. [Google Scholar] [CrossRef]
  30. Denton-Giles, M.; Derbyshire, M.C.; Khentry, Y.; Buchwaldt, L.; Kamphuis, L.G. Partial stem resistance in Brassica napus to highly aggressive and genetically diverse Sclerotinia sclerotiorum isolates from Australia. Can. J. Plant Pathol. 2018, 40, 551–561. [Google Scholar] [CrossRef] [Green Version]
  31. Gyawali, S.; Harrington, M.; Durkin, J.; Horner, K.; Parkin, I.A.; Hegedus, D.D.; Bekkaoui, D.; Buchwaldt, L. Microsatellite markers used for genome-wide association mapping of partial resistance to Sclerotinia sclerotiorum in a world collection of Brassica napus. Mol. Breeding 2016, 36, 72. [Google Scholar] [CrossRef] [Green Version]
  32. McCaghey, M.; Willbur, J.; Smith, D.L.; Kabbage, M. The complexity of the Sclerotinia sclerotiorum pathosystem in soybean: Virulence factors, resistance mechanisms, and their exploitation to control Sclerotinia stem rot. Trop. Plant Pathol. 2019, 44, 12–22. [Google Scholar] [CrossRef]
  33. Moellers, T.C.; Singh, A.; Zhang, J.; Brungardt, J.; Kabbage, M.; Mueller, D.S.; Grau, C.R.; Ranjan, A.; Smith, D.L.; Chowda-Reddy, R.V.; et al. Main and epistatic loci studies in soybean for Sclerotinia sclerotiorum resistance reveal multiple modes of resistance in multi-environments. Sci. Rep. 2017, 7, 1–13. [Google Scholar] [CrossRef] [Green Version]
  34. Auclair, J.; Boland, G.J.; Cober, E.; Graef, G.L.; Steadman, J.R.; Zilka, J.; Rajcan, I. Development of a new field inoculation technique to assess partial resistance in soybean to Sclerotinia sclerotiorum. Can. J. Plant Sci. 2004, 84, 57–64. [Google Scholar] [CrossRef] [Green Version]
  35. Amoozadeh, A.L.; Darvishzadeh, R.; Davar, R.; Mandoulakani, B.A.; Haddadi, P.; Basirnia, A. Quantitative trait loci associated with isolate specific and isolate non-specific partial resistance to Sclerotinia sclerotiorum in sunflower. J. Agr. Sci. Tech. Iran 2015, 17, 213–226. [Google Scholar]
  36. Davar, R.; Darvishzadeh, R.; Majd, A.; Ghosta, Y.; Sarrafi, A. QTL mapping of partial resistance to basal stem rot in sunflower using recombinant inbred lines. Phytopathol. Mediterr. 2010, 49, 330–341. [Google Scholar]
  37. Liu, R.; Ding, L.N.; Li, M.; Cao, W.; Wang, Y.K.; Wang, W.J.; Yu, Y.K.; Wang, Z.; Zhu, K.M.; Tan, X.L. Characterization of a Rapeseed Anthocyanin-More Mutant with Enhanced Resistance to Sclerotinia sclerotiorum. J. Plant Growth Regul. 2019, 39, 1–14. [Google Scholar] [CrossRef]
  38. Liu, Y.; Tikunov, Y.; Schouten, R.E.; Marcelis, L.F.; Visser, R.G.; Bovy, A. Anthocyanin biosynthesis and degradation mechanisms in Solanaceous vegetables: A review. Front. Chem. 2018, 6, 52. [Google Scholar] [CrossRef] [PubMed]
  39. Xu, Z.; Rothstein, S.J. ROS-Induced anthocyanin production provides feedback protection by scavenging ROS and maintaining photosynthetic capacity in Arabidopsis. Plant Signal. Behav. 2018, 13, 1364–1377. [Google Scholar] [CrossRef] [PubMed] [Green Version]
  40. Calla, B.; Vuong, T.; Radwan, O.; Hartman, G.L.; Clough, S.J. Gene expression profiling soybean stem tissue early response to Sclerotinia sclerotiorum and in silico mapping in relation to resistance markers. Plant Genome 2009, 2, 149–166. [Google Scholar] [CrossRef] [Green Version]
  41. Glazebrook, J. Contrasting mechanisms of defense against biotrophic and necrotrophic pathogens. Annu. Rev. Phytopathol. 2005, 43, 205–227. [Google Scholar] [CrossRef]
  42. Vargas, W.A.; Martín, J.M.S.; Rech, G.E.; Rivera, L.P.; Benito, E.P.; Díaz-Mínguez, J.M.; Thon, M.R.; Sukno, S.A. Plant defense mechanisms are activated during biotrophic and necrotrophic development of Colletotricum graminicola in maize. Plant Physiol. 2012, 158, 1342–1358. [Google Scholar] [CrossRef] [Green Version]
  43. Almagro, L.; Gómez Ros, L.V.; Belchi-Navarro, S.; Bru, R.; Ros Barceló, A.; Pedreno, M.A. Class III peroxidases in plant defence reactions. J. Exp. Bot. 2009, 60, 377–390. [Google Scholar] [CrossRef] [Green Version]
  44. Shigeto, J.; Tsutsumi, Y. Diverse functions and reactions of class III peroxidases. New Phytol. 2016, 209, 1395–1402. [Google Scholar] [CrossRef] [PubMed] [Green Version]
  45. Ranjan, A.; Westrick, N.M.; Jain, S.; Piotrowski, J.S.; Ranjan, M.; Kessens, R.; Stiegman, L.; Grau, C.R.; Conley, S.P.; Smith, D.L.; et al. Resistance against Sclerotinia sclerotiorum in soybean involves a reprogramming of the phenylpropanoid pathway and up-regulation of antifungal activity targeting ergosterol biosynthesis. Plant Biotechnol. J. 2019, 17, 1567–1581. [Google Scholar] [CrossRef] [PubMed] [Green Version]
  46. Lv, C.-M.; Zhao, Y.; Zhao, X.; Wang, Q.; Meng, X.-X.; Wei, S.-H.; Han, Y.-P.; Li, W.-B.; Zhang, J.-H. Biochemical resistance mechanism of soybean cultivar Maple Arrow to Sclerotinia sclerotiorum. Chin. J. Oil Crop Sci. 2014, 36, 630. [Google Scholar]
  47. Leite, M.E.; Dos Santos, J.B.; Ribeiro, P.M.; de Souza, D.A.; de Castro Lara, L.A.; de Resende, M.L.V. Biochemical responses associated with common bean defence against Sclerotinia sclerotiorum. Eur. J. Plant Pathol. 2014, 138, 391–404. [Google Scholar] [CrossRef]
  48. Monazzah, M.; Tahmasebi Enferadi, S.; Rabiei, Z. Enzymatic activities and pathogenesis-related genes expression in sunflower inbred lines affected by Sclerotinia sclerotiorum culture filtrate. J. Appl. Microbiol. 2018, 125, 227–242. [Google Scholar] [CrossRef] [PubMed]
  49. Na, R.; Luo, Y.; Bo, H.; Jia, R.; Meng, Q.; Zhou, H.; Hao, J.; Zhao, J. Responses of sunflower induced by Sclerotinia sclerotiorum infection. Physiol. Mol. Plant Pathol. 2018, 102, 113–121. [Google Scholar] [CrossRef]
  50. Liu, J.; Zhang, Y.; Meng, Q.; Shi, F.; Ma, L.; Li, Y. Physiological and biochemical responses in sunflower leaves infected by Sclerotinia sclerotiorum. Physiol. Mol. Plant Pathol. 2017, 100, 41–48. [Google Scholar] [CrossRef]
  51. Davar, R.; Darvishzadeh, R.; Majd, A. Changes in antioxidant systems in sunflower partial resistant and susceptible lines as affected by Sclerotinia sclerotiorum. Biologia 2013, 68, 821–829. [Google Scholar] [CrossRef]
  52. Wen, L.; Tan, T.L.; Shu, J.B.; Chen, Y.; Liu, Y.; Yang, Z.F.; Zhang, Q.P.; Yin, M.Z.; Tao, J.; Guan, C.Y. Using proteomic analysis to find the proteins involved in resistance against Sclerotinia sclerotiorum in adult Brassica napus. Eur. J. Plant Pathol. 2013, 137, 505–523. [Google Scholar] [CrossRef]
  53. Qi, S.W.; Guan, C.Y.; Liu, C.L. Relationship between some enzyme activity and resistance to Sclerotinia sclerotiorum of rapeseed cultivars. Zuo Wu Xue Bao 2004, 30, 270–273. [Google Scholar]
  54. Shetty, N.P.; Mehrabi, R.; Lütken, H.; Haldrup, A.; Kema, G.H.; Collinge, D.B.; Jørgensen, H.J.L. Role of hydrogen peroxide during the interaction between the hemibiotrophic fungal pathogen Septoria tritici and wheat. New Phytol. 2007, 174, 637–647. [Google Scholar] [CrossRef] [PubMed]
  55. Peluffo, L.; Lia, V.; Troglia, C.; Maringolo, C.; Norma, P.; Escande, A.; Hopp, H.E.; Lytovchenko, A.; Fernie, A.R.; Heinz, R.; et al. Metabolic profiles of sunflower genotypes with contrasting response to Sclerotinia sclerotiorum infection. Phytochemistry 2010, 71, 70–80. [Google Scholar] [CrossRef] [PubMed]
  56. Ma, J.; Liu, X.; Liu, J.; Wang, H. Changes of protective enzymes activities responding to Sclerotinia sclerotiorum inoculation in non-heading Chinese cabbages. Jiangsu J. Agric. Sci. 2012, 28, 1403–1408. [Google Scholar]
  57. Taranto, F.; Pasqualone, A.; Mangini, G.; Tripodi, P.; Miazzi, M.M.; Pavan, S.; Montemurro, C. Polyphenol oxidases in crops: Biochemical, physiological and genetic aspects. Int. J. Mol. Sci. 2017, 18, 377. [Google Scholar] [CrossRef]
  58. Constabel, C.P.; Barbehenn, R. Defensive roles of polyphenol oxidase in plants. In Induced Plant Resistance to Herbivory; Schaller, A., Ed.; Springer: Dordrecht, The Netherlands, 2008; pp. 253–270. [Google Scholar]
  59. Ni, Y.; Guo, Y.J.; Wang, J.; Xia, R.E.; Wang, X.Q.; Ash, G.; Li, J.N. Responses of physiological indexes and leaf epicuticular waxes of Brassica napus to Sclerotinia sclerotiorum infection. Plant Pathol. 2014, 63, 174–184. [Google Scholar] [CrossRef] [Green Version]
  60. Wang, H.; Liu, G.; Zheng, Y.; Wang, X.; Yang, Q. Breeding of the Brassica napus cultivar Zhongshuang 9 with high-resistance to Sclerotinia sclerotiorum and dynamics of its important defense enzyme activity. Sci. Agri. Sin. 2004, 37, 23–28. [Google Scholar]
  61. Yang, X.; Yang, J.; Li, H.; Niu, L.; Xing, G.; Zhang, Y.; Xu, W.; Zhao, Q.; Li, Q.; Dong, Y. Overexpression of the chitinase gene CmCH1 from Coniothyrium minitans renders enhanced resistance to Sclerotinia sclerotiorum in soybean. Transgenic Res. 2020, 29, 187–198. [Google Scholar] [CrossRef]
  62. Nicholson, R.L.; Hammerschmidt, R. Phenolic compounds and their role in disease resistance. Annu. Rev. Phytopathol. 1992, 30, 369–389. [Google Scholar] [CrossRef]
  63. Lin, D.; Xiao, M.; Zhao, J.; Li, Z.; Xing, B.; Li, X.; Kong, M.; Li, L.; Zhang, Q.; Liu, Y.; et al. An overview of plant phenolic compounds and their importance in human nutrition and management of type 2 diabetes. Molecules 2016, 21, 1374. [Google Scholar] [CrossRef]
  64. Rahaman, M.M.; Zwart, R.S.; Thompson, J.P. Constitutive and Induced Expression of Total Phenol and Phenol Oxidases in Wheat Genotypes Ranging in Resistance/Susceptibility to the Root-Lesion Nematode Pratylenchus thornei. Plants 2020, 9, 485. [Google Scholar] [CrossRef] [Green Version]
  65. Wallace, G.; Fry, S.C. Phenolic components of the plant cell wall. In International Review of Cytology, 1st ed.; Jeon, K.W., Jarvik, J., Eds.; Elsevier B.V.: Amsterdam, The Netherlands, 1994; Volume 151, pp. 229–267. [Google Scholar]
  66. Lattanzio, V.; Lattanzio, V.M.; Cardinali, A. Role of phenolics in the resistance mechanisms of plants against fungal pathogens and insects. In Phytochemistry: Advances in Research; Imperato, F., Ed.; Research Signpost: Trivandrum, India, 2006; pp. 23–67. [Google Scholar]
  67. Skłodowska, M.; Mikiciński, A.; Wielanek, M.; Kuźniak, E.; Sobiczewski, P. Phenolic profiles in apple leaves and the efficacy of selected phenols against fire blight (Erwinia amylovora). Eur. J. Plant Pathol. 2018, 151, 213–228. [Google Scholar] [CrossRef] [Green Version]
  68. Mandavia, M.K.; Gajera, H.P.; Andharia, J.H.; Khandar, R.R.; Parameswaran, M. Cell wall degrading enzymes in host-pathogen interaction of Fusarium wilt of chickpea: Inhibitory effects of phenolic compounds. Indian Phytopathol. 1999, 52, 285–288. [Google Scholar]
  69. Sharma, S.; Harmandeep; Soni, G. Interaction of phenolic compounds with pectinases from Sclerotinia sclerotiorum. Indian Phytopath. 2001, 54, 167–170. [Google Scholar]
  70. Rodríguez, M.A.; Venedikian, N.; Bazzalo, M.E.; Godeas, A. Histopathology of Sclerotinia sclerotiorum attack on flower parts of Helianthus annuus heads in tolerant and susceptible varieties. Mycopathologia 2004, 157, 291–302. [Google Scholar] [CrossRef] [PubMed]
  71. Prats, E.; Bazzalo, M.E.; León, A.; Jorrín, J.V. Accumulation of soluble phenolic compounds in sunflower capitula correlates with resistance to Sclerotinia sclerotiorum. Euphytica 2003, 132, 321–329. [Google Scholar] [CrossRef] [Green Version]
  72. Bazzalo, M.E.; Dimarco, P.; Martinez, F.; Daleo, G.R. Indicators of resistance of sunflower plant to basal stalk rot (Sclerotinia sclerotiorum): Symptomatological, biochemical, anatomical, and morphological characters of the host. Euphytica 1991, 57, 195–205. [Google Scholar] [CrossRef]
  73. El_Komy, M.H.; Saleh, A.A.; Ibrahim, Y.E.; Molan, Y.Y. Early production of reactive oxygen species coupled with an efficient antioxidant system play a role in potato resistance to late blight. Trop. Plant Pathol. 2020, 45, 44–55. [Google Scholar] [CrossRef]
  74. Hellmann, H.A.; Smeekens, S. Sugar sensing and signaling in plants. Front. Plant Sci. 2014, 5, 113. [Google Scholar]
  75. Hura, K.; Hura, T.; Dziurka, K.; Dziurka, M. Carbohydrate, phenolic and antioxidant level in relation to chlorophyll a content in oilseed winter rape (Brassica napus L.) inoculated with Leptosphaeria maculans. Eur. J. Plant Pathol. 2015, 143, 291–303. [Google Scholar] [CrossRef] [Green Version]
  76. Engelsdorf, T.; Horst, R.J.; Pröls, R.; Pröschel, M.; Dietz, F.; Hückelhoven, R.; Voll, L.M. Reduced carbohydrate availability enhances the susceptibility of Arabidopsis toward Colletotrichum higginsianum. Plant Physiol. 2013, 162, 225–238. [Google Scholar] [CrossRef] [Green Version]
  77. Ponmurugan, P.; Baby, U.I. Morphological, physiological and biochemical changes in resistant and susceptible cultivars of tea in relation to phomopsis disease. Plant Pathol. J. 2007, 6, 91–94. [Google Scholar]
  78. Bandara, Y.M.A.Y.; Tesso, T.T.; Zhang, K.; Wang, D.; Little, C.R. Charcoal rot and Fusarium stalk rot diseases influence sweet sorghum sugar attributes. Ind. Crops Prod. 2018, 112, 188–195. [Google Scholar] [CrossRef]
  79. Qi, H.X.; Wang, T.K.; Qi, Y.S.; Zhang, J.Z.; Liu, Y.J.; Li, S.M. Studies on the leaf biochemical and physiological changes of resistant and susceptible grape cultivars infected by Plasmopara viticola J. Int. J. Fruit Sci. 2006, 23, 73–76. [Google Scholar]
  80. Li, C.X.; Li, H.; Sivasithamparam, K.; Fu, T.D.; Li, Y.C.; Liu, S.Y.; Barbetti, M.J. Expression of field resistance under Western Australian conditions to Sclerotinia sclerotiorum in Chinese and Australian Brassica napus and Brassica juncea germplasm and its relation with stem diameter. Aust. J. Agric. Res. 2006, 57, 1131–1135. [Google Scholar] [CrossRef]
  81. Sen, A.; Alikamanoglu, S. Antioxidant enzyme activities, malondialdehyde, and total phenolic content of PEG-induced hyperhydric leaves in sugar beet tissue culture. In Vitro Cell. Dev. Biol. 2013, 49, 396–404. [Google Scholar] [CrossRef]
  82. Lowry, O.H.; Rosebrough, N.J.; Farr, A.L.; Randall, R.J. Protein measurement with the Folin phenol reagent. J. Biol. Chem. 1951, 193, 265–275. [Google Scholar]
  83. Maehly, A.C. The assay of catalase and peroxidases. In Methods of Biochemical Analysis; Glick, D., Ed.; Interscience Publishers, Inc.: New York, NY, USA, 1954; Volume 1, pp. 357–424. [Google Scholar]
  84. Aebi, H. Catalase in vitro. In Methods in Enzymology; Packer, L., Ed.; Academic Press: New York, NY, USA, 1984; Volume 105, pp. 121–126. [Google Scholar]
  85. Gauillard, F.; Richardforget, F.; Nicolas, J. New spectrophotometric assay for polyphenol oxidase activity. Anal. Biochem. 1993, 215, 59–65. [Google Scholar] [CrossRef]
  86. Bray, H.G.; Thorpe, W.V. Analysis of phenolic compounds of interest in metabolism. In Methods of Biochemical Analysis; Glick, D., Ed.; Interscience Publishers, Inc.: New York, NY, USA, 1954; Volume 1, pp. 27–52. [Google Scholar]
  87. Dubois, M.; Gilles, K.A.; Hamilton, J.K.; Rebers, P.T.; Smith, F. Colorimetric method for determination of sugars and related substances. Anal. Chem. 1956, 28, 350–356. [Google Scholar] [CrossRef]
Figure 1. Lifecycle of S. sclerotiorum on Indian mustard.
Pathogens 09 00892 g001
Figure 2. Comparison of percent increase in POX activity after S. sclerotiorum inoculation and mean lesion length (MLL) among different Indian mustard genotypes at 6, 12, and 18 DAI. (R—Resistant, S—Susceptible).
Pathogens 09 00892 g002
Figure 3. Comparison of percent decrease in CAT activity after S. sclerotiorum inoculation and mean lesion length (MLL) among different Indian mustard genotypes at 6, 12 and 18 DAI. R—Resistant, S—Susceptible.
Pathogens 09 00892 g003
Figure 4. Comparison of percent increase in PPO activity after S. sclerotiorum inoculation and mean lesion length (MLL) among different Indian mustard genotypes at 6, 12, and 18 DAI. R—Resistant, S—Susceptible.
Pathogens 09 00892 g004
Figure 5. Comparison of percent increase in TSP after S. sclerotiorum inoculation and mean lesion length (MLL) among different Indian mustard genotypes at 6, 12, and 18 DAI. R—Resistant, S—Susceptible.
Pathogens 09 00892 g005
Figure 6. Comparison of percent decrease in TSS after S. sclerotiorum inoculation and mean lesion length (MLL) among different Indian mustard genotypes at 6, 12, and 18 DAI. R—Resistant, S—Susceptible.
Pathogens 09 00892 g006
Figure 7. Resistance response of different Indian mustard genotypes against Sclerotinia sclerotiorum. (a) Extreme resistance shown by genotype RH 1222-28 and (b) DRMR 2035 with purple coloration extending on both sides of the inoculation site. (c) Typical susceptible response with lesion length >7.5cm shown by genotype RH 1566. (d) Stem breakage and high degree of susceptibility in genotype RH 1569 (plant collapsed).
Pathogens 09 00892 g007
Table 1. Analysis of variance for mean lesion length on stems due to S. sclerotiorum inoculation.
Source of Variationdfp Value
Lesion length (6 DAI)5<0.0001
Lesion length (12 DAI)5<0.0001
Lesion length (18 DAI)5<0.0001
DAI-Days After Inoculation, df-degree of freedom.
Table 2. Disease progression characterization parameters for different Indian mustard genotypes at 6, 12, and 18 days after inoculation (DAI).
GenotypeMean Lesion Length (cm)Rate of Increase in Lesion Length (cm day-1)AUDPC *Disease Response **
6 DAI12 DAI18 DAI6 DAI12 DAI18 DAI
RH 1222-280.72 d2.58 b4.16 c0.120.310.2632.28Resistant
DRMR 20350.91 d2.06 b2.48 c0.150.190.0725.26Highly Resistant
EC 5973281.70 c3.19 b4.73 c0.280.250.2643.53Resistant
RH 15665.22 a7.30 a8.91 b0.870.350.27101.85Susceptible
RH 15694.68 b8.24 a11.95 a0.760.590.62113.37Highly Susceptible
RH 16334.39 b7.40 a10.81 ab0.730.500.57103.17Highly Susceptible
Treatment means in the same columns with different letters differ significantly (p < 0.05). * AUDPC—Area Under Disease Progress Curve, ** Disease response was measured on the basis of mean lesion length at 18 DAI as per scale given by Garg et al. [23].
Table 3. Analysis of variance of the effect of sampling times (ST), plant inoculation (PI), and Indian mustard genotypes with different response to sclerotinia rot (G) and their interactions on the peroxidase activity (POX), catalase activity (CAT), polyphenol oxidase activity (PPO), total soluble phenolics (TSP), and total soluble sugar (TSS) content.
p Values
Sources of VariationdfPOXCATPPOTSPTSS
ST2<0.0001<0.0001<0.00010.0283<0.0001
PI1<0.0001<0.0001<0.0001<0.0001<0.0001
G50.0002<0.0001<0.0001<0.0001<0.0001
ST X PI20.0002NSNSNSNS
ST X G10<0.0001NS0.0077NS0.0120
PI X G50.0003<0.0001NS0.0001<0.0001
ST X PI X G10<0.0001NSNSNSNS
NS—Nonsignificant, df—degree of freedom.
Table 4. Mean comparison for interaction of sampling time (ST), plant inoculation, and Indian mustard genotypes (G) with contrasting behavior to sclerotinia rot on the peroxidase activity (POX), catalase activity (CAT), polyphenol oxidase activity (PPO), total soluble phenolics (TSP), and total soluble sugar (TSS).
DAI/PI/GPOX µmol min −1 mg −1 ProteinCAT µmol min −1 mg −1 ProteinPPO µmol min −1 mg −1 ProteinTSP mg g −1 DWTSS mg g −1 DW
6DAI/UI/R12.96 e–g6.60 ab1.03 a−c0.98 b−d46.37 c
6DAI/UI/R22.87 e−g7.08 a1.38 a−c1.00 b−d48.30 b
6DAI/UI/R33.21 d−g6.22 a−c1.21 a−c0.94 b−d49.74 a
6DAI/UI/S13.02 d−g5.98 b−d0.79 bc0.79 cd48.60 b
6DAI/UI/S22.86 e−g6.05 b−d0.69 bc0.71 cd46.64 c
6DAI/UI/S32.98 e−g5.84 b−f0.59 bc0.63 d47.82 b
6DAI/I/R15.32 ab5.45 c−h1.56 ab2.06 a41.07 f−h
6DAI/I/R25.98 a6.01 b−d1.90 a1.68 a−d40.62 gh
6DAI/I/R35.16 ab4.93 e−i1.60 ab1.31 a−d39.51 i
6DAI/I/S13.64 c−e3.71 k−m0.93 a−c0.96 b−d31.81 p
6DAI/I/S23.21 d−g2.86 mn0.83 bc0.95 b−d32.50 op
6DAI/I/S33.11 d−g3.11 l−n0.66 bc0.84 b−d28.73 q
12DAI/UI/R12.63 e−g5.56 c−g0.94 a−c1.09 a−d41.34 fg
12DAI/UI/R22.75 e−g5.87 b−e1.27 a−c1.18 a−d40.33 hi
12DAI/UI/R32.98 e−g5.35 c−h0.92 a−c1.03 b−d44.08 d
12DAI/UI/S12.54 fg5.13 d−h0.80 bc0.91 b−d42.50 e
12DAI/UI/S22.70 e−g5.48 c−h0.63 bc0.78 cd40.62 gh
12DAI/UI/S32.89 e−g4.93 e−i0.66 bc0.75 cd41.92 ef
12DAI/I/R14.97 b4.96 e−i1.26 a−c1.89 ab38.16 j
12DAI/I/R24.49 bc5.35 c−h1.54 ab1.74 a−c35.41 l
12DAI/I/R33.21 d-g4.12 i−k1.14 a−c1.58 a−d37.45 j
12DAI/I/S13.28 d−f2.39 no0.96 a−c1.24 a−d27.52 r
12DAI/I/S23.64 c−e2.48 no0.70 bc1.05 a−d21.42 t
12DAI/I/S33.99 cd2.33 no0.72 bc0.88 b−d24.46 s
18DAI/UI/R12.51 fg4.86 f−j0.78 bc1.17 a−d34.35 m
18DAI/UI/R22.39 fg5.31 c−h0.96 a−c1.23 a−d36.61 k
18DAI/UI/R32.43 fg4.67 g−k0.67 bc1.06 a−d40.78 gh
18DAI/UI/S12.19 g4.53 h−k0.59 bc0.98 b−d35.33 l
18DAI/UI/S22.51 fg4.12 i−k0.46 c0.90 b−d34.43 m
18DAI/UI/S32.30 fg4.81 g−j0.55 bc0.84 b−d35.32 l
18DAI/I/R12.85 e−g4.51 h−k0.93 a−c1.60 a−d33.28 no
18DAI/I/R22.53 fg5.12 d−h1.21 a−c1.49 a−d34.43 m
18DAI/I/R32.75 e−g3.89 j−l0.89 a−c1.36 a−d33.87 mn
18DAI/I/S13.06 d−g2.29 no0.67 bc1.34 a−d18.11 u
18DAI/I/S23.16 d−g1.71 op0.58 bc1.14 a−d12.43 w
18DAI/I/S32.94 e−g1.23 p0.64 bc1.02 b−d14.48 v
Treatment means in the same columns with different letters differ significantly (p < 0.05). The design consisted of three sampling times (ST) (6, 12, and 18 days after inoculation (DAI)), two inoculation treatment (PI) (uninoculated plants (UI) and inoculated plants (I)), and six Indian mustard genotypes with contrasting behavior to sclerotinia rot (G) (3 Resistant (R1, R2, and R3) and 3 susceptible (S1, S2, and S3)) (R1-RH 1222-28, R2-DRMR 2035, R3-EC 597328, S1-RH 1566, S2-RH 1569, S3-RH 1633).
Table 5. The Pearson’s product-moment correlation matrix between mean lesion length (cm) and percent deviation (PD) for peroxidase (POX), catalase (CAT), polyphenol oxidase (PPO) activities, total soluble phenolics (TSP), and total soluble sugar (TSS) in inoculated plants over uninoculated plants at different sampling times viz. 6, 12, and 18 DAI.
Per Cent Deviation (PD)Mean Lesion Length (cm)
6 DAI12 DAI18 DAI
POX−0.943 *−0.407 NS0.801 NS
CAT0.999 *0.976 *0.965 *
PPO−0.862 *−0.742 NS−0.436 NS
TSP−0.697 NS−0.768 NS−0.045 NS
TSS0.887 *0.972 *0.976 *
* Significant linear relationship (p < 0.05) between PD in inoculated plants over uninoculated plants for enzymes (POX, CAT, PPO) activities and metabolites (TSP, TSS) contents with sclerotinia rot resistance. NS—Nonsignificant. Negative values indicate negative correlation of PD with mean lesion length (cm) and vice versa. Higher PD in POX, PPO, and TSP is directly associated with resistance (lesser mean lesion length) while positive values indicate positive correlation of PD with mean lesion length (cm) and vice versa. Lower PD in CAT and TSS is directly associated with sclerotinia rot resistance (lesser mean lesion length).
Publisher’s Note: MDPI stays neutral with regard to jurisdictional claims in published maps and institutional affiliations.

