Characteristics of Listeria Monocytogenes Strains Persisting in a Meat Processing Facility over a 4-Year Period


Institute for Food Safety and Hygiene, Vetsuisse Faculty, University of Zurich, 8057 Zurich, Switzerland
*
Author to whom correspondence should be addressed.
Pathogens 2019, 8(1), 32; https://doi.org/10.3390/pathogens8010032
Submission received: 14 February 2019
/
Revised: 1 March 2019
/
Accepted: 3 March 2019
/
Published: 7 March 2019
(This article belongs to the Section Human Pathogens)
Abstract
:Listeria monocytogenes can persist in food production facilities, resulting in serious threats to consumers due to the high mortality associated with listeriosis, especially in the very young, old and pregnant. We subtyped 124 strains of L. monocytogenes isolated from a meat processing facility in Switzerland by serotyping, multi locus sequence typing (MLST) typing and whole genome sequencing. We then analyzed their ability to form biofilms and their resistance to the disinfectants benzalkonium chloride (BC) and peracetic acid (PAA). The genotyping results of the strains showed that several clonal populations of L. monocytogenes belonging to CC9, CC204 and CC121 had persisted in this meat processing facility for at least four years. All of the strains showed biofilm forming capacity comparable to a known high biofilm forming strain. Known efflux pumps for BC were present in CC204, CC9 (brcABC) and CC121 (qacH) strains, while strains from other CC showed very low minimal inhibitory concentrations (MICs) for BC. For PAA, minimal bactericidal concentrations of 1.2–1.6% for 20 min and minimal inhibitory concentrations between 0.1 and 0.2% were observed. These values were close to or above the recommended concentration for use (0.5–1%), suggesting that PAA might be ineffective at controlling L. monocytogenes in this and potentially other meat processing facilities.
1. Introduction
Listeria monocytogenes is a food-borne pathogen that causes disease mainly in vulnerable populations such as very young, old, pregnant or immunocompromised individuals. The high mortality rate of 15–30 deaths per 100 cases of listeriosis [1,2,3,4] is mostly attributable to severe central nervous system infections, septicemia, abortions and neonatal listeriosis. In the United States alone, listeriosis is estimated to cause an annual loss of 8800 disease adjusted live years (DALY), of which the majority are premature deaths [5].
Human cases of listeriosis often trace back to food products that were contaminated during production, with subsequent growth of L. monocytogenes to high numbers. Ready-to-eat products such as salads or deli meat are of special concern due to the lack of a heating step prior to consumption. The frequent occurrence of L. monocytogenes in the environment results in a high probability of introducing the organism into facilities, either on raw materials, through equipment or via employees. Once introduced, several factors increase the probability of a strain being able to establish long-lasting colonization of niches. L. monocytogenes has a high tolerance against acid and salt stress, and is able to grow at refrigerating temperatures. In addition, the ability to form biofilms may enhance survival, especially in niches that are difficult to reach during cleaning procedures. Further, tolerance against commonly used disinfectants such as the quaternary ammonium chloride compound benzalkonium chloride were observed in L. monocytogenes isolates from food processing environments [6,7,8,9,10,11]. Accordingly, L. monocytogenes presents a challenge to the food industry and has been shown to persist in food producing facilities for long periods of time, in some cases for more than a decade. For example, a meat factory in Texas harbored the same strain for at least 12 years, eventually causing an outbreak in 2000 [6,7]. A smoked fish processing plant harbored the same strain of L. monocytogenes for 11 years [8]. A study in Ireland found that seven out of 48 food processors housed a persistent strain—defined as isolated at least six months apart [9].
Here, we analyzed strains from a Swiss deli meat plant where L. monocytogenes strains were repeatedly isolated between 2015 and 2018. The aim was (i) to determine whether a clonal population of L. monocytogenes persisted in the facility or if L. monocytogenes was repeatedly reintroduced, and (ii), to characterize the resistance of the collected strains against benzalkonium chloride (BC) and peracetic acid (PAA) and their ability to form biofilms.
2. Results
2.1. Subtyping of 124 Listeria Monocytogenes Isolated from a Swiss Meat Plant
A total of 124 strains of L. monocytogenes were analyzed in this study. All strains were collected in the framework of a hygiene monitoring program in a meat processing facility in Switzerland between 2015 and 2018 (Table 1). The collection contains four strains from 2015, three strains from 2016, 32 strains from 2017 and 85 strains from 2018. The samples originated from products (n = 8) and from the food production environment (n = 116).
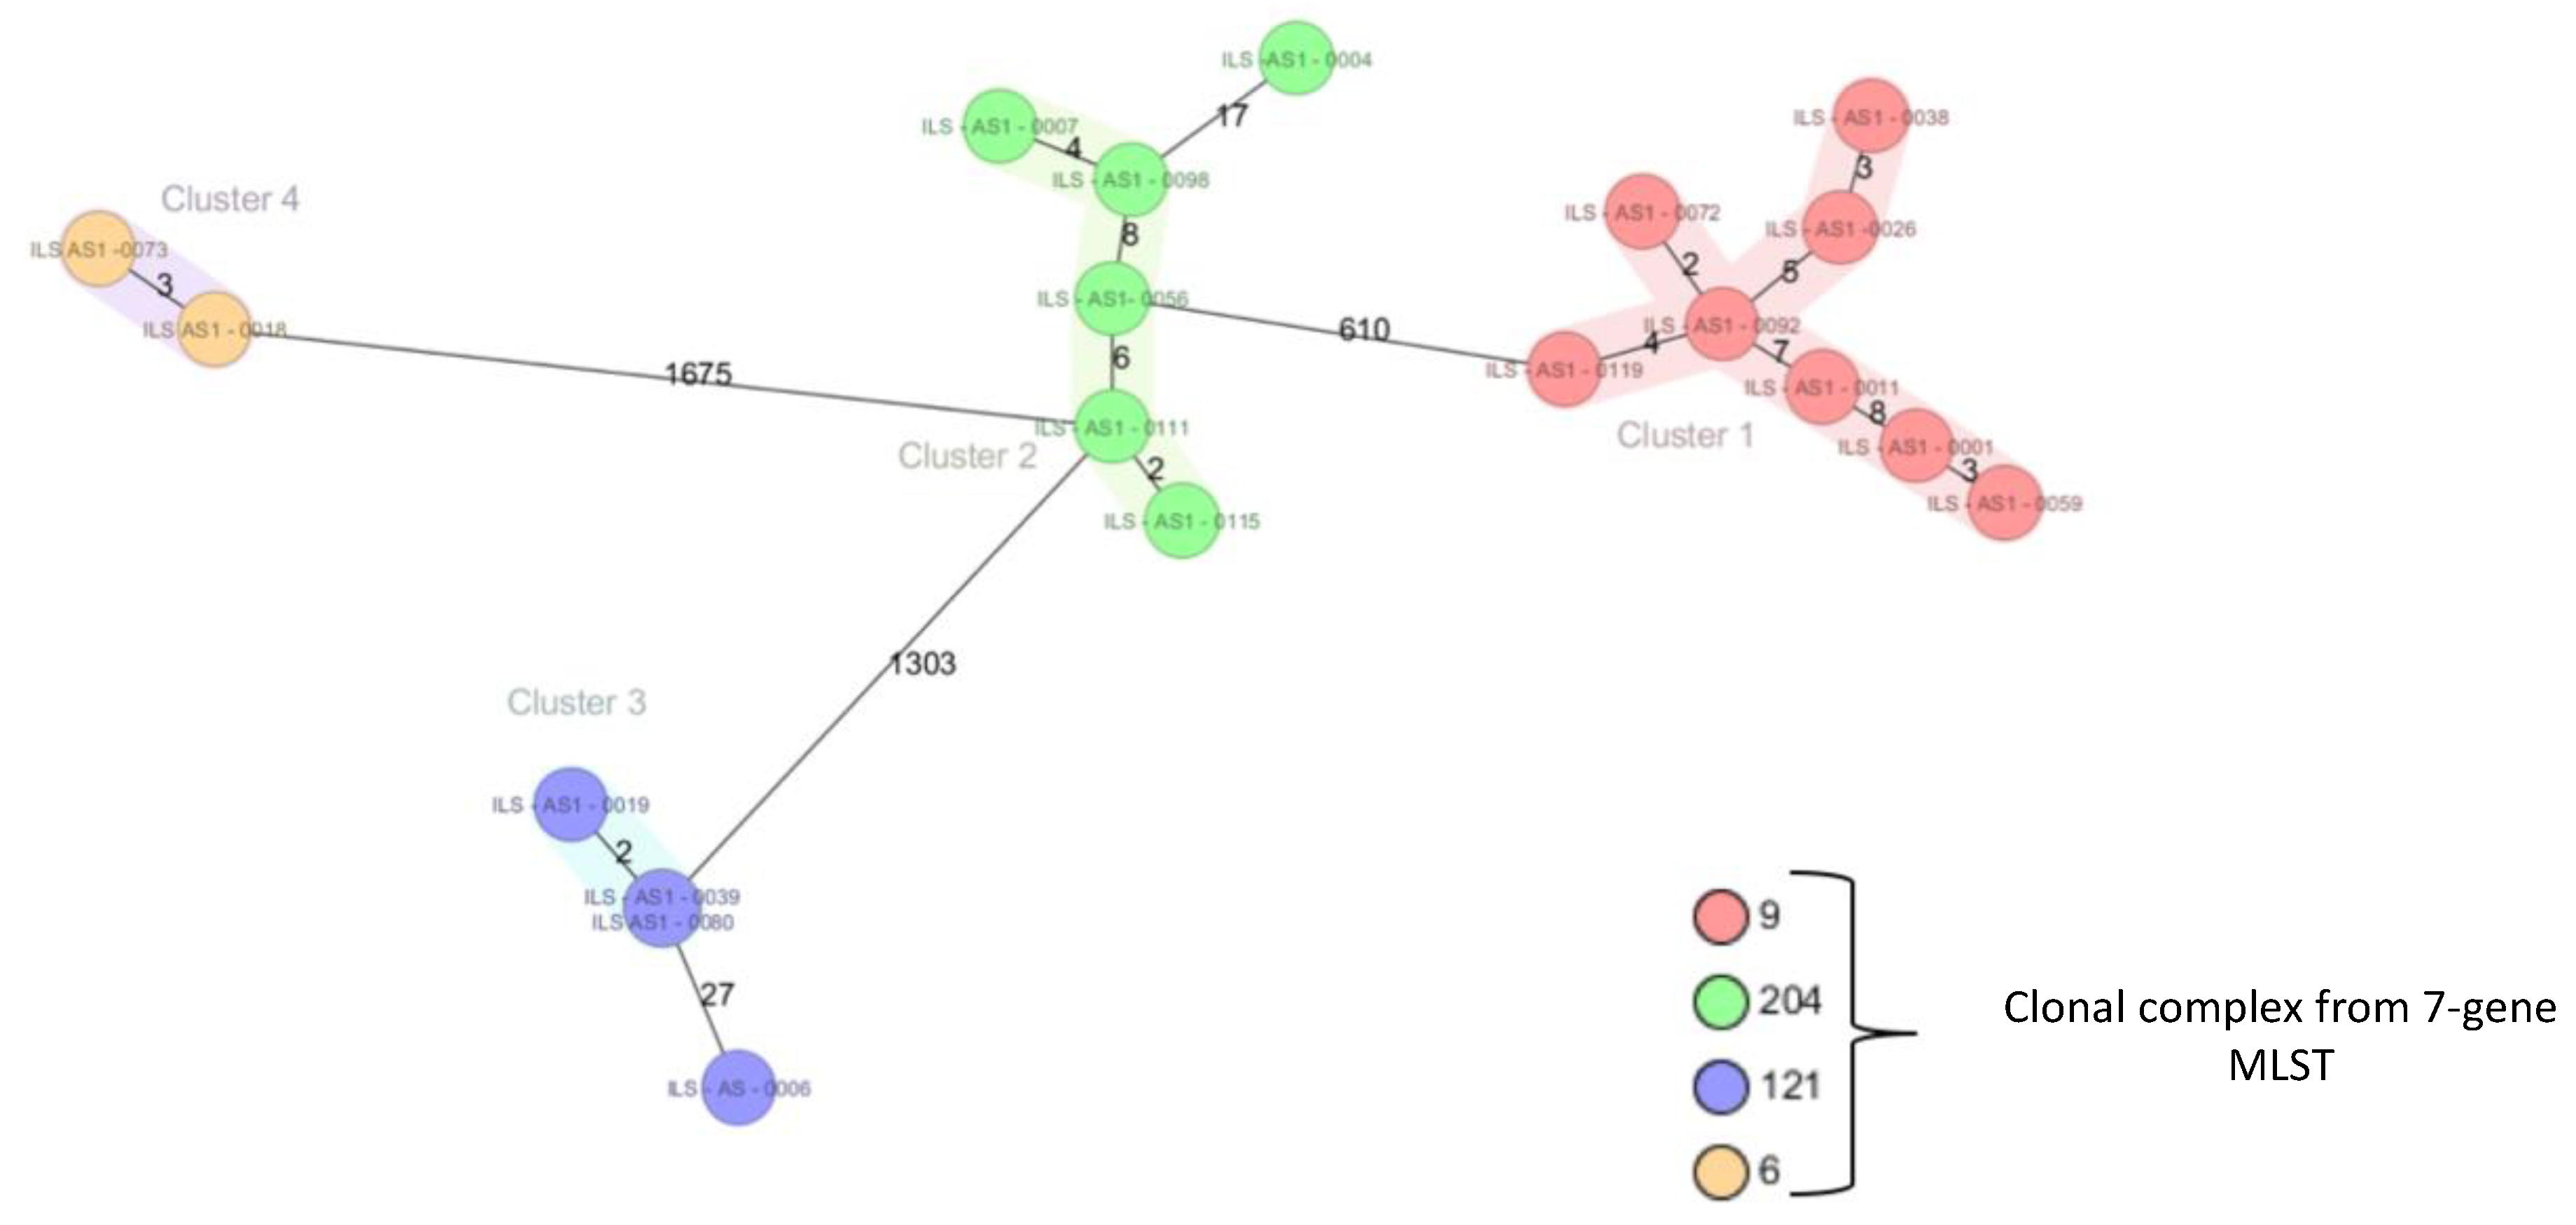
In a first screening of the diversity of the 124 L. monocytogenes strains, their serogroup and multi locus sequence typing (MLST) profile was determined. The majority of the strains (n = 73, 58.9%) belonged to serogroup II (containing serotype 1/2c, 3c), 48 strains (38.7%) belonged to serogroup I (1/2a, 3a) and three strains (2.4%) belonged to serogroup IV (4b, 4d, 4e). Seven gene MLST revealed that all of the 73 serogroup II strains belonged to CC9 (n = 73, 58.9%). The strains belonging to serogroup I were more heterogenous with 31 strains assigned to CC204, seven strains assigned to CC121, four strains to CC20 and to CC29, and one to CC8 and to CC89. The three strains in serogroup IV all belonged to CC6. Only strains from CC9, CC204 and CC121 were consistently isolated over all four years. CC6 strains seem to have been introduced into the facility in July 2017 and persisted until the end of the sampling period in June 2018.
From these results we concluded that it was likely that clonal populations of CC9, CC204, CC121, and CC6 persisted in this facility, while strains from other complexes were sporadically introduced and deemed “presumably non-persistent”. We consciously use the term “presumably” because there is no reasonable way to determine if those strains would have persisted in different environments or under different growth conditions.
2.2. Biofilm Formation
The capacity to form biofilms is an important mechanism for persistence [11], and biofilm formation might have contributed to the maintained presence of clonal clusters of L. monocytogenes strains in the facility for years. We therefore investigated the biofilm forming ability in a subset of strains of the collective (CC9, CC204, CC121 and CC6) at 22 and 8 °C.
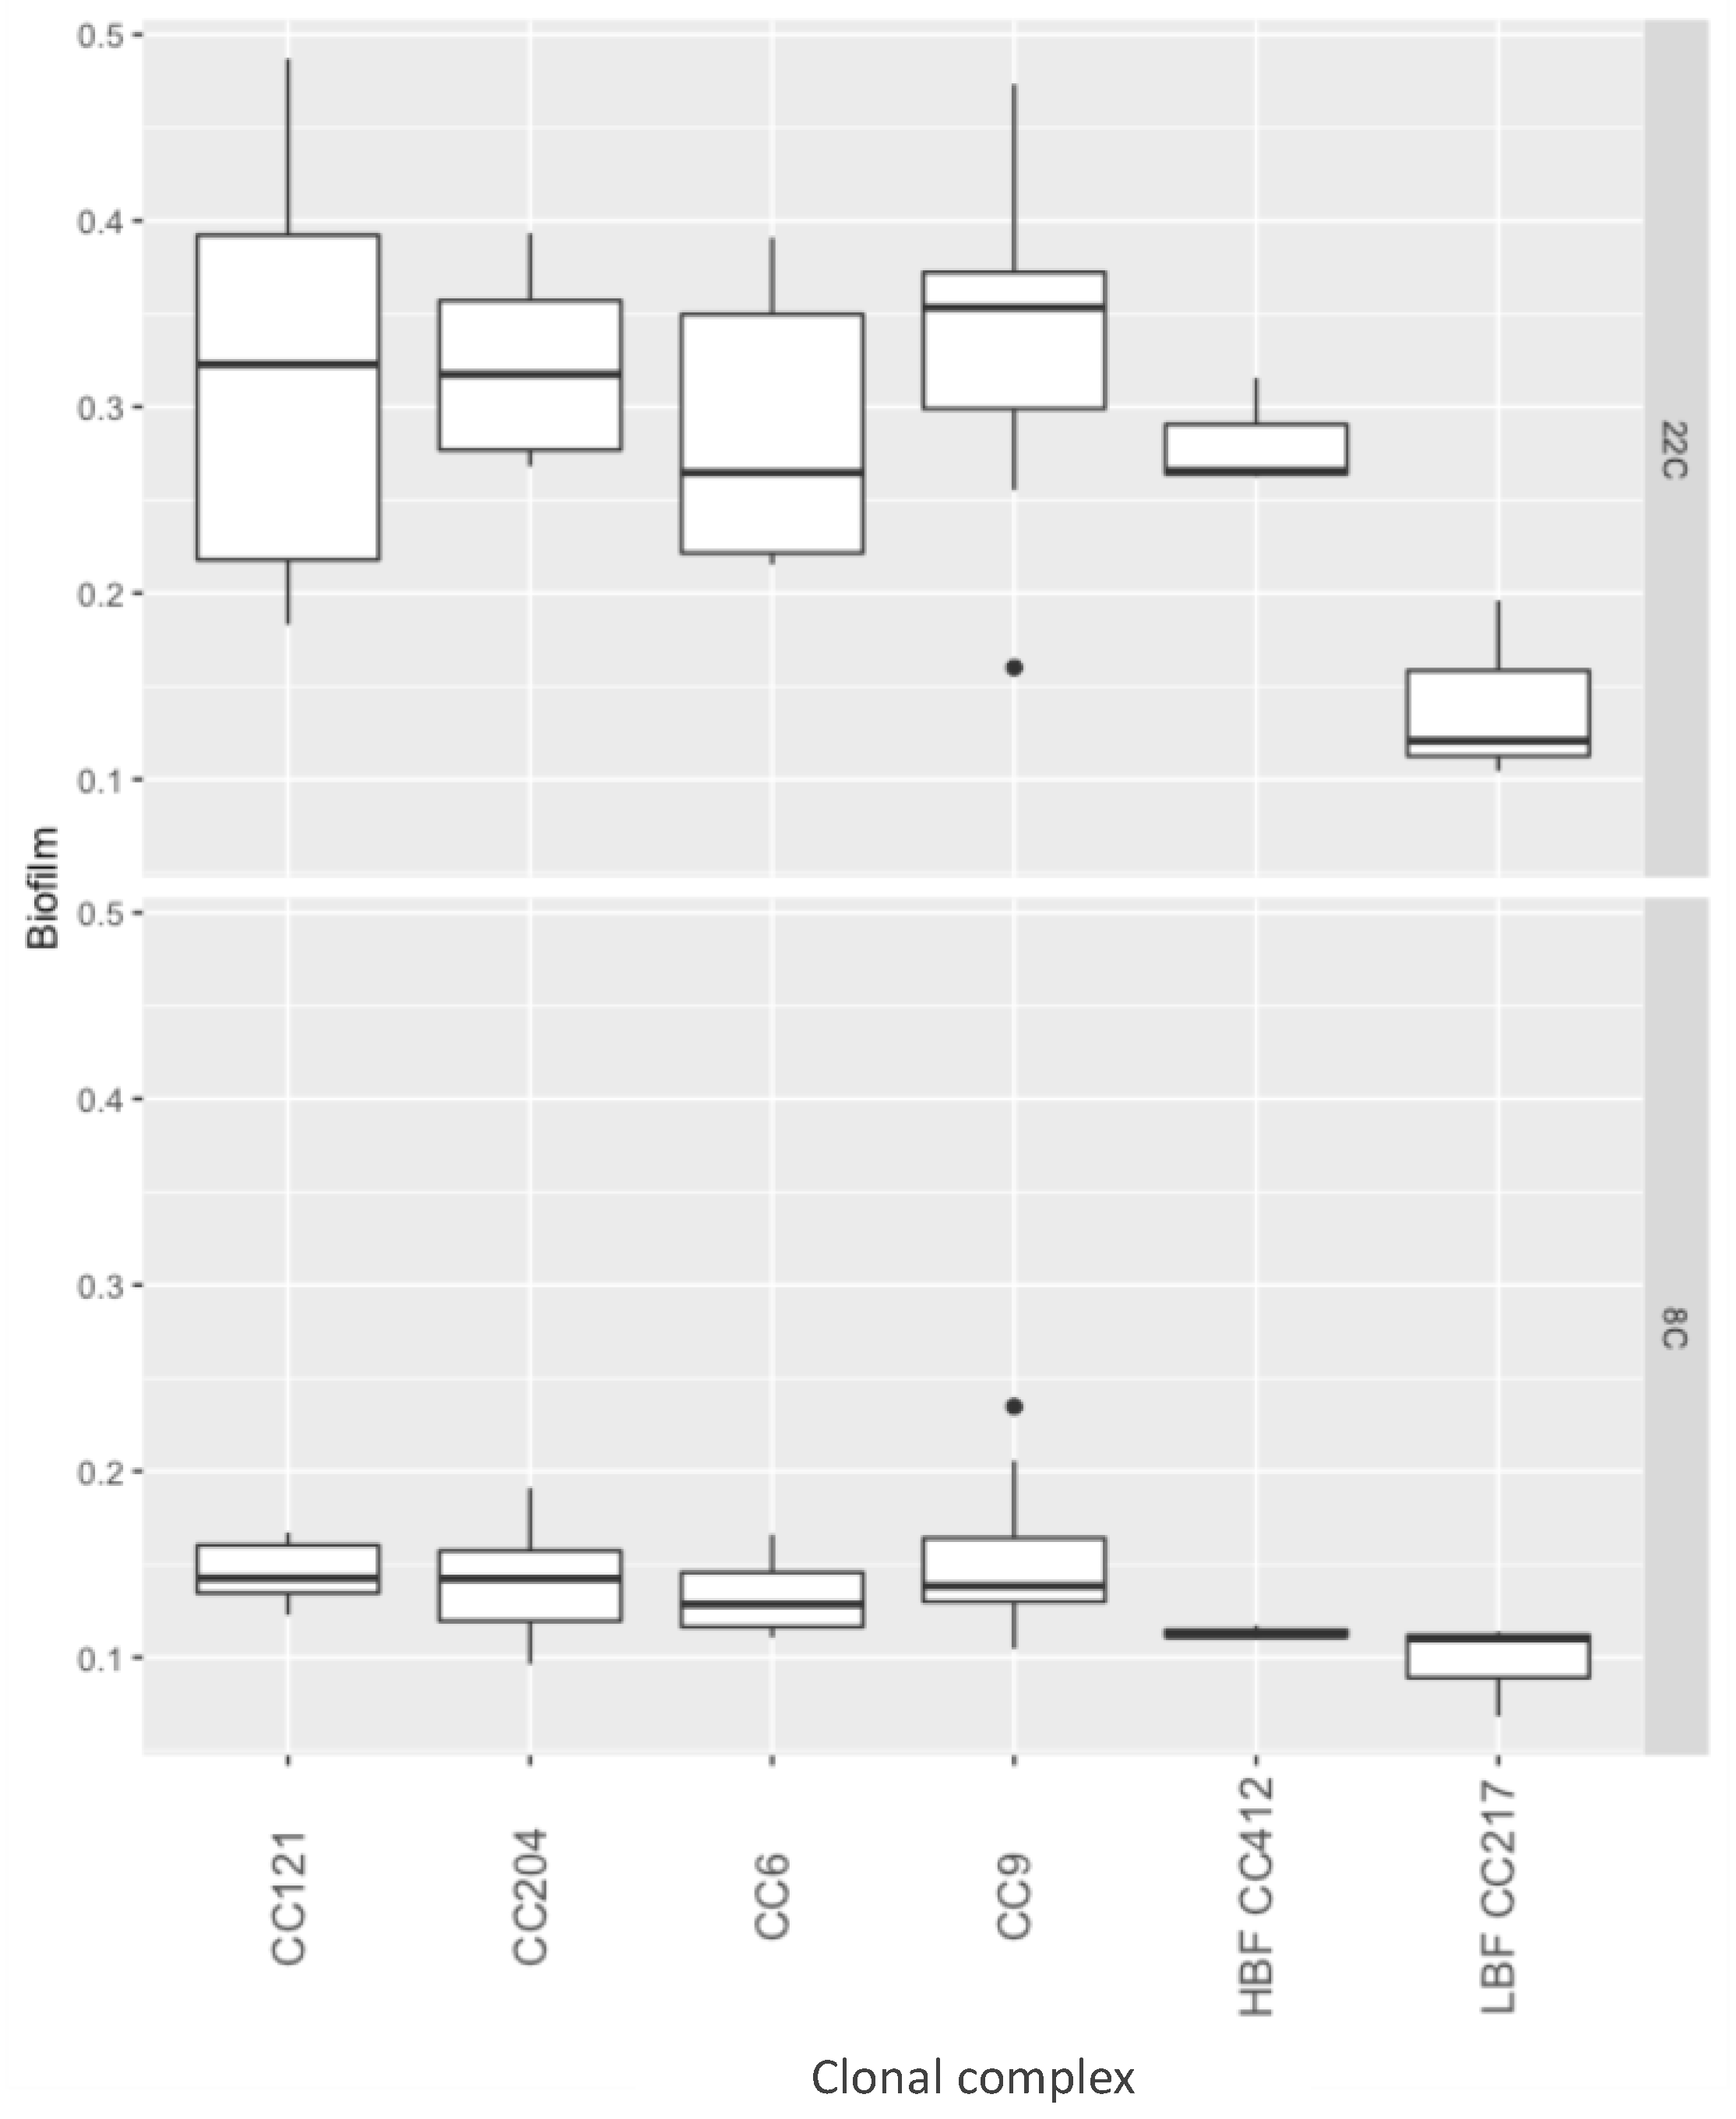
Approximately double the biofilm mass was recovered after 96 h of growth at 22 °C compared to 168 h growth at 8 °C (p < 0.01) (Figure 2). However, no individual strain had significantly different biofilm formation compared to the other tested strains (Supplementary File 1).
At 22 °C, strains from CC9, CC204, CC121 and CC6 showed a biofilm forming capacity in the range of a high biofilm forming (HBF) control strain, and all strains had significantly higher biofilm formation than that of a low biofilm forming (LBF) control strain (p < 0.01). At 8 °C, all strains, including the HBF control strain, were impaired in their biofilm forming capacity and hence, no significant differences between the strains from different complexes, nor between the strains isolated from the meat processing facility vs. the control strains, were found (Figure 2).
2.3. Tolerance to Benzalkonium Chloride
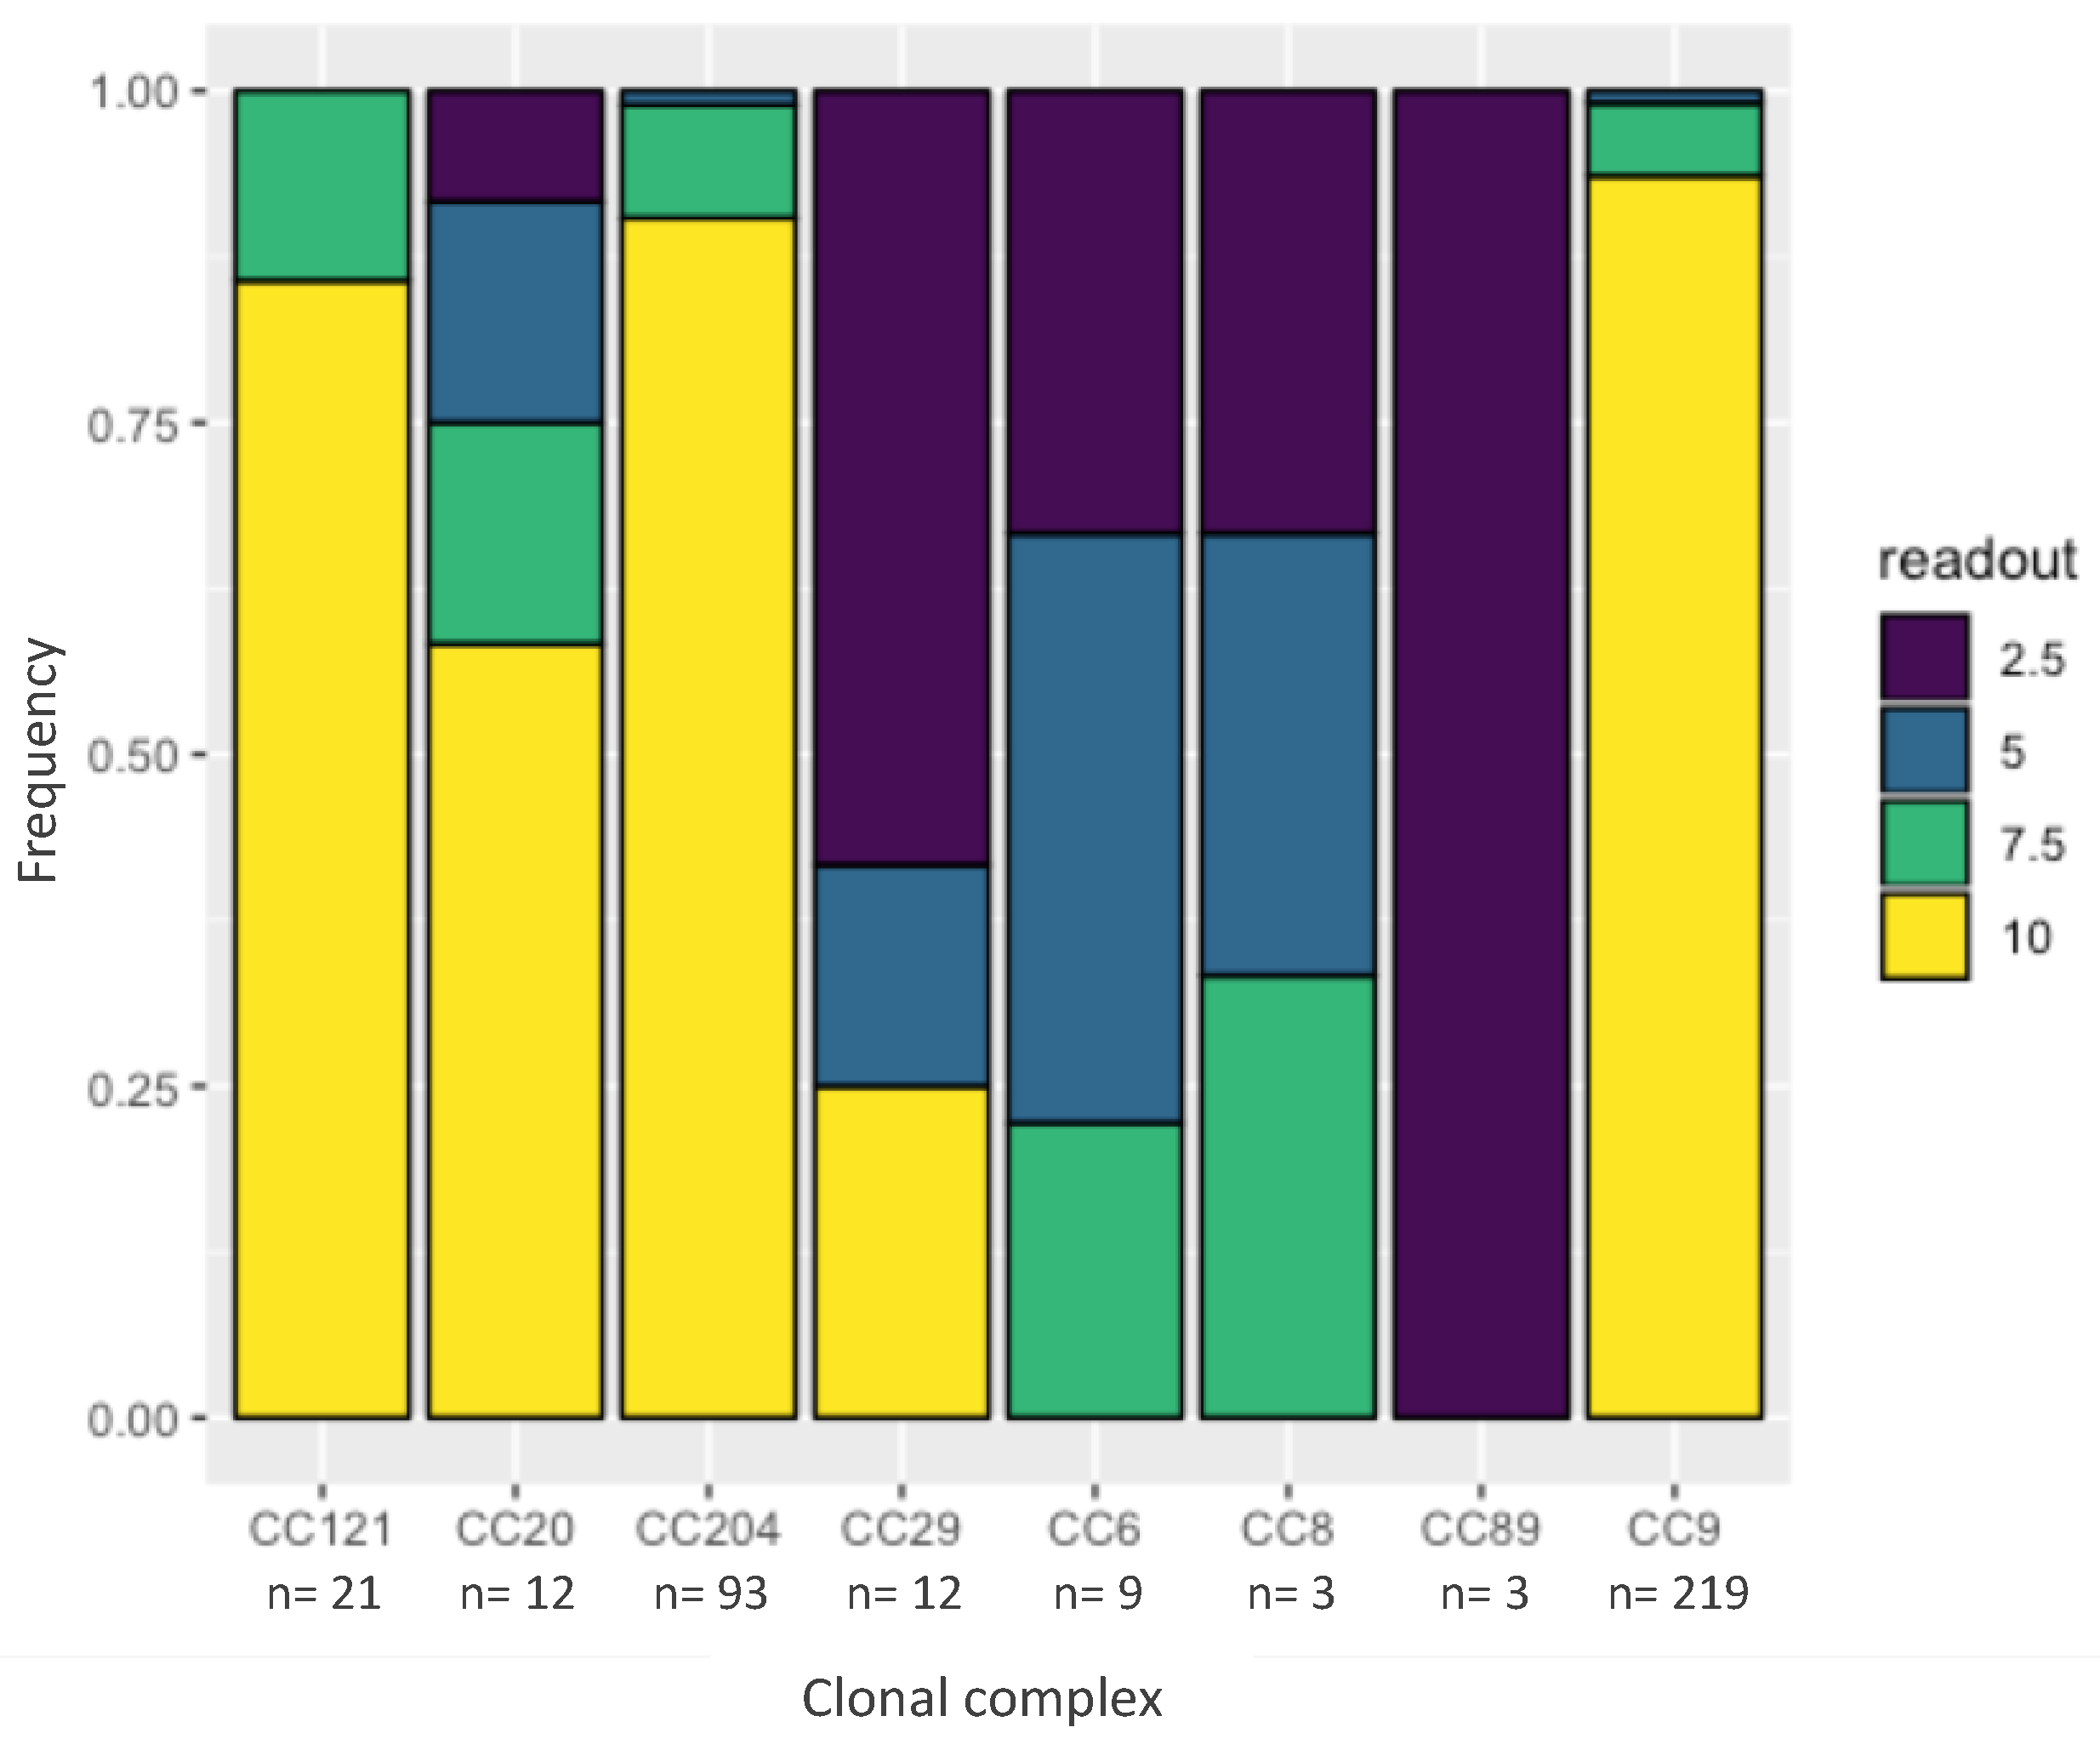
Benzalkonium chloride is a commonly used disinfectant in the food industry and resistance against BC might contribute to the persistence of a strain. One hundred and six out of 124 tested strains were resistant to 10 µg/mL BC (Figure 3). None of the strains, however, were resistant to the cutoff for resistance—20 µg/mL BC. A cumulative link model [12] revealed that CC29, CC89, CC8 and CC6 had a significantly lower tolerance to BC (combined average of 4.5 µg/mL BC) compared to the other CC in the dataset (combined average of 9.2 µg/mL BC, p < 0.05).
A genome-wide search in the 20 sequenced strains revealed the presence of either brcABC [13] or qacH [14] BC resistance genes in 16 (80%) of the strains (Table 1). brcABC genes were present in six strains of CC204 and CC9, respectively. qacH was present in four CC121 strains. No strain carried the emrE [15] BC resistance gene. All strains that carried resistance genes had the highest measured BC resistance at 10 µg/mL, except strain ILS AS1-0004 which was resistant to 7.5 µg/mL.
2.4. Minimal Inhibitory Concentration and Minimal Bactericidal Concentration of Peracetic Acid against L. monocytogenes
PAA is frequently used as a disinfectant in the food production environment with a recommended final concentration between 0.5% and 1%. The meat processing facility from which the strains originated used 0.8% PAA as a sanitizer; we therefore hypothesized that strains from this collective might have adapted to PAA over time.
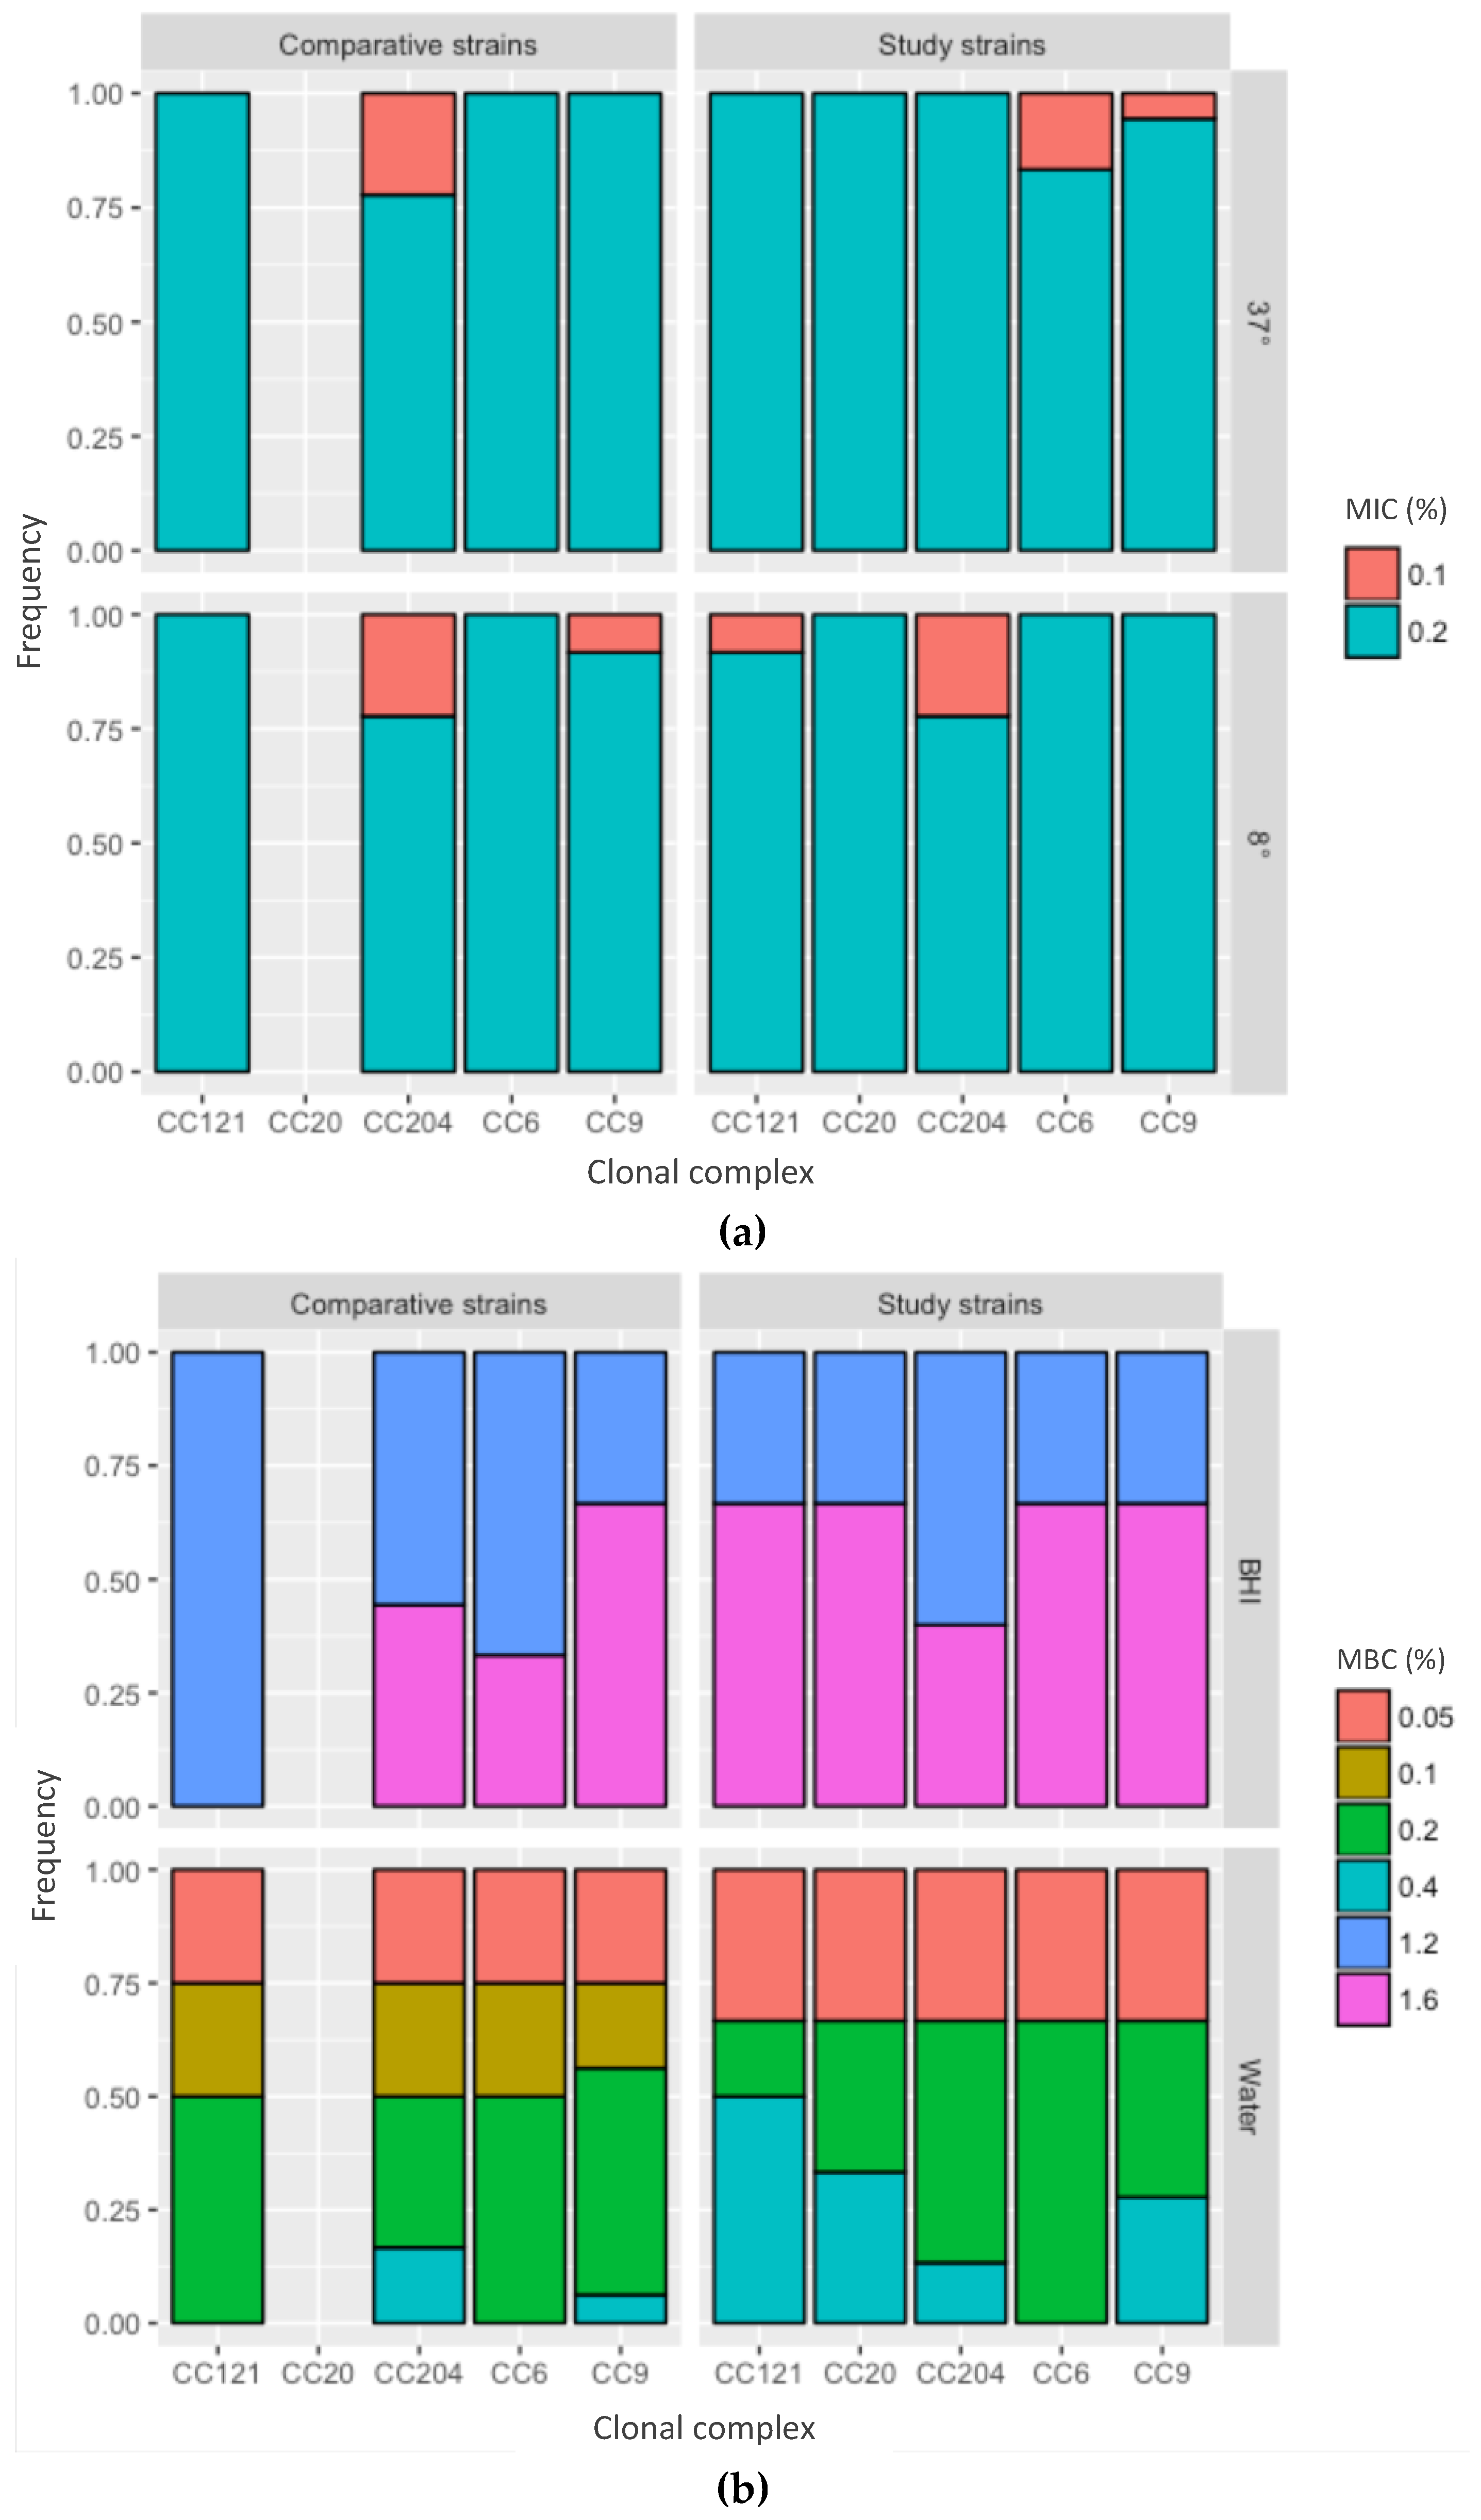
The MIC was between 0.1% and 0.2% for all strains and the MBC was between 1.2% and 1.6% (Figure 4, Supplementary File 1). Since the strains were isolated up to four years apart, these data strongly suggest no adaptation to PAA over time.
All further analyses were performed in a subset of strains that were chosen to represent all four years of collection and were divided over the most frequent clonal complexes CC9 (n = 6), CC204 (n = 4), CC121 (n = 3), CC6 (n = 2) and CC20 (n = 1). To test whether the strains had an unusually high resistance to PAA, a comparison was made to L. monocytogenes strains from unrelated sources that belonged to the same clonal complexes [CC9 (n = 4), CC204 (n = 3), CC121 (n = 1) and CC6 (n = 1)] (Table 1). The minimal bactericidal concentration (MBC) of the strains was between 1.2% and 1.6% with no difference between the clonal complexes or between the strains isolated from the meat processing facility versus the control strains (Figure 4a). Therefore, the strains from the meat processing facility showed no increased tolerance to PAA.
To test whether the availability of protein compounds in the test medium affected the outcome, the MBC was compared with PAA in tap water and PAA in brain heart infusion (BHI). The MBC of PAA in tap water was 0.1–0.4% and, therefore, lower compared to the PAA BHI (p < 0.05) (Figure 4b), indicating that protein affects the effectiveness of PAA and that there is a protein error for PAA.
We further assessed whether the incubation temperature influenced the outcome, which would indicate that PAA has a cold error. While MBC values were generally a better indicator for disinfection, we used MIC measurements to address this question because they allowed us to test the effects of cold exposure over a longer time than MBC measurements. The MIC for PAA was 0.2% for all strains, regardless of incubation at 4 °C or 37 °C, suggesting no evidence for a cold error for PAA against L. monocytogenes.
3. Discussion
In this study, we showed that several clonal populations of L. monocytogenes persisted in a meat processing facility in Switzerland for at least four years. The persistent strains belonged to CC9, CC204 and CC121. The dominant CC9 and CC121 have previously been shown to be overrepresented in food processing facilities in France [16], Spain [17], Switzerland [18], and all over Europe [19]. CC204 on the other hand has only been sporadically isolated from food processing facilities [18] and human patients [20].
Strains from the facility formed biofilm in the range of a high biofilm former. However, no difference was found between the individual strains isolated from the facility, nor between clonal complexes. Subtle differences between clonal complexes might be revealed by replacing the 96-well format biofilm screening protocol used in this study [21] with more labor-intensive procedures, such as culturing biofilms on stainless steel coupons [22], in a follow-up study. Contradictory results have been found by other authors: Some studies showed that persistent strains of L. monocytogenes formed more biofilm than presumed non-persistent strains [11], and persistent strains were more efficient in attaching to surfaces during a short contact time [23]. Others did not observe a difference between persistent vs. presumed non-persistent strains [24], and the ability of L. monocytogenes to form true biofilms at all has been critically questioned by some authors [25]. Given the high biofilm forming capacity we found in the strains of L. monocytogenes isolated from this meat processing facility, biofilm formation may have contributed to persistence.
The overrepresentation of CC121 in food processing environments has often been explained with their higher resistance to BC due to the presence of the qacH or brcABC genes that encode efflux pumps [26]. Confirming this, all CC121 strains that were sequenced in this study were positive for qacH. Moreover, 80% of all sequenced strains carried either qacH or brcABC. Given the clonal structure of the CC121, CC9 and CC204 strains in this collection and their uniform resistance to 10 µg/mL BC, it is reasonable to assume that most strains in this collection carried either qacH or brcABC. However, tolerance to 10 µg/mL BC is below the typical in-use concentrations of BC (500–1000 µg/mL) [27], indicating that BC should be active against the strains in this study.
In contrast, PAA was routinely used for disinfection in the facility, at a final concentration of 0.8%. Our data showed that the MBC (1.2–1.6%) and the MIC (0.1–0.2%) values were close to or above this concentration, to ensure efficient disinfection. Experiments without nutrients in the medium showed that even in the absence of proteins the MBC, between 0.2% and 0.4%, was still very close to the recommended concentration for use. Under real-life conditions, when disinfecting larger areas, it is likely that the concentration of the disinfectant becomes diluted through residual washing water and that residual organic matter is present. It is also likely that contact times differ due to run-off or delayed reach of hard to clean niches, which in this case would lead to ineffective concentrations of PAA.
Different strains of L. monocytogenes also exhibited high MBCs for PAA in the range of up to 0.5% [28,29,30,31]. In contrast, others concluded that PAA was able to significantly reduce L. monocytogenes from multispecies biofilms at 0.15% [32] and 0.3% [30], respectively. The MIC of PAA for other organisms seemed to be much lower, in the range of 0.01–0.03% for Gram-positive and Gram-negative flora isolated from citrus fruit [33], 0.0003% for Escherichia coli, Staphylococcus aureus, Pseudomonas aeruginosa [34], and 0.0001–0.001% for P. aeruginosa, S. aureus, E. coli, and S. epidermidis [35]. Given the high tolerance of L. monocytogenes against PAA found in our data and by others, the ability of PAA to reduce L. monocytogenes from biofilms may primarily have been due to the elimination of the supporting flora in multispecies biofilms.
Our data confirm the absence of adaptation of L. monocytogenes to PAA found in other work that found no adaptation over several hundred generations when L. monocytogenes were exposed to an industrial disinfectant containing PAA and hydrogen peroxide [36].
Taken together, these experiments show that the concentration of 0.8% PAA used by the facility is insufficient to ensure safe production standards with regard to L. monocytogenes. However, PAA is a valuable option for disinfection due to its effectiveness against most bacteria, fungi and viruses, the absence of a cold error, its status as GRAS, and its colorless and odorless properties, but only when L. monocytogenes is not a major concern. Since PAA at concentrations above 1% is corrosive to equipment and irritating to the eyes, via fumes, an alternative disinfectant regimen should be considered in food production facilities that struggle to control L. monocytogenes in their environment.
4. Material and Methods
4.1. Bacterial Strains and Preparation of Bacterial Cultures
The hygiene-monitoring program of the meat-producing facility entailed product samples and swabs of the production environment such as floor drains, trolleys, elevators, cold room floors, scales, production and packaging lines, toilet drains and toilet floors or doors between production sections. All samples were tested for L. monocytogenes using the “Assurance Genetic Detection System” (GDS, Biocontrol, Nieuwerkerk aan den IJssel, The Netherlands) according to the protocol. In short, swabs or samples were incubated in Half Frazer Broth (HFB, BioRad, Marne-la-Coquette, France) at 30 °C for 48 h. L. monocytogenes were further enriched on magnetic beads and then identified via a kit-specific PCR in an “Assurance GDS Rotor-Gene” cycler. To obtain single colonies, the enriched HFB was streaked on Oxoid chromogenic Listeria agar (OCLA) plates (Oxoid, Pratteln, Switzerland) and incubated at 37 °C for 24 h. All strains were kept in 15% glycerol stocks at –80 °C.
To obtain overnight cultures for experiments, the strains were streaked on BHI agar (Oxoid, Pratteln, Switzerland) and incubated overnight at 37 °C. A single colony was inoculated into 5 mL BHI and incubated for 18 h overnight at 37 °C with shaking at 200 RPM in a shaking incubator (Edmund Buehler SM30/TH30 combination, Huber AG, Reinach, Switzerland). To obtain exponential phase cultures with an OD590 of 0.4, 50 µL of the overnight culture was subcultivated into 5 mL of fresh BHI and incubated for 3 h at 37 °C with shaking at 200 rpm.
4.2. Serogrouping by qPCR
DNA was isolated from 1 mL overnight cultures using the DNeasy Blood and Tissue Kit (Qiagen, Hilden, Germany) and eluted in 10 mM Tris pH 7.3. The DNA concentration was measured with a Nanodrop 1000 (Thermo Fisher Scientific, Basel, Switzerland) and PCR templates were standardized to 105 copies per 1 µL by dilution in fresh 10 mM Tris. Multiplex qPCRs were performed according to Vitullo et al. [37], with the following modifications: Instead of a triplex-PCR we performed the qPCR as duplex with PUC19 [38] as an internal control on the third channel. Primers and probes according to Vitullo et al. (37) (Table 2) were obtained from Sigma-Aldrich (Buchs, Switzerland), and used at a final concentration of 0.4 μM for the primer and 0.2 μM for the probe.
Cycling conditions for the two-step PCR on a LightCycler 2.0 (Roche Science, Rotkreuz, Switzerland) were as follows: 5 s at 95 °C, followed by 40 cycles of 45 s at 95 °C and 45 s at 60 °C.
4.3. Multi Locus Sequence Typing (MLST)
MLST was performed on all 124 strains according to Ragon et al. [39]. All primers (Table 2) were ordered from Microsynth (Balgach, Switzerland). The fragment sizes were confirmed by gel-electrophoresis, the products were sequenced by Microsynth (Balgach Switzerland), assembled in Geneious (Version 11.1.4, Biomatters, Newark, NJ, USA) and analyzed using the website of the Institute Pasteur (http://bigsdb.pasteur.fr/listeria/listeria.html).
4.4. Whole Genome Sequencing
Based on the MLST results, a selection of 20 strains (Table 1) were Illumina sequenced. DNA was extracted, as for the MLST. Sequencing libraries were prepared using the Illumina Nextera DNA Flex chemistry and sequenced on an Illumina MiniSeq (Illlumina, San Diego, CA, USA) with a minimal coverage of 30 ×. After quality control with FastQC (http://www.bioinformatics.babraham.ac.uk/projects/fastqc/), the reads were assembled with Spades 3.12.0 [40]. Core-genome multilocus sequence typing (cgMLST) was performed in the software package SeqSphere 4.1.9 (Ridom, Münster, Germany). Assembled genome sequences were imported and blasted against 1701 genes of the seed genome EGD-e, using the standard settings [10]. A minimal spanning tree was produced in SeqSphere with the options “ignore missing values pairwise” and “discard genomes with >3% missing genes”. Strains with less than 10 different alleles were considered to belong to the same complex.
4.5. Biofilm Formation
The 15 strains that represented the four clonal complexes that seemed to persist in the factory (CC9 (n = 9), CC204 (n = 2), CC121 (n = 2)), (CC6 (n = 2)) were chosen for biofilm assays, according to the protocol published by Harvey et al. with minor changes [21]. A single colony was inoculated into 5 mL of tryptone soy broth (TSB, from Fluka, obtained from Sigma-Aldrich, Buchs, Switzerland), incubated for 20 h at 30 °C with shaking at 200 rpm, subcultured 1:250 into fresh TSB, and incubated for an additional 20 h at 30 °C with shaking at 200 rpm. The resulting cultures were adjusted to an OD600 of 1.0, diluted 1:80 in TSB and added to 96-well plates, which were incubated for 96 h at 22 °C, or for 168 h at 8 °C, respectively. Biofilms were then washed three times with distilled water, stained with crystal violet, and washed five times with distilled water. The remaining crystal violet was dissolved in ethanol and the OD600 was measured in a Synergy plate reader (BioTek, Lucern, Switzerland). Control strains that were high and low biofilm formers (Institute for Food Safety and Hygiene, Zurich; unpublished results) (Table 1) were included in each experiment.
4.6. Tolerance to Benzalkonium Chloride
MICs for BC were determined for all 124 strains included in this study, as per the protocol of Meier et al. with minor changes [26]. Five µL of an exponential phase culture were spotted on BHI plates containing BC at 0, 2.5, 5.0, 7.5, 10.0, 15.0, 20.0, 25.0 and 30.0 µg/mL (Sigma Aldrich, Buchs, Switzerland). The plates were incubated for 48 h at 37 °C. Strains were considered resistant to the concentration of BC on which confluent growth was observed. The cutoff for resistance was set, according to Langsrud et al. [41], as double the value of the lowest concentration that inhibited growth in >50% of the tested strains.
All sequenced genomes were searched for the qacH, brcABC and emrE BC resistance genes using BLASTP 2.7.1+ [42] with the standard settings and an e-value cutoff of 10−20.
4.7. Minimal Inhibitory Concentration and Minimal Bactericidal Concentration of Peracetic Acid against L. monocytogenes
These assays were performed in PAA diluted in BHI to mimic a worst case scenario that assumed incomplete cleaning of organic matter from surfaces before disinfection, and to assess the overall effect of PAA on bacteria within an otherwise favorable environment. To determine the influence of the protein in BHI on the outcome, some of the assays were additionally performed in PAA diluted in tap water (City of Zürich, supplementary file 2). First, the MIC and MBC for PAA were determined in a screening of all 124 strains. Given the clonal nature of much of the strain collection, we then compared the resistance to PAA in detail in a subset of the strains: CC9 (n = 6), CC204 (n = 4), CC121 (n = 3), CC6 (n = 2) and CC20 (n = 1). A control dataset contained strains from unrelated sources: CC9 (n = 4), CC204 (n = 3), CC121 (n = 1) and CC6 (n = 1) (Table 1).
To obtain the MBC values, serial dilutions were prepared to obtain final PAA concentrations of 2.8%, 2.4%, 2.0%, 1.6%, 1.2%, 0.8%, 0.4%, 0.2%, 0.1% and 0.05%. Next, 190 µL of these dilutions were added to 96-well plates and cooled to 4 °C. Then, exponential phase cultures were diluted in 0.9% NaCl and 10 µL were added to each well to achieve an inoculum of approximately 5 × 10² CFU/well for the dilution rows in BHI and 5 × 10⁴ CFU/well for the dilution rows in water. The plates were incubated for 20 min at 4 °C. After incubation, the wells were mixed by pipetting and 20 µL were washed in 180 µL 0.9% NaCl in a fresh 96-well plate. These plates were centrifuged at 3220 g for 5 min, the supernatant was discarded, and the cells were resuspended in 20 µL 0.9% NaCl. Next, 10 µL of each well was spotted on the edge of a BHI agar plate and run down the plate by tilting [43]. These plates were incubated for either 7 days at 8 °C, to mimic the conditions in a food processing plant, or for 48 h at 37 °C, to provide more favorable growth conditions. Surviving bacteria were enumerated by direct colony count and the MBC was defined as the concentration of PAA that produced no colonies. To determine the MIC, the serial dilution plates were incubated at 37 °C for 48 h and at 8 °C for 7 days. The MIC was defined as the concentration of PAA that allowed for no visible growth [44].
4.8. Statistical Analysis
All of the experiments were performed in triplicate unless otherwise indicated.
The results were analyzed in RStudio Version 1.1.456 (RStudio, Boston, MA, USA)) and all statistical analyses are provided as a supplementary file (Supplementary File 1). In short, a linear mixed effects model, using lmer in a LmerTest [45], was modelled to the biofilm data and lsmeans was used to create contrasts [46]. A cumulative link model was calculated for the BC and PAA data using polR in MASS [47], and model selection was done with stepAIC in MASS [47]. All graphics were done using ggplot2 [48].
Supplementary Materials
The following are available online at https://www.mdpi.com/2076-0817/8/1/32/s1.
Author Contributions
Conceptualization, R.S. and C.G.; methodology, R.S. and C.G.; investigation, A.S.; genomics, M.S.; writing–original draft preparation, A.S.; writing–review and editing, M.S. and C.G.; visualization, A.S.; supervision, R.S. and C.G.
Funding
This research received no external funding.
Acknowledgments
We thank Nicole Cernela and Sabrina Corti for their help with the strain collection and WGS typing of the selected stains.
Conflicts of Interest
The authors declare no conflicts of interest.
References
- Barton Behravesh, C.; Jones, T.F.; Vugia, D.J.; Long, C.; Marcus, R.; Smith, K.; Thomas, S.; Zansky, S.; Fullerton, K.E.; Henao, O.L.; et al. Deaths associated with bacterial pathogens transmitted commonly through food: Foodborne diseases active surveillance network (FoodNet), 1996–2005. J. Infect. Dis. 2011, 204, 263–267. [Google Scholar] [CrossRef] [PubMed]
- de Valk, H.; Jacquet, C.; Goulet, V.; Vaillant, V.; Perra, A.; Simon, F.; Desenclos, J.C.; Martin, P. Surveillance of Listeria infections in Europe. Euro Surveill. 2005, 10, 251–255. [Google Scholar] [CrossRef] [PubMed]
- Popovic, I.; Heron, B.; Covacin, C. Listeria: An Australian perspective (2001–2010). Foodborne Pathog. Dis. 2014, 11, 425–432. [Google Scholar] [CrossRef] [PubMed]
- Werber, D.; Hille, K.; Frank, C.; Dehnert, M.; Altmann, D.; Müller-Nordhorn, J.; Koch, J.; Stark, K. Years of potential life lost for six major enteric pathogens, Germany, 2004–2008. Epidemiol. Infect. 2012, 141, 961–968. [Google Scholar] [CrossRef] [PubMed] [Green Version]
- Scallan, E.; Hoekstra, R.M.; Mahon, B.E.; Jones, T.F.; Griffin, P.M. An assessment of the human health impact of seven leading foodborne pathogens in the United States using disability adjusted life years. Epidemiol. Infect. 2015, 143, 2795–2804. [Google Scholar] [CrossRef] [PubMed]
- Olsen, S.J.; Patrick, M.; Hunter, S.B.; Reddy, V.; Kornstein, L.; MacKenzie, W.R.; Lane, K.; Bidol, S.; Stoltman, G.A.; Frye, D.M.; et al. Multistate outbreak of Listeria monocytogenes infection linked to delicatessen turkey meat. Clin. Infect. Dis. 2005, 40, 962–967. [Google Scholar] [CrossRef] [PubMed]
- Orsi, R.H.; Borowsky, M.L.; Lauer, P.; Young, S.K.; Nusbaum, C.; Galagan, J.E.; Birren, B.W.; Ivy, R.A.; Sun, Q.; Graves, L.M.; et al. Short-term genome evolution of Listeria monocytogenes in a non-controlled environment. BMC Genom. 2008, 9, 539. [Google Scholar] [CrossRef] [PubMed]
- Vongkamjan, K.; Roof, S.; Stasiewicz, M.J.; Wiedmann, M. Persistent Listeria monocytogenes subtypes isolated from a smoked fish processing facility included both phage susceptible and resistant isolates. Food Microbiol. 2013, 35, 38–48. [Google Scholar] [CrossRef] [PubMed]
- Leong, D.; Alvarez-Ordóñez, A.; Jordan, K. Monitoring occurrence and persistence of Listeria monocytogenes in foods and food processing environments in the Republic of Ireland. Front. Microbiol. 2014, 5, 436. [Google Scholar] [CrossRef] [PubMed]
- Ruppitsch, W.; Pietzka, A.; Prior, K.; Bletz, S.; Fernandez, H.L.; Allerberger, F.; Harmsen, D.; Mellmann, A. Defining and Evaluating a Core Genome Multilocus Sequence Typing Scheme for Whole-Genome Sequence-Based Typing of Listeria monocytogenes. J. Clin. Microbol. 2015, 53, 2869–2876. [Google Scholar] [CrossRef] [PubMed]
- Borucki, M.K.; Peppin, J.D.; White, D.; Loge, F.; Call, D.R. Variation in Biofilm Formation among Strains of Listeria monocytogenes. Appl. Environ. Microbiol. 2003, 69, 7336–7342. [Google Scholar] [CrossRef] [PubMed]
- Agresti, A. Categorical Data Analysis; John Wiley & Sons, Inc.: Hoboken, NJ, USA, 2002. [Google Scholar]
- Elhanafi, D.; Dutta, V.; Kathariou, S. Genetic characterization of plasmid-associated benzalkonium chloride resistance determinants in a Listeria monocytogenes strain from the 1998-1999 outbreak. Appl. Environ. Microbiol. 2010, 76, 8231–8238. [Google Scholar] [CrossRef] [PubMed]
- Muller, A.; Rychli, K.; Muhterem-Uyar, M.; Zaiser, A.; Stessl, B.; Guinane, C.M.; Cotter, P.D.; Wagner, M.; Schmitz-Esser, S. Tn6188—A novel transposon in Listeria monocytogenes responsible for tolerance to benzalkonium chloride. PLoS ONE 2013, 8, e76835. [Google Scholar] [CrossRef] [PubMed]
- Kovacevic, J.; Ziegler, J.; Walecka-Zacharska, E.; Reimer, A.; Kitts, D.D.; Gilmour, M.W. Tolerance of Listeria monocytogenes to Quaternary Ammonium Sanitizers Is Mediated by a Novel Efflux Pump Encoded by emrE. Appl. Environ. Microbiol. 2015, 82, 939–953. [Google Scholar] [CrossRef] [PubMed]
- Maury, M.M.; Tsai, Y.-H.; Charlier, C.; Touchon, M.; Chenal-Francisque, V.; Leclercq, A.; Criscuolo, A.; Gaultier, C.; Roussel, S.; Brisabois, A.; et al. Uncovering Listeria monocytogenes hypervirulence by harnessing its biodiversity. Nat. Genet. 2016, 48, 308–313. [Google Scholar] [CrossRef] [PubMed]
- Martín, B.; Perich, A.; Gómez, D.; Yangüela, J.; Rodríguez, A.; Garriga, M.; Aymerich, T. Diversity and distribution of Listeria monocytogenes in meat processing plants. Food Microbiol. 2014, 44, 119–127. [Google Scholar] [CrossRef] [PubMed]
- Ebner, R.; Stephan, R.; Althaus, D.; Brisse, S.; Maury, M.; Tasara, T. Phenotypic and genotypic characteristics of Listeria monocytogenes strains isolated during 2011–2014 from different food matrices in Switzerland. Food Control 2015, 321–326. [Google Scholar] [CrossRef]
- Nielsen, E.M.; Björkman, J.T.; Kiil, K.; Grant, K.; Dallman, T.; Painset, A.; Amar, C.; Roussel, S.; Guillier, L.; Félix, B.; et al. Closing gaps for performing a risk assessment on Listeria monocytogenes in ready-to-eat (RTE) foods: Activity 3, the comparison of isolates from different compartments along the food chain, and from humans using whole genome sequencing (WGS) analysis. EFSA Support. Publ. 2017, 14, 539. [Google Scholar] [CrossRef]
- Althaus, D.; Lehner, A.; Brisse, S.; Maury, M.; Tasara, T.; Stephan, R. Characterization of Listeria monocytogenes Strains Isolated During 2011–2013 from Human Infections in Switzerland. Foodborne Pathog. Dis. 2014, 11, 753–758. [Google Scholar] [CrossRef] [PubMed]
- Harvey, J.; Keenan, K.P.; Gilmour, A. Assessing biofilm formation by Listeria monocytogenes strains. Food Microbiol. 2007, 24, 380–392. [Google Scholar] [CrossRef] [PubMed]
- Heir, E.; Møretrø, T.; Simensen, A.; Langsrud, S. Listeria monocytogenes strains show large variations in competitive growth in mixed culture biofilms and suspensions with bacteria from food processing environments. Int. J. Food Microbiol. 2018, 275, 46–55. [Google Scholar] [CrossRef] [PubMed]
- Lundén, J.M.; Miettinen, M.K.; Autio, T.J.; Korkeala, H.J. Persistent Listeria monocytogenes strains show enhanced adherence to food contact surface after short contact times. J. Food Prot. 2000, 63, 1204–1207. [Google Scholar] [CrossRef] [PubMed]
- Djordjevic, D.; Wiedmann, M.; McLandsborough, L.A. Microtiter plate assay for assessment of Listeria monocytogenes biofilm formation. Appl. Environ. Microbiol. 2002, 68, 2950–2958. [Google Scholar] [CrossRef] [PubMed]
- Ferreira, V.; Wiedmann, M.; Teixeira, P.; Stasiewicz, M.J. Listeria monocytogenes persistence in food-associated environments: Epidemiology, strain characteristics, and implications for public health. J. Food Prot. 2014, 77, 150–170. [Google Scholar] [CrossRef] [PubMed]
- Meier, A.B.; Guldimann, C.; Markkula, A.; Pöntinen, A.; Korkeala, H.; Tasara, T. Comparative Phenotypic and Genotypic Analysis of Swiss and Finnish Listeria monocytogenes Isolates with Respect to Benzalkonium Chloride Resistance. Front. Microbiol. 2017, 8, 397. [Google Scholar] [CrossRef] [PubMed]
- Hegstad, K.; Langsrud, S.; Lunestad, B.T.; Scheie, A.A.; Sunde, M.; Yazdankhah, S.P. Does the wide use of quaternary ammonium compounds enhance the selection and spread of antimicrobial resistance and thus threaten our health? Microb. Drug Resist. 2010, 16, 91–104. [Google Scholar] [CrossRef] [PubMed]
- Poimenidou, S.V.; Dalmasso, M.; Papadimitriou, K.; Fox, E.M.; Skandamis, P.N.; Jordan, K. Virulence Gene Sequencing Highlights Similarities and Differences in Sequences in Listeria monocytogenes Serotype 1/2a and 4b Strains of Clinical and Food Origin From 3 Different Geographic Locations. Front. Microbiol. 2018, 9, 1103. [Google Scholar] [CrossRef] [PubMed]
- Skowron, K.; Hulisz, K.; Gryń, G.; Olszewska, H.; Wiktorczyk, N.; Paluszak, Z. Comparison of selected disinfectants efficiency against Listeria monocytogenes biofilm formed on various surfaces. Int. Microbiol. 2018, 21, 23–33. [Google Scholar] [CrossRef] [PubMed]
- Oxaran, V.; Dittmann, K.K.; Lee, S.H.I.; Chaul, L.T.; Fernandes de Oliveira, C.A.; Corassin, C.H.; Alves, V.F.; De Martinis, E.C.P.; Gram, L. Behavior of Foodborne Pathogens Listeria monocytogenes and Staphylococcus aureus in Mixed-Species Biofilms Exposed to Biocides. Appl. Environ. Microbiol. 2018, 84, 627. [Google Scholar] [CrossRef] [PubMed]
- Saá Ibusquiza, P.; Herrera, J.J.R.; Cabo, M.L. Resistance to benzalkonium chloride, peracetic acid and nisin during formation of mature biofilms by Listeria monocytogenes. Food Microbiol. 2011, 28, 418–425. [Google Scholar] [CrossRef] [PubMed]
- da Silva Fernandes, M.; Kabuki, D.Y.; Kuaye, A.Y. Behavior of Listeria monocytogenes in a multi-species biofilm with Enterococcus faecalis and Enterococcus faecium and control through sanitation procedures. Int. J. Food Microbiol. 2015, 200, 5–12. [Google Scholar] [CrossRef] [PubMed]
- Winniczuk, P.P.; Parish, M.E. Minimum inhibitory concentrations of antimicrobials against micro-organisms related to citrus juice. Food Microbiol. 1997, 14, 373–381. [Google Scholar] [CrossRef]
- Alasri, A.; Roques, C.; Michel, G.; Cabassud, C.; Aptel, P. Bactericidal properties of peracetic acid and hydrogen peroxide, alone and in combination, and chlorine and formaldehyde against bacterial water strains. Can. J. Microbiol. 1992, 38, 635–642. [Google Scholar] [CrossRef] [PubMed]
- Vieira, R.G.L.; da Silva Moraes, T.; de Oliveira Silva, L.; Bianchi, T.C.; Veneziani, R.C.S.; Ambrósio, S.R.; Bastos, J.K.; Pires, R.H.; Martins, C.H.G. In vitro studies of the antibacterial activity of Copaifera spp. oleoresins, sodium hypochlorite, and peracetic acid against clinical and environmental isolates recovered from a hemodialysis unit. Antimicrob. Resist. Infect. Control 2018, 7, 14. [Google Scholar] [CrossRef] [PubMed] [Green Version]
- Kastbjerg, V.G.; Gram, L. Industrial disinfectants do not select for resistance in Listeria monocytogenes following long term exposure. Int. J. Food Microbiol. 2012, 160, 11–15. [Google Scholar] [CrossRef] [PubMed]
- Vitullo, M.; Grant, K.A.; Sammarco, M.L.; Tamburro, M.; Ripabelli, G.; Amar, C.F.L. Real-time PCRs assay for serogrouping Listeria monocytogenes and differentiation from other Listeria spp. Mol. Cell. Probes 2013, 27, 68–70. [Google Scholar] [CrossRef] [PubMed]
- Yanisch-Perron, C.; Vieira, J.; Messing, J. Improved M13 phage cloning vectors and host strains: Nucleotide sequences of the M13mpl8 and pUC19 vectors. Gene 1985, 33, 103–119. [Google Scholar] [CrossRef]
- Ragon, M.; Wirth, T.; Hollandt, F.; Lavenir, R.; Lecuit, M.; Le, M.A.; Brisse, S. A new perspective on Listeria monocytogenes evolution. PLoS Pathog. 2008, 4, e1000146. [Google Scholar] [CrossRef] [PubMed]
- Bankevich, A.; Nurk, S.; Antipov, D.; Gurevich, A.A.; Dvorkin, M.; Kulikov, A.S.; Lesin, V.M.; Nikolenko, S.I.; Pham, S.; Prjibelski, A.D.; et al. SPAdes: A new genome assembly algorithm and its applications to single-cell sequencing. J. Comput. Biol. 2012, 19, 455–477. [Google Scholar] [CrossRef] [PubMed]
- Langsrud, S.; Sidhu, M.S.; Heir, E.; Holck, A. Bacterial disinfectant resistance—A challenge for the food industry. Int. J. Biodeter. Biodegrad. 2003, 51, 283–290. [Google Scholar] [CrossRef]
- Altschul, S.F.; Madden, T.L.; Schäffer, A.A.; Zhang, J.; Zhang, Z.; Miller, W.; Lipman, D.J. Gapped BLAST and PSI-BLAST: A new generation of protein database search programs. Nucleic Acids Res. 1997, 25, 3389–3402. [Google Scholar] [CrossRef] [PubMed]
- Jordan, K.; Fox, E.M.; Wagner, M. (Eds.) Listeria monocytogenes—Methods and Protocols; Springer: New York, NY, USA, 2014; Volume 1157. [Google Scholar]
- Wiegand, I.; Hilpert, K.; Hancock, R.E.W. Agar and broth dilution methods to determine the minimal inhibitory concentration (MIC) of antimicrobial substances. Nat. Protoc. 2008, 3, 163–175. [Google Scholar] [CrossRef] [PubMed]
- Kuznetsova, A.; Bruun Brockhoff, P.; Bojesen Christensen, H. lmerTest: Tests in Linear Mixed Effects Models. 2016. Available online: https://CRAN. R-project. org/package=lmerTest (accessed on 14 December 2018).
- Lenth, R.V. Least-Squares Means: The RPackage lsmeans. J. Stat. Softw. 2016, 69, 1–33. [Google Scholar] [CrossRef]
- Venable, W.N.; Ripley, B.D. Modern Applied Statistics with S, 4th ed.; Springer: Berlin/Heidelberg, Germany, 2002. [Google Scholar]
- Wickham, H. ggplot2: Elegant graphics for data analysis. In ggplot2: Elegant Graphics for Data Analysis; Springer: New York, NY, USA, 2009. [Google Scholar]
Figure 1.
Core genome MLST (cgMLST) for 20 selected strains from the collection. See main text for details.
Figure 1.
Core genome MLST (cgMLST) for 20 selected strains from the collection. See main text for details.

Figure 2.
Biofilm formation by clonal complex, at 22 and 8 °C. The y-axis represents optical density in a crystal violet assay, the x-axis represents strains by clonal complex.
Figure 2.
Biofilm formation by clonal complex, at 22 and 8 °C. The y-axis represents optical density in a crystal violet assay, the x-axis represents strains by clonal complex.

Figure 3.
Minimal inhibitory concentration (MIC) of benzalkonium chlorice (BC) by clonal complex. The y-axis represents frequency. The colors represent the highest concentration of BC (in μg/mL) at which confluent growth was observed after 48 h at 37 °C. The x-axis represents the different clonal complexes. n is the number of data points that were observed for each clonal complex.

Figure 4.
Tolerance to peracetic acid (PAA). The x-axis represents the clonal complexes, the y-axis the frequency. Study strains—strains isolated from the food processing facility; comparative strains—strains from the same CC but isolated from unrelated sources. (a) Minimal inhibitory concentration (MIC) for PAA in BHI, at 37 and 8 °C. (b) Minimal bactericidal concentration (MBC) for PAA by medium, BHI—brain heart infusion; water—tap water.


Table 1.
L. monocytogenes strains used in this study.
| Strain | Isolation Date | Source | Purpose | Serogroup | Sequence Type | CC | WGS | brcABC | qacH | emrE | Lineage |
|---|---|---|---|---|---|---|---|---|---|---|---|
| ILS AS1-0001 | 2015/10/15 | FPE | Study strain | 2 | 9 | 9 | 1 | absent | absent | absent | II |
| ILS AS1-0002 | 2015/10/19 | FP | Study strain | 1 | 121 | 121 | n/a | n/a | n/a | II | |
| ILS AS1-0003 | 2015/11/9 | FPE | Study strain | 1 | 204 | 204 | n/a | n/a | n/a | II | |
| ILS AS1-0004 | 2015/11/14 | FPE | Study strain | 1 | 204 | 204 | 2* | present | absent | absent | II |
| ILS AS1-0005 | 2016/2/2 | FPE | Study strain | 2 | 9 | 9 | n/a | n/a | n/a | II | |
| ILS AS1-0006 | 2016/3/9 | FPE | Study strain | 1 | 121 | 121 | 3* | absent | present | absent | II |
| ILS AS1-0007 | 2016/10/20 | FP | Study strain | 1 | 204 | 204 | 2 | present | absent | absent | II |
| ILS AS1-0008 | 2017/1/9 | FPE | Study strain | 2 | 9 | 9 | n/a | n/a | n/a | II | |
| ILS AS1-0009 | 2017/1/9 | FPE | Study strain | 2 | 9 | 9 | n/a | n/a | n/a | II | |
| ILS AS1-0010 | 2017/1/9 | FPE | Study strain | 2 | 9 | 9 | n/a | n/a | n/a | II | |
| ILS AS1-0011 | 2017/1/9 | FPE | Study strain | 2 | 9 | 9 | 1 | present | absent | absent | II |
| ILS AS1-0012 | 2017/1/9 | FPE | Study strain | 2 | 9 | 9 | n/a | n/a | n/a | II | |
| ILS AS1-0013 | 2017/1/9 | FPE | Study strain | 2 | 9 | 9 | n/a | n/a | n/a | II | |
| ILS AS1-0014 | 2017/1/9 | FPE | Study strain | 2 | 9 | 9 | n/a | n/a | n/a | II | |
| ILS AS1-0015 | 2017/6/26 | FPE | Study strain | 2 | 9 | 9 | n/a | n/a | n/a | II | |
| ILS AS1-0016 | 2017/6/29 | FPE | Study strain | 2 | 9 | 9 | n/a | n/a | n/a | II | |
| ILS AS1-0017 | 2017/7/7 | FPE | Study strain | 2 | 9 | 9 | n/a | n/a | n/a | II | |
| ILS AS1-0018 | 2017/7/7 | FPE | Study strain | 4 | 6 | 6 | 4 | absent | absent | absent | I |
| ILS AS1-0019 | 2017/8/10 | FP | Study strain | 1 | 121 | 121 | 3 | absent | present | absent | II |
| ILS AS1-0020 | 2017/9/12 | FP | Study strain | 1 | 204 | 204 | n/a | n/a | n/a | II | |
| ILS AS1-0021 | 2017/9/13 | FP | Study strain | 1 | 204 | 204 | n/a | n/a | n/a | II | |
| ILS AS1-0022 | 2017/9/18 | FPE | Study strain | 2 | 9 | 9 | n/a | n/a | n/a | II | |
| ILS AS1-0023 | 2017/9/18 | FPE | Study strain | 1 | 204 | 204 | n/a | n/a | n/a | II | |
| ILS AS1-0024 | 2017/11/6 | FPE | Study strain | 2 | 9 | 9 | n/a | n/a | n/a | II | |
| ILS AS1-0025 | 2017/11/6 | FPE | Study strain | 2 | 9 | 9 | n/a | n/a | n/a | II | |
| ILS AS1-0026 | 2017/11/13 | FPE | Study strain | 1 | 204 | 204 | 1 | absent | absent | absent | II |
| ILS AS1-0027 | 2017/11/23 | FPE | Study strain | 2 | 9 | 9 | n/a | n/a | n/a | II | |
| ILS AS1-0028 | 2017/12/5 | FPE | Study strain | 2 | 9 | 9 | n/a | n/a | n/a | II | |
| ILS AS1-0029 | 2017/12/5 | FPE | Study strain | 2 | 9 | 9 | n/a | n/a | n/a | II | |
| ILS AS1-0030 | 2017/12/5 | FPE | Study strain | 2 | 9 | 9 | n/a | n/a | n/a | II | |
| ILS AS1-0031 | 2017/12/5 | FPE | Study strain | 1 | 204 | 204 | n/a | n/a | n/a | II | |
| ILS AS1-0032 | 2017/12/7 | FPE | Study strain | 1 | 20 | 20 | n/a | n/a | n/a | II | |
| ILS AS1-0033 | 2017/12/7 | FPE | Study strain | 1 | 20 | 20 | n/a | n/a | n/a | II | |
| ILS AS1-0034 | 2017/12/7 | FPE | Study strain | 2 | 9 | 9 | n/a | n/a | n/a | II | |
| ILS AS1-0035 | 2017/12/5 | FPE | Study strain | 2 | 9 | 9 | n/a | n/a | n/a | II | |
| ILS AS1-0036 | 2017/12/5 | FPE | Study strain | 2 | 9 | 9 | n/a | n/a | n/a | II | |
| ILS AS1-0037 | 2017/12/5 | FPE | Study strain | 2 | 9 | 9 | n/a | n/a | n/a | II | |
| ILS AS1-0038 | 2017/12/5 | FPE | Study strain | 2 | 9 | 9 | 1 | absent | absent | absent | II |
| ILS AS1-0039 | 2017/12/14 | FPE | Study strain | 1 | 121 | 121 | 3 | absent | present | absent | II |
| ILS AS1-0040 | 2018/1/23 | FPE | Study strain | 1 | 204 | 204 | n/a | n/a | n/a | II | |
| ILS AS1-0041 | 2018/1/23 | FPE | Study strain | 2 | 9 | 9 | n/a | n/a | n/a | II | |
| ILS AS1-0042 | 2018/1/23 | FPE | Study strain | 2 | 9 | 9 | n/a | n/a | n/a | II | |
| ILS AS1-0043 | 2018/1/23 | FPE | Study strain | 1 | 29 | 29 | n/a | n/a | n/a | II | |
| ILS AS1-0044 | 2018/1/23 | FPE | Study strain | 2 | 9 | 9 | n/a | n/a | n/a | II | |
| ILS AS1-0045 | 2018/1/25 | FPE | Study strain | 2 | 9 | 9 | n/a | n/a | n/a | II | |
| ILS AS1-0046 | 2018/1/25 | FPE | Study strain | 2 | 9 | 9 | n/a | n/a | n/a | II | |
| ILS AS1-0047 | 2018/1/25 | FPE | Study strain | 1 | 204 | 204 | n/a | n/a | n/a | II | |
| ILS AS1-0048 | 2018/1/25 | FPE | Study strain | 2 | 9 | 9 | n/a | n/a | n/a | II | |
| ILS AS1-0049 | 2018/1/25 | FPE | Study strain | 2 | 9 | 9 | n/a | n/a | n/a | II | |
| ILS AS1-0050 | 2018/1/25 | FPE | Study strain | 2 | 9 | 9 | n/a | n/a | n/a | II | |
| ILS AS1-0051 | 2018/1/25 | FPE | Study strain | 2 | 9 | 9 | n/a | n/a | n/a | II | |
| ILS AS1-0052 | 2018/1/25 | FPE | Study strain | 2 | 9 | 9 | n/a | n/a | n/a | II | |
| ILS AS1-0053 | 2018/1/25 | FPE | Study strain | 2 | 9 | 9 | n/a | n/a | n/a | II | |
| ILS AS1-0054 | 2018/1/25 | FPE | Study strain | 1 | 204 | 204 | n/a | n/a | n/a | II | |
| ILS AS1-0055 | 2018/1/25 | FPE | Study strain | 1 | 204 | 204 | n/a | n/a | n/a | II | |
| ILS AS1-0056 | 2018/1/25 | FPE | Study strain | 1 | 204 | 204 | 2 | present | absent | absent | II |
| ILS AS1-0057 | 2018/1/25 | FPE | Study strain | 2 | 9 | 9 | n/a | n/a | n/a | II | |
| ILS AS1-0058 | 2018/1/25 | FPE | Study strain | 2 | 9 | 9 | n/a | n/a | n/a | II | |
| ILS AS1-0059 | 2018/1/25 | FPE | Study strain | 2 | 9 | 9 | 1 | present | absent | absent | II |
| ILS AS1-0060 | 2018/1/25 | FPE | Study strain | 2 | 9 | 9 | n/a | n/a | n/a | II | |
| ILS AS1-0061 | 2018/1/25 | FPE | Study strain | 2 | 9 | 9 | n/a | n/a | n/a | II | |
| ILS AS1-0062 | 2018/1/26 | FPE | Study strain | 2 | 9 | 9 | n/a | n/a | n/a | II | |
| ILS AS1-0063 | 2018/1/26 | FPE | Study strain | 2 | 9 | 9 | n/a | n/a | n/a | II | |
| ILS AS1-0064 | 2018/1/25 | FPE | Study strain | 2 | 9 | 9 | n/a | n/a | n/a | II | |
| ILS AS1-0065 | 2018/1/25 | FPE | Study strain | 2 | 9 | 9 | n/a | n/a | n/a | II | |
| ILS AS1-0066 | 2018/1/25 | FPE | Study strain | 1 | 391 | 89 | n/a | n/a | n/a | II | |
| ILS AS1-0067 | 2018/2/6 | FPE | Study strain | 2 | 9 | 9 | n/a | n/a | n/a | II | |
| ILS AS1-0068 | 2018/2/6 | FPE | Study strain | 2 | 9 | 9 | n/a | n/a | n/a | II | |
| ILS AS1-0069 | 2018/2/7 | FPE | Study strain | 1 | 29 | 29 | n/a | n/a | n/a | II | |
| ILS AS1-0070 | 2018/2/6 | FPE | Study strain | 2 | 9 | 9 | n/a | n/a | n/a | II | |
| ILS AS1-0071 | 2018/2/9 | FPE | Study strain | 2 | 9 | 9 | n/a | n/a | n/a | II | |
| ILS AS1-0072 | 2018/2/9 | FPE | Study strain | 2 | 9 | 9 | 1 | present | absent | absent | II |
| ILS AS1-0073 | 2018/2/9 | FPE | Study strain | 4 | 6 | 6 | 4 | absent | absent | absent | I |
| ILS AS1-0074 | 2018/2/9 | FPE | Study strain | 1 | 29 | 29 | n/a | n/a | n/a | II | |
| ILS AS1-0075 | 2018/2/9 | FPE | Study strain | 1 | 8 | 8 | n/a | n/a | n/a | II | |
| ILS AS1-0076 | 2018/2/9 | FPE | Study strain | 1 | 20 | 20 | n/a | n/a | n/a | II | |
| ILS AS1-0077 | 2018/2/9 | FPE | Study strain | 1 | 29 | 29 | n/a | n/a | n/a | II | |
| ILS AS1-0078 | 2018/2/9 | FPE | Study strain | 2 | 9 | 9 | n/a | n/a | n/a | II | |
| ILS AS1-0079 | 2018/2/9 | FPE | Study strain | 1 | 121 | 121 | n/a | n/a | n/a | II | |
| ILS AS1-0080 | 2018/2/9 | FPE | Study strain | 1 | 121 | 121 | 3 | absent | present | absent | II |
| ILS AS1-0081 | 2018/2/9 | FPE | Study strain | 2 | 9 | 9 | n/a | n/a | n/a | II | |
| ILS AS1-0082 | 2018/2/9 | FPE | Study strain | 2 | 9 | 9 | n/a | n/a | n/a | II | |
| ILS AS1-0083 | 2018/2/9 | FPE | Study strain | 1 | 204 | 204 | n/a | n/a | n/a | II | |
| ILS AS1-0084 | 2018/2/9 | FPE | Study strain | 1 | 204 | 204 | n/a | n/a | n/a | II | |
| ILS AS1-0085 | 2018/2/9 | FPE | Study strain | 2 | 9 | 9 | n/a | n/a | n/a | II | |
| ILS AS1-0086 | 2018/2/9 | FPE | Study strain | 1 | 20 | 20 | n/a | n/a | n/a | II | |
| ILS AS1-0087 | 2018/2/9 | FPE | Study strain | 1 | 204 | 204 | n/a | n/a | n/a | II | |
| ILS AS1-0088 | 2018/2/9 | FPE | Study strain | 2 | 9 | 9 | n/a | n/a | n/a | II | |
| ILS AS1-0089 | 2018/2/9 | FPE | Study strain | 2 | 9 | 9 | n/a | n/a | n/a | II | |
| ILS AS1-0090 | 2018/2/9 | FPE | Study strain | 2 | 9 | 9 | n/a | n/a | n/a | II | |
| ILS AS1-0091 | 2018/2/10 | FPE | Study strain | 2 | 9 | 9 | n/a | n/a | n/a | II | |
| ILS AS1-0092 | 2018/2/13 | FPE | Study strain | 2 | 9 | 9 | 1 | present | absent | absent | II |
| ILS AS1-0093 | 2018/3/21 | FPE | Study strain | 2 | 9 | 9 | n/a | n/a | n/a | II | |
| ILS AS1-0094 | 2018/4/5 | FPE | Study strain | 2 | 9 | 9 | n/a | n/a | n/a | II | |
| ILS AS1-0095 | 2018/4/5 | FPE | Study strain | 2 | 9 | 9 | n/a | n/a | n/a | II | |
| ILS AS1-0096 | 2018/4/5 | FPE | Study strain | 2 | 9 | 9 | n/a | n/a | n/a | II | |
| ILS AS1-0097 | 2018/4/5 | FPE | Study strain | 2 | 9 | 9 | n/a | n/a | n/a | II | |
| ILS AS1-0098 | 2018/5/22 | FPE | Study strain | 1 | 204 | 204 | 2 | present | absent | absent | II |
| ILS AS1-0099 | 2018/5/22 | FPE | Study strain | 1 | 204 | 204 | n/a | n/a | n/a | II | |
| ILS AS1-0100 | 2018/3/21 | FPE | Study strain | 2 | 9 | 9 | n/a | n/a | n/a | II | |
| ILS AS1-0101 | 2018/5/25 | FPE | Study strain | 2 | 9 | 9 | n/a | n/a | n/a | II | |
| ILS AS1-0102 | 2018/5/25 | FPE | Study strain | 2 | 9 | 9 | n/a | n/a | n/a | II | |
| ILS AS1-0103 | 2018/5/25 | FPE | Study strain | 2 | 9 | 9 | n/a | n/a | n/a | II | |
| ILS AS1-0104 | 2018/5/25 | FPE | Study strain | 2 | 9 | 9 | present | absent | absent | II | |
| ILS AS1-0105 | 2018/5/25 | FPE | Study strain | 2 | 9 | 9 | n/a | n/a | n/a | II | |
| ILS AS1-0106 | 2018/5/25 | FPE | Study strain | 2 | 9 | 9 | n/a | n/a | n/a | II | |
| ILS AS1-0107 | 2018/5/25 | FPE | Study strain | 2 | 9 | 9 | n/a | n/a | n/a | II | |
| ILS AS1-0108 | 2018/5/25 | FPE | Study strain | 4 | 6 | 6 | n/a | n/a | n/a | I | |
| ILS AS1-0109 | 2018/6/19 | FP | Study strain | 2 | 9 | 9 | n/a | n/a | n/a | II | |
| ILS AS1-0110 | 2018/6/25 | FPE | Study strain | 1 | 204 | 204 | n/a | n/a | n/a | II | |
| ILS AS1-0111 | 2018/6/25 | FPE | Study strain | 1 | 204 | 204 | 2 | present | absent | absent | II |
| ILS AS1-0112 | 2018/6/26 | FPE | Study strain | 1 | 204 | 204 | n/a | n/a | n/a | II | |
| ILS AS1-0113 | 2018/6/26 | FPE | Study strain | 1 | 204 | 204 | n/a | n/a | n/a | II | |
| ILS AS1-0114 | 2018/6/26 | FPE | Study strain | 1 | 204 | 204 | n/a | n/a | n/a | II | |
| ILS AS1-0115 | 2018/6/26 | FPE | Study strain | 1 | 204 | 204 | 2 | present | absent | absent | II |
| ILS AS1-0116 | 2018/6/26 | FPE | Study strain | 1 | 204 | 204 | n/a | n/a | n/a | II | |
| ILS AS1-0117 | 2018/6/26 | FPE | Study strain | 1 | 204 | 204 | n/a | n/a | n/a | II | |
| ILS AS1-0118 | 2018/6/26 | FPE | Study strain | 1 | 204 | 204 | n/a | n/a | n/a | II | |
| ILS AS1-0119 | 2028/6/25 | FP | Study strain | 2 | 9 | 9 | 1 | present | absent | absent | II |
| ILS AS1-0120 | 2018/7/16 | FPE | Study strain | 1 | 204 | 204 | n/a | n/a | n/a | II | |
| ILS AS1-0121 | 2018/7/16 | FPE | Study strain | 1 | 204 | 204 | n/a | n/a | n/a | II | |
| ILS AS1-0122 | 2018/7/16 | FPE | Study strain | 1 | 204 | 204 | n/a | n/a | n/a | II | |
| ILS AS1-0123 | 2018/8/3 | FP | Study strain | 1 | 121 | 121 | n/a | n/a | n/a | II | |
| ILS AS1-0124 | 2018/8/9 | FPE | Study strain | 1 | 204 | 204 | n/a | n/a | n/a | II | |
| ILS-AS-R-001 | PAA reference | 204 | 204 | n/a | n/a | n/a | II | ||||
| ILS-AS-R-002 | PAA reference | 204 | 204 | n/a | n/a | n/a | II | ||||
| ILS-AS-R-003 | PAA reference | 204 | 204 | n/a | n/a | n/a | II | ||||
| ILS-AS-R-004 | PAA reference | 9 | 9 | n/a | n/a | n/a | II | ||||
| ILS-AS-R-005 | PAA reference | 9 | 9 | n/a | n/a | n/a | II | ||||
| ILS-AS-R-006 | PAA reference | 9 | 9 | n/a | n/a | n/a | II | ||||
| ILS-AS-R-007 | PAA reference | 9 | 9 | n/a | n/a | n/a | II | ||||
| ILS-AS-R-008 | PAA reference | 121 | 121 | n/a | n/a | n/a | II | ||||
| ILS-AS-R-009 | PAA reference | 6 | 6 | n/a | n/a | n/a | I | ||||
| N586 | LBF | 3a° | 412 | 412 | n/a | n/a | n/a | II | |||
| N11-1850 | HBF | 4b° | 1290 | 217 | n/a | n/a | n/a | I |
* indicates strains that are associated with a cgMLST cluster without being properly in it. These strains were serotyped with antibodies from Denka-Seiken (Basel, Switzerland). n/a = not applicable; LBF = low biofilm former; HBF = high biofilm former; CC = clonal complex; WGS = core genome multi locus sequencing (cgMLST) cluster; FPE = food processing environment; FP = food product.
Table 2.
Nucleotides used in this study.
 |
© 2019 by the authors. Licensee MDPI, Basel, Switzerland. This article is an open access article distributed under the terms and conditions of the Creative Commons Attribution (CC BY) license (http://creativecommons.org/licenses/by/4.0/).
Share and Cite
MDPI and ACS Style
Stoller, A.; Stevens, M.J.A.; Stephan, R.; Guldimann, C. Characteristics of Listeria Monocytogenes Strains Persisting in a Meat Processing Facility over a 4-Year Period. Pathogens 2019, 8, 32. https://doi.org/10.3390/pathogens8010032
AMA Style
Stoller A, Stevens MJA, Stephan R, Guldimann C. Characteristics of Listeria Monocytogenes Strains Persisting in a Meat Processing Facility over a 4-Year Period. Pathogens. 2019; 8(1):32. https://doi.org/10.3390/pathogens8010032
Chicago/Turabian StyleStoller, Andrea, Marc J. A. Stevens, Roger Stephan, and Claudia Guldimann. 2019. "Characteristics of Listeria Monocytogenes Strains Persisting in a Meat Processing Facility over a 4-Year Period" Pathogens 8, no. 1: 32. https://doi.org/10.3390/pathogens8010032
Note that from the first issue of 2016, this journal uses article numbers instead of page numbers. See further details here.