Article

Integrative Analysis of miRNA and mRNA Expression Profiles in Mammary Glands of Holstein Cows Artificially Infected with Staphylococcus aureus

1
College of Animal Science and Technology, Yangzhou University, Yangzhou 225009, China
2
Jiangsu Co-Innovation Center for the Prevention and Control of Important Animal Infectious Diseases and Zoonoses, College of Veterinary Medicine, Yangzhou University, Yangzhou 225009, China
3
International Corporation Laboratory of Agriculture and Agricultural Products Safety, Yangzhou 225009, China
*
Author to whom correspondence should be addressed.
These authors contributed equally to this study.
Pathogens 2021, 10(5), 506; https://doi.org/10.3390/pathogens10050506
Submission received: 26 March 2021 / Revised: 10 April 2021 / Accepted: 21 April 2021 / Published: 22 April 2021
(This article belongs to the Special Issue Staphylococcus Infections in Humans and Animals)

Abstract

:
Staphylococcus aureus- induced mastitis is one of the most intractable problems for the dairy industry, which causes loss of milk yield and early slaughter of cows worldwide. Few studies have used a comprehensive approach based on the integrative analysis of miRNA and mRNA expression profiles to explore molecular mechanism in bovine mastitis caused by S. aureus. In this study, S. aureus (A1, B1 and C1) and sterile phosphate buffered saline (PBS) (A2, B2 and C2) were introduced to different udder quarters of three individual cows, and transcriptome sequencing and microarrays were utilized to detected miRNA and gene expression in mammary glands from the challenged and control groups. A total of 77 differentially expressed microRNAs (DE miRNAs) and 1625 differentially expressed genes (DEGs) were identified. Gene Ontology (GO) annotation and Kyoto Encyclopedia of Genes and Genomes (KEGG) pathway analysis showed that multiple DEGs were enriched in significant terms and pathways associated with immunity and inflammation. Integrative analysis between DE miRNAs and DEGs proved that miR-664b, miR-23b-3p, miR-331-5p, miR-19b and miR-2431-3p were potential factors regulating the expression levels of CD14 Molecule (CD14), G protein subunit gamma 2 (GNG2), interleukin 17A (IL17A), collagen type IV alpha 1 chain (COL4A1), microtubule associated protein RP/EB family member 2 (MAPRE2), member of RAS oncogene family (RAP1B), LDOC1 regulator of NFKB signaling (LDOC1), low-density lipoprotein receptor (LDLR) and S100 calcium binding protein A9 (S100A9) in bovine mastitis caused by S. aureus. These findings could enhance the understanding of the underlying immune response in bovine mammary glands against S. aureus infection and provide a useful foundation for future application of the miRNA–mRNA-based genetic regulatory network in the breeding cows resistant to S. aureus.

1. Introduction

Bovine mastitis compromises the health and welfare of dairy cattle, as well as decreases the quality and quantity of milk production, causing huge economic losses in the global dairy industry [1]. Staphylococcus aureus is a major etiological pathogen of bovine mastitis, especially subclinical mastitis, causing a persistent and chronic infection, and antibiotic therapies are largely ineffective [2,3,4]. The infectivity and antibiotic resistance of S. aureus and other causative agents make bovine mastitis more difficult to control, which is also a risk of public health [5,6,7,8,9]. By breeding dairy cattle resistance to udder diseases, the risk of mastitis may be reduced in the dairy cow population [10]. Therefore, the identification of specific genes related to mastitis susceptibility or resistance can provide a new way to control mastitis through genetic selection [11,12].
In recent years, numerous studies have shown that bovine mammary epithelial cells (BMECs) respond to the invasion of bacteria or bacterial products by altering the expression levels of several genes involved in inflammation and immunity in vitro [13,14,15]. However, one limitation of these studies is that the conclusions drawn at cellular levels are not necessarily consistent with those of individuals [16]. Although some transcriptome-wide association studies have been carried out on S. aureus-induced mastitis in vivo, these studies always analyzed the expression levels of mRNAs or microRNAs (miRNAs) separately [17,18,19,20,21]. Few studies used a comprehensive approach based on the integrative analysis of miRNA and mRNA expression profiles to improve the understanding of the underlying molecular mechanism of cow mastitis caused by S. aureus.
To investigate various interaction networks and regulatory modes of mRNAs and miRNAs, we constructed a S. aureus-type bovine mastitis model and integrated the analysis of miRNAs and mRNAs between the S. aureus-infected quarters and the control ones. These findings will provide new insights into the mechanism of S. aureus-induced cow mastitis.

2. Results

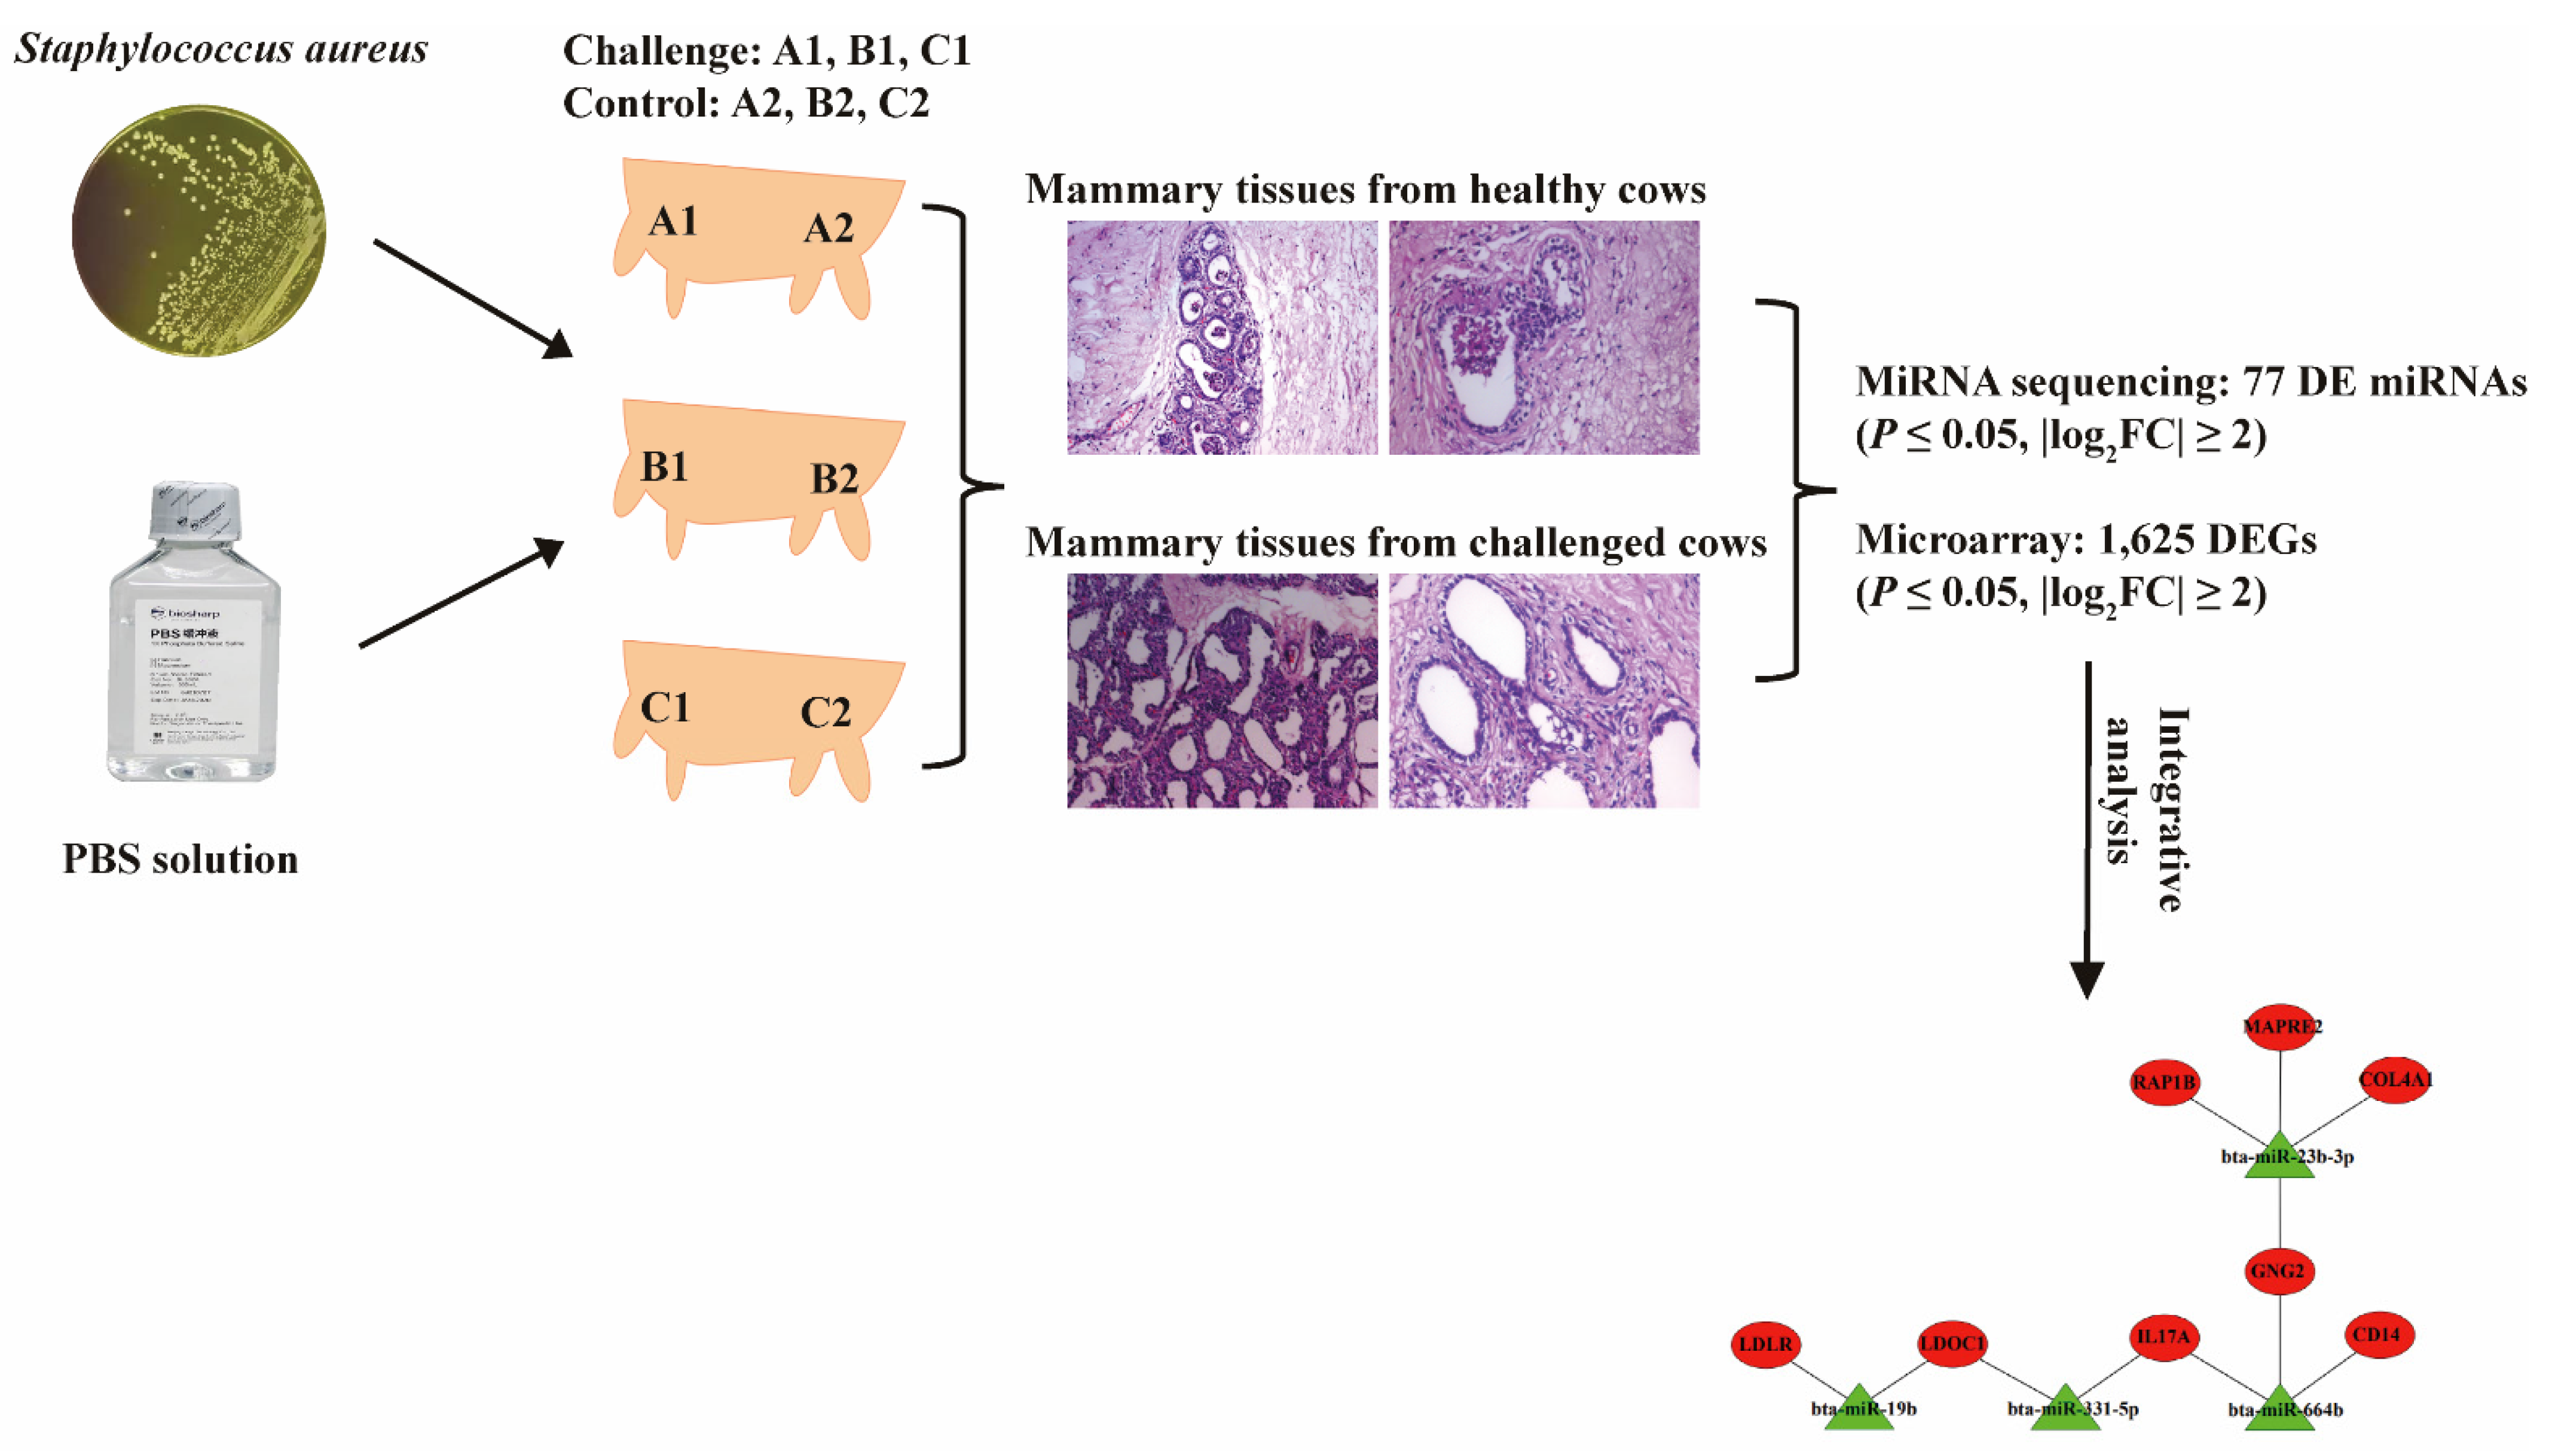
2.1. The Establishment of Bovine S. aureus-Induced Mastitis Model

Indicators of the three cows were measured and recorded after bacterial infection. At 48 h post inoculation, the dairy cattle suffered from obvious pain and had a drastic reduction (25.8% reduction in average) in milk yield. In addition, the temperature of the cows raised (1.7 °C in average), and their mammary glands and lymph nodes were swollen and hard. At the same time, the alteration of the biophysical properties of milk (grey–white color) was observed. There were significant increases of somatic cell count (SCC) of the milk from inoculated quarters (A1: 1,790,000/mL; B1: 1,920,000/mL; and C1: 2,080,000/mL), while those from the controls remained below 100,000/mL.

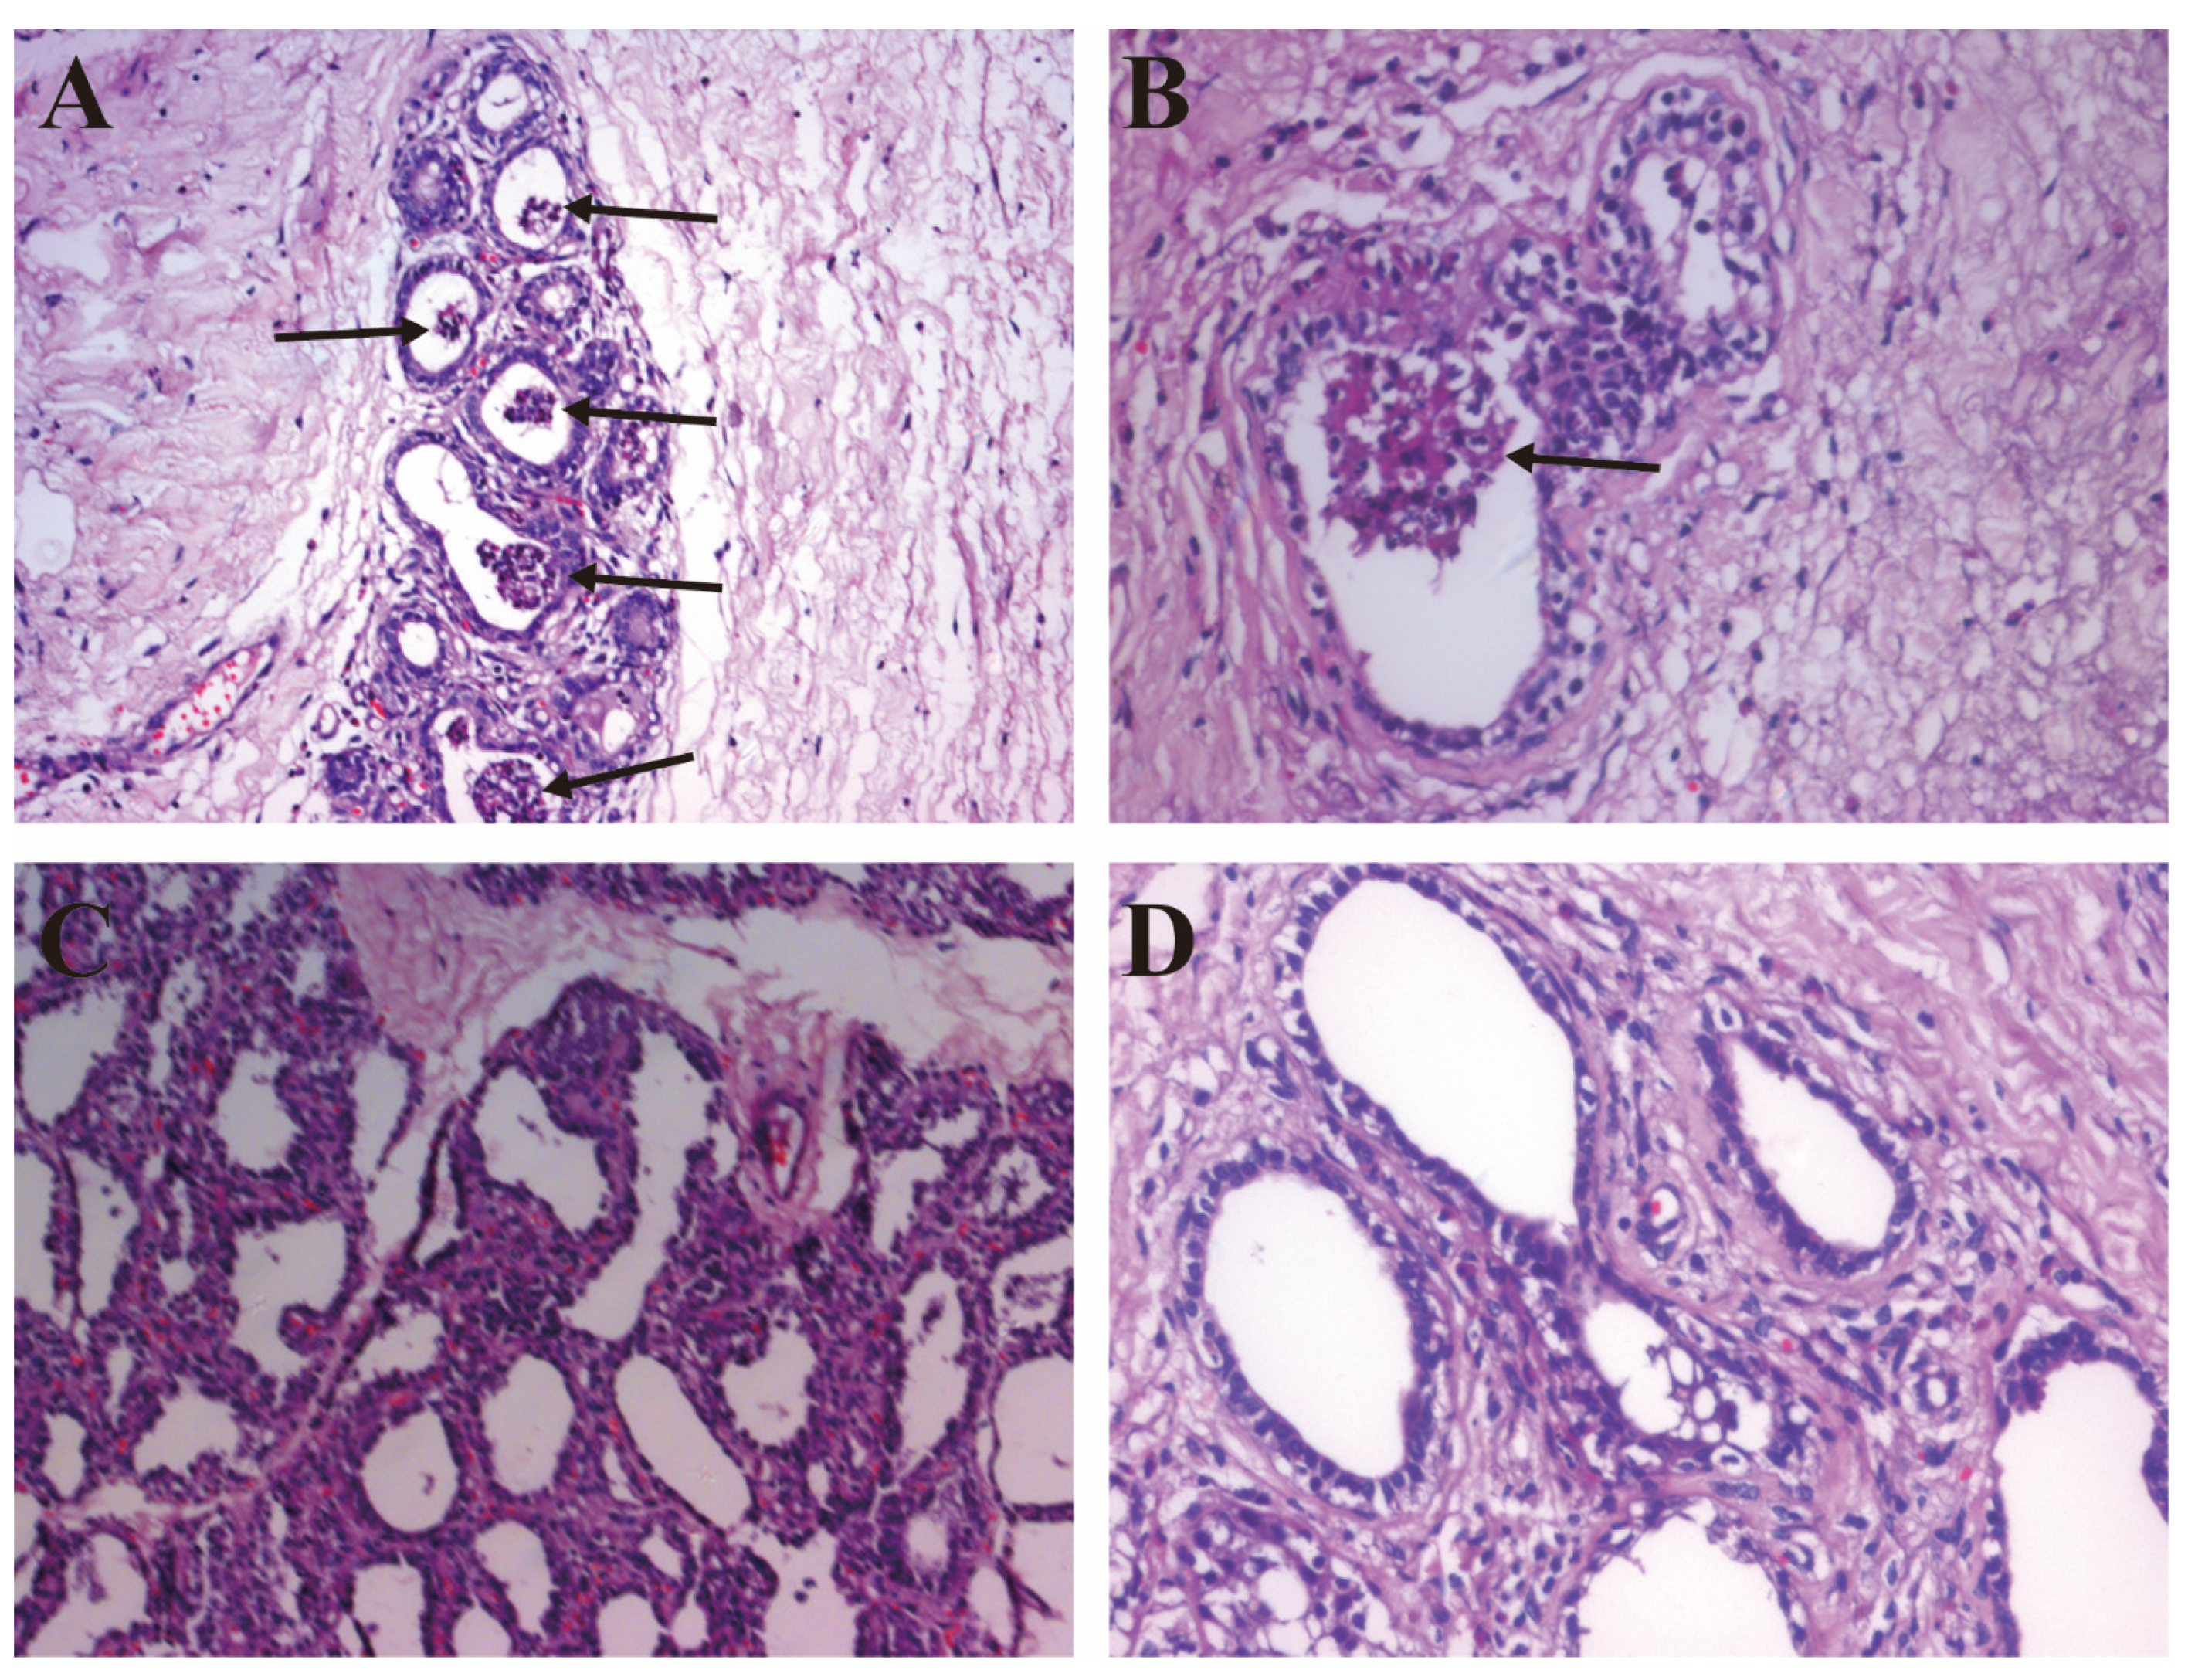
2.2. The Pathological Observation

Compared with the control group, the mammary epithelial cells in the S. aureus-inoculated group were loosely connected and had a lager intercellular space. A large number of inflammatory cells, including shed mammary epithelial cells, macrophages, neutrophils and lymphocytes, were clustered in the acini (Figure 1).

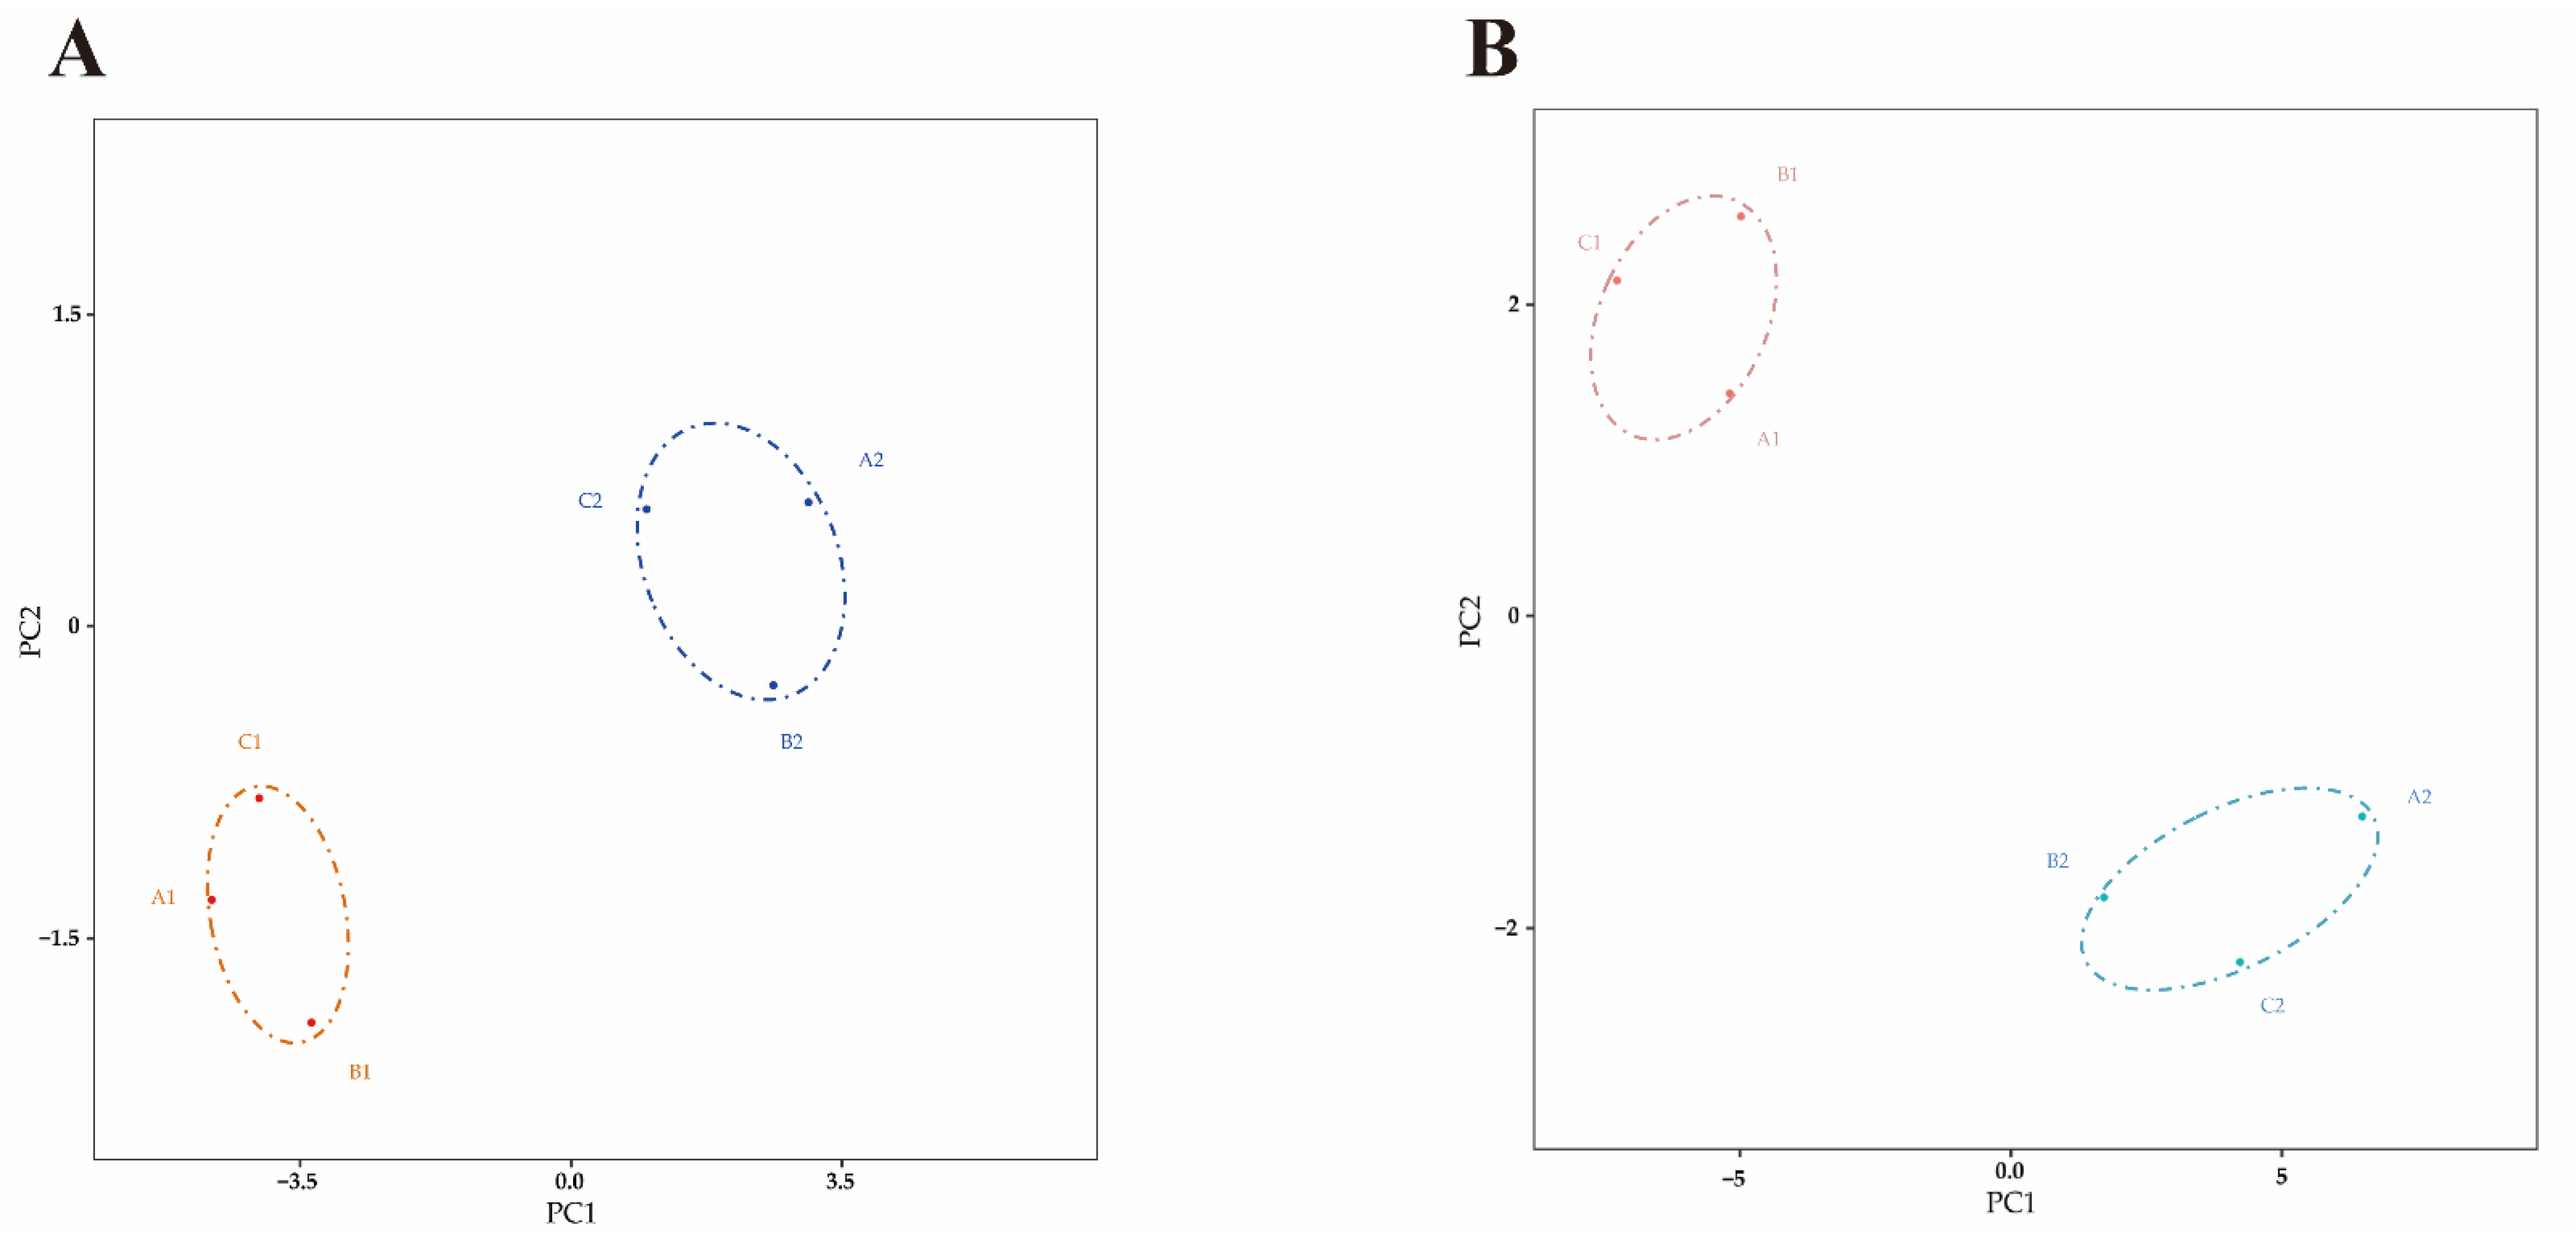
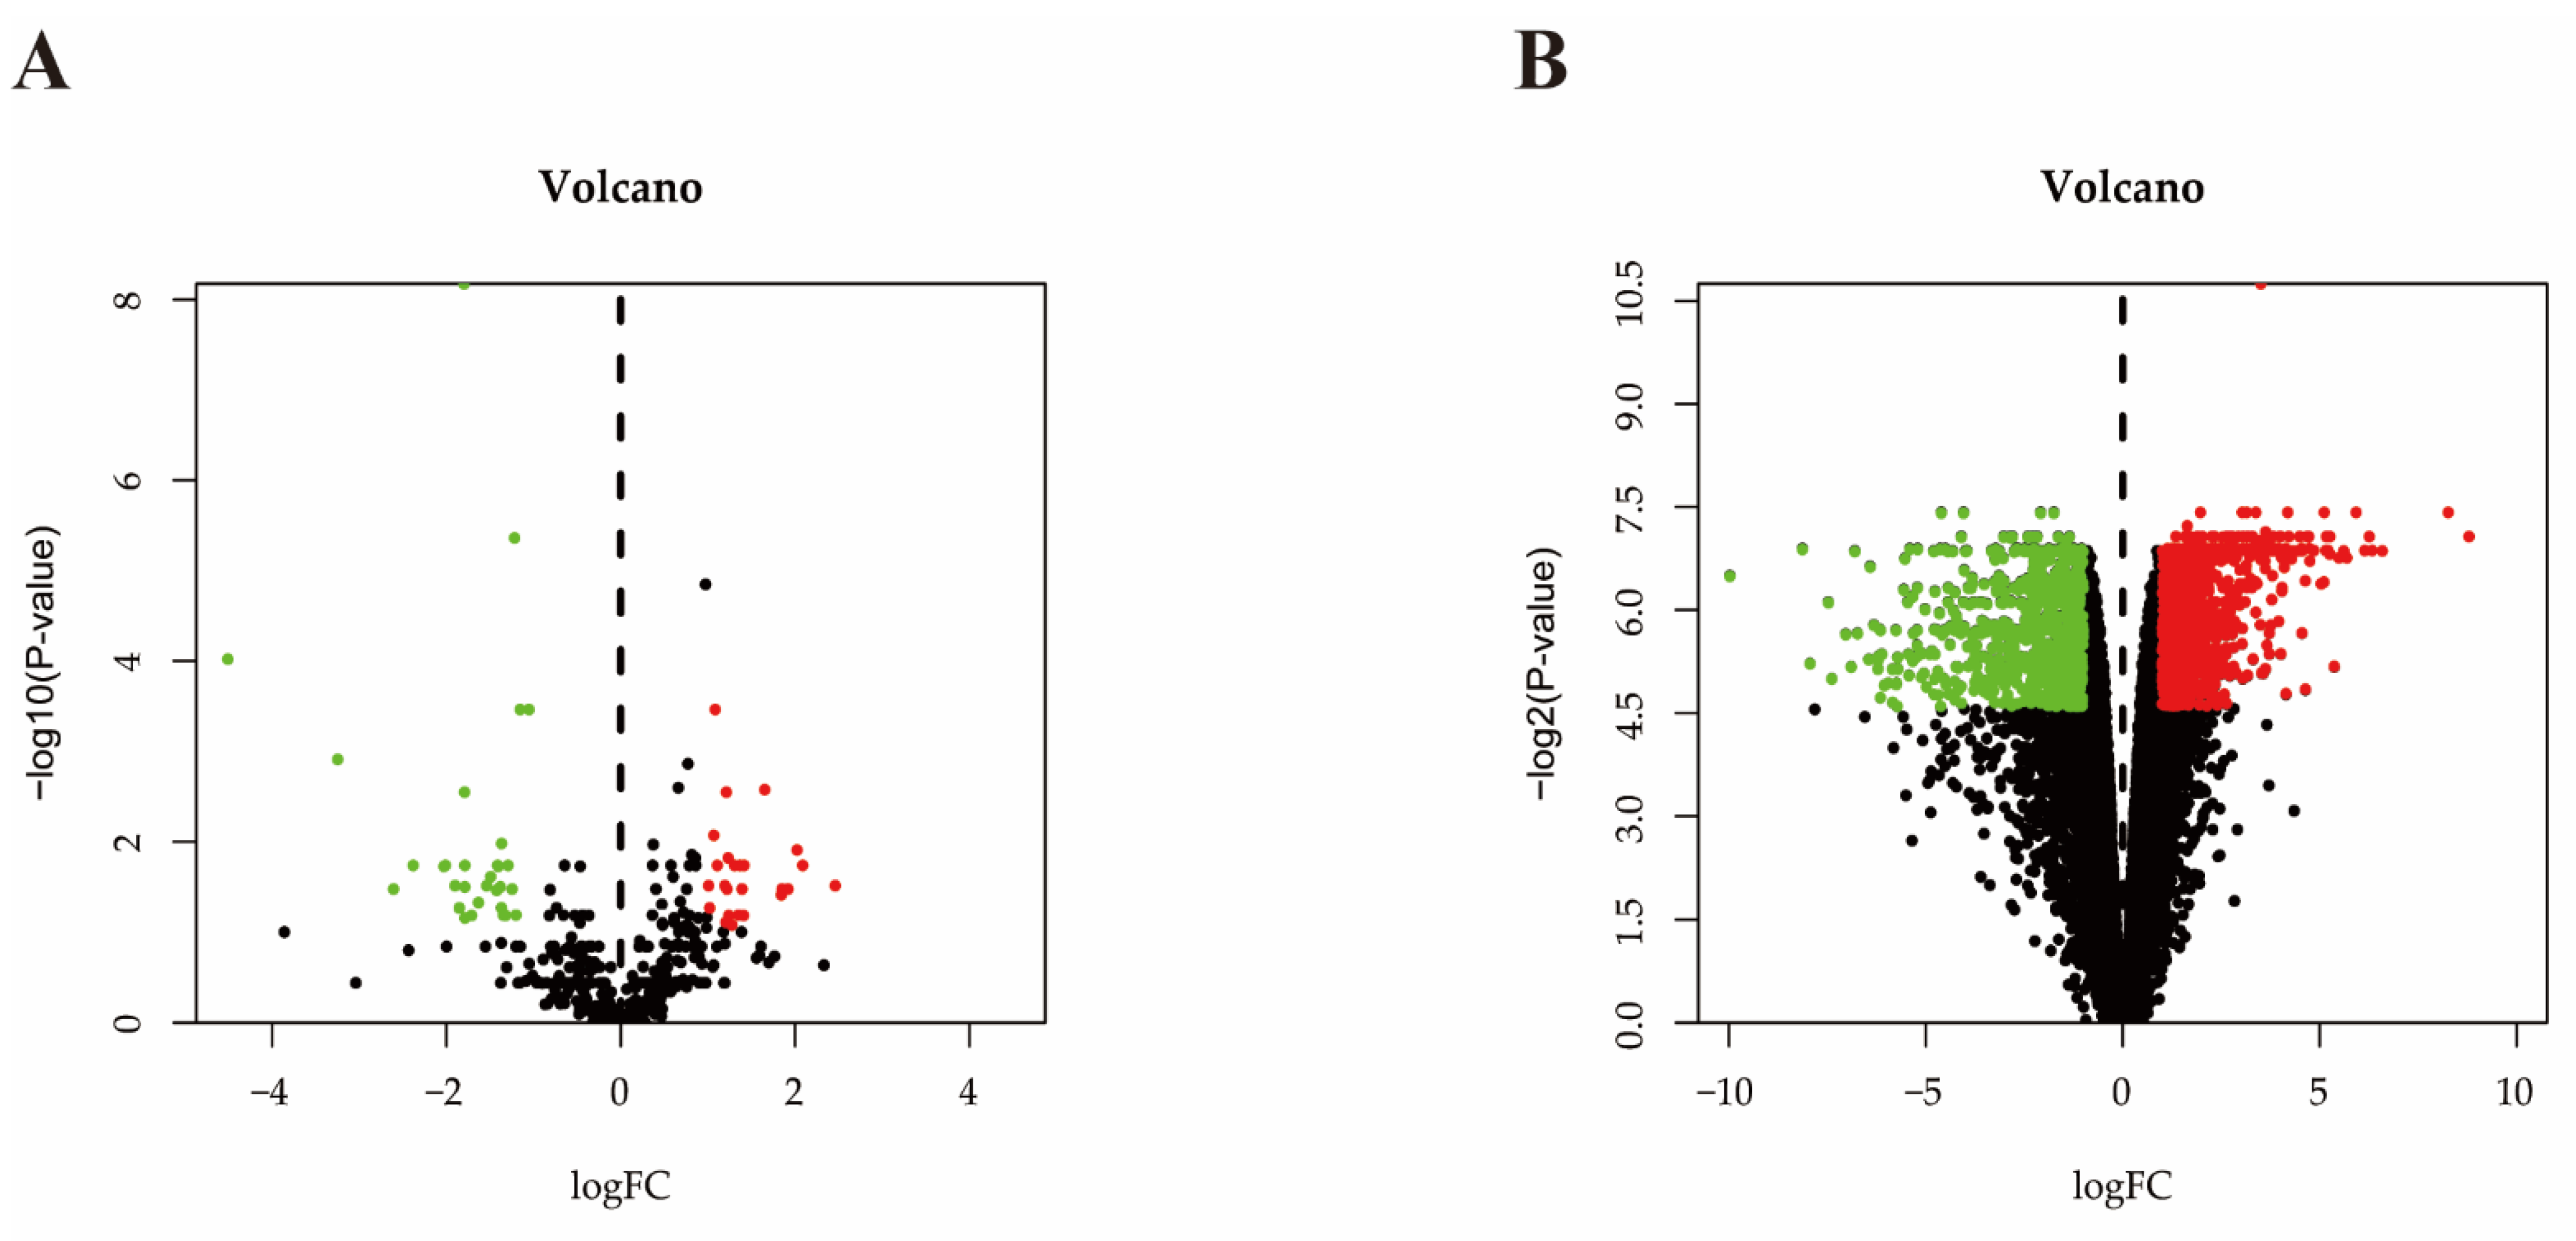
2.3. Differential Expressed miRNA Identification

A total of 21,293,853 and 18,588,177 raw reads were generated from the control and S. aureus-inoculated groups, respectively, by miRNA sequencing (Table S1). After raw reads were disposed, there were 20,847,000 and 18,504,775 clean reads for length distribution assessment. The assessment results revealed that the 78.76% and 71.79% of clean reads were 20–24 nucleotides in length in the two groups (Figure S1). Principal component analysis (PCA) showed the miRNAs in the challenged and control groups can be classified into different clusters, respectively, indicating sequencing data is qualified for further analysis (Figure 2A). A total of 77 DE miRNAs, including 30 up-regulated and 47 down-regulated miRNAs (p ≤ 0.05 and |log2FC| ≥ 1), were identified in the S. aureus-inoculated group, compared with control group (Figure 3A).

2.4. Differential Expressed mRNA Identification

The values of 2100 RIN and 28S/18S were between 7.5–8.9 and 1.3–2.1, respectively (Table S2), indicating that the RNA quality met the requirement and could be used for marker hybridization.
In this study, the CV values of all samples ranged from 3.389% to 4.821% (Table S3), indicating that the detection results of the microarray are reliable.
The PCA was also performed to evaluate the sample distribution. Two separate clusters were found, representing the S. aureus inoculation and control groups, respectively (Figure 2B). The transcriptional sequences of the same group were assembled in the same cluster, indicating that the main differences in the mRNA expression profiles occurred between different groups.
A total of 1030 up-regulated genes and 595 down-regulated genes (p ≤ 0.05 and |log2FC| ≥ 1) were identified in the S. aureus inoculation group versus control group (Figure 3B).

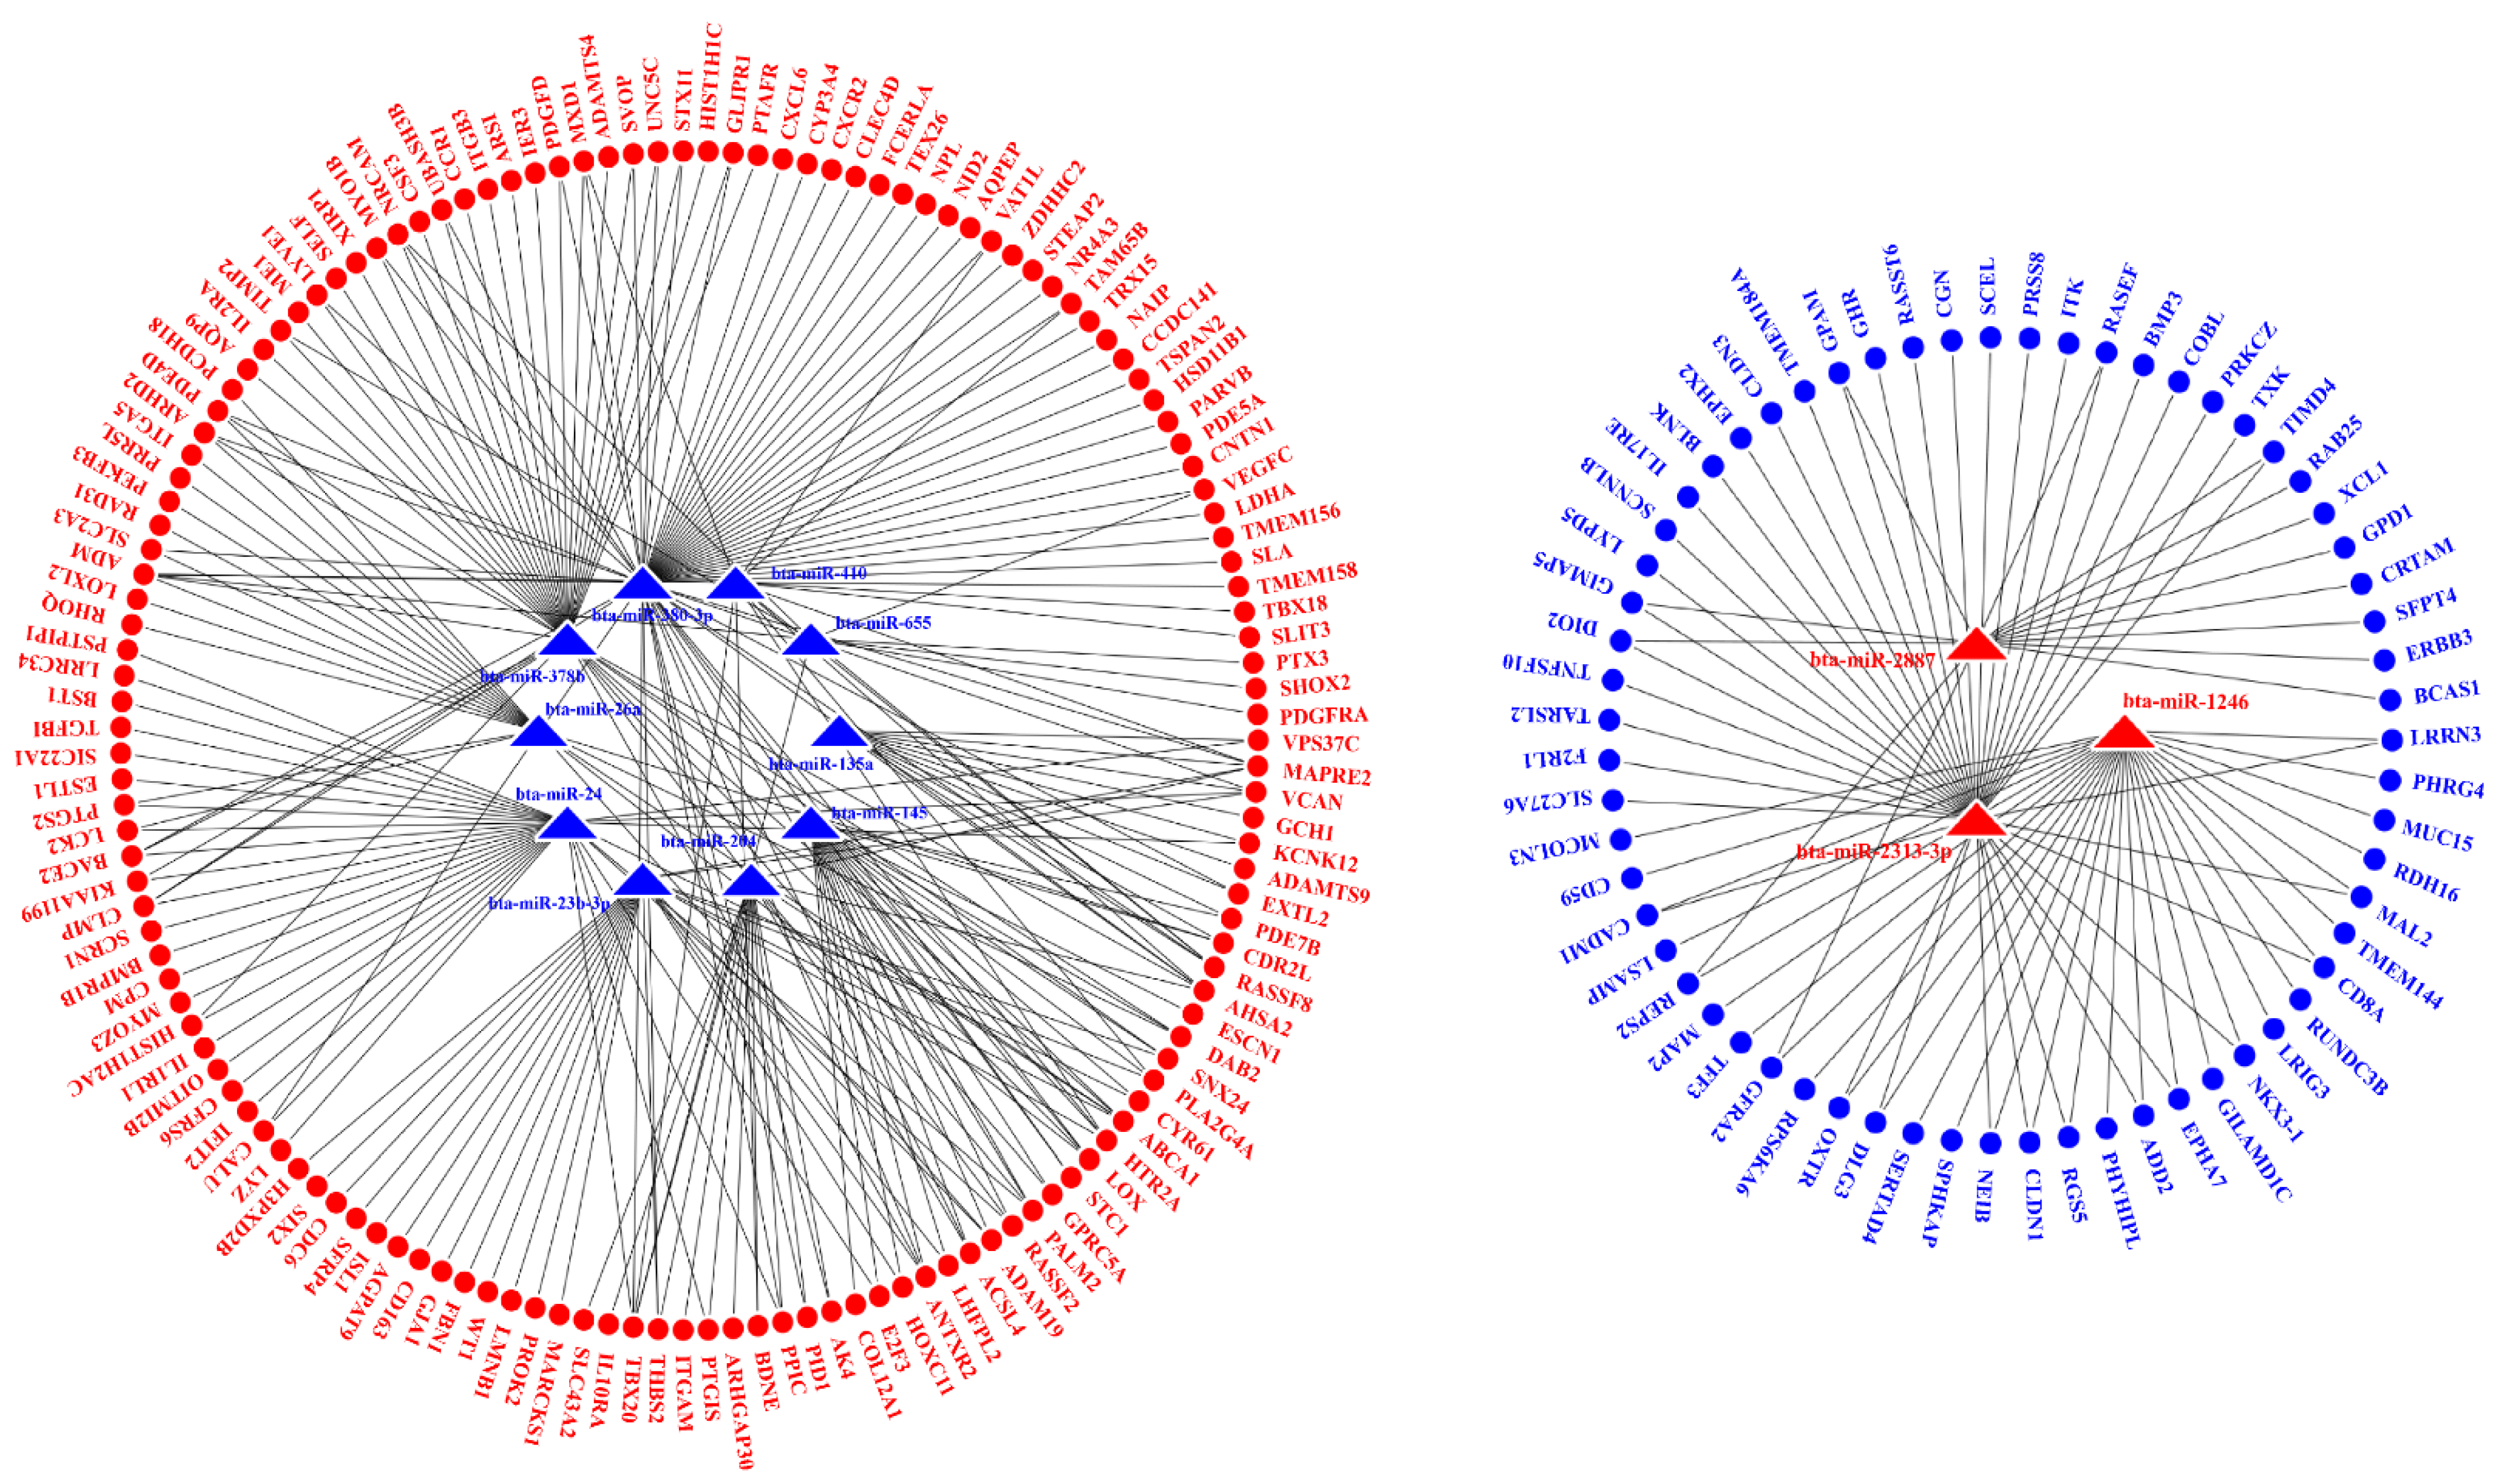
2.5. Interaction Analysis of the miRNAs and mRNAs

Three up-regulated and ten down-regulated DE miRNAs (p ≤ 0.05 and |log2FC| ≥ 2) were selected for the miRNA–mRNA interactive analysis. Among all potential target genes predicted by TargetScan, 143 up-regulated and 63 down-regulated genes identified in this study were employed for the construction of miRNA–mRNA interaction networks (Figure 4).
Among the DE miRNAs and DEGs (p ≤ 0.05 and |log2FC| ≥ 2) employed for the interaction analysis, 76.92% (10/13) of the DE miRNAs and 16.50% (34/206) of the DEGs had been identified by previous studies [20,22,23,24,25,26,27,28,29,30,31].

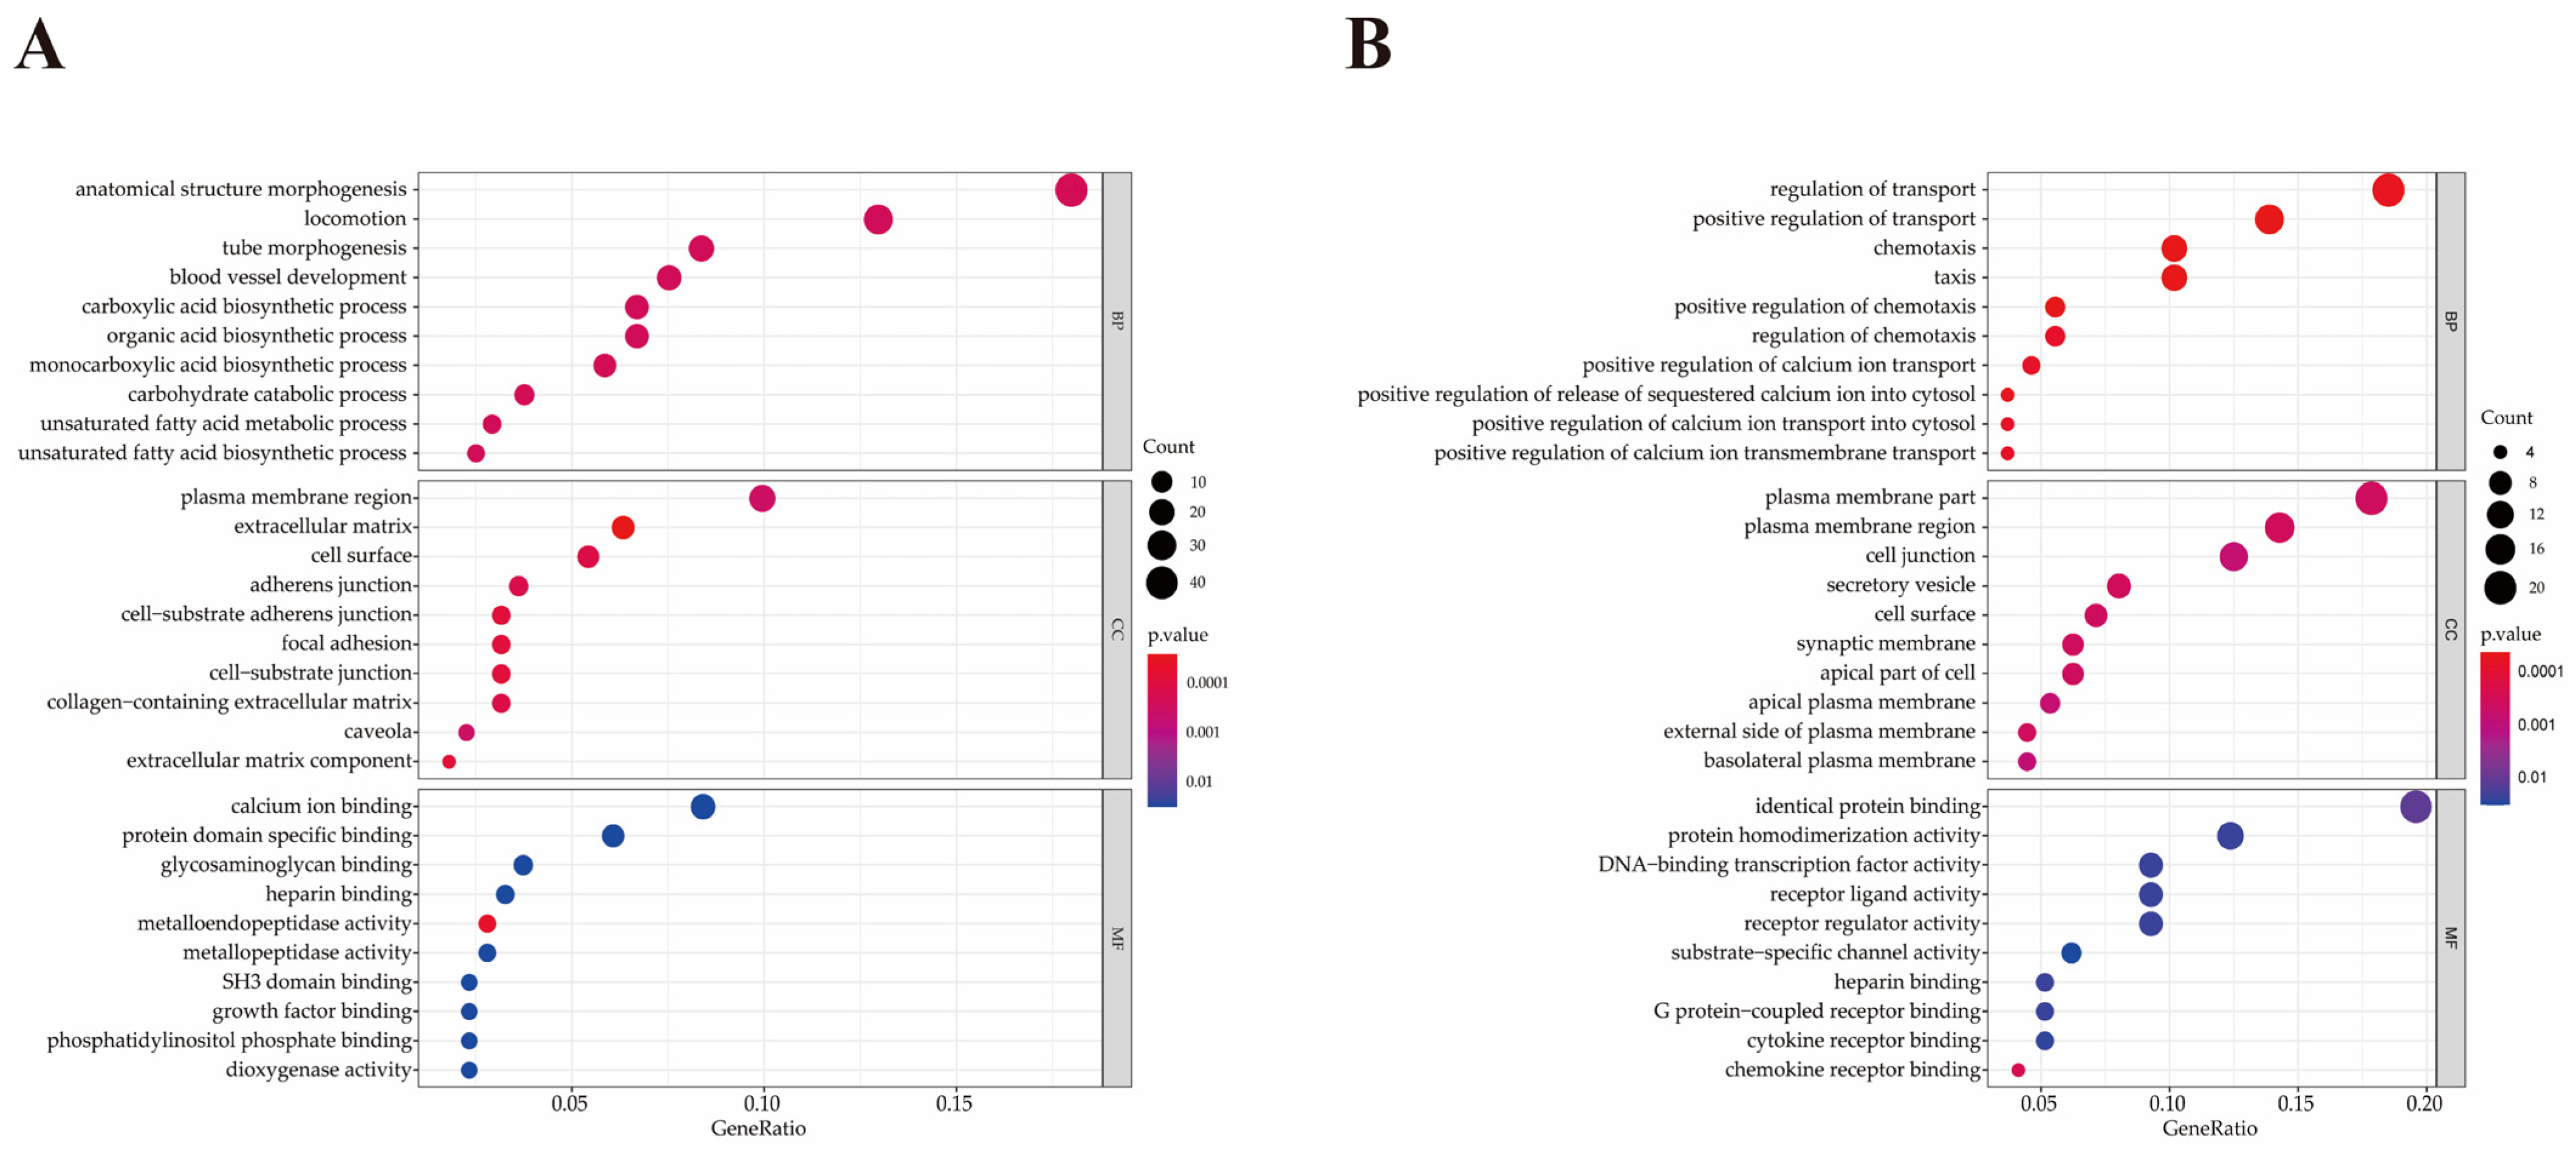
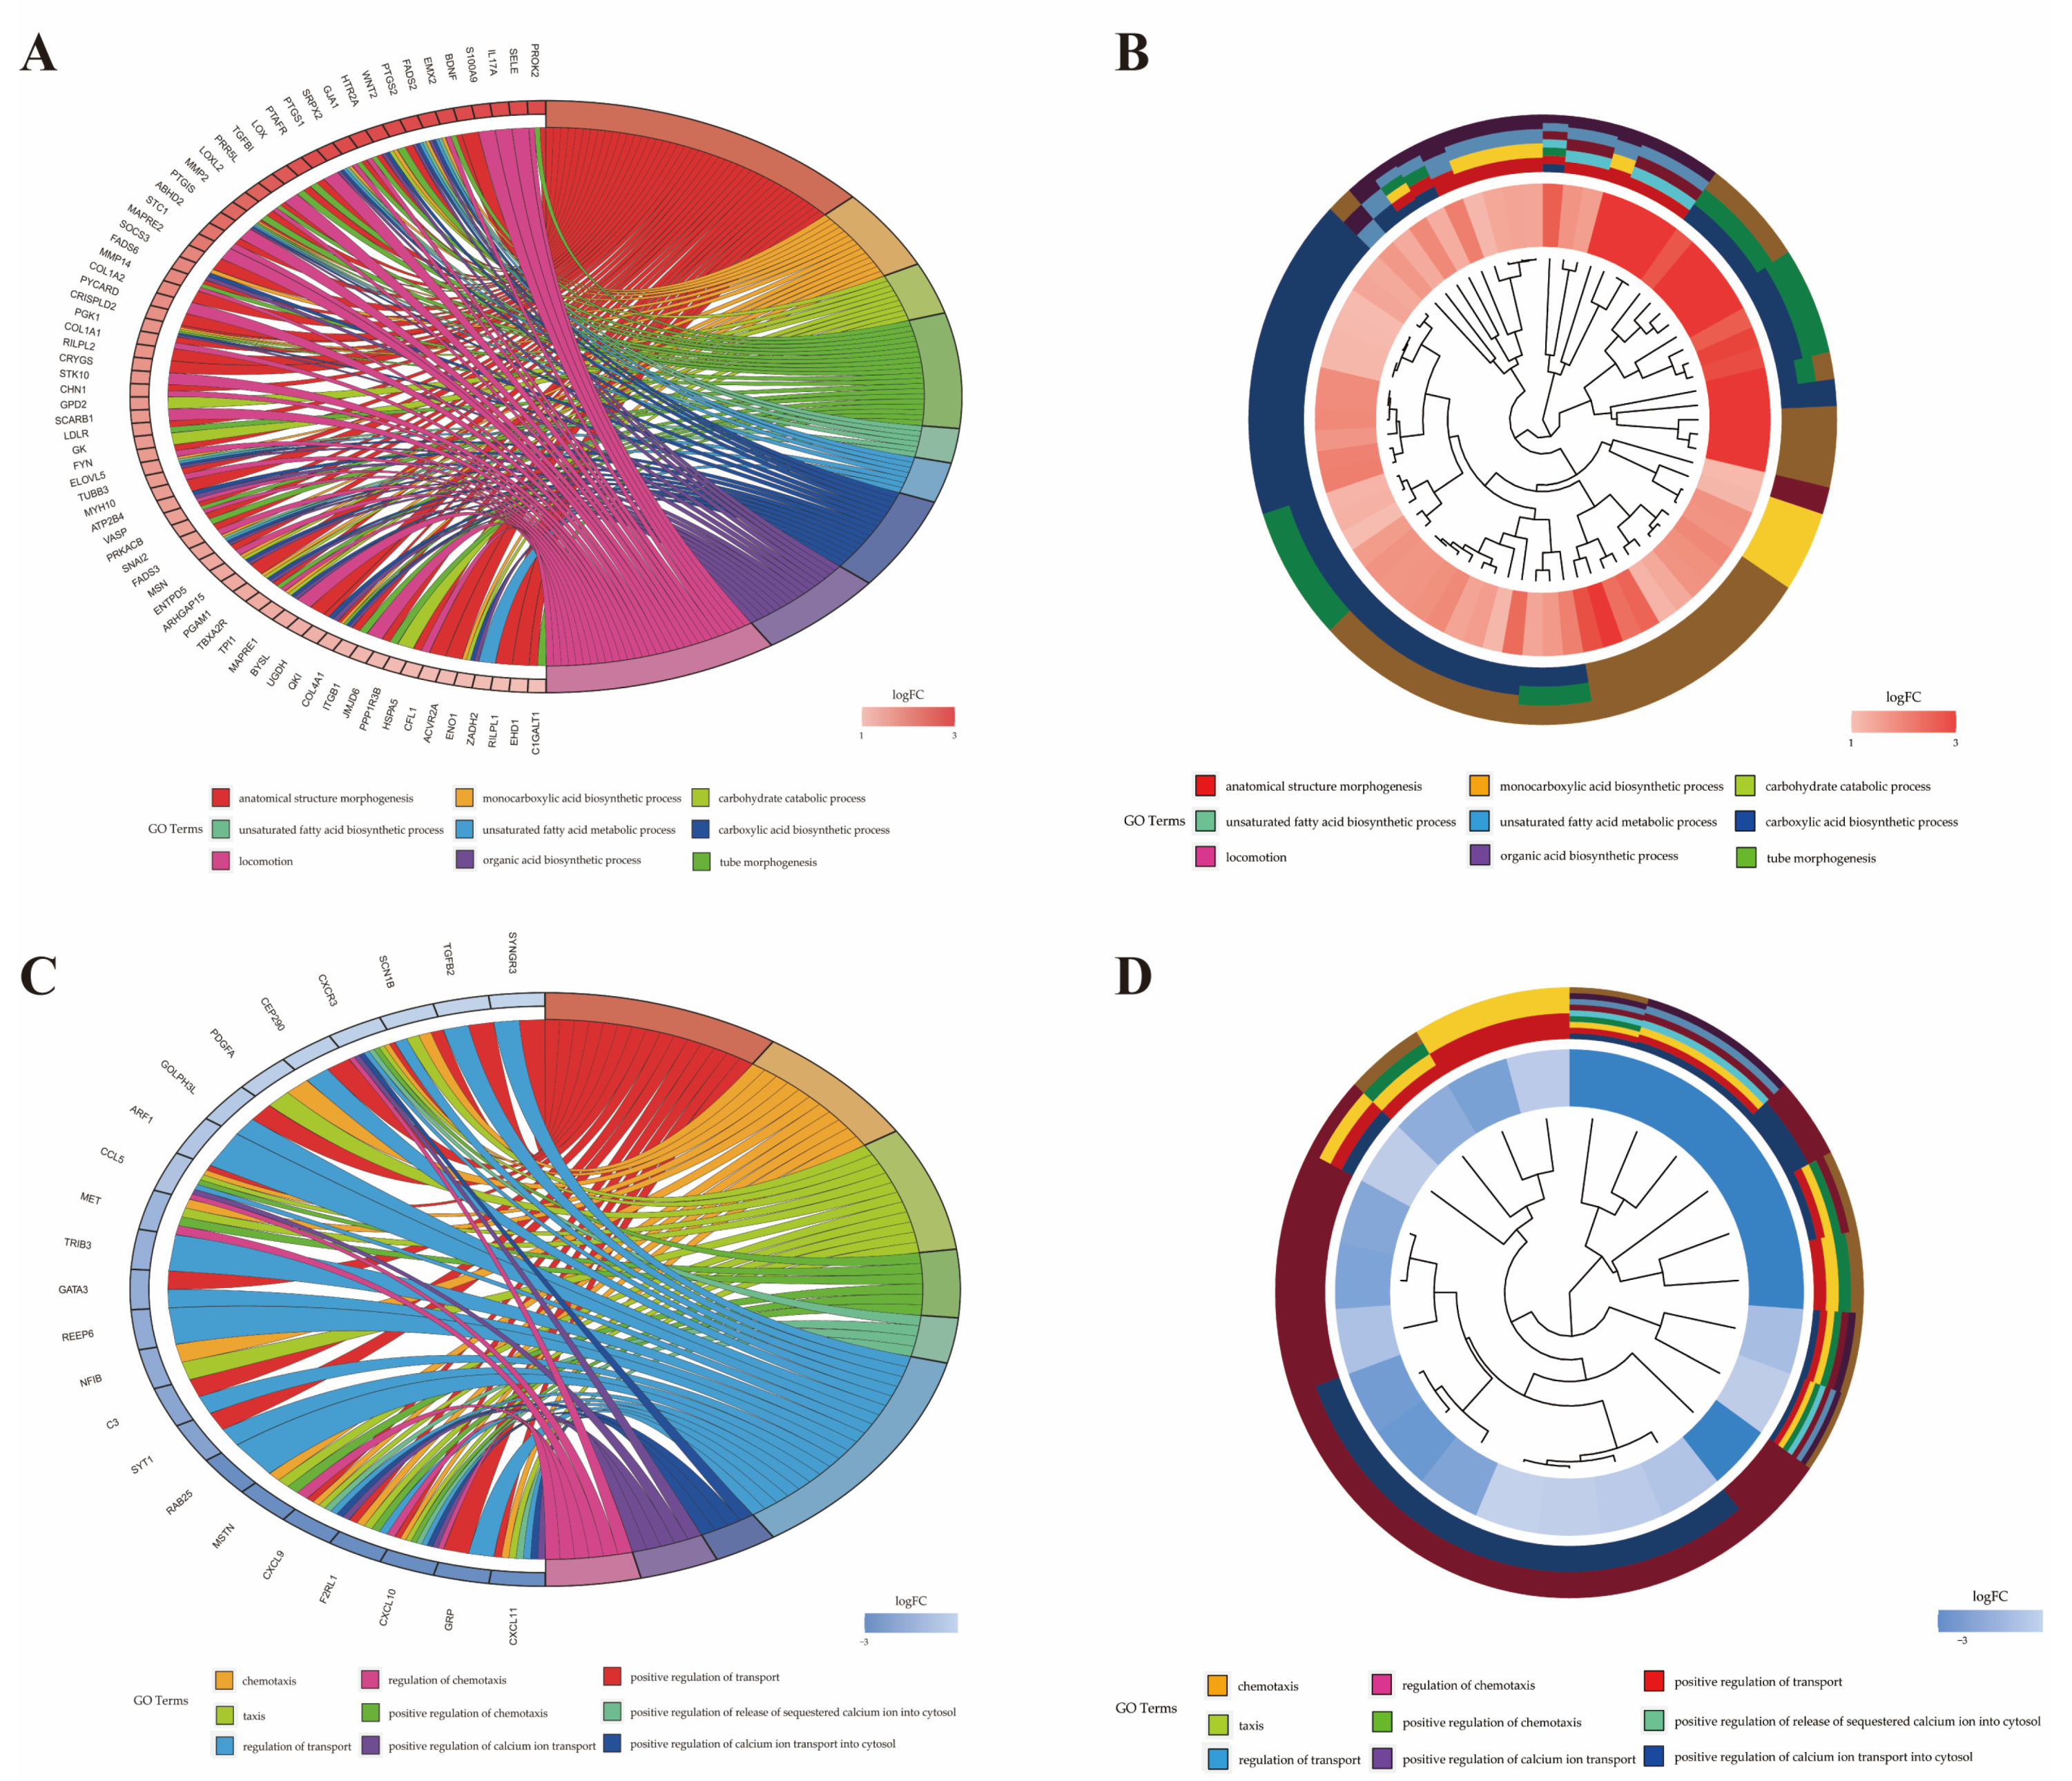
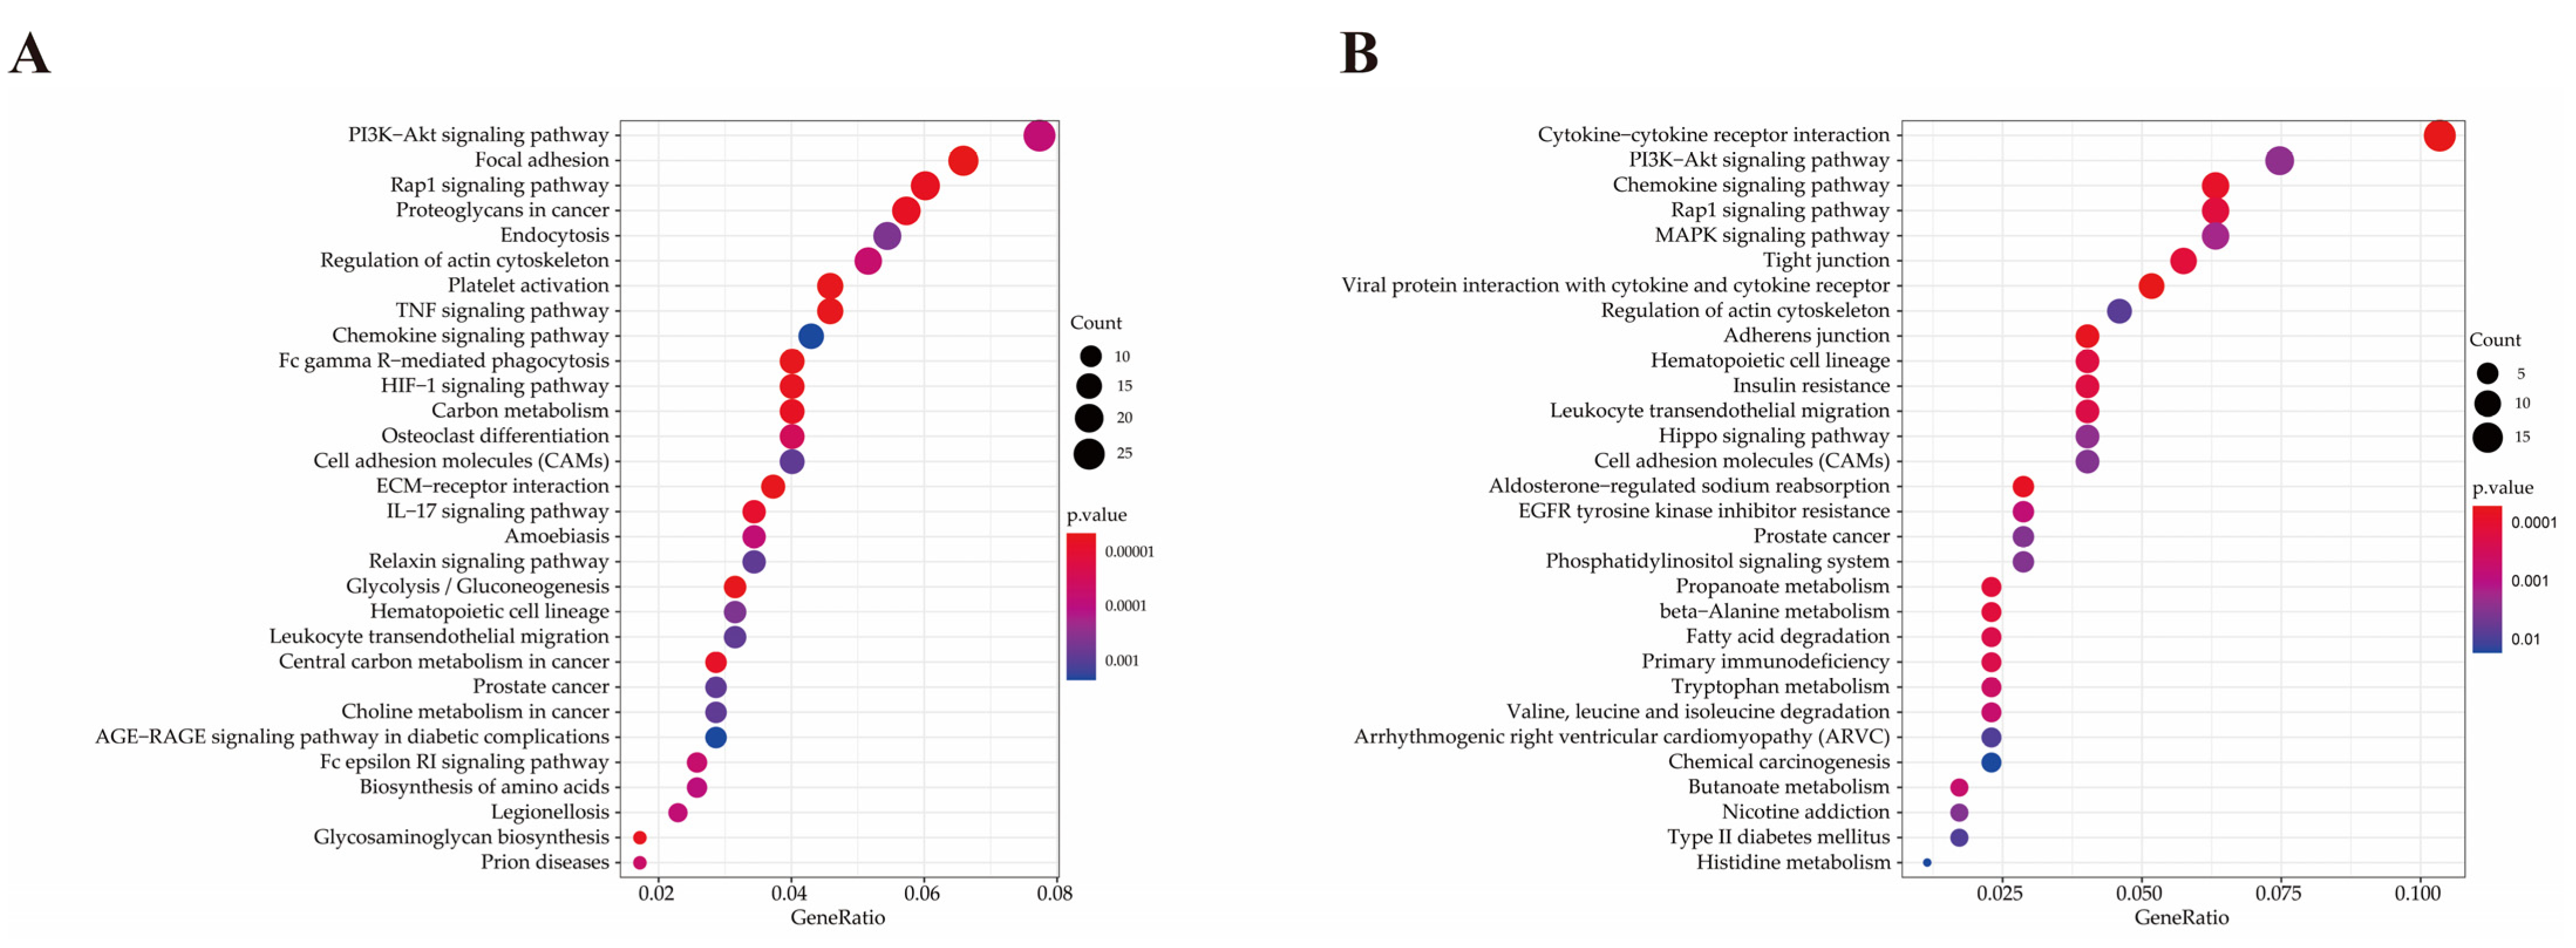
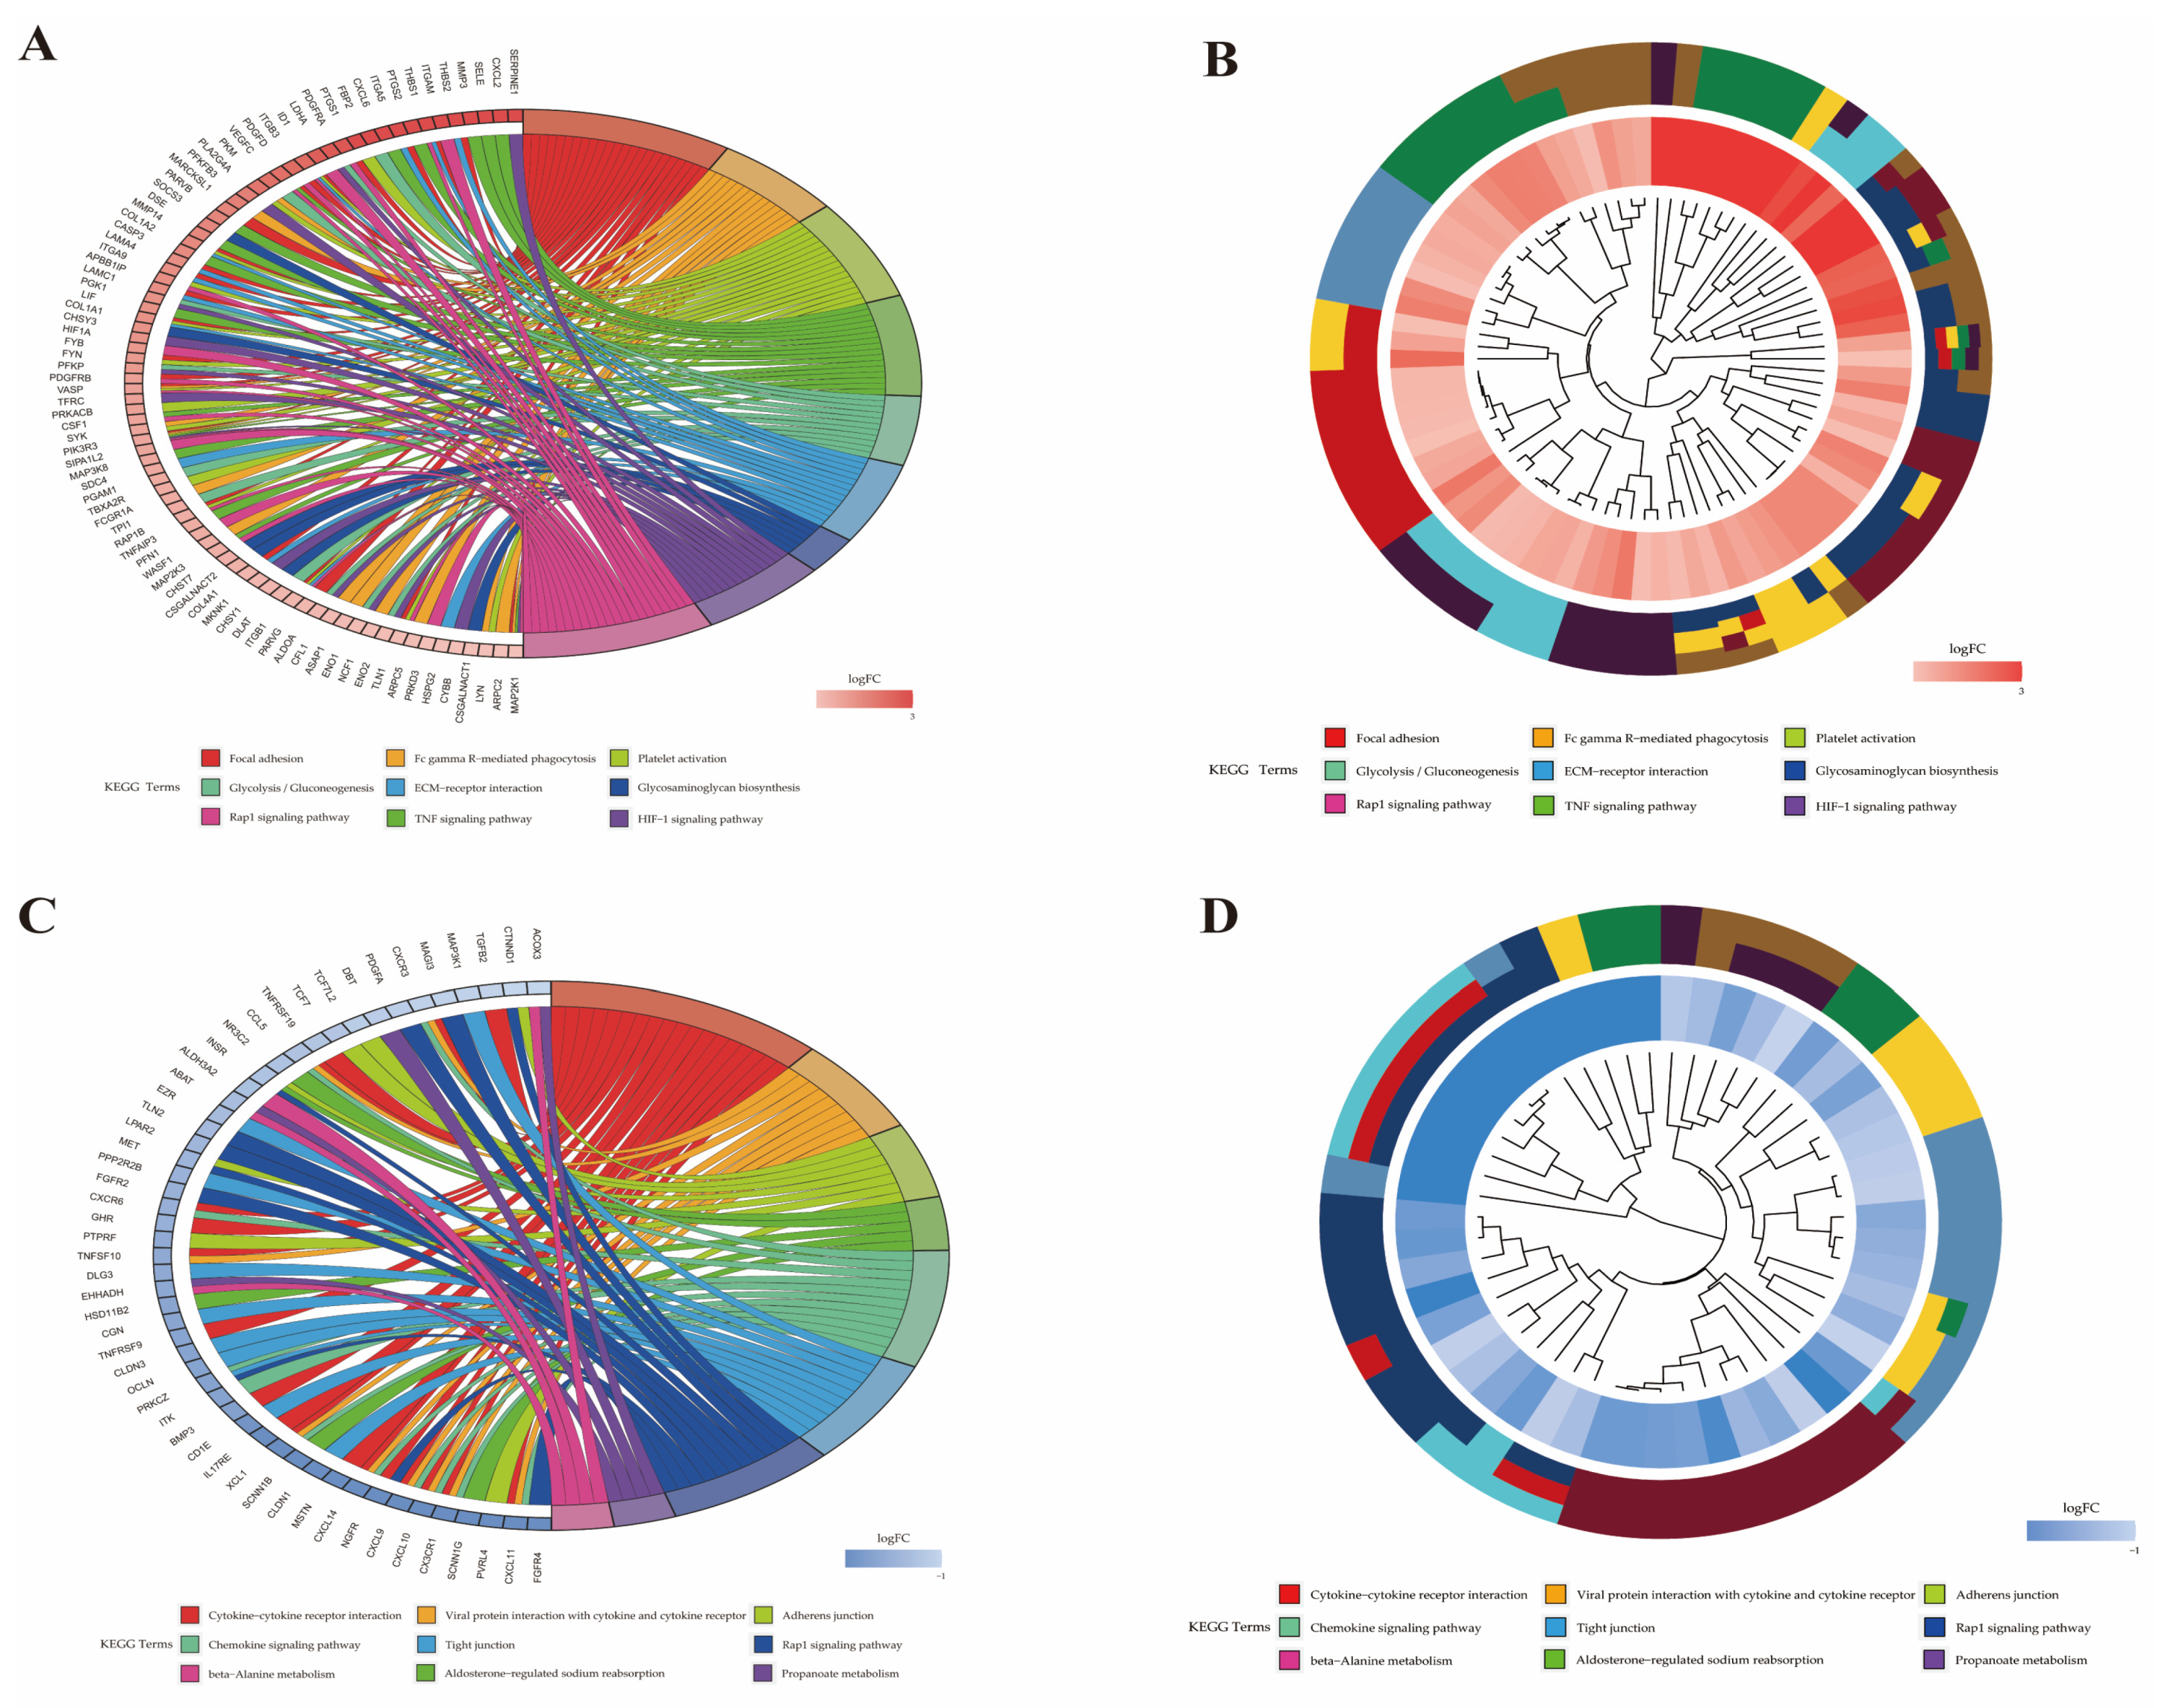
2.6. Functional Analysis of Differentially Expressed Genes

The Gene Ontology (GO) annotation based on three categories (biological processes (BP), molecular functions (MF) and cellular component (CC)) was performed to explore biological functions of DEGs regulated by DE miRNAs, in which there were 721 up-regulated and 381 down-regulated genes. The 721 up-regulated genes were significantly enriched in 174 BP terms, 31 MF terms and 25 CC terms. Among them, 68 up-regulated genes of 19 terms were involved in inflammation and immune response (Table 1). The 381 down-regulated genes were significantly enriched in 199 BP terms, 23 MF terms and 37 CC terms. Among them, 21 down-regulated genes of 25 terms were involved in inflammation and immune response. Only the top 10 up-regulated and down-regulated terms in each category are listed in Figure 5. Features of DEGs enriched in the top 9 significant GO terms are shown in Figure 6.
The 721 up-regulated genes were significantly enriched in 65 KEGG pathways, in which 22 pathways containing 119 up-regulated genes were involved in inflammation and immune response (Table 2). The 381 down-regulated genes are significantly enriched in 26 KEGG pathways, in which 10 KEGG pathways containing 51 down-regulated genes were involved in inflammation and immune response (Table 2). The top 30 up-regulated and down-regulated pathways are listed in Figure 7. Features of DEGs enriched in the top 9 significant KEGG terms are shown in Figure 8.

2.7. Validation of DE miRNAs and DEGs by qRT-PCR

To verify the accuracy of RNA sequencing and microarray, qRT-PCR was performed to detect the expression levels of miRNA and DEGs. The results showed that the relative expression levels of selected miRNAs and mRNAs identified by qRT-PCR were consistent with RNA sequencing and microarray results, respectively (Tables S4 and S5), indicating a high reliability of the study.

3. Discussion

To date, more than 150 pathogenic bacteria have been identified in dairy cows with mastitis; among them, Escherichia coli, Streptococcus spp. and S. aureus are most frequently isolated from cows with clinical or subclinical mastitis [9,32]. In this study, the S. aureus-type bovine mastitis model was constructed to explore interaction patterns of mRNAs and miRNAs in the S. aureus-infected quarters and the control ones. One quarter of the mammary gland of each cow received the inoculation of S. aureus, and the remaining quarters with the inoculation of PBS served as control group. In this way, the systematic errors could be well minimized when we analyzed and compared the expression levels of mRNAs and miRNAs between inoculated and control groups [33,34]. In total, 77 DE miRNAs and 1625 DEGs were identified in the S. aureus-challenged quarters, compared with the healthy ones (Figure 9).
A previous study showed that miR-664b is a promising candidate involved in response to pathogen infection, which was down-regulated in S. aureus-infected quarters (0.450-fold change, p < 0.001) [35]. Accordingly, CD14 Molecule (CD14), a lipopolysaccharide-binding protein enriched significantly in several inflammation-related terms (cellular response to organic substance/oxygen-containing compound/biotic stimulus/biotic stimulus/molecule of bacterial origin terms), which was identified as a predicted target of miR-664b, was up-regulated in S. aureus-infected quarters (2.151-fold change, p = 0.002) (Table S6). This result is consistent with previous studies, in which CD14 was measured as an up-regulated trend as an early innate immune response gene in bacterial infections of mammary gland [13,36,37]. This finding potentially supports that miR-664b negatively regulates its target gene, CD14, to mediate inflammation in mammary gland of dairy cattle infected by S. aureus.
G protein subunit gamma 2 (GNG2), another target gene of miR-664b, was up-regulated in S. aureus-inoculated quarters (3.246-fold change, p = 0.020), which is significantly enriched in three significant terms (cellular response to organic substance term, cellular response to oxygen-containing compound term and cellular response to acid chemical term) and four significant pathways (PI3K–Akt signaling pathway, chemokine signaling pathway, Kaposi sarcoma-associated herpesvirus infection pathway and Ras signaling pathway) (Table S6). These terms and pathways are mainly involved in inflammation response. Previous studies mainly focused on functional analysis of GNG2 in human malignant melanoma cells [38,39,40]. However, there is no direct evidence to prove the association between the up-regulation of GNG2 and the infection of S. aureus in mammary glands. The highly expressed GNG2 may also be associated with the down-regulation of miR-23b-3p (0.223-fold change, p < 0.001), which was identified to be associated with various cancers, such as cervical cancer, renal cancer and pancreatic cancer [41,42,43,44]. Other up-regulated DEGs regulated by miR-23b-3p in the S. aureus infection group were collagen type IV alpha 1 chain (COL4A1) (2.272-fold change, p = 0.007), microtubule associated protein RP/EB family member 2 (MAPRE2) (5.500-fold change, p = 0.001) and member of RAS oncogene family (RAP1B) (2.548-fold change, p = 0.008). Although COL4A1, MAPRE2 and RAP1B are respectively enriched in various inflammation-related terms and pathways, to our knowledge, there is no evidence to prove that they have a bearing on bovine mastitis infected by S. aureus.
The down-regulation of miR-664b has a potential association with the extremely significant up-regulation of interleukin 17A (IL17A) (18.584-fold change, p < 0.001) in S. aureus-inoculated quarters, which plays a crucial role in the defense of Gram-positive bacterial infection and inflammation development [45,46,47]. IL17A is significantly enriched in the terms of cellular response to organic substance, leukocyte migration and inflammatory response and the pathways of IL-17 signaling and rheumatoid arthritis, which indicated that IL17A potentially acts as a functional gene in the defense of S. aureus infection in bovine mammary glands. Generally known, the expression level of a single gene can be regulated by multiple miRNAs [48]. As shown in this study, miR-331-5p, which targets IL17A, was down-regulated in S. aureus-inoculated quarters (0.273-fold change, p < 0.001). At the same time, LDOC1 regulator of NFKB signaling (LDOC1), the target gene of miR-331-5p, was up-regulated in the infected group (2.114-fold change, p = 0.002). LDOC1 is significantly enriched in cellular response to organic substance term, cellular response to oxygen-containing compound term, cellular response to biotic stimulus term, cellular response to lipopolysaccharide term, response to lipopolysaccharide term, cellular response to molecule of bacterial origin term and response to molecule of bacterial origin term. Previous studies have suggested that LDOC1 regulated the expression of nuclear factor kappa-B (NF-κB), which plays a significant role in cellular inflammatory and immune responses [49]. Additionally, multiple studies have shown that LDOC1 can induce apoptosis [50,51,52]. Thus, it remains to be clarified the role of LDOC1 in S. aureus-induced apoptosis.
The down-regulation of miR-19b (0.397-fold change, p < 0.001) is potentially responsible for the up-regulation of LDOC1 in S. aureus-induced mastitis, which has been identified to be the candidate marker for lung cancer and diabetes [53,54]. The down-regulation of miR-19b is also observed to account for the down-regulation of low-density lipoprotein receptor (LDLR) (2.976-fold change, p = 0.024), which was significantly enriched in cellular response to organic substance term, cellular response to oxygen-containing compound term, cellular response to acid chemical term, inflammatory response term and toxoplasmosis pathway and can develop inflammatory atherosclerosis [55].
S100 calcium binding protein A9 (S100A9) is a kind of pro-inflammatory factor, and the protein from exosomes in follicular fluid causes inflammation by NF-κB pathway activation in polycystic ovary syndrome [56,57]. In this study, the up-regulated S100A9 (10.631-fold change, p = 0.006) and down-regulated predicted target miRNA-2431-3p (0.459-fold change, p = 0.005) were screened in S. aureus-inoculated quarters. S100A9 was enriched in multiple significant inflammatory and immune-related pathways, including positive regulation of hydrolase activity pathway, leukocyte migration pathway, neutrophil chemotaxis pathway and inflammatory response pathway.

4. Materials and Methods

4.1. Ethics Statement and Animals Selection

All experimental protocols in this study were reviewed and approved by the Institutional Animal Care and Use Committee of Yangzhou University (ZZCX2019-SYXY-056). All methods in this study were carried out in accordance with the Administration of Affairs Concerning Experimental Animals published by the Ministry of Science and Technology of China.
Three apparently half-sib, healthy and mastitis-free Holstein dairy cattle (A, B and C) were chosen from a dairy farm in Yangzhou, China. All the three cows were in the middle lactation term of first parity with a consistent history of milk somatic cell count (SCC) below 100,000/mL. In particular, the employed cows were detected to be in absence of Mycobacterium bovis, Brucella abortus, Anaplasma spp., Babesia spp., Theileria spp., bovine leukemia virus, bovine herpesvirus-1, bovine viral diarrhea virus and bovine respiratory syncytial virus with commercial or in-house molecular diagnostic kits [58,59,60,61]. Then, the experiment was performed after one week in quarantine.

4.2. Mastitis Model Construction

For challenge infection study, aliquots from frozen stock cultures (S. aureus, ATCC29213) were plated on sheep blood agar and incubated at 37 °C for 18 h under 10% CO2-enriched conditions. Bacterial suspensions for each pure culture were diluted in sterile phosphate buffered saline (PBS) (Biosharp, Hefei, China) to 1 × 10⁷ Colony-Forming Units (CFU)/mL, using a spectrophotometer (Eppendorf, Germany) with a wavelength of 600 nm. For challenged group, one quarter (A1, B1 and C1) of the mammary gland of the three individuals received a dose of 5 × 10⁷ CFU of S. aureus, and one of the remaining quarters (A2, B2 and C2) not administered with the S. aureus inoculation served as control group that received 5 mL of sterile PBS [20,62]. The milk yield, SCC (Shanghai DHI Test Center, Shanghai, China) and temperature of cows were recorded before and at 24 h post-inoculation.

4.3. Sample Collection and Total RNA Extraction

The mammary tissues (1–2 g per quarter) were collected by sterile surgery from two quarters per dairy cattle at 48 h post-inoculation. Samples from challenged (A1, B1 and C1) and control (A2, B2 and C2) quarters were immediately frozen in liquid nitrogen before RNA extraction or stored in 10% formalin for hematoxylin and eosin (HE) staining.
Total RNA was extracted from 250 mg mammary tissues with mirVanaTM RNA Isolation Kit (Applied Biosystems, Carlsbad, CA, USA) and purified with QIAGEN RNeasy® Kit (QIAGEN, Dusseldorf, Germany). The RNA quality was assessed using Agilent Bioanalyzer 2100 (Agilent Technologies, Santa Clara, USA) and NanoDrop spectrophotometer (Thermo Fisher, USA). Total RNA samples were stored at −70 °C. A total of 10 μg per RNA sample was sent to a commercial sequencing laboratory (Oebiotech, Shanghai, China) for evaluating the expression levels of miRNA with HiSeq 2000 System (single-end) (Illumina, San Diego, CA, USA) and mRNA with microarray (G2519F-023647, Agilent Technologies, Santa Clara, CA, USA).

4.4. Pathological Tests

After 48 h of soaking, the samples were rinsed with water for 12 h and subjected to gradient alcohol dehydration, wax impregnation and embedding. Hematoxylin-eosin (HE) staining was performed for 15 min after dewaxing and adequate washing. The pathological changes were visualized with a microscope (M152, Mshot, Guangzhou, China) at different magnifications.

4.5. Small RNA Sequencing and Data Analysis

Clean reads constructing the small RNA libraries were obtained by removing low-quality reads, adaptors and insufficient tags. Then the length distribution and sequences of the clean reads were summarized and analyzed, respectively. Ribosomal RNAs (rRNAs), transfer RNAs (tRNAs) and other noncoding RNAs were identified and removed, based on GenBank (http://www.ncbi.nlm.nih.gov, accessed on 6 October 2020) and Rfamdatabase10.1 (http://rfam.xfam.org/, accessed on 6 October 2020). MiRNAs were identified through a BLASTN search against the miRBase18.0 (http://www.mirbase.org/, accessed on 6 October 2020) [63].
The miRNA counts were normalized as transcript per million (TPM) with the formula (number of reads per miRNA alignment) / (number of reads from the total sample alignment) × 106 [64]. The differentially expressed (DE) miRNAs in each sample were calculated with DEseq R package (1.18.0), with p ≤ 0.05 and fold change ≥2 as the threshold.

4.6. mRNA Analysis and Data Process

The 2100 RNA Integrity Number (RIN) and 28S/18S values were detected to evaluate the quality of RNAs. The GeneSpring software (version 12.5, Agilent Technologies, Santa Clara, CA, USA) was utilized to evaluate the coefficient of variation (CV) of each sample.
Total RNA was reverse-transcribed to double-stranded complementary DNA (cDNA) and purified with QIAGEN RNeasy® Kit (QIAGEN, Dusseldorf, Germany), from which cNDAs were synthesized and then labeled with cyanine-3-cytidine triphosphate. For the calculation of fluorescence molecule concentration and incorporation, the following formulas were employed: Cy3-concentration (pmol/µL) = A552/0.15, and Cy3-incorproation (pmol/µg) = Cy3-concentration/cRNA concentration (µg/µL). Then, the cDNA sample fragmentation and chip hybridization were conducted, and the chips were washed and scanned subsequently.
Feature Extraction software (version 10.7.1.1, Agilent Technologies Santa Clara, CA, USA) was employed to extract and analyze raw data from array images. Briefly, the raw data was normalized with the quantile algorithm, and the resultant flag value of any probe was assigned as “Detected” only if there were no “Compromised” or “Not Detected”. DEGs were identified with p ≤ 0.05 and |log2FC| ≥ 1 as the threshold.

4.7. miRNA–mRNA Interaction Network Construction

With the online software TargetScan (www.targetscan.org, accessed on 6 November 2020), the potential target genes of DE miRNAs with more significant expression levels (p ≤ 0.05 and |log2FC| ≥ 2) were predicted and intersected, with the DEGs identified by microarray test (p ≤ 0.05 and |log2FC| ≥ 2). Then, the miRNA–mRNA interaction networks were constructed and visualized with the DE miRNAs and screened genes by Cytoscape (v3.7.2) [65].
To evaluate the reliability of the miRNA–mRNA interaction network, the DE miRNAs and DEGs (p ≤ 0.05 and |log2FC| ≥ 2) obtained in this study were compared and taken the intersections with those from previous relevant studies [20,22,23,24,25,26,27,28,29,30,31].

4.8. Functional Analysis of Differentially Expressed Genes

DEGs regulated by DE miRNAs were screened to further understand their biological and metabolic pathways. Gene ontology (GO) annotation and Kyoto Encyclopedia of Genes and Genomes (KEGG) analysis were respectively performed with the DAVID 6.8 (https://david.ncifcrf.gov/, accessed on 6 November 2020) and KOBAS 3.0 (http://kobas.cbi.pku.edu.cn/index.php, accessed on 6 November 2020) using R based on the hypergeometric distribution [65]. Then, the GO terms and KEGG pathways with adjusted p ≤ 0.05 were significantly enriched in DEGs or the miRNA target genes.

4.9. RT-qPCR Validation of DEGs and DE miRNAs

To validate the RNA sequencing data, five duplicates of eight DEGs (DGAT2, FADS2, ALDH3A2, EHHADH, FASN, LPL, SCD and SLC27A6) and six DE miRNAs (bta-miR-196a, bta-miR-205, bta-miR-200b, bta-miR-223, bta-miR-184, bta-miR-1246) were selected and analyzed by RT-qPCR. All the specific primers were synthesized by a commercial company (Sangon Biotech, Shanghai, China) and are described in Tables S7 and S8. The LightCycler® 480 II System (Roche, Basel, Switzerland) was applied to qRT-PCR with 20 μL volumes composed of 10 μL of 2 × TB Green Fast qPCR Mix (Takara, Dalian, China), 0.8 μL of forward/ reverse primer, 2 μL of DNA template and 6.4 μL of double distilled water (ddH2O). Thermal cycling consisted of a 30 s denaturation step at 94 °C, followed by 40 cycles of 94 °C for 5 s and 60 °C for 30 s, melting curve determination between 50 °C and 90 °C and final holding at 37 ℃. MiRNA/mRNA were normalized for bovine 18S rRNA/β-actin. Relative expression was calculated using the 2−ΔΔCt method in all samples.

4.10. Statistical Analysis

Data were analyzed using GraphPad Prism 8 (GraphPad, San Diego, CA, USA) with Student’s t-test and presented as mean ± standard deviation (SD). The resulting p-values were adjusted using the Benjamini and Hochberg’s approach for controlling the false discovery rate (FDR). Adjusted p < 0.05 indicated a significant difference.

5. Conclusions

In the present study, we comprehensively analyzed the changes in miRNA and mRNA profiles of the mammary gland of dairy cattle under S. aureus inoculation. Overall, 77 DE miRNAs and 1625 DEGs were identified in the S. aureus-challenged quarters. Among them, the predicted integrated regulatory network was constructed with the miRNAs (miR-664b, miR-23b-3p, miR-331-5p, miR-19b and miR-2431-3p) and the mRNAs (CD14, GNG2, COL4A1, MAPRE2, RAP1B, IL17A, LDOC1, LDLR and S100A9), which were significantly associated with inflammation and immunity. These findings could enhance the understanding of underlying immune response in bovine mammary glands against S. aureus infection and provide a useful foundation for the future application of the miRNA–mRNA-based genetic regulatory network in the breeding of cows resistant to S. aureus.

Supplementary Materials

The following are available online at https://www.mdpi.com/article/10.3390/pathogens10050506/s1. Table S1: Statistics of miRNA sequencing. Table S2: The quality control of mRNAs. Table S3: The variation coefficient of samples used for microarray test. Table S4: Comparison of the expression levels of seven miRNAs detected by transcriptome sequencing and qRT-PCR. Table S5: Comparison of the expression levels of eight mRNAs detected by microarray and qRT-PCR. Table S6: Functional annotations of key DEGs and their potential target miRNAs. Table S7: The primers used for qRT-PCR to validate the small RNA sequencing. Table S8: The primers used for qRT-PCR to validate the microarray test. Figure S1: The length distribution of small RNAs in (A) control group and (B) S. aureus-inoculated group.

Author Contributions

Conceptualization, Y.Y. and Z.Y.; methodology, Y.Y., Z.Y., X.W. and Y.F.; software, X.W. and Y.F.; validation, Y.Y. and Z.Y.; formal analysis, Y.Y., Z.Y., X.W. and Y.F.; investigation, X.W.; data curation, Z.H., Z.G., Y.H., Y.P., Y.M. (Yining Meng) and Y.M. (Yongjiang Mao); writing—original draft preparation, X.W. and Y.F.; writing—review and editing, Y.Y. and Y.H.; visualization, Y.Y., Y.F. and Y.H.; funding acquisition, Y.Y. All authors have read and agreed to the published version of the manuscript.

Funding

This work was funded by Jiangsu Agriculture Science and Technology Innovation Fund (JASTIF) (CX(20)3089 to Y.Y.), The National Natural Science Foundation of China (32002263 to Y.Y.), The Basic Research Program of Jiangsu Province (BK20190881 to Y.Y.), The China Postdoctoral Science Foundation (2019M650126 to Y.Y.), The Natural Science Foundation of Jiangsu Higher Education Institutions of China (19KJB230001 to Y.Y.), The High-level Innovation and Entrepreneurship Talents Introduction Program of Jiangsu Province of China, and A Project Funded by the Priority Academic Program Development of Jiangsu Higher Education Institutions (PAPD).

Institutional Review Board Statement

All experimental protocols in this study were reviewed and approved by the Institutional Animal Care and Use Committee of Yangzhou University (ZZCX2019-SYXY-056). All methods in this study were carried out according in accordance with the Administration of Affairs Concerning Experimental Animals published by the Ministry of Science and Technology of China.

Informed Consent Statement

Not applicable.

Data Availability Statement

The data presented in this study are available in the main text and supplementary material of this article.

Conflicts of Interest

The authors declare no conflict of interest.

References

  1. Zhang, L.; Gao, J.; Barkema, H.W.; Ali, T.; Liu, G.; Deng, Y.; Naushad, S.; Kastelic, J.P.; Han, B. Virulence gene profiles: Alpha-hemolysin and clonal diversity in Staphylococcus aureus isolates from bovine clinical mastitis in China. BMC Vet. Res. 2018, 14, 63. [Google Scholar] [CrossRef] [Green Version]
  2. Sutra, L.; Poutrel, B. Virulence factors involved in the pathogenesis of bovine intramammary infections due to Staphylococcus aureus. J. Med. Microbiol. 1994, 40, 79–89. [Google Scholar] [CrossRef] [Green Version]
  3. Hwang, S.Y.; Park, Y.K.; Koo, H.C.; Park, Y.H. spa typing and enterotoxin gene profile of Staphylococcus aureus isolated from bovine raw milk in Korea. J. Vet. Sci. 2010, 11, 125–131. [Google Scholar] [CrossRef] [Green Version]
  4. Nedic, S.; Vakanjac, S.; Samardzija, M.; Borozan, S. Paraoxonase 1 in bovine milk and blood as marker of subclinical mastitis caused by Staphylococcus aureus. Res. Vet. Sci. 2019, 125, 323–332. [Google Scholar] [CrossRef]
  5. Lutzow, Y.C.; Donaldson, L.; Gray, C.P.; Vuocolo, T.; Pearson, R.D.; Reverter, A.; Byrne, K.A.; Sheehy, P.A.; Windon, R.; Tellam, R.L. Identification of immune genes and proteins involved in the response of bovine mammary tissue to Staphylococcus aureus infection. BMC Vet. Res. 2008, 4, 18. [Google Scholar] [CrossRef] [Green Version]
  6. Oliver, J.P.; Gooch, C.A.; Lansing, S.; Schueler, J.; Hurst, J.J.; Sassoubre, L.; Crossette, E.M.; Aga, D.S. Invited review: Fate of antibiotic residues, antibiotic-resistant bacteria, and antibiotic resistance genes in US dairy manure management systems. J. Dairy Sci. 2020, 103, 1051–1071. [Google Scholar] [CrossRef]
  7. Saidi, R.; Kaidi, R.; Khelef, D.; Solmaz, H.; Ergun, Y.; Mimoune, N.; Cantekin, Z. Investigation of the presence of slime production, VanA gene and antiseptic resistance genes in Staphylococci isolated from bovine mastitis in Algeria. Vet. Stn. 2020, 52, 57–63. [Google Scholar] [CrossRef]
  8. Burović, J. Izolacija bakterijskih patogena kod klinički manifestnih mastitisa mliječnih goveda i njihova antimikrobna osjetljivost u zeničkoj regiji u 2017. godini. Vet. Stn. 2020, 51, 47–52. [Google Scholar] [CrossRef]
  9. Benić, M.; Maćešić, N.; Cvetnić, L.; Habrun, B.; Cvetnić, Ž.; Turk, R.; Đuričić, D.; Lojkić, M.; Dobranić, V.; Valpotić, H.; et al. Bovine mastitis: A persistent and evolving problem requiring novel approaches for its control—A review. Vet. Arh. 2018, 88, 535–557. [Google Scholar] [CrossRef]
  10. Huang, J.; Luo, G.; Zhang, Z.; Wang, X.; Ju, Z.; Qi, C.; Zhang, Y.; Wang, C.; Li, R.; Li, J.; et al. iTRAQ-proteomics and bioinformatics analyses of mammary tissue from cows with clinical mastitis due to natural infection with Staphylococci aureus. BMC Genom. 2014, 15, 839. [Google Scholar] [CrossRef] [Green Version]
  11. Bobbo, T.; Penasa, M.; Finocchiaro, R.; Visentin, G.; Cassandro, M. Alternative somatic cell count traits exploitable in genetic selection for mastitis resistance in Italian Holsteins. J. Dairy Sci. 2018, 101, 10001–10010. [Google Scholar] [CrossRef]
  12. Asselstine, V.; Miglior, F.; Suarez-Vega, A.; Fonseca, P.A.S.; Mallard, B.; Karrow, N.; Islas-Trejo, A.; Medrano, J.F.; Canovas, A. Genetic mechanisms regulating the host response during mastitis. J. Dairy Sci. 2019, 102, 9043–9059. [Google Scholar] [CrossRef]
  13. Strandberg, Y.; Gray, C.; Vuocolo, T.; Donaldson, L.; Broadway, M.; Tellam, R. Lipopolysaccharide and lipoteichoic acid induce different innate immune responses in bovine mammary epithelial cells. Cytokine 2005, 31, 72–86. [Google Scholar] [CrossRef]
  14. Gunther, J.; Koczan, D.; Yang, W.; Nurnberg, G.; Repsilber, D.; Schuberth, H.J.; Park, Z.; Maqbool, N.; Molenaar, A.; Seyfert, H.M. Assessment of the immune capacity of mammary epithelial cells: Comparison with mammary tissue after challenge with Escherichia coli. Vet. Res. 2009, 40, 31. [Google Scholar] [CrossRef] [Green Version]
  15. Griesbeck-Zilch, B.; Meyer, H.H.; Kuhn, C.H.; Schwerin, M.; Wellnitz, O. Staphylococcus aureus and Escherichia coli cause deviating expression profiles of cytokines and lactoferrin messenger ribonucleic acid in mammary epithelial cells. J. Dairy Sci. 2008, 91, 2215–2224. [Google Scholar] [CrossRef] [Green Version]
  16. Fu, Y.; Zhou, E.; Liu, Z.; Li, F.; Liang, D.; Liu, B.; Song, X.; Zhao, F.; Fen, X.; Li, D.; et al. Staphylococcus aureus and Escherichia coli elicit different innate immune responses from bovine mammary epithelial cells. Vet. Immunol. Immunopathol. 2013, 155, 245–252. [Google Scholar] [CrossRef]
  17. Li, R.; Zhang, C.L.; Liao, X.X.; Chen, D.; Wang, W.Q.; Zhu, Y.H.; Geng, X.H.; Ji, D.J.; Mao, Y.J.; Gong, Y.C.; et al. Transcriptome microRNA profiling of bovine mammary glands infected with Staphylococcus aureus. Int. J. Mol. Sci. 2015, 16, 4997–5013. [Google Scholar] [CrossRef] [PubMed] [Green Version]
  18. Luoreng, Z.M.; Wang, X.P.; Mei, C.G.; Zan, L.S. Expression profiling of peripheral blood miRNA using RNAseq technology in dairy cows with Escherichia coli-induced mastitis. Sci. Rep. 2018, 8, 12693. [Google Scholar] [CrossRef] [Green Version]
  19. Kosciuczuk, E.M.; Lisowski, P.; Jarczak, J.; Majewska, A.; Rzewuska, M.; Zwierzchowski, L.; Bagnicka, E. Transcriptome profiling of Staphylococci-infected cow mammary gland parenchyma. BMC Vet. Res. 2017, 13, 161. [Google Scholar] [CrossRef]
  20. Luoreng, Z.M.; Wang, X.P.; Mei, C.G.; Zan, L.S. Comparison of microRNA Profiles between Bovine Mammary Glands Infected with Staphylococcus aureus and Escherichia coli. Int. J. Biol. Sci. 2018, 14, 87–99. [Google Scholar] [CrossRef] [Green Version]
  21. Pisanu, S.; Cacciotto, C.; Pagnozzi, D.; Puggioni, G.M.G.; Uzzau, S.; Ciaramella, P.; Guccione, J.; Penati, M.; Pollera, C.; Moroni, P.; et al. Proteomic changes in the milk of water buffaloes (Bubalus bubalis) with subclinical mastitis due to intramammary infection by Staphylococcus aureus and by non-aureus staphylococci. Sci. Rep. 2019, 9, 15850. [Google Scholar] [CrossRef]
  22. Han, S.; Li, X.; Liu, J.; Zou, Z.; Luo, L.; Wu, R.; Zhao, Z.; Wang, C.; Shen, B. Bta-miR-223 Targeting CBLB Contributes to Resistance to Staphylococcus aureus Mastitis Through the PI3K/AKT/NF-kappaB Pathway. Front. Vet. Sci 2020, 7, 529. [Google Scholar] [CrossRef] [PubMed]
  23. Ju, Z.; Jiang, Q.; Liu, G.; Wang, X.; Luo, G.; Zhang, Y.; Zhang, J.; Zhong, J.; Huang, J. Solexa sequencing and custom microRNA chip reveal repertoire of microRNAs in mammary gland of bovine suffering from natural infectious mastitis. Anim. Genet. 2018, 49, 3–18. [Google Scholar] [CrossRef]
  24. Sun, J.; Aswath, K.; Schroeder, S.G.; Lippolis, J.D.; Reinhardt, T.A.; Sonstegard, T.S. MicroRNA expression profiles of bovine milk exosomes in response to Staphylococcus aureus infection. BMC Genom. 2015, 16, 806. [Google Scholar] [CrossRef] [Green Version]
  25. Jin, W.; Ibeagha-Awemu, E.M.; Liang, G.; Beaudoin, F.; Zhao, X.; Guan, L.L. Transcriptome microRNA profiling of bovine mammary epithelial cells challenged with Escherichia coli or Staphylococcus aureus bacteria reveals pathogen directed microRNA expression profiles. BMC Genom. 2014, 15, 181. [Google Scholar] [CrossRef] [PubMed] [Green Version]
  26. Islam, M.A.; Takagi, M.; Fukuyama, K.; Komatsu, R.; Albarracin, L.; Nochi, T.; Suda, Y.; Ikeda-Ohtsubo, W.; Rutten, V.; Eden, W.V.; et al. Transcriptome Analysis of The Inflammatory Responses of Bovine Mammary Epithelial Cells: Exploring Immunomodulatory Target Genes for Bovine Mastitis. Pathogens 2020, 9, 200. [Google Scholar] [CrossRef]
  27. Gunther, J.; Petzl, W.; Bauer, I.; Ponsuksili, S.; Zerbe, H.; Schuberth, H.J.; Brunner, R.M.; Seyfert, H.M. Differentiating Staphylococcus aureus from Escherichia coli mastitis: S. aureus triggers unbalanced immune-dampening and host cell invasion immediately after udder infection. Sci. Rep. 2017, 7, 4811. [Google Scholar] [CrossRef]
  28. Gilbert, F.B.; Cunha, P.; Jensen, K.; Glass, E.J.; Foucras, G.; Robert-Granie, C.; Rupp, R.; Rainard, P. Differential response of bovine mammary epithelial cells to Staphylococcus aureus or Escherichia coli agonists of the innate immune system. Vet. Res. 2013, 44, 40. [Google Scholar] [CrossRef] [PubMed] [Green Version]
  29. Gunther, J.; Esch, K.; Poschadel, N.; Petzl, W.; Zerbe, H.; Mitterhuemer, S.; Blum, H.; Seyfert, H.M. Comparative kinetics of Escherichia coli- and Staphylococcus aureus-specific activation of key immune pathways in mammary epithelial cells demonstrates that S. aureus elicits a delayed response dominated by interleukin-6 (IL-6) but not by IL-1A or tumor necrosis factor alpha. Infect. Immun. 2011, 79, 695–707. [Google Scholar] [CrossRef] [Green Version]
  30. Wang, D.; Liu, L.; Augustino, S.M.A.; Duan, T.; Hall, T.J.; MacHugh, D.E.; Dou, J.; Zhang, Y.; Wang, Y.; Yu, Y. Identification of novel molecular markers of mastitis caused by Staphylococcus aureus using gene expression profiling in two consecutive generations of Chinese Holstein dairy cattle. J. Anim. Sci. Biotechnol. 2020, 11, 98. [Google Scholar] [CrossRef] [PubMed]
  31. Mitra, S.D.; Ganaie, F.; Bankar, K.; Velu, D.; Mani, B.; Vasudevan, M.; Shome, R.; Rahman, H.; Kumar Ghosh, S.; Shome, B.R. Genome-wide analysis of mammary gland shows modulation of transcriptome landscape with alternative splice variants in Staphylococcus aureus mastitis in mice. Gene 2020, 735, 144278. [Google Scholar] [CrossRef]
  32. Yang, Y.; Peng, Y.; Jiang, J.; Gong, Z.; Zhu, H.; Wang, K.; Zhou, Q.; Tian, Y.; Qin, A.; Yang, Z.; et al. Isolation and characterization of multidrug-resistant Klebsiella pneumoniae from raw cow milk in Jiangsu and Shandong provinces, China. Transbound. Emerg. Dis. 2020. [Google Scholar] [CrossRef] [PubMed]
  33. Chen, Z.; Xia, H.; Shen, H.; Xu, X.; Arbab, A.A.I.; Li, M.; Zhang, H.; Mao, Y.; Yang, Z. Pathological Features of Staphylococcus aureus Induced Mastitis in Dairy Cows and Isobaric-Tags-for-Relative-and-Absolute-Quantitation Proteomic Analyses. J. Agric. Food Chem. 2018, 66, 3880–3890. [Google Scholar] [CrossRef] [PubMed]
  34. Zhang, H.; Jiang, H.; Fan, Y.; Chen, Z.; Li, M.; Mao, Y.; Karrow, N.A.; Loor, J.J.; Moore, S.; Yang, Z. Transcriptomics and iTRAQ-Proteomics Analyses of Bovine Mammary Tissue with Streptococcus agalactiae-Induced Mastitis. J. Agric. Food Chem. 2018, 66, 11188–11196. [Google Scholar] [CrossRef]
  35. Podolska, A.; Anthon, C.; Bak, M.; Tommerup, N.; Skovgaard, K.; Heegaard, P.M.; Gorodkin, J.; Cirera, S.; Fredholm, M. Profiling microRNAs in lung tissue from pigs infected with Actinobacillus pleuropneumoniae. BMC Genom. 2012, 13, 459. [Google Scholar] [CrossRef] [Green Version]
  36. Lahouassa, H.; Moussay, E.; Rainard, P.; Riollet, C. Differential cytokine and chemokine responses of bovine mammary epithelial cells to Staphylococcus aureus and Escherichia coli. Cytokine 2007, 38, 12–21. [Google Scholar] [CrossRef] [PubMed]
  37. Bannerman, D.D.; Paape, M.J.; Goff, J.P.; Kimura, K.; Lippolis, J.D.; Hope, J.C. Innate immune response to intramammary infection with Serratia marcescens and Streptococcus uberis. Vet. Res. 2004, 35, 681–700. [Google Scholar] [CrossRef] [Green Version]
  38. Yajima, I.; Kumasaka, M.Y.; Tamura, H.; Ohgami, N.; Kato, M. Functional analysis of GNG2 in human malignant melanoma cells. J. Dermatol. Sci. 2012, 68, 172–178. [Google Scholar] [CrossRef]
  39. Yajima, I.; Kumasaka, M.Y.; Yamanoshita, O.; Zou, C.; Li, X.; Ohgami, N.; Kato, M. GNG2 inhibits invasion of human malignant melanoma cells with decreased FAK activity. Am. J. Cancer Res. 2014, 4, 182–188. [Google Scholar] [PubMed]
  40. Yajima, I.; Kumasaka, M.Y.; Naito, Y.; Yoshikawa, T.; Takahashi, H.; Funasaka, Y.; Suzuki, T.; Kato, M. Reduced GNG2 expression levels in mouse malignant melanomas and human melanoma cell lines. Am. J. Cancer Res. 2012, 2, 322–329. [Google Scholar]
  41. Campos-Viguri, G.E.; Peralta-Zaragoza, O.; Jimenez-Wences, H.; Longinos-Gonzalez, A.E.; Castanon-Sanchez, C.A.; Ramirez-Carrillo, M.; Camarillo, C.L.; Castaneda-Saucedo, E.; Jimenez-Lopez, M.A.; Martinez-Carrillo, D.N.; et al. MiR-23b-3p reduces the proliferation, migration and invasion of cervical cancer cell lines via the reduction of c-Met expression. Sci. Rep. 2020, 10, 3256. [Google Scholar] [CrossRef]
  42. Zaman, M.S.; Thamminana, S.; Shahryari, V.; Chiyomaru, T.; Deng, G.; Saini, S.; Majid, S.; Fukuhara, S.; Chang, I.; Arora, S.; et al. Inhibition of PTEN gene expression by oncogenic miR-23b-3p in renal cancer. PLoS ONE 2012, 7, e50203. [Google Scholar] [CrossRef]
  43. Chen, D.; Wu, X.; Xia, M.; Wu, F.; Ding, J.; Jiao, Y.; Zhan, Q.; An, F. Upregulated exosomic miR23b3p plays regulatory roles in the progression of pancreatic cancer. Oncol. Rep. 2017, 38, 2182–2188. [Google Scholar] [CrossRef] [Green Version]
  44. Grieco, F.A.; Sebastiani, G.; Juan-Mateu, J.; Villate, O.; Marroqui, L.; Ladriere, L.; Tugay, K.; Regazzi, R.; Bugliani, M.; Marchetti, P.; et al. MicroRNAs miR-23a-3p, miR-23b-3p, and miR-149-5p Regulate the Expression of Proapoptotic BH3-Only Proteins DP5 and PUMA in Human Pancreatic beta-Cells. Diabetes 2017, 66, 100–112. [Google Scholar] [CrossRef] [Green Version]
  45. Nakada, T.A.; Russell, J.A.; Boyd, J.H.; Walley, K.R. IL17A genetic variation is associated with altered susceptibility to Gram-positive infection and mortality of severe sepsis. Crit. Care 2011, 15, R254. [Google Scholar] [CrossRef] [PubMed] [Green Version]
  46. Dominguez-Villar, M.; Hafler, D.A. Immunology. An innate role for IL-17. Science 2011, 332, 47–48. [Google Scholar] [CrossRef] [PubMed]
  47. Iwakura, Y.; Ishigame, H.; Saijo, S.; Nakae, S. Functional specialization of interleukin-17 family members. Immunity 2011, 34, 149–162. [Google Scholar] [CrossRef] [PubMed] [Green Version]
  48. Zhang, G.; Zou, X.; Liu, Q.; Xie, T.; Huang, R.; Kang, H.; Lai, C.; Zhu, J. MiR-193a-3p functions as a tumour suppressor in human aldosterone-producing adrenocortical adenoma by down-regulating CYP11B2. Int. J. Exp. Pathol. 2018, 99, 77–86. [Google Scholar] [CrossRef]
  49. Hayden, M.S.; Ghosh, S. NF-kappaB in immunobiology. Cell Res. 2011, 21, 223–244. [Google Scholar] [CrossRef] [PubMed] [Green Version]
  50. Inoue, M.; Takahashi, K.; Niide, O.; Shibata, M.; Fukuzawa, M.; Ra, C. LDOC1, a novel MZF-1-interacting protein, induces apoptosis. FEBS Lett. 2005, 579, 604–608. [Google Scholar] [CrossRef] [Green Version]
  51. Mizutani, K.; Koike, D.; Suetsugu, S.; Takenawa, T. WAVE3 functions as a negative regulator of LDOC1. J. Biochem. 2005, 138, 639–646. [Google Scholar] [CrossRef] [PubMed]
  52. Salemi, M.; Barone, N.; La Vignera, S.; Condorelli, R.A.; Recupero, D.; Galia, A.; Fraggetta, F.; Aiello, A.M.; Pepe, P.; Castiglione, R.; et al. Leucine zipper, down regulated in cancer-1 gene expression in prostate cancer. Oncol. Lett. 2016, 12, 2796–2800. [Google Scholar] [CrossRef]
  53. Liu, X.; Zhang, H.; Zhang, B.; Zhang, X. Expression and Role of MicroRNA-663b in Childhood Acute Lymphocytic Leukemia and its Mechanism. Open Med. 2019, 14, 863–871. [Google Scholar] [CrossRef]
  54. He, J.; Kang, Y.; Lian, C.; Wu, J.; Zhou, H.; Ye, X. Effect of miR-19b on the protective effect of Exendin-4 on islet cells in non-obese diabetic mice. Exp. Ther. Med. 2019, 18, 503–508. [Google Scholar] [CrossRef] [Green Version]
  55. Kiugel, M.; Hellberg, S.; Kakela, M.; Liljenback, H.; Saanijoki, T.; Li, X.G.; Tuomela, J.; Knuuti, J.; Saraste, A.; Roivainen, A. Evaluation of [(68)Ga]Ga-DOTA-TCTP-1 for the Detection of Metalloproteinase 2/9 Expression in Mouse Atherosclerotic Plaques. Molecules 2018, 23, 3168. [Google Scholar] [CrossRef] [Green Version]
  56. Ramadori, G.; Ljubicic, S.; Ricci, S.; Mikropoulou, D.; Brenachot, X.; Veyrat-Durebex, C.; Aras, E.; Ioris, R.M.; Altirriba, J.; Malle, E.; et al. S100A9 extends lifespan in insulin deficiency. Nat. Commun. 2019, 10, 3545. [Google Scholar] [CrossRef] [Green Version]
  57. Li, H.; Huang, X.; Chang, X.; Yao, J.; He, Q.; Shen, Z.; Ji, Y.; Wang, K. S100-A9 protein in exosomes derived from follicular fluid promotes inflammation via activation of NF-kappaB pathway in polycystic ovary syndrome. J. Cell Mol. Med. 2020, 24, 114–125. [Google Scholar] [CrossRef] [PubMed] [Green Version]
  58. Qiu, H.; Kelly, P.J.; Zhang, J.; Luo, Q.; Yang, Y.; Mao, Y.; Yang, Z.; Li, J.; Wu, H.; Wang, C. Molecular Detection of Anaplasma spp. and Ehrlichia spp. in Ruminants from Twelve Provinces of China. Can. J. Infect. Dis. Med. Microbiol. 2016, 2016, 9183861. [Google Scholar] [CrossRef] [PubMed] [Green Version]
  59. Li, J.; Kelly, P.; Zhang, J.; Xu, C.; Wang, C. Development of a pan-Babesia FRET-qPCR and a survey of livestock from five Caribbean islands. BMC Vet. Res. 2015, 11, 246. [Google Scholar] [CrossRef] [PubMed] [Green Version]
  60. Yang, Y.; Mao, Y.; Kelly, P.; Yang, Z.; Luan, L.; Zhang, J.; Li, J.; El-Mahallawy, H.S.; Wang, C. A pan-Theileria FRET-qPCR survey for Theileria spp. in ruminants from nine provinces of China. Parasites Vectors 2014, 7, 413. [Google Scholar] [CrossRef] [PubMed] [Green Version]
  61. Yang, Y.; Fan, W.; Mao, Y.; Yang, Z.; Lu, G.; Zhang, R.; Zhang, H.; Szeto, C.; Wang, C. Bovine leukemia virus infection in cattle of China: Association with reduced milk production and increased somatic cell score. J. Dairy Sci. 2016, 99, 3688–3697. [Google Scholar] [CrossRef] [PubMed] [Green Version]
  62. Fang, L.; Hou, Y.; An, J.; Li, B.; Song, M.; Wang, X.; Sorensen, P.; Dong, Y.; Liu, C.; Wang, Y.; et al. Genome-Wide Transcriptional and Post-transcriptional Regulation of Innate Immune and Defense Responses of Bovine Mammary Gland to Staphylococcus aureus. Front. Cell Infect. Microbiol. 2016, 6, 193. [Google Scholar] [CrossRef] [PubMed] [Green Version]
  63. Pu, J.; Li, R.; Zhang, C.; Chen, D.; Liao, X.; Zhu, Y.; Geng, X.; Ji, D.; Mao, Y.; Gong, Y.; et al. Expression profiles of miRNAs from bovine mammary glands in response to Streptococcus agalactiae-induced mastitis. J. Dairy Res. 2017, 84, 300–308. [Google Scholar] [CrossRef] [Green Version]
  64. Chen, Z.; Chu, S.; Wang, X.; Fan, Y.; Zhan, T.; Arbab, A.A.I.; Li, M.; Zhang, H.; Mao, Y.; Loor, J.J.; et al. MicroRNA-106b Regulates Milk Fat Metabolism via ATP Binding Cassette Subfamily A Member 1 (ABCA1) in Bovine Mammary Epithelial Cells. J. Agric. Food Chem. 2019, 67, 3981–3990. [Google Scholar] [CrossRef] [PubMed]
  65. Han, Z.; Fan, Y.; Yang, Z.; Loor, J.J.; Yang, Y. Mammary Transcriptome Profile during Peak and Late Lactation Reveals Differentially Expression Genes Related to Inflammation and Immunity in Chinese Holstein. Animals 2020, 10, 510. [Google Scholar] [CrossRef] [Green Version]
Figure 1. HE staining of mammary tissues. (A) Mammary tissues from the S. aureus-inoculated group with the infiltration of a large number of inflammatory cells, 200×. (B) Mammary tissues from the S. aureus-inoculated group with the infiltration of a large number of inflammatory cells, 400×. (C) Mammary tissues from the control group with an integrated structure, 200×. (D) Mammary tissues from the control group with an integrated structure, 400×. Arrowheads point to the mammary tissues with immune infiltrate.
Pathogens 10 00506 g001
Figure 2. PCA analysis. (A) PCA analysis of miRNAs. (B) PCA analysis of mRNAs.
Pathogens 10 00506 g002
Figure 3. The volcano plots. (A) DE miRNAs in bovine mammary gland between the control group and S. aureus-inoculated group. The up-regulated and down-regulated miRNAs are shown in red and green dots, respectively, while the miRNAs with no significant difference in the two groups are shown in black dots. (B) DEGs in bovine mammary gland between the control group and S. aureus-inoculated group. The up-regulated and down-regulated mRNAs are indicated by red and green dots, respectively, while the mRNAs with no significant difference in the two groups are indicated by black dots.
Pathogens 10 00506 g003
Figure 4. miRNA–mRNA interaction networks. Red and blue triangles represent up-regulated and down-regulated miRNA in the S. aureus-inoculated group, respectively. Red and blue circles represent up-regulated and down-regulated DEGs in the S. aureus-inoculated group, respectively.
Pathogens 10 00506 g004
Figure 5. GO functional enrichment analysis of DEGs. (A) Top 10 significant biological process, cellular component and molecular function terms enriched by up-regulated DEGs. (B) Top 10 significant biological process, cellular component and molecular function terms enriched by down-regulated DEGs.
Pathogens 10 00506 g005
Figure 6. Features of DEGs enriched in top 9 significant GO terms. (A) Circos plots show overlapping and specific responses of up-regulated DEGs. (B) Circos plots summarize features of up-regulated DEGs. (C) Circos plots show overlapping and specific responses of down-regulated DEGs. (D) Circos plots summarize features of down-regulated DEGs.
Pathogens 10 00506 g006
Figure 7. KEGG pathway analysis of DEGs. (A) Scatter plots of the top 30 significant enriched KEGG pathways of up-regulated DEGs. (B) Scatter plots of the top 30 significant enriched KEGG pathways of down-regulated DEGs.
Pathogens 10 00506 g007
Figure 8. Features of DEGs enriched in the top 30 significant KEGG pathways. (A) Circos plots show overlapping and specific responses of up-regulated DEGs. (B) Circos plots summarize features of up-regulated DEGs. (C) Circos plots show overlapping and specific responses of down-regulated DEGs. (D) Circos plots summarize features of down-regulated DEGs.
Pathogens 10 00506 g008
Figure 9. The construction of Staphylococcus aureus-induced mastitis and pathological features and integrative analysis of miRNA and mRNA expression profiles of mammary tissues.
Pathogens 10 00506 g009
Table 1. Significant terms involved in inflammation and immune response.
Term IDTermP-ValueGene NameNumber
GO:0071310cellular response to organic substance0.009CXCR1a, GFPT2, CSF3, IL17A, PTGS2, WNT2, CXCL5, IL2RA, OAS2, PTAFR, PTGIS, ABHD2, RIPOR2, SOCS3, COL1A2, GNG2, COL1A1, SCARB1, LDLR, FYN, ATP2B4, SNAI2, MSN, IRAK2, RAP1B, WASF1, CD14, COL4A1, DERL1, HSPA5, ACVR2A, LDOC1, EHD1, UFM134
GO:0051345positive regulation of hydrolase activity0.010SELE, S100A9, HTR2A, MAPRE2, AHSA2, PYCARD, ABR, CHN1, DNAJB4, ARHGAP15, SEC23A, ATP1B3, AGFG1, ASAP114
GO:1901701cellular response to oxygen-containing compound0.011CXCL5, PTAFR, COL1A2, GNG2, COL1A1, SCARB1, LDLR, FYN, ATP2B4, TXN, SNAI2, MSN, IRAK2, RAP1B, CD14, COL4A1, LDOC1, NCF1, SOD219
GO:0071216cellular response to biotic stimulus0.015CXCL5, PTAFR, SCARB1, IRAK2, CD14, HSPA5, LDOC17
GO:0071222cellular response to lipopolysaccharide0.015CXCL5, PTAFR, SCARB1, IRAK2, CD14, LDOC16
GO:0072676lymphocyte migration0.016RIPOR2, PYCARD, STK10, MSN4
GO:0032496response to lipopolysaccharide0.020CXCL5, PTAFR, SCARB1, IRAK2, TBXA2R, CD14, LDOC17
GO:0071219cellular response to molecule of bacterial origin0.021CXCL5, PTAFR, SCARB1, IRAK2, CD14, LDOC16
GO:0030334regulation of cell migration0.023SRPX2, PRR5L, ABHD2, RIPOR2, STC1, MAPRE2, MMP14, PYCARD, COL1A1, STK10, SNAI2, MSN, TBXA2R, ITGB1, HSPA515
GO:0071229cellular response to acid chemical0.028COL1A2, GNG2, COL1A1, LDLR, COL4A15
GO:0032729positive regulation of interferon gamma production0.028PYCARD, FAM49B, CD143
GO:0050900leukocyte migration0.030SELE, IL17A, S100A9, CXCL5, RIPOR2, PYCARD, STK10, MSN8
GO:0002237response to molecule of bacterial origin0.031CXCL5, PTAFR, SCARB1, IRAK2, TBXA2R, CD14, LDOC17
GO:0030593neutrophil chemotaxis0.034S100A9, CXCL5, RIPOR23
GO:0072678T cell migration0.034RIPOR2, PYCARD, MSN3
GO:0006954inflammatory response0.038IL17A, S100A9, THBS1, PTGS2, ALOX5AP, CD163, PTGS1, PTAFR, PTGIS, SOCS3, PYCARD, LDLR, IRAK2, CYBB14
GO:0030203glycosaminoglycan metabolic process0.040LYVE1, DSE, SLC35D1, UGDH4
GO:0050954sensory perception of mechanical stimulus0.040RIPOR2, COL1A1, FYN, SNAI24
GO:0071230cellular response to amino acid stimulus0.041COL1A2, COL1A1, COL4A13
GO:0006935chemotaxis<0.001CXCL11b, CXCL10, F2RL1, CXCL9, MSTN, NFIB, MET, CCL5, PDGFA, CXCR3, SCN1B11
GO:0050921positive regulation of chemotaxis<0.001CXCL10, F2RL1, MSTN, MET, CCL5, CXCR36
GO:0050920regulation of chemotaxis<0.001CXCL10, F2RL1, MSTN, MET, CCL5, CXCR36
GO:0032103positive regulation of response to external stimulus0.001CXCL10, F2RL1, MSTN, C3, MET, CCL5, CXCR37
GO:0050900leukocyte migration0.001CXCL11, CXCL10, F2RL1, MSTN, GATA3, CCL5, CXCR37
GO:0060326cell chemotaxis0.004CXCL11, CXCL10, MSTN, MET, CCL55
GO:0002690positive regulation of leukocyte chemotaxis0.005CXCL10, MSTN, CCL53
GO:1990868response to chemokine0.005CX3CR1, CCL5, CXCR33
GO:1990869cellular response to chemokine0.005CX3CR1, CCL5, CXCR33
GO:0032101regulation of response to external stimulus0.006CXCL10, F2RL1, MSTN, S100B, C3, GATA3, MET, CCL5, PDGFA, CXCR310
GO:0002688regulation of leukocyte chemotaxis0.010CXCL10, MSTN, CCL53
GO:0002685regulation of leukocyte migration0.012CXCL10, MSTN, CCL5, CXCR34
GO:0030595leukocyte chemotaxis0.013CXCL11, CXCL10, MSTN, CCL54
GO:0002687positive regulation of leukocyte migration0.016CXCL10, MSTN, CCL53
GO:0007606sensory perception of chemical stimulus0.027SCNN1G, SCNN1B2
GO:0036230granulocyte activation0.027F2RL1, CCL52
GO:0071622regulation of granulocyte chemotaxis0.027MSTN, CCL52
GO:1905517macrophage migration0.027MSTN, CCL52
GO:0002673regulation of acute inflammatory response0.032S100B, C32
GO:0050918positive chemotaxis0.034CXCL10, MET, CCL53
GO:0009605response to external stimulus0.039CXCL11, CXCL10, F2RL1, CXCL9, MSTN, S100B, C3, NFIB, REEP6, GATA3, AQP3, MET, IKZF3, CCL5, PDGFA, CXCR3, SCN1B17
GO:0072678T cell migration0.043CXCL11, CXCL102
GO:2000401regulation of lymphocyte migration0.048CXCL10, CCL52
GO:1904062regulation of cation transmembrane transport0.048CXCL11, CXCL10, CXCL9, CXCR34
GO:0042379chemokine receptor binding<0.001CXCL11, CXCL10, CXCL9, CCL54
a The names in bold italic indicate that the genes are up-regulated in the S. aureus-inoculated group. b The names in regular italic indicate that the genes are down-regulated in the S. aureus-inoculated group.
Table 2. Significant KEGG pathways involved in inflammation and immune response.
Pathway IDPathwayP-ValueGene NameNumber
bta04666Fc gamma R-mediated phagocytosis<0.001PLA2G4Aa, MARCKSL1, VASP, SYK, PIK3R3, FCGR1A, WASF1, CFL1, ASAP1, NCF1, ARPC5, LYN, ARPC2, MAP2K114
bta04668TNF signaling pathway<0.001CXCL2, SELE, MMP3, PTGS2, CXCL6, VEGFC, SOCS3, MMP14, CASP3, LIF, CSF1, PIK3R3, MAP3K8, TNFAIP3, MAP2K3, MAP2K116
bta04066HIF-1 signaling pathway<0.001SERPINE1, LDHA, PFKFB3, PGK1, HIF1A, PFKP, TFRC, PIK3R3, MKNK1, ALDOA, ENO1, ENO2, CYBB, MAP2K114
bta04015Rap1 signaling pathway<0.001ITGAM, THBS1, PDGFRA, ID1, ITGB3, PDGFD, VEGFC, APBB1IP, FYB, PDGFRB, VASP, CSF1, PIK3R3, SIPA1L2, RAP1B, PFN1, MAP2K3, ITGB1, TLN1, PRKD3, MAP2K121
bta04657IL-17 signaling pathway<0.001CXCL2, CSF3, IL17A, MMP3, S100A9, FOSL1, PTGS2, CXCL6, MMP1, CASP3, TNFAIP3, MAPK612
bta05020Prion diseases0.001 NCAM1, LAMC1, FYN, PRKACB, HSPA5, MAP2K16
bta04664Fc epsilon RI signaling pathway0.002 ALOX5AP, FCER1A, PLA2G4A, FYN, SYK, PIK3R3, MAP2K3, LYN, MAP2K19
bta04151PI3K–Akt signaling pathway0.002 CSF3, THBS2, BDNF, THBS1, ITGA5, IL2RA, PDGFRA, EPOR, ITGB3, PDGFD, VEGFC, COL1A2, LAMA4, ITGA9, LAMC1, GNG2, COL1A1, PDGFRB, CSF1, SYK, PIK3R3, YWHAG, GNB4, COL4A1, ITGB1, CDK2, MAP2K127
bta05134Legionellosis0.002 CXCL2, ITGAM, NAIP, CASP3, PYCARD, HSPA8, CD14, SAR1A8
bta05146Amoebiasis0.002 SERPINB4, CXCL2, ITGAM, COL1A2, CASP3, LAMA4, LAMC1, COL1A1, PRKACB, PIK3R3, CD14, COL4A112
bta04670Leukocyte transendothelial migration0.005 ITGAM, MMP2, JAM3, VASP, PIK3R3, MSN, RAP1B, PTPN11, ITGB1, NCF1, CYBB11
bta04062Chemokine signaling pathway0.007 CXCR2, CXCL2, CCR1, CXCL6, CCL16, PREX1, GNG2, ARRB2, PRKACB, PIK3R3, RAP1B, GNB4, NCF1, LYN, MAP2K115
bta05100Bacterial invasion of epithelial cells0.008 ITGA5, CBL, PIK3R3, WASF1, DNM3, ITGB1, ARPC5, ARPC28
bta04145Phagosome0.008 THBS2, ITGAM, THBS1, ITGA5, ITGB3, SCARB1, TUBB3, TFRC, FCGR1A, CD14, ITGB1, ATP6V1C1, NCF1, CYBB14
bta05165Human papillomavirus infection0.011 THBS2, THBS1, PTGS2, WNT2, ITGA5, ITGB3, PKM, COL1A2, CASP3, LAMA4, ITGA9, LAMC1, COL1A1, PDGFRB, PRKACB, NOTCH2, PIK3R3, COL4A1, MX2, ITGB1, ATP6V1C1, CDK2, MAP2K123
bta05167Kaposi sarcoma-associated herpesvirus infection0.023 CXCL2, CCR1, PTGS2, E2F3, CASP3, PREX1, GNG2, HIF1A, RCAN1, SYK, PIK3R3, GNB4, MAPKAPK2, LYN, MAP2K115
bta05323Rheumatoid arthritis0.023 CXCL2, IL17A, MMP3, CXCL6, MMP1, CD80, CSF1, ATP6V1C1, IL119
bta04392Hippo signaling pathway- multiple species0.026 RASSF2, WTIP, TEAD3, WWTR14
bta04014Ras signaling pathway0.030 BDNF, PDGFRA, PDGFD, VEGFC, PLA2G4A, GNG2, PDGFRB, PRKACB, CSF1, PIK3R3, RAP1B, GNB4, ABL1, PTPN11, ABL2, MAP2K116
bta04061Viral protein interaction with cytokine and cytokine receptor0.033 CXCR2, CXCL2, CCR1, CXCL6, IL2RA, CCL16, IL10RA, CSF18
bta05140Leishmaniasis0.033 ITGAM, PTGS2, MARCKSL1, FCGR1A, ITGB1, NCF1, CYBB7
bta05145Toxoplasmosis0.035 IL10RA, CASP3, LAMA4, LAMC1, LDLR, SOCS1, MAP2K3, HSPA8, ITGB19
bta04060Cytokine–cytokine receptor interaction<0.001CXCL11b, CX3CR1, CXCL10, CXCL9, NGFR, CXCL14, MSTN, XCL1, IL17RE, BMP3, TNFRSF9, TNFSF10, GHR, CXCR6, CCL5, TNFRSF19, CXCR3, TGFB218
bta04061Viral protein interaction with cytokine and cytokine receptor<0.001CXCL11, CX3CR1, CXCL10, CXCL9, CXCL14, XCL1, TNFSF10, CCL5, CXCR39
bta04062Chemokine signaling pathway0.001CXCL11, CX3CR1, CXCL10, CXCL9, CXCL14, XCL1, ITK, PRKCZ, CXCR6, CCL5, CXCR311
bta04015Rap1 signaling pathway0.004FGFR4, NGFR, PRKCZ, FGFR2, MET, LPAR2, TLN2, INSR, PDGFA, MAGI3, CTNND111
bta04670Leukocyte trans endothelial migration0.007CLDN1, ITK, OCLN, CLDN3, TXK, EZR, CTNND17
bta05340Primary immunodeficiency0.009CD8A, BLNK, CIITA, TAP14
bta01521EGFR tyrosine kinase inhibitor resistance0.020ERBB3, FGFR2, MET, PDGFA, GAB15
bta04010MAPK signaling pathway0.028FGFR4, ERBB3, NGFR, RPS6KA6, FGFR2, MET, INSR, MAP3K13, PDGFA, MAP3K1, TGFB211
bta04390Hippo signaling pathway0.034RASSF6, PRKCZ, DLG3, PPP2R2B, TCF7, TCF7L2, TGFB27
bta04151PI3K–Akt signaling pathway0.035FGFR4, ERBB3, NGFR, GHR, FGFR2, PPP2R2B, MET, LPAR2, INSR, ITGA6, LAMC2, PDGFA, ITGA313
a The names in bold italic indicate that the genes are up-regulated in the S. aureus-inoculated group. b The names in regular italic indicate that the genes are down-regulated in the S. aureus-inoculated group.
Publisher’s Note: MDPI stays neutral with regard to jurisdictional claims in published maps and institutional affiliations.

