Inflammatory Properties of Diet and Glucose-Insulin Homeostasis in a Cohort of Iranian Adults

Abstract
:1. Introduction
2. Methods
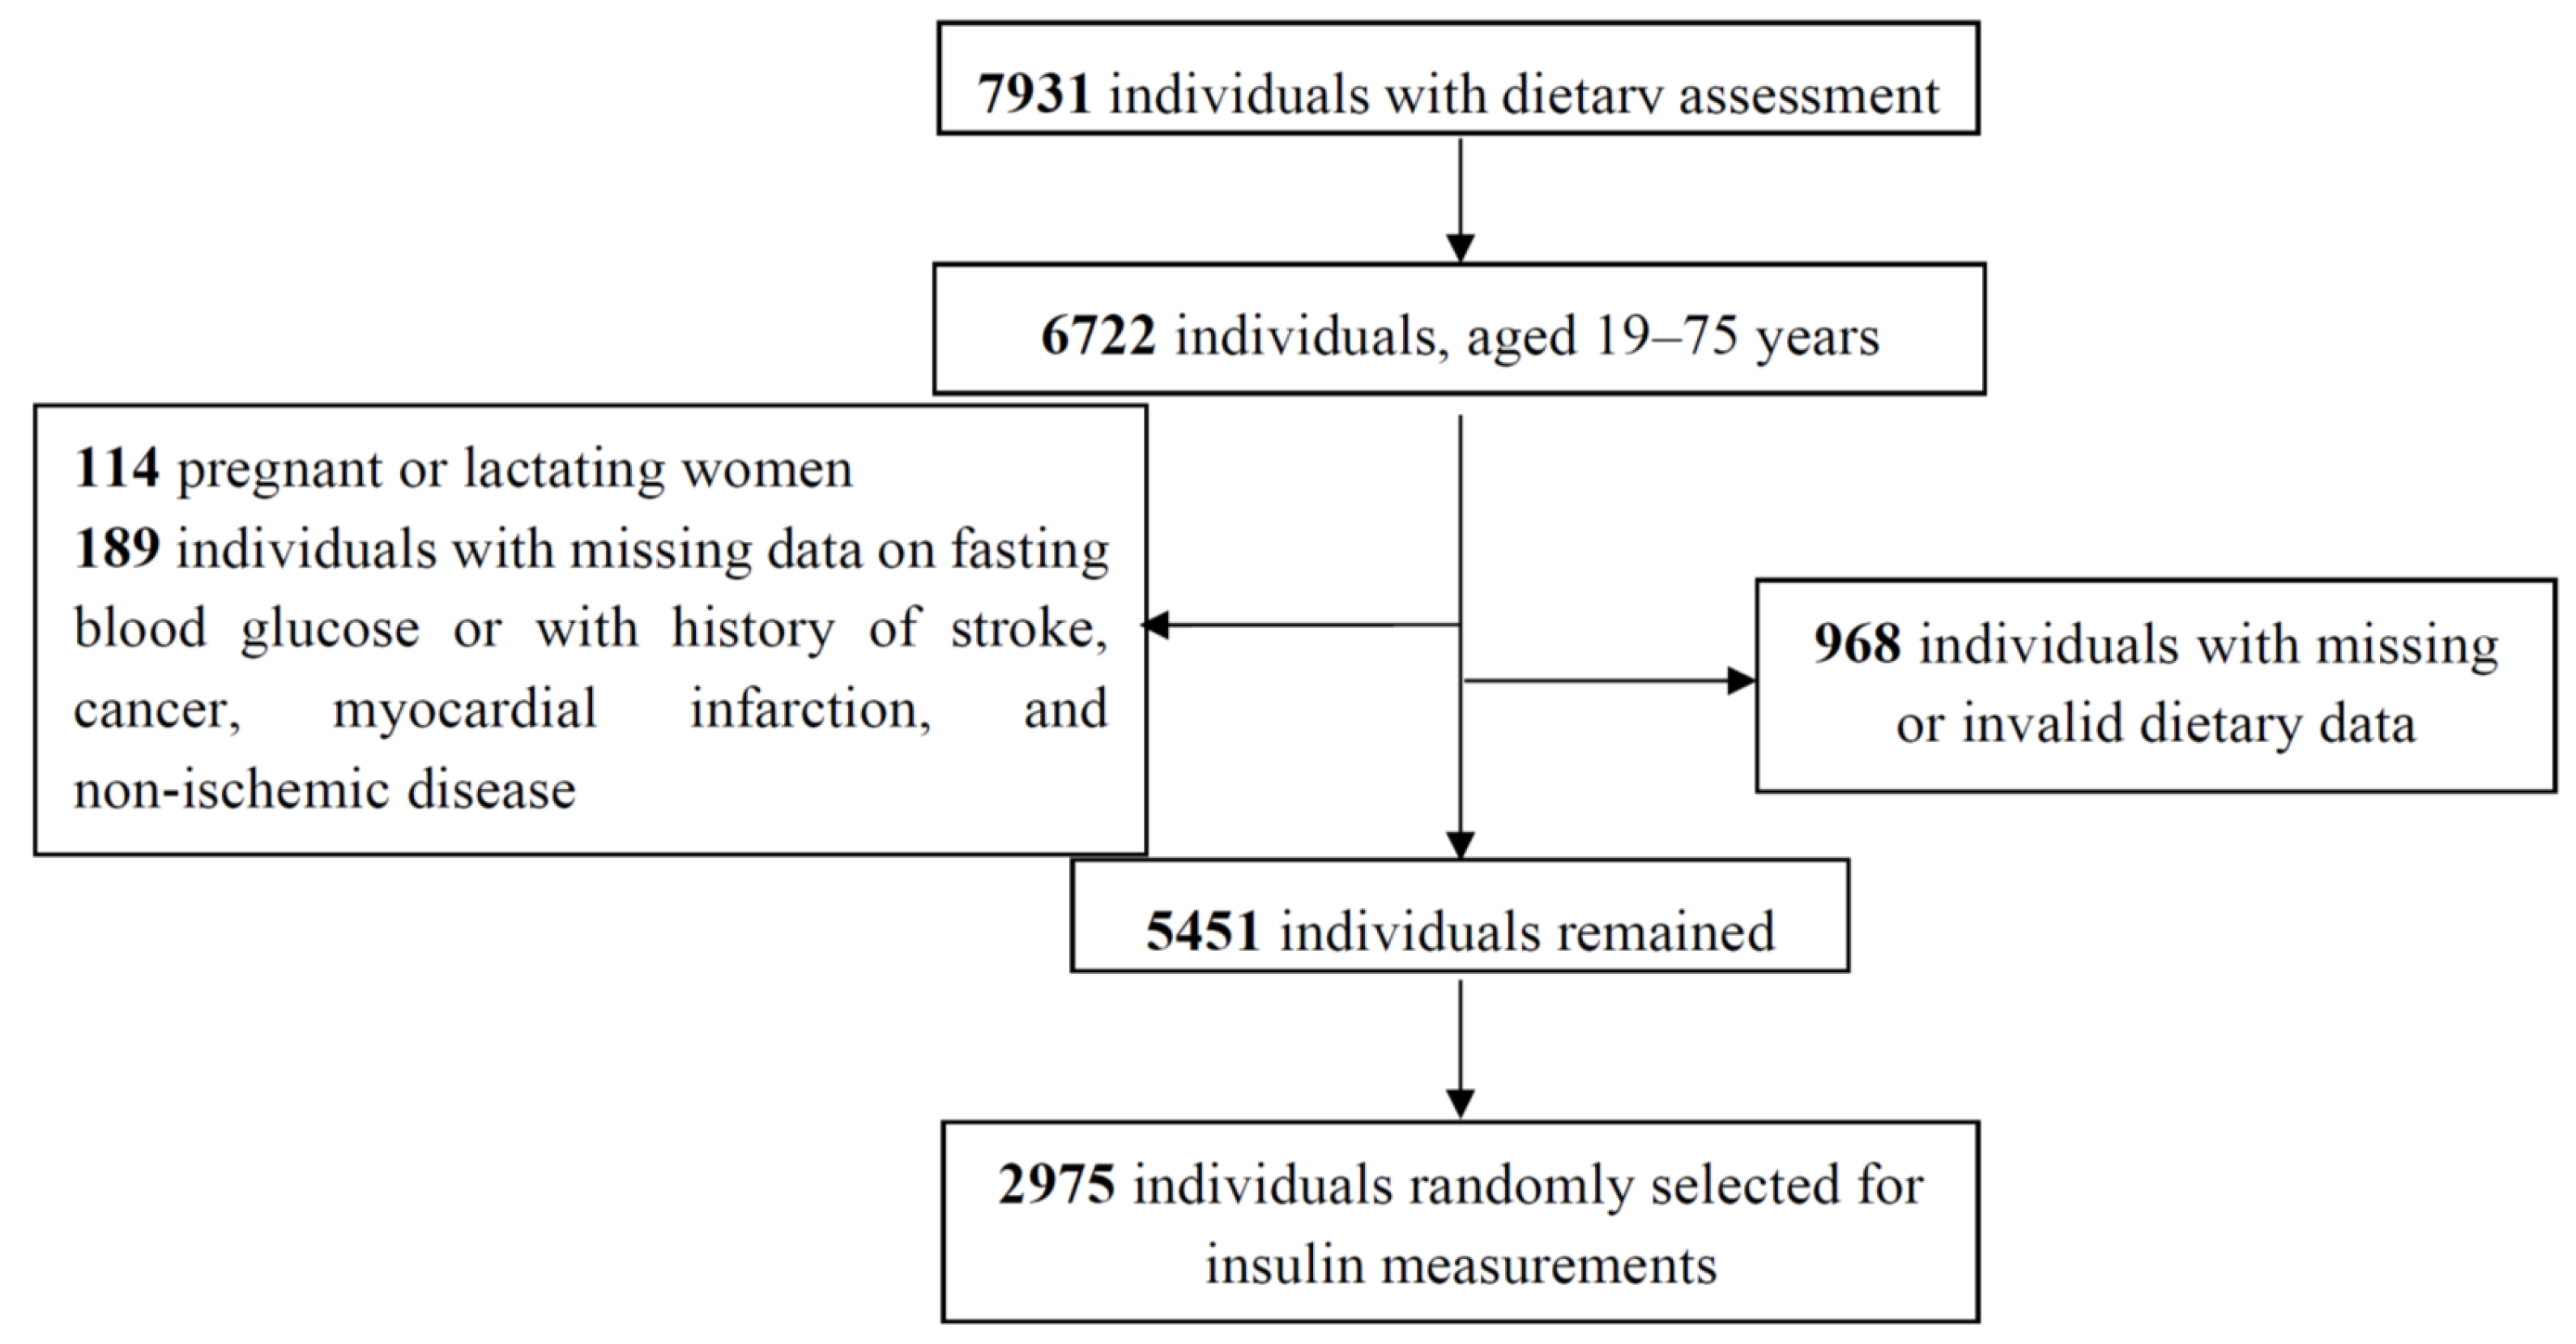
2.1. Participants
2.2. Clinical and Biochemical Measurements
2.3. Outcome Definitions
2.4. Dietary Assessment and Calculation of the Dietary Inflammatory Index
2.5. Statistical Analysis
3. Results
4. Discussion
5. Conclusions
Acknowledgments
Authors Contributions
Conflicts of interest
References
- Herman, W.H.; Zimmet, P. Type 2 diabetes: An epidemic requiring global attention and urgent action. Diabetes Care 2012, 35, 943–944. [Google Scholar] [CrossRef] [PubMed]
- Guariguata, L.; Whiting, D.; Hambleton, I.; Beagley, J.; Linnenkamp, U.; Shaw, J. Global estimates of diabetes prevalence for 2013 and projections for 2035. Diabetes Res. Clin. Pract. 2014, 103, 137–149. [Google Scholar] [CrossRef] [PubMed]
- World Health Organization (WHO). Global Status Report on Noncommunicable Diseases 2014; World Health Organization: Geneva, Switzerland, 2014. [Google Scholar]
- Hu, F.B. Globalization of diabetes: The role of diet, lifestyle, and genes. Diabetes Care 2011, 34, 1249–1257. [Google Scholar] [CrossRef] [PubMed]
- Hosseinpour-Niazi, S.; Mirmiran, P.; Amiri, Z.; Hosseini-Esfahani, F.; Shakeri, N.; Azizi, F. Legume intake is inversely associated with metabolic syndrome in adults. Arch. Iran. Med. 2012, 15, 538–544. [Google Scholar] [PubMed]
- Hosseinpour-Niazi, S.; Sohrab, G.; Asghari, G.; Mirmiran, P.; Moslehi, N.; Azizi, F. Dietary glycemic index, glycemic load, and cardiovascular disease risk factors: Tehran Lipid and Glucose Study. Arch. Iran. Med. 2013, 16, 401–407. [Google Scholar] [PubMed]
- Moslehi, N.; Shab-Bidar, S.; Mirmiran, P.; Sadeghi, M.; Azizi, F. Associations between dairy products consumption and risk of type 2 diabetes: Tehran lipid and glucose study. Int. J. Food Sci. Nutr. 2015, 66, 692–699. [Google Scholar] [CrossRef] [PubMed]
- Mirmiran, P.; Bahadoran, Z.; Moslehi, N.; Bastan, S.; Azizi, F. Colors of fruits and vegetables and 3-year changes of cardiometabolic risk factors in adults: Tehran lipid and glucose study. Eur. J. Clin. 2015, 69, 1215–1219. [Google Scholar] [CrossRef] [PubMed]
- Calder, P.C.; Albers, R.; Antoine, J.-M.; Blum, S.; Bourdet-Sicard, R.; Ferns, G.; Folkerts, G.; Friedmann, P.; Frost, G.; Guarner, F. Inflammatory disease processes and interactions with nutrition. Br. J. Nutr. 2009, 101, 1–45. [Google Scholar] [CrossRef] [PubMed]
- Sharma, B.R.; Kim, H.J.; Rhyu, D.Y. Caulerpa lentillifera extract ameliorates insulin resistance and regulates glucose metabolism in C57BL/KsJ-db/db mice via PI3K/AKT signaling pathway in myocytes. J. Transl. Med. 2015, 13, 62. [Google Scholar] [CrossRef] [PubMed]
- Shivappa, N.; Steck, S.E.; Hurley, T.G.; Hussey, J.R.; Hebert, J.R. Designing and developing a literature-derived, population-based dietary inflammatory index. Public Health Nutr. 2014, 17, 1689–1696. [Google Scholar] [CrossRef] [PubMed]
- Shivappa, N.; Hebert, J.R.; Rietzschel, E.R.; De Buyzere, M.L.; Langlois, M.; Debruyne, E.; Marcos, A.; Huybrechts, I. Associations between dietary inflammatory index and inflammatory markers in the Asklepios Study. Br. J. Nutr. 2015, 113, 665–671. [Google Scholar] [CrossRef] [PubMed]
- Shivappa, N.; Steck, S.E.; Hurley, T.G.; Hussey, J.R.; Ma, Y.; Ockene, I.S.; Tabung, F.; Hebert, J.R. A population-based dietary inflammatory index predicts levels of C-reactive protein in the Seasonal Variation of Blood Cholesterol Study (SEASONS). Public Health Nutr. 2014, 17, 1825–1833. [Google Scholar] [CrossRef] [PubMed]
- Garcia-Arellano, A.; Ramallal, R.; Ruiz-Canela, M.; Salas-Salvado, J.; Corella, D.; Shivappa, N.; Schroder, H.; Hebert, J.R.; Ros, E.; Gomez-Garcia, E.; et al. Dietary Inflammatory Index and Incidence of Cardiovascular Disease in the PREDIMED Study. Nutrients 2015, 7, 4124–4138. [Google Scholar] [CrossRef] [PubMed]
- Shivappa, N.; Bosetti, C.; Zucchetto, A.; Montella, M.; Serraino, D.; La Vecchia, C.; Hebert, J.R. Association between dietary inflammatory index and prostate cancer among Italian men. Br. J. Nutr. 2015, 113, 278–283. [Google Scholar] [CrossRef] [PubMed]
- Shivappa, N.; Prizment, A.E.; Blair, C.K.; Jacobs, D.R., Jr.; Steck, S.E.; Hebert, J.R. Dietary inflammatory index and risk of colorectal cancer in the Iowa Women’s Health Study. Cancer Epidemiol. Biomark. Prev. 2014, 23, 2383–2392. [Google Scholar] [CrossRef] [PubMed]
- Tabung, F.K.; Steck, S.E.; Ma, Y.; Liese, A.D.; Zhang, J.; Caan, B.; Hou, L.; Johnson, K.C.; Mossavar-Rahmani, Y.; Shivappa, N.; et al. The association between dietary inflammatory index and risk of colorectal cancer among postmenopausal women: Results from the Women’s Health Initiative. Cancer Causes Control 2015, 26, 399–408. [Google Scholar] [CrossRef] [PubMed]
- Wood, L.G.; Shivappa, N.; Berthon, B.S.; Gibson, P.G.; Hebert, J.R. Dietary inflammatory index is related to asthma risk, lung function and systemic inflammation in asthma. Clin. Exp. Allergy 2015, 45, 177–183. [Google Scholar] [CrossRef] [PubMed]
- Ruiz-Canela, M.; Zazpe, I.; Shivappa, N.; Hebert, J.R.; Sanchez-Tainta, A.; Corella, D.; Salas-Salvado, J.; Fito, M.; Lamuela-Raventos, R.M.; Rekondo, J.; et al. Dietary inflammatory index and anthropometric measures of obesity in a population sample at high cardiovascular risk from the PREDIMED (PREvencion con DIeta MEDiterranea) trial. Br. J. Nutr. 2015, 113, 984–995. [Google Scholar] [CrossRef] [PubMed]
- Shivappa, N.; Hebert, J.R.; Karamati, M.; Shariati-Bafghi, S.E.; Rashidkhani, B. Increased inflammatory potential of diet is associated with bone mineral density among postmenopausal women in Iran. Eur. J. Nutr. 2015, 55, 561–568. [Google Scholar] [CrossRef] [PubMed]
- Van Woudenbergh, G.J.; Theofylaktopoulou, D.; Kuijsten, A.; Ferreira, I.; van Greevenbroek, M.M.; van der Kallen, C.J.; Schalkwijk, C.G.; Stehouwer, C.D.; Ocke, M.C.; Nijpels, G.; et al. Adapted dietary inflammatory index and its association with a summary score for low-grade inflammation and markers of glucose metabolism: The Cohort study on Diabetes and Atherosclerosis Maastricht (CODAM) and the Hoorn study. Am. J. Clin. Nutr. 2013, 98, 1533–1542. [Google Scholar] [CrossRef] [PubMed]
- Wirth, M.D.; Burch, J.; Shivappa, N.; Violanti, J.M.; Burchfiel, C.M.; Fekedulegn, D.; Andrew, M.E.; Hartley, T.A.; Miller, D.B.; Mnatsakanova, A.; et al. Association of a dietary inflammatory index with inflammatory indices and metabolic syndrome among police officers. J. Occup. Environ. Med. 2014, 56, 986–989. [Google Scholar] [CrossRef] [PubMed]
- Alkerwi, A.; Shivappa, N.; Crichton, G.; Hebert, J.R. No significant independent relationships with cardiometabolic biomarkers were detected in the observation of cardiovascular risk factors in Luxembourg study population. Nutr. Res. 2014, 34, 1058–1065. [Google Scholar] [CrossRef] [PubMed]
- Azizi, F.; Ghanbarian, A.; Momenan, A.A.; Hadaegh, F.; Mirmiran, P.; Hedayati, M.; Mehrabi, Y.; Zahedi-Asl, S. Prevention of non-communicable disease in a population in nutrition transition: Tehran Lipid and Glucose Study phase II. Trials 2009, 10, 5. [Google Scholar] [CrossRef] [PubMed]
- Momenan, A.A.; Delshad, M.; Sarbazi, N.; Rezaei Ghaleh, N.; Ghanbarian, A.; Azizi, F. Reliability and validity of the Modifiable Activity Questionnaire (MAQ) in an Iranian urban adult population. Arch. Iran. Med. 2012, 15, 279–282. [Google Scholar] [PubMed]
- American Diabetes Association. Diagnosis and Classification of Diabetes Mellitus. Diabetes Care 2014, 37, S81–S90. [Google Scholar]
- Ghasemi, A.; Tohidi, M.; Derakhshan, A.; Hasheminia, M.; Azizi, F.; Hadaegh, F. Cut-off points of homeostasis model assessment of insulin resistance, beta-cell function, and fasting serum insulin to identify future type 2 diabetes: Tehran Lipid and Glucose Study. Acta Diabetol. 2015, 52, 905–915. [Google Scholar] [CrossRef] [PubMed]
- Hosseini Esfahani, F.; Asghari, G.; Mirmiran, P.; Azizi, F. Reproducibility and relative validity of food group intake in a food frequency questionnaire developed for the Tehran Lipid and Glucose Study. J. Epidemiol. 2010, 20, 150–158. [Google Scholar] [CrossRef]
- Mirmiran, P.; Esfahani, F.H.; Mehrabi, Y.; Hedayati, M.; Azizi, F. Reliability and relative validity of an FFQ for nutrients in the Tehran lipid and glucose study. Public Health Nutr. 2010, 13, 654–662. [Google Scholar] [CrossRef] [PubMed]
- Willett, W.C.; Howe, G.R.; Kushi, L.H. Adjustment for total energy intake in epidemiologic studies. Am. J. Clin. Nutr. 1997, 65, 1220s–1228s. [Google Scholar] [PubMed]


| Characteristics | Quartiles of the DII | ||||
|---|---|---|---|---|---|
| Q1 (n = 743) | Q2 (n = 744) | Q3 (n = 744) | Q4 (n = 744) | p * | |
| DII | |||||
| Median | −3.43 | −1.96 | −0.48 | 1.24 | |
| Minimum, maximum | −5.82, <−2.67 | −2.67, <−1.23 | −1.23, <0.29 | 0.29, 5.23 | |
| Age, years | 47.8 ± 11.6 | 45.8 ± 11.9 | 43.5 ± 11.3 | 41.9 ± 11.3 | <0.001 |
| Men | 209 (16.1) | 292 (22.4) | 375 (28.8) | 428 (32.8) | <0.001 |
| Smoking | 27 (11.9) | 47 (20.7) | 73 (32.2) | 80 (35.2) | <0.001 |
| Body mass index †, kg/m2 | 28.8 ± 4.63 | 28.0 ± 4.41 | 27.8 ± 4.47 | 27.4 ± 4.41 | <0.001 |
| Physical activity ‡, MET-min/week | 652 ± 893 | 561 ± 768 | 505 ± 762 | 469 ± 780 | <0.001 |
| Family history of diabetes § | 76 (23.5) | 85 (26.3) | 80 (24.8) | 82 (25.4) | 0.90 |
| Glucose-lowering medication | 62 (42.8) | 36 (24.8) | 24 (16.6) | 23 (15.9) | <0.001 |
| Lipid-lowering medication | 74 (36.5) | 52 (25.6) | 44 (21.7) | 33 (16.3) | <0.001 |
| Hypertension ¶ | 152 (31.5) | 127 (26.3) | 105 (21.8) | 98 (20.3) | 0.001 |
| Variables | Model 1 † | Model 2 ‡ | ||
|---|---|---|---|---|
| Standardized Beta | p | Standardized Beta | p | |
| Fasting plasma glucose, mmol/L | 0.008 | 0.61 | 0.01 | 0.52 |
| Postload glucose, mmol/L | 0.03 | 0.05 | 0.04 | 0.05 |
| Fasting insulin, μU/mL | 0.01 | 0.42 | 0.02 | 0.17 |
| HOMA-IR | 0.02 | 0.38 | 0.02 | 0.15 |
| HOMA-B | 0.007 | 0.71 | 0.01 | 0.48 |
| QUICKI | −0.01 | 0.43 | −0.02 | 0.18 |
| Variables | Quartiles of the Dietary Inflammatory Index | ||||||||||
|---|---|---|---|---|---|---|---|---|---|---|---|
| Q1 (n = 743) | Q2 (n = 744) | Q3 (n = 744) | Q4 (n = 744) | p 1 vs. 4 | p 2 vs. 4 | ptrend | |||||
| Geometric Means | 95% CI | Geometric Means | 95% CI | Geometric Means | 95% CI | Geometric Means | 95% CI | ||||
| Fasting plasma glucose, mmol/L | |||||||||||
| Model 1 | 5.45 | 5.39, 5.52 | 5.38 | 5.32, 5.44 | 5.46 | 5.39, 5.52 | 5.46 | 5.39, 5.52 | 0.89 | 0.08 | 0.23 |
| Model 2 | 5.45 | 5.39, 5.51 | 5.38 | 5.32, 5.44 | 5.46 | 5.39, 5.51 | 5.46 | 5.40, 5.52 | 0.82 | 0.07 | 0.24 |
| Postload glucose, mmol/L | |||||||||||
| Model 1 | 5.67 | 5.51, 5.78 | 5.72 | 5.61, 5.83 | 5.83 | 5.67, 5.94 | 5.78 | 5.67, 5.89 | 0.15 | 0.53 | 0.28 |
| Model 2 | 5.67 | 5.51, 5.78 | 5.72 | 5.61, 5.83 | 5.83 | 5.67, 5.94 | 5.78 | 5.67, 5.89 | 0.13 | 0.51 | 0.27 |
| Fasting insulin, μU/mL | |||||||||||
| Model 1 | 8.15 | 7.84, 8.47 | 8.26 | 7.95, 8.57 | 8.23 | 7.93, 8.55 | 8.48 | 8.16, 8.81 | 0.16 | 0.33 | 0.53 |
| Model 2 | 8.12 | 7.83, 8.41 | 8.26 | 7.99, 8.56 | 8.21 | 7.94, 8.50 | 8.52 | 8.22, 8.82 | 0.07 | 0.24 | 0.29 |
| HOMA-IR | |||||||||||
| Model 1 | 1.97 | 1.89, 2.06 | 1.97 | 1.89, 2.05 | 2.00 | 1.91, 2.08 | 2.05 | 1.97, 2.14 | 0.18 | 0.17 | 0.49 |
| Model 2 | 1.96 | 1.89, 2.04 | 1.98 | 1.90, 2.05 | 1.99 | 1.91, 2.06 | 2.06 | 1.99, 2.14 | 0.08 | 0.11 | 0.28 |
| HOMA-B | |||||||||||
| Model 1 | 89.7 | 86.0, 93.5 | 93.4 | 89.5, 97.2 | 90.6 | 86.9, 94.4 | 92.9 | 89.0, 96.8 | 0.26 | 0.88 | 0.48 |
| Model 2 | 89.4 | 85.8, 93.1 | 93.4 | 89.8, 97.2 | 90.5 | 86.9, 94.1 | 93.1 | 89.5, 97.0 | 0.17 | 0.92 | 0.34 |
| QUICKI | |||||||||||
| Model 1 | 0.35 | 0.34, 0.35 | 0.35 | 0.34, 0.35 | 0.34 | 0.34, 0.35 | 0.34 | 0.34, 0.35 | 0.20 | 0.22 | 0.55 |
| Model 2 | 0.35 | 0.34, 0.35 | 0.35 | 0.34, 0.35 | 0.34 | 0.34, 0.35 | 0.34 | 0.34, 0.35 | 0.09 | 0.16 | 0.33 |
| Variables | Dietary Inflammatory Index | |||||||
|---|---|---|---|---|---|---|---|---|
| Q1 | Q2 | Q3 | Q4 | ptrend | ||||
| OR | 95% CI | OR | 95% CI | OR | 95% CI | |||
| Glucose tolerance abnormality * (n = 1007) | ||||||||
| Model 1 | 1.00 | 0.94 | 0.74, 1.19 | 1.11 | 0.87, 1.41 | 1.15 | 0.90, 1.47 | 0.14 |
| Model 2 | 1.00 | 0.94 | 0.74, 1.19 | 1.10 | 0.87, 1.40 | 1.15 | 0.90, 1.48 | 0.14 |
| Impaired fasting glucose † (n = 590) | ||||||||
| Model 1 | 1.00 | 0.96 | 0.74, 1.25 | 1.11 | 0.85, 1.44 | 1.09 | 0.83, 1.44 | 0.36 |
| Model 2 | 1.00 | 0.97 | 0.74, 1.26 | 1.10 | 0.84, 1.43 | 1.09 | 0.83, 1.44 | 0.37 |
| Impaired glucose tolerance ‡ (n = 259) | ||||||||
| Model 1 | 1.00 | 0.96 | 0.66, 1.39 | 0.99 | 0.68, 1.46 | 1.24 | 0.85, 1.81 | 0.25 |
| Model 2 | 1.00 | 0.96 | 0.66, 1.40 | 0.98 | 0.67, 1.45 | 1.24 | 0.84, 1.81 | 0.27 |
| Type 2 diabetes § (n = 286) | ||||||||
| Model 1 | 1.00 | 0.96 | 0.67, 1.38 | 1.06 | 0.73, 1.54 | 0.99 | 0.66, 1.47 | 0.93 |
| Model 2 | 1.00 | 0.96 | 0.67, 1.38 | 1.05 | 0.72, 1.53 | 0.98 | 0.66, 1.47 | 0.94 |
| Insulin resistance || (n = 1923) | ||||||||
| Model 1 ¶ | 1.00 | 1.01 | 0.81, 1.26 | 0.97 | 0.77, 1.22 | 1.11 | 0.87, 1.40 | 0.47 |
| Model 2 | 1.00 | 1.05 | 0.83, 1.32 | 0.98 | 0.77, 1.25 | 1.18 | 0.91, 1.51 | 0.29 |
© 2016 by the authors; licensee MDPI, Basel, Switzerland. This article is an open access article distributed under the terms and conditions of the Creative Commons Attribution (CC-BY) license (http://creativecommons.org/licenses/by/4.0/).
Share and Cite
Moslehi, N.; Ehsani, B.; Mirmiran, P.; Shivappa, N.; Tohidi, M.; Hébert, J.R.; Azizi, F. Inflammatory Properties of Diet and Glucose-Insulin Homeostasis in a Cohort of Iranian Adults. Nutrients 2016, 8, 735. https://doi.org/10.3390/nu8110735
Moslehi N, Ehsani B, Mirmiran P, Shivappa N, Tohidi M, Hébert JR, Azizi F. Inflammatory Properties of Diet and Glucose-Insulin Homeostasis in a Cohort of Iranian Adults. Nutrients. 2016; 8(11):735. https://doi.org/10.3390/nu8110735
Chicago/Turabian StyleMoslehi, Nazanin, Behnaz Ehsani, Parvin Mirmiran, Nitin Shivappa, Maryam Tohidi, James R. Hébert, and Fereidoun Azizi. 2016. "Inflammatory Properties of Diet and Glucose-Insulin Homeostasis in a Cohort of Iranian Adults" Nutrients 8, no. 11: 735. https://doi.org/10.3390/nu8110735