
Effects of Consuming Beverages Sweetened with Fructose, Glucose, High-Fructose Corn Syrup, Sucrose, or Aspartame on OGTT-Derived Indices of Insulin Sensitivity in Young Adults

 , , , ,
Abstract
:
1. Introduction
2. Materials and Methods
2.1. Previous Publications
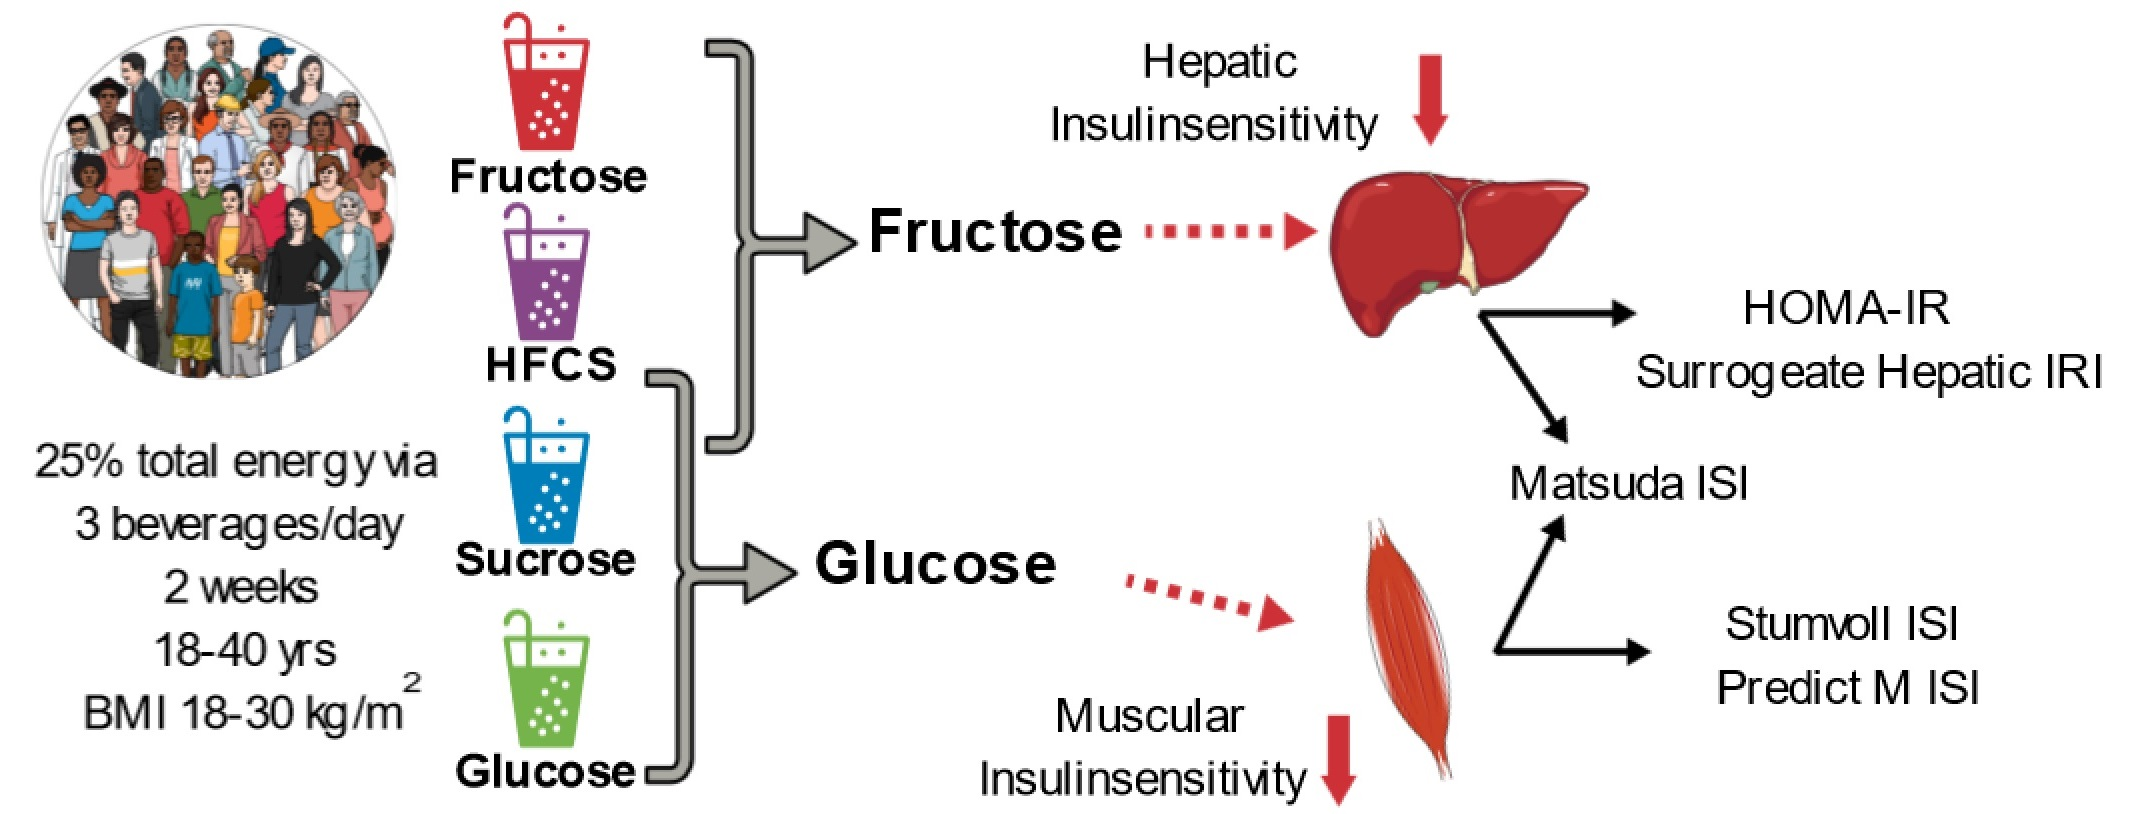
2.2. Participants
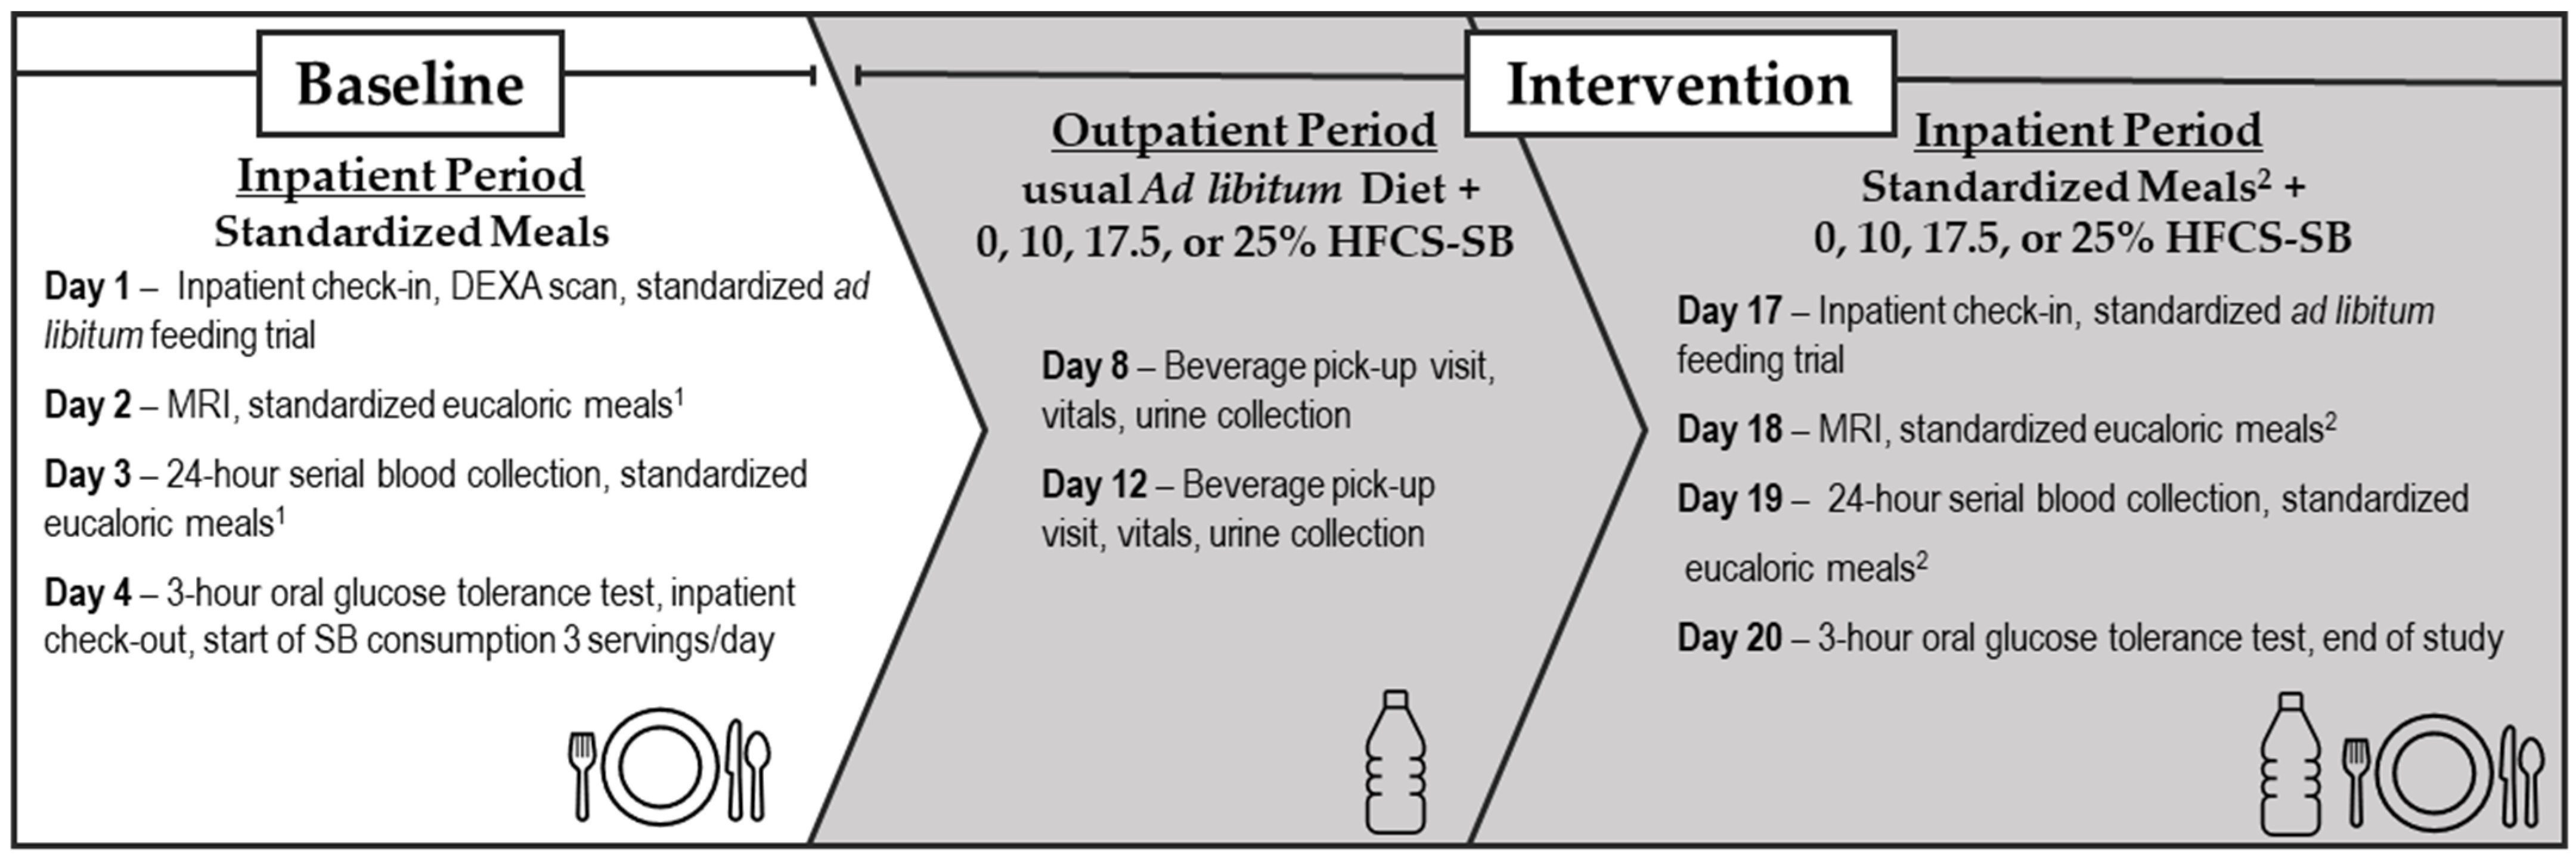
2.3. Study Protocol
2.3.1. Inpatient Meals
2.3.2. Study Beverages and Outpatient Meals
2.3.3. Insulin Sensitivity
2.3.4. Outpatient 24-h Food Intake Recalls
2.4. Statistical Analyses
3. Results
3.1. Outcomes at Baseline

| Parameter | 25% HFCS (n = 28) | 25% Sucrose (n = 24) | 25% Fructose (n = 28) | 25% Glucose (n = 28) | Aspartame (n = 23) |
|---|---|---|---|---|---|
| Age (year) | 26.8 ± 6.6 | 25.9 ± 6.1 | 26.8 ± 6.2 | 26.0 ± 5.7 | 25.4 ± 6.2 |
| Sex (M/F) | 15/13 | 12/12 | 15/13 | 15/13 | 11/12 |
| BMI (kg/m2) | 24.9 ± 4.0 | 25.3 ± 3.4 | 25.4 ± 3.7 | 25.8 ± 3.4 | 24.8 ± 3.3 |
| Waist circumference (cm) | 77.0 ± 10.1 | 75.4 ± 7.3 | 78.3 ± 10.2 | 79.0 ± 9.3 | 75.2 ± 6.4 |
| Body fat (%) | 26.0 ± 9.7 | 29.1 ± 11.3 | 29.0 ± 10.3 | 28.9 ± 8.4 | 27.1 ± 9.6 |
| Energy requirement (kcal/d) | 2390 ± 350 | 2351 ± 310 | 2450 ± 324 | 2431 ± 309 | 2354 ± 322 |
| Systolic blood pressure (mm Hg) | 117 ± 10 | 114 ± 8 | 117 ± 10 | 119 ± 11 | 112 ± 12 |
| Diastolic blood pressure (mm Hg) | 73 ± 7 | 72 ± 6 | 72 ± 7 | 74 ± 8 | 69 ± 9 |
| Fasting triglyceride (mmol/L) | 1.2 ± 0.6 | 1.3 ± 0.6 | 1.1 ± 0.4 | 1.1 ± 0.5 | 1.1 ± 0.6 |
| Fasting total cholesterol (mmol/L) | 4.1 ± 0.9 | 4.1 ± 0.6 | 3.9 ± 0.6 | 4.2 ± 0.8 | 3.9 ± 0.7 |
| Fasting HDL cholesterol (mmol/L) | 1.2 ± 0.4 | 1.1 ± 0.2 | 1.2 ± 0.2 | 1.2 ± 0.4 | 1.0 ± 0.2 |
| MSRF | 1.1 ± 1.0 | 0.9 ± 1.1 | 0.8 ± 0.9 | 1.0 ± 0.9 | 1.2 ± 0.7 |
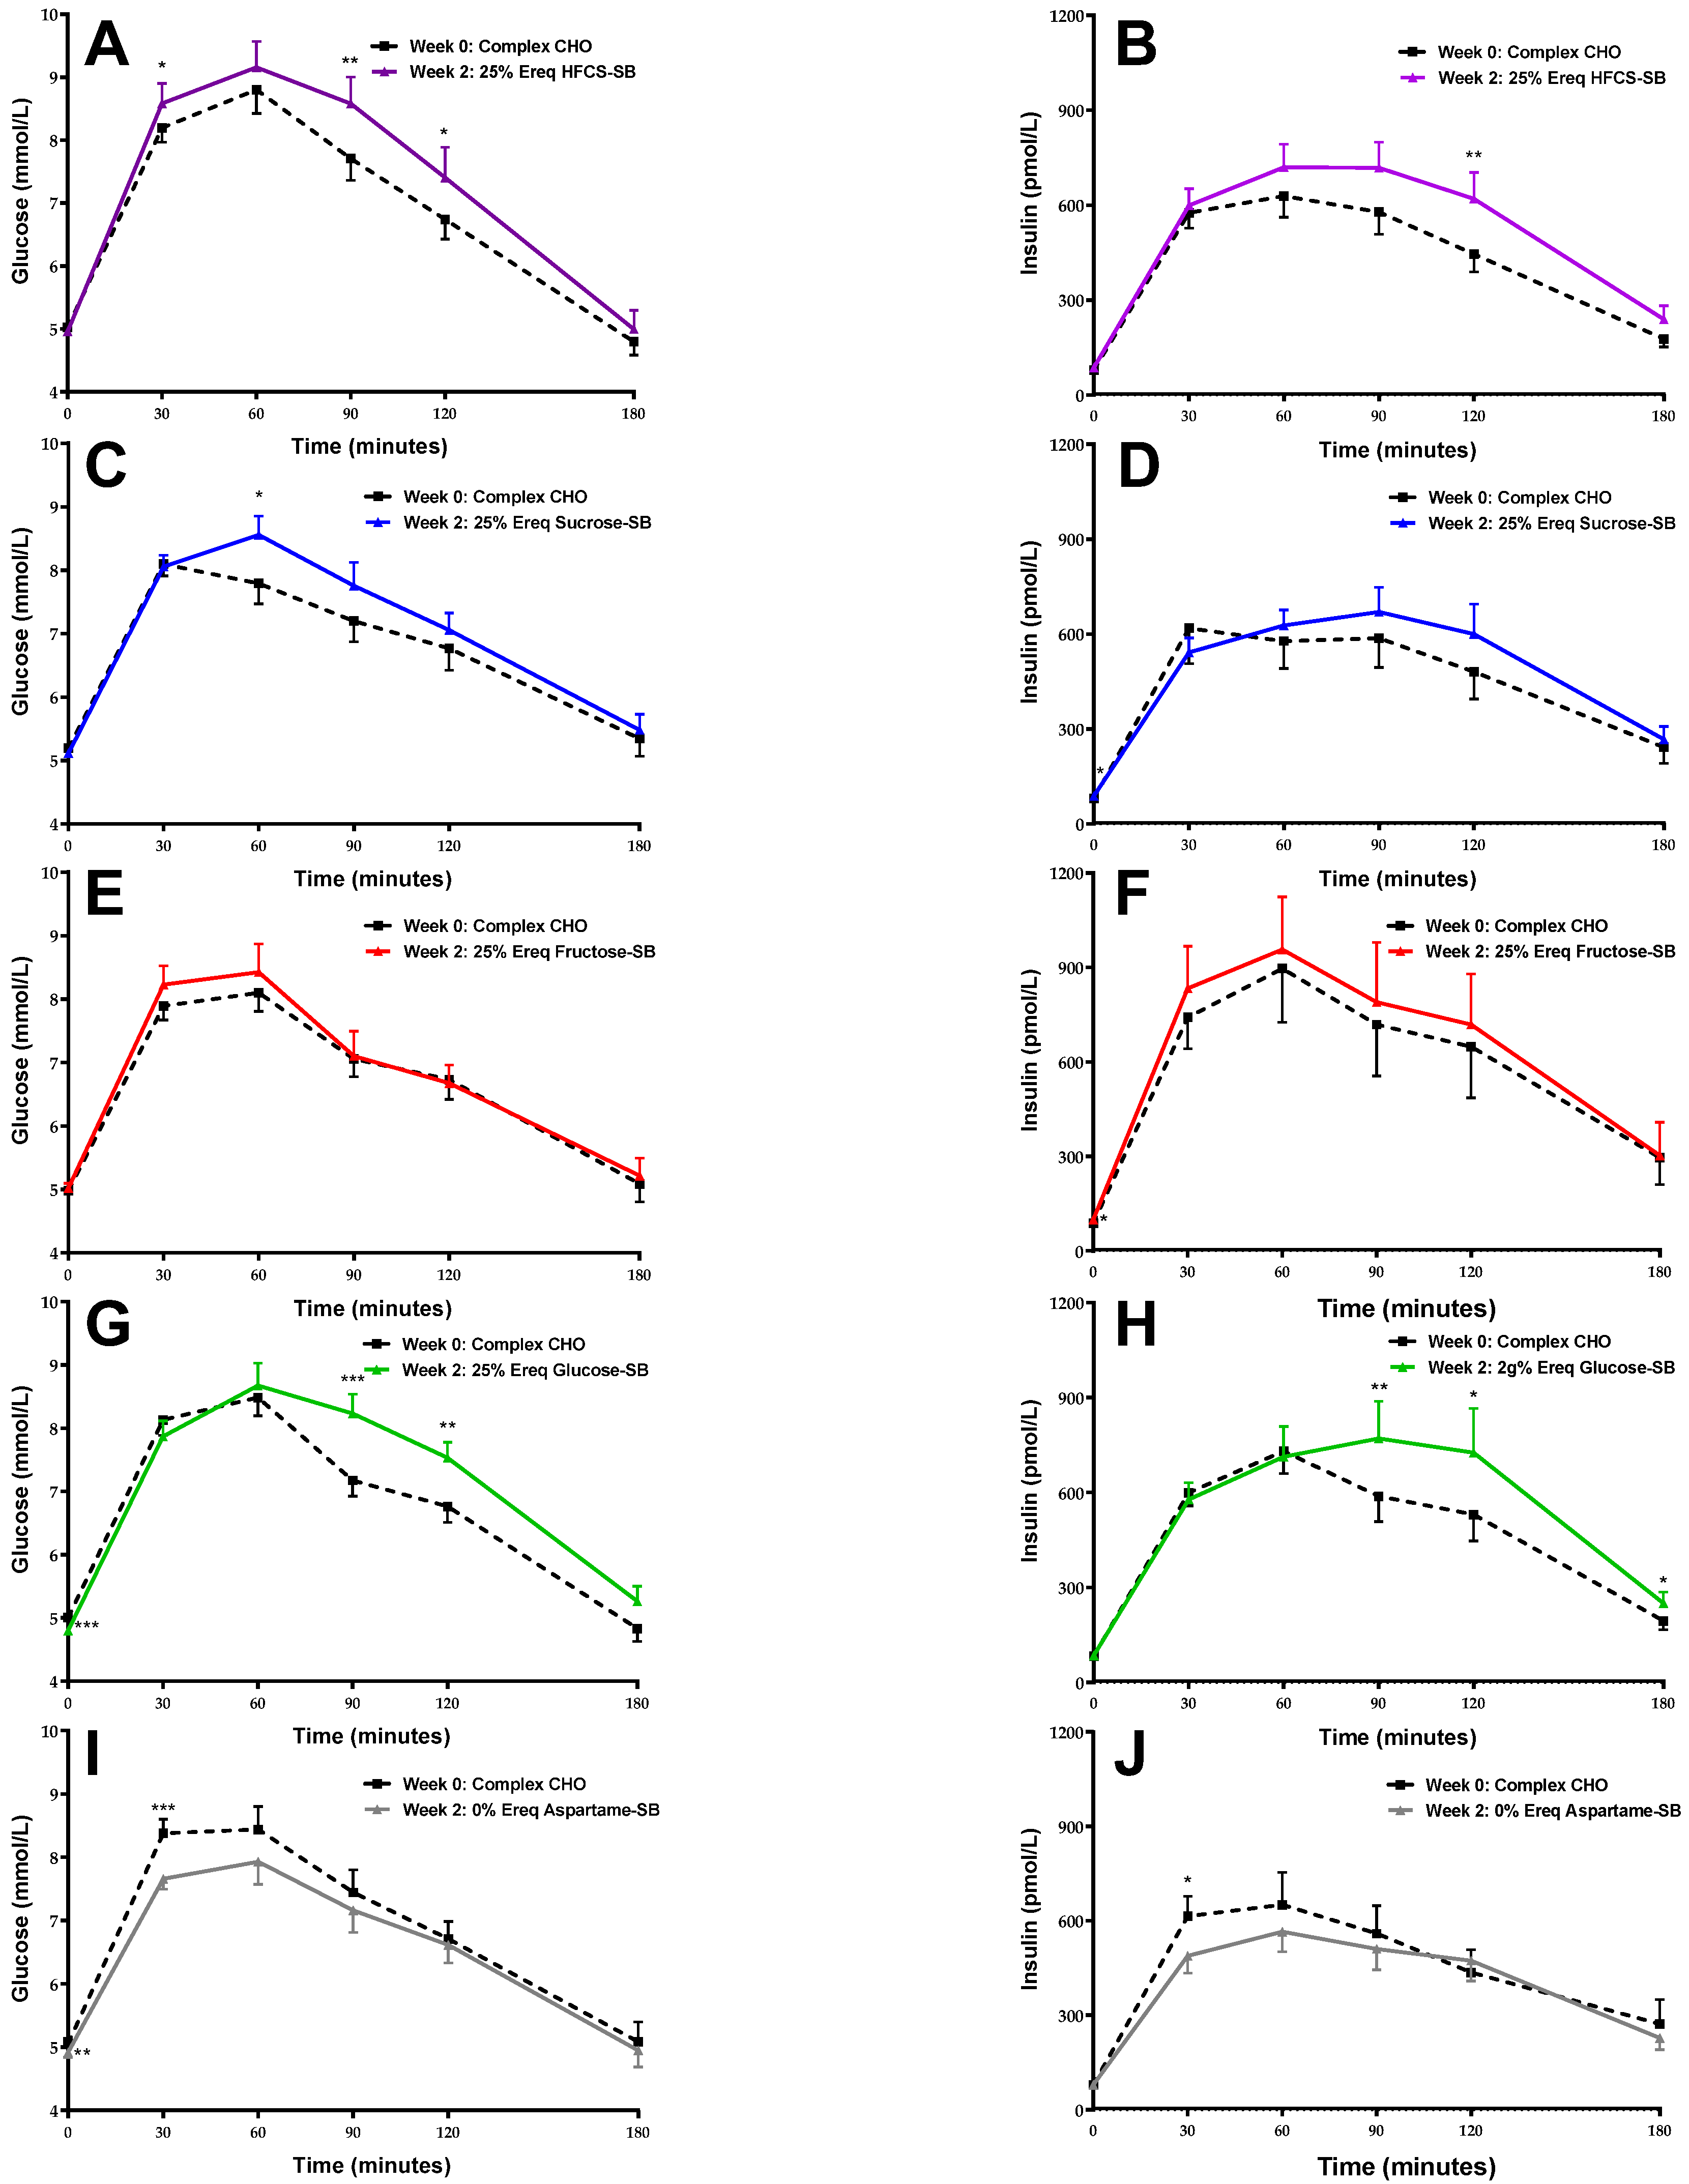
3.2. Glucose and Insulin Responses during OGTT
3.3. Body Weight and OGTT-Derived Outcomes
3.4. Body Weight
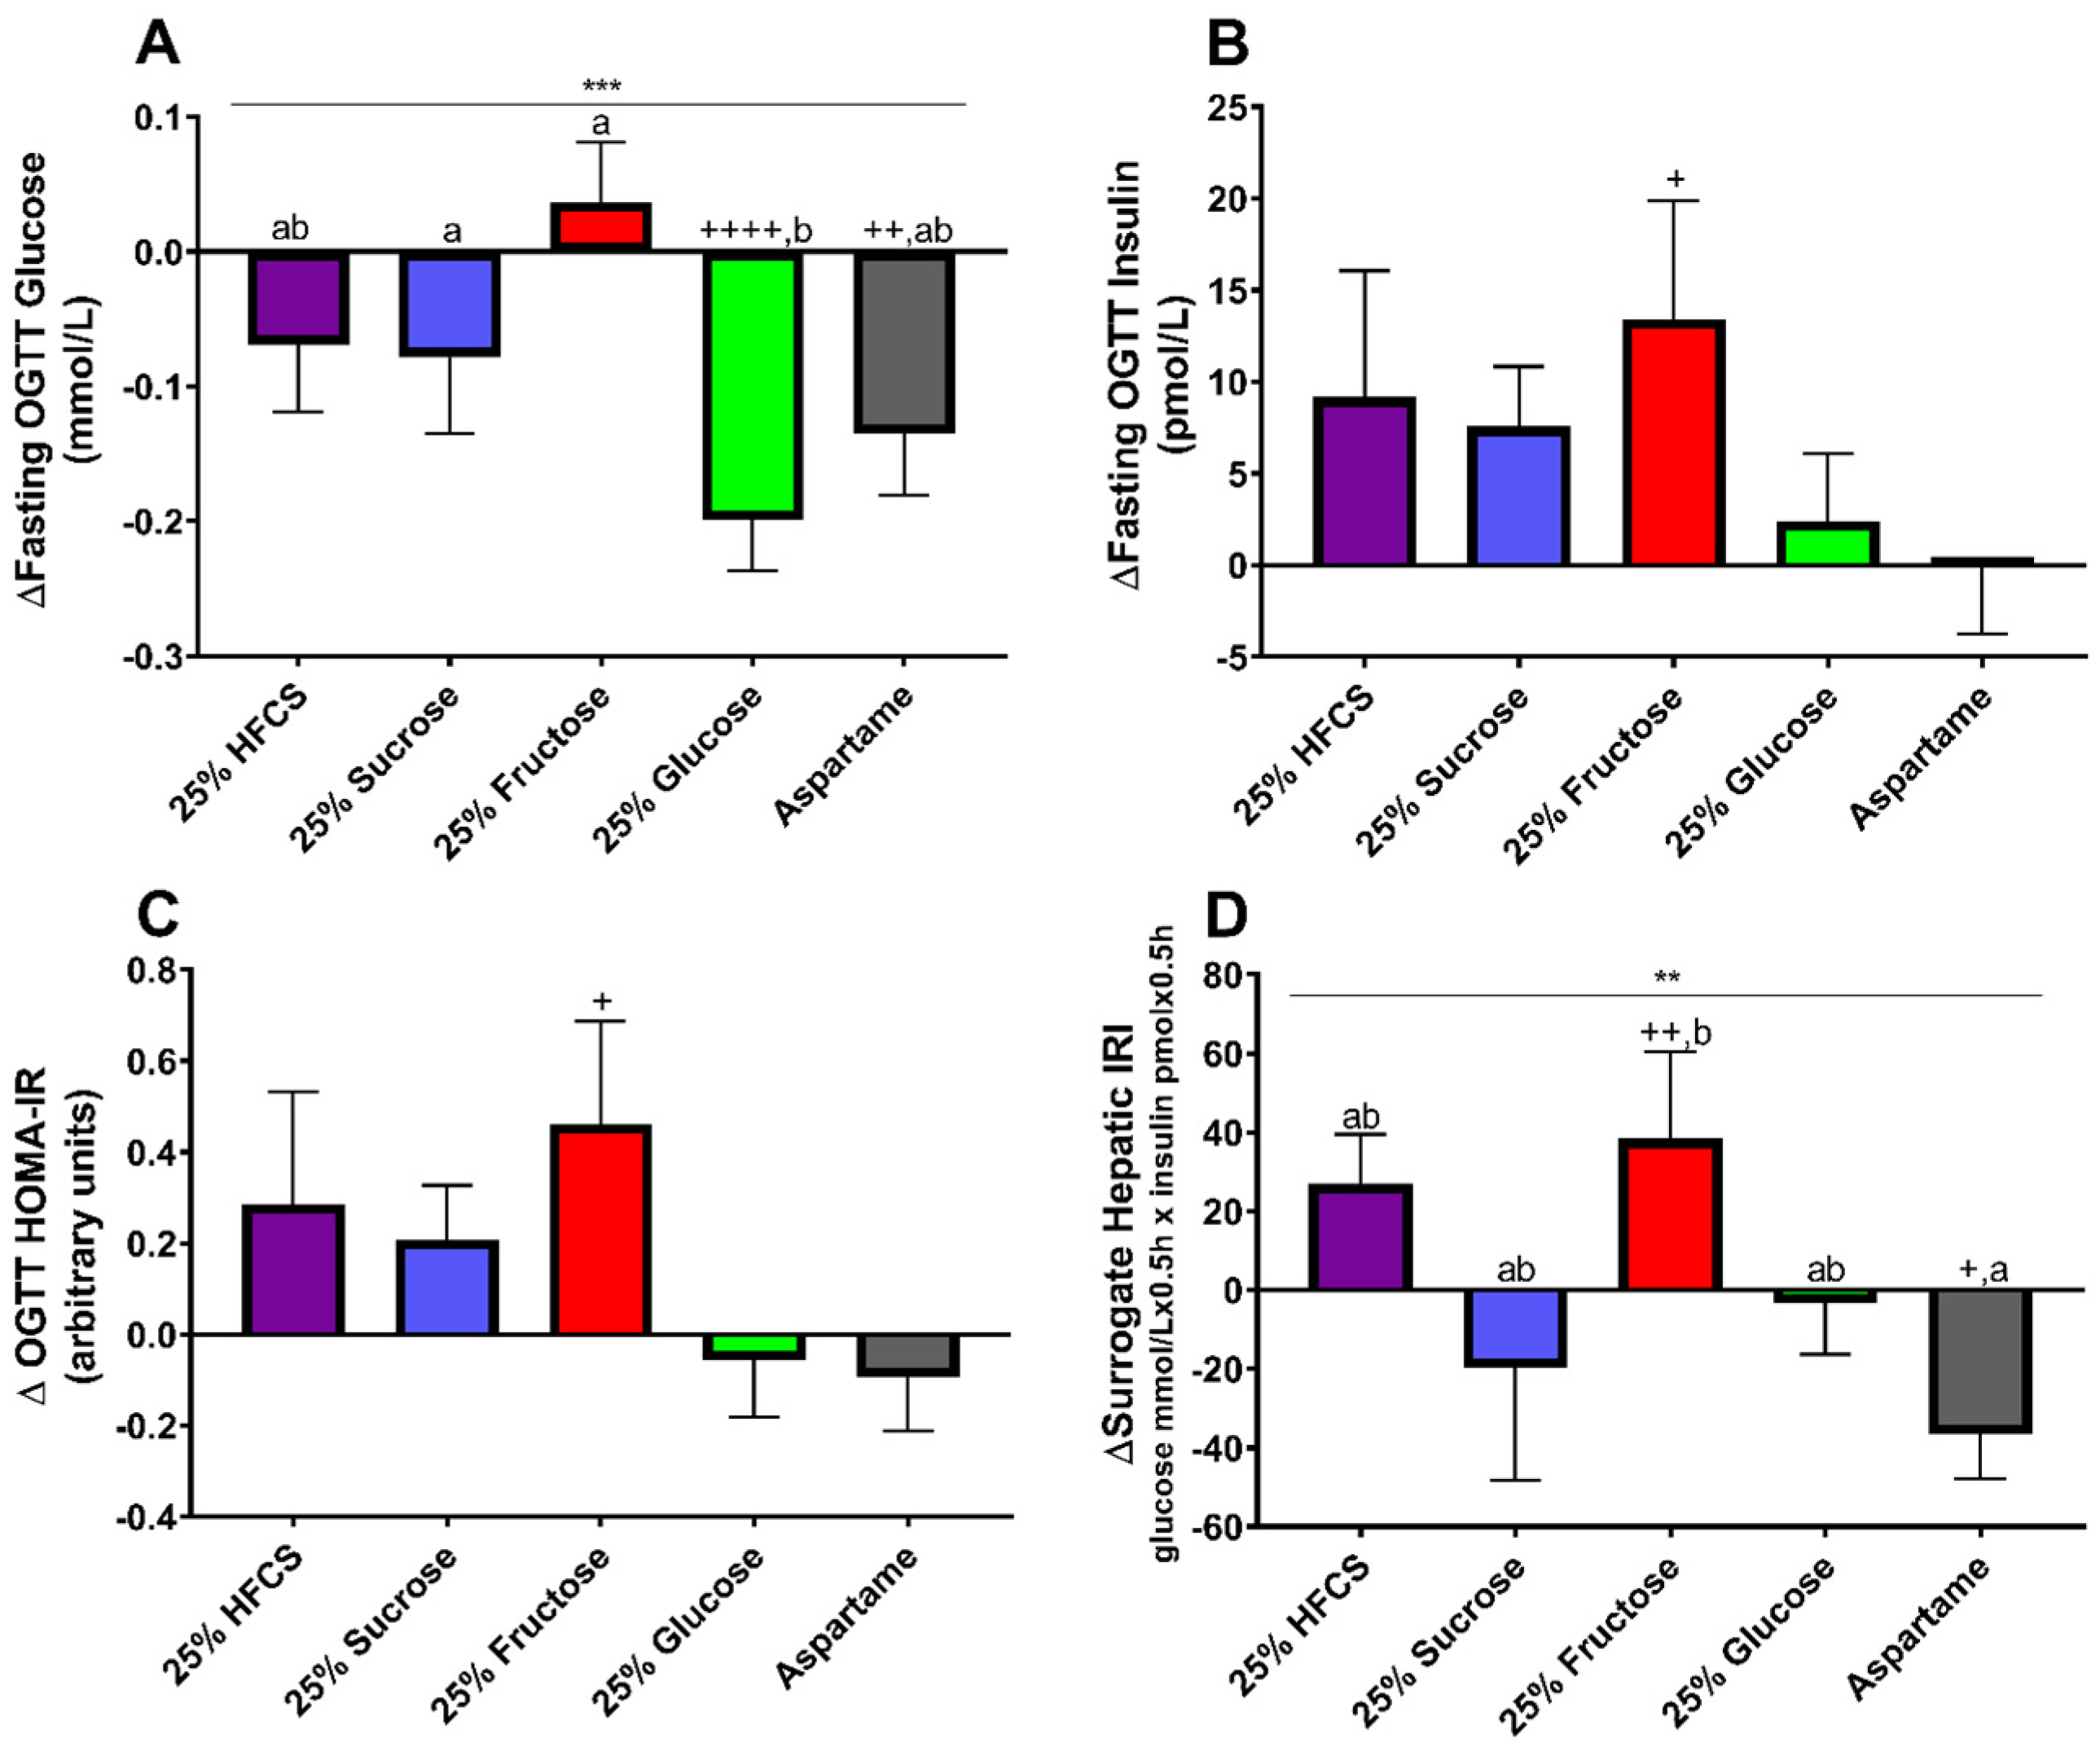
3.5. Static Indices and Surrogate Hepatic IRI
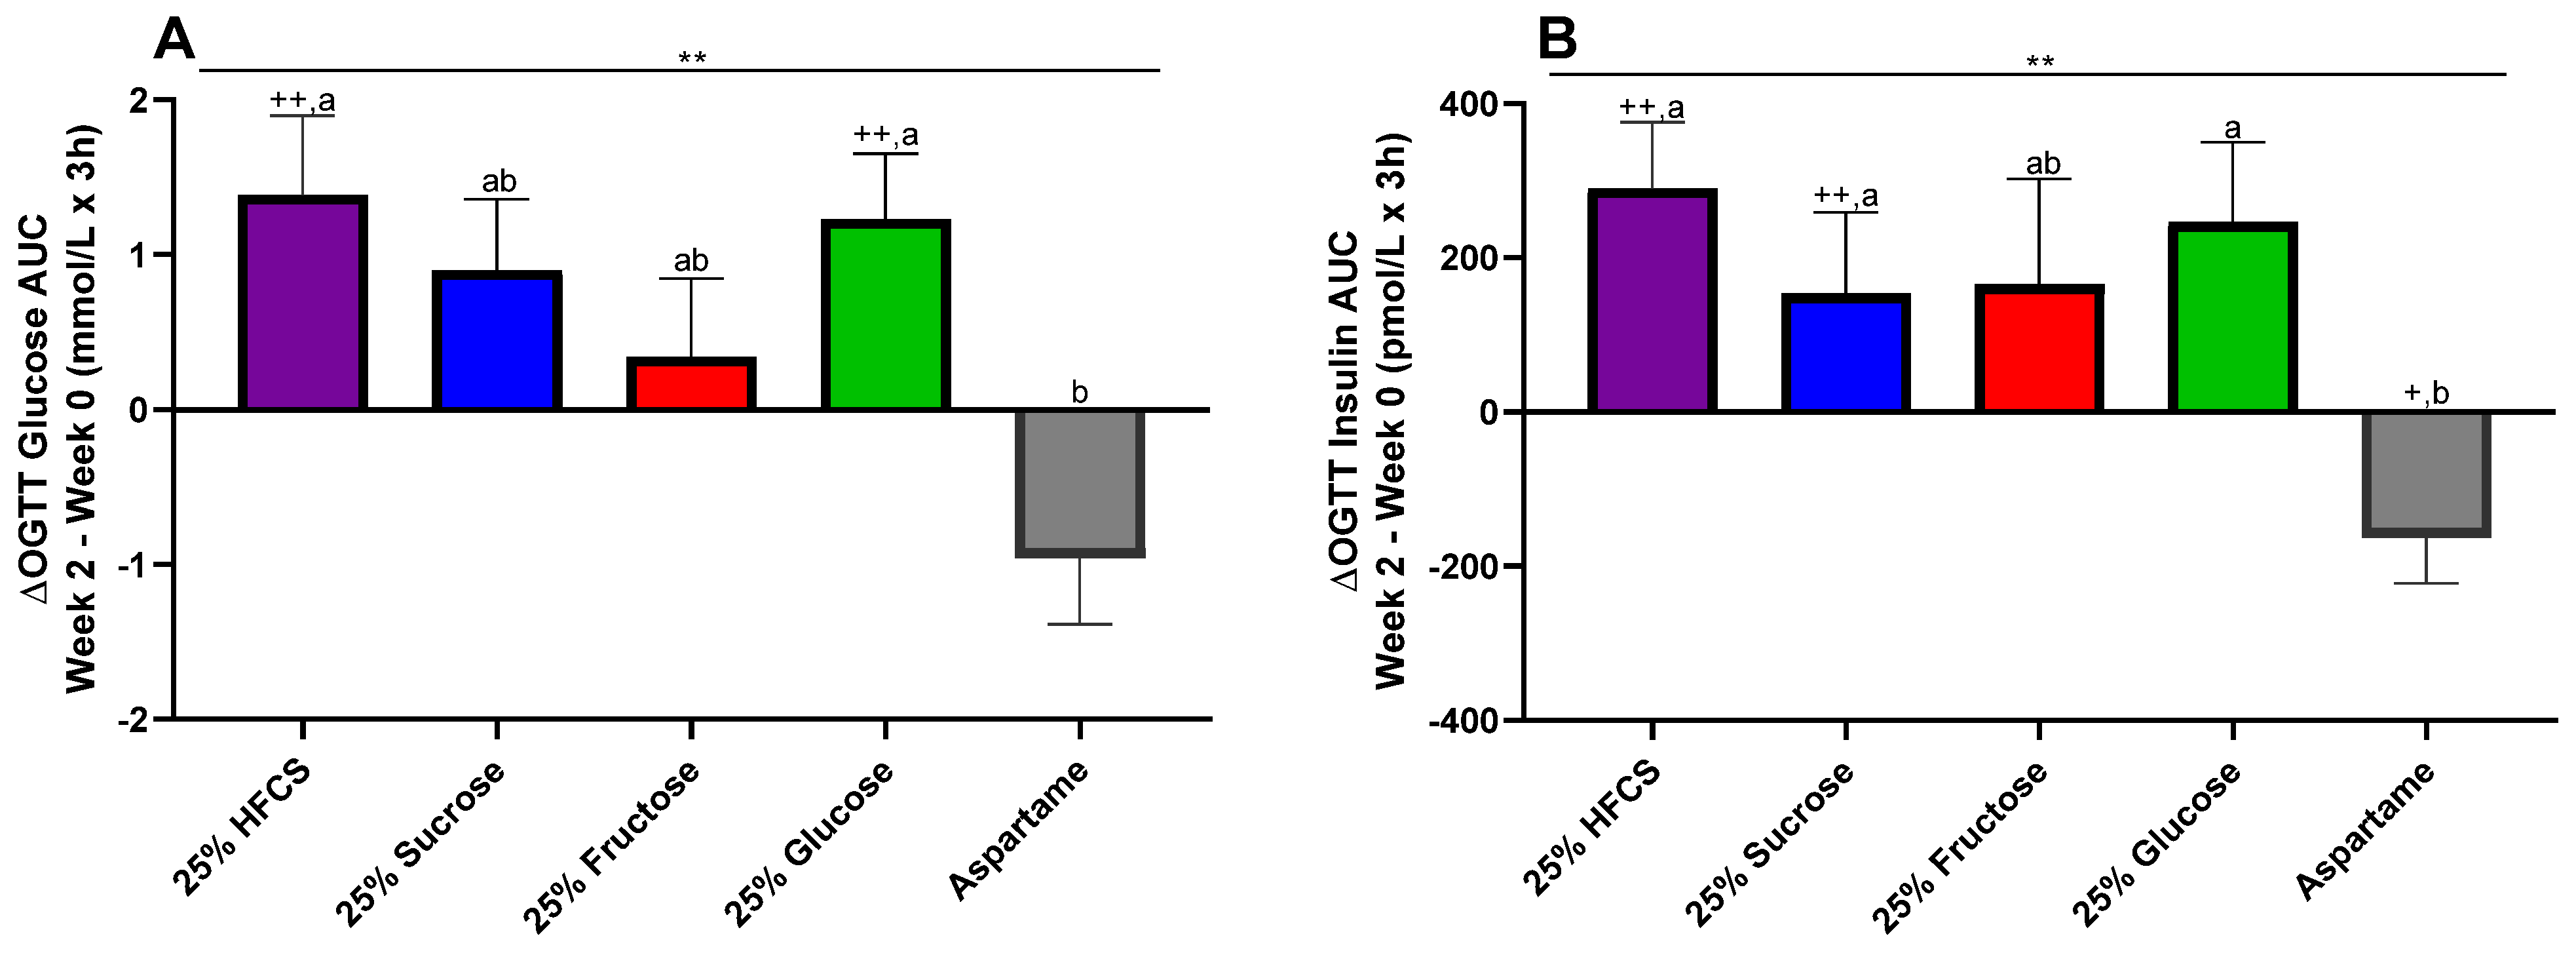
3.6. OGTT Glucose and Insulin 3 h AUC
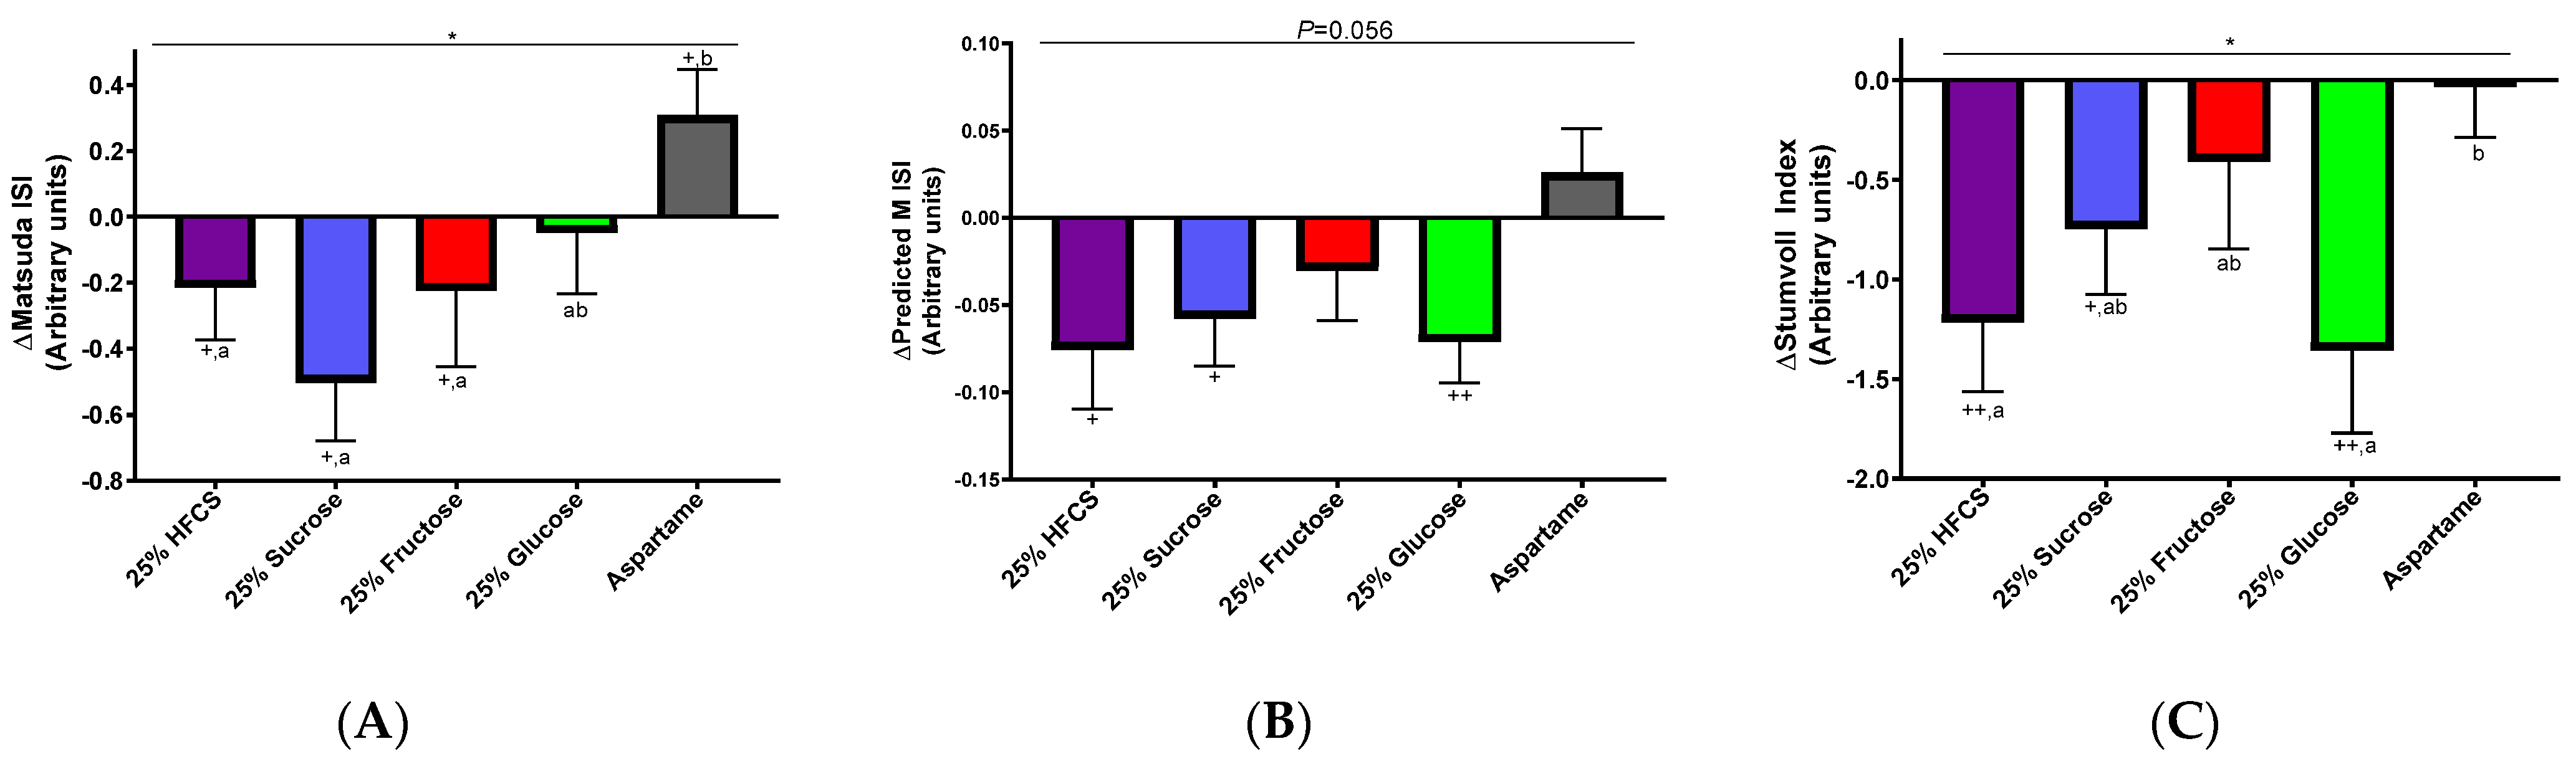
3.7. Dynamic OGTT Indices
3.8. The Contributions of Fructose and Glucose
4. Discussion
4.1. Static Indices and Surrogate Hepatic IRI
4.2. OGTT Glucose and Insulin AUC
4.3. Dynamic Indices
4.4. Study Strengths and Limitations
5. Conclusions
Supplementary Materials
Author Contributions
Funding
Institutional Review Board Statement
Informed Consent Statement
Data Availability Statement
Acknowledgments
Conflicts of Interest
References
- International Diabetes Federation. IDF Diabetes Atlas, 10th ed. Available online: http://www.diabetesatlas.org (accessed on 15 November 2021).
- Kahn, C.R. Knockout mice challenge our concepts of glucose homeostasis and the pathogenesis of diabetes. Exp. Diabesity Res. 2003, 4, 169–182. [Google Scholar] [CrossRef] [PubMed]
- Lee, S.H.; Park, S.Y.; Choi, C.S. Insulin Resistance: From Mechanisms to Therapeutic Strategies. Diabetes Metab. J. 2021, 46, 15–37. [Google Scholar] [CrossRef] [PubMed]
- Abdul-Ghani, M.A.; Matsuda, M.; Balas, B.; DeFronzo, R.A. Muscle and liver insulin resistance indexes derived from the oral glucose tolerance test. Diabetes Care 2007, 30, 89–94. [Google Scholar] [CrossRef] [PubMed]
- Matsuda, M.; DeFronzo, R.A. Insulin sensitivity indices obtained from oral glucose tolerance testing: Comparison with the euglycemic insulin clamp. Diabetes Care 1999, 22, 1462–1470. [Google Scholar] [CrossRef] [PubMed]
- Tura, A.; Chemello, G.; Szendroedi, J.; Gobl, C.; Faerch, K.; Vrbikova, J.; Pacini, G.; Ferrannini, E.; Roden, M. Prediction of clamp-derived insulin sensitivity from the oral glucose insulin sensitivity index. Diabetologia 2018, 61, 1135–1141. [Google Scholar] [CrossRef] [PubMed]
- Stumvoll, M.; Mitrakou, A.; Pimenta, W.; Jenssen, T.; Yki-Jarvinen, H.; Van Haeften, T.; Renn, W.; Gerich, J. Use of the oral glucose tolerance test to assess insulin release and insulin sensitivity. Diabetes Care 2000, 23, 295–301. [Google Scholar] [CrossRef] [PubMed]
- Gastaldelli, A. Measuring and estimating insulin resistance in clinical and research settings. Obesity 2022, 30, 1549–1563. [Google Scholar] [CrossRef]
- Malik, V.S.; Hu, F.B. The role of sugar-sweetened beverages in the global epidemics of obesity and chronic diseases. Nat. Rev. Endocrinol. 2022, 18, 205–218. [Google Scholar] [CrossRef]
- Ma, J.; Jacques, P.F.; Meigs, J.B.; Fox, C.S.; Rogers, G.T.; Smith, C.E.; Hruby, A.; Saltzman, E.; McKeown, N.M. Sugar-Sweetened Beverage but Not Diet Soda Consumption Is Positively Associated with Progression of Insulin Resistance and Prediabetes. J. Nutr. 2016, 146, 2544–2550. [Google Scholar] [CrossRef]
- Santos, L.P.; Gigante, D.P.; Delpino, F.M.; Maciel, A.P.; Bielemann, R.M. Sugar sweetened beverages intake and risk of obesity and cardiometabolic diseases in longitudinal studies: A systematic review and meta-analysis with 1.5 million individuals. Clin. Nutr. ESPEN 2022, 51, 128–142. [Google Scholar] [CrossRef]
- Lee, J.J.; Khan, T.A.; McGlynn, N.; Malik, V.S.; Hill, J.O.; Leiter, L.A.; Jeppesen, P.B.; Rahelic, D.; Kahleova, H.; Salas-Salvado, J.; et al. Relation of Change or Substitution of Low- and No-Calorie Sweetened Beverages With Cardiometabolic Outcomes: A Systematic Review and Meta-analysis of Prospective Cohort Studies. Diabetes Care 2022, 45, 1917–1930. [Google Scholar] [CrossRef]
- Aeberli, I.; Hochuli, M.; Gerber, P.A.; Sze, L.; Murer, S.B.; Tappy, L.; Spinas, G.A.; Berneis, K. Moderate amounts of fructose consumption impair insulin sensitivity in healthy young men: A randomized controlled trial. Diabetes Care 2013, 36, 150–156. [Google Scholar] [CrossRef] [PubMed]
- Lecoultre, V.; Egli, L.; Carrel, G.; Theytaz, F.; Kreis, R.; Schneiter, P.; Boss, A.; Zwygart, K.; Le, K.A.; Bortolotti, M.; et al. Effects of fructose and glucose overfeeding on hepatic insulin sensitivity and intrahepatic lipids in healthy humans. Obesity 2013, 21, 782–785. [Google Scholar] [CrossRef] [PubMed]
- Schwarz, J.M.; Noworolski, S.M.; Wen, M.J.; Dyachenko, A.; Prior, J.L.; Weinberg, M.E.; Herraiz, L.A.; Tai, V.W.; Bergeron, N.; Bersot, T.P.; et al. Effect of a High-Fructose Weight-Maintaining Diet on Lipogenesis and Liver Fat. J. Clin. Endocrinol. Metab. 2015, 100, 2434–2442. [Google Scholar] [CrossRef] [PubMed]
- Stanhope, K.L.; Schwarz, J.M.; Keim, N.L.; Griffen, S.C.; Bremer, A.A.; Graham, J.L.; Hatcher, B.; Cox, C.L.; Dyachenko, A.; Zhang, W.; et al. Consuming fructose-sweetened, not glucose-sweetened, beverages increases visceral adiposity and lipids and decreases insulin sensitivity in overweight/obese humans. J. Clin. Investig. 2009, 119, 1322–1334. [Google Scholar] [CrossRef] [PubMed]
- Taskinen, M.R.; Soderlund, S.; Bogl, L.H.; Hakkarainen, A.; Matikainen, N.; Pietilainen, K.H.; Rasanen, S.; Lundbom, N.; Bjornson, E.; Eliasson, B.; et al. Adverse effects of fructose on cardiometabolic risk factors and hepatic lipid metabolism in subjects with abdominal obesity. J. Intern. Med. 2017, 282, 187–201. [Google Scholar] [CrossRef] [PubMed]
- Sigala, D.M.; Hieronimus, B.; Medici, V.; Lee, V.; Nunez, M.V.; Bremer, A.A.; Cox, C.L.; Price, C.A.; Benyam, Y.; Abdelhafez, Y.; et al. The Dose-Response Effects of Consuming High Fructose Corn Syrup-Sweetened Beverages on Hepatic Lipid Content and Insulin Sensitivity in Young Adults. Nutrients 2022, 14, 1648. [Google Scholar] [CrossRef]
- Sigala, D.M.; Hieronimus, B.; Medici, V.; Lee, V.; Nunez, M.V.; Bremer, A.A.; Cox, C.L.; Price, C.A.; Benyam, Y.; Chaudhari, A.J.; et al. Consuming Sucrose- or HFCS-sweetened Beverages Increases Hepatic Lipid and Decreases Insulin Sensitivity in Adults. J. Clin. Endocrinol. Metab. 2021, 106, 3248–3264. [Google Scholar] [CrossRef]
- Engel, S.; Tholstrup, T.; Bruun, J.M.; Astrup, A.; Richelsen, B.; Raben, A. Effect of high milk and sugar-sweetened and non-caloric soft drink intake on insulin sensitivity after 6 months in overweight and obese adults: A randomized controlled trial. Eur. J. Clin. Nutr. 2018, 72, 358–366. [Google Scholar] [CrossRef]
- Silbernagel, G.; Machann, J.; Unmuth, S.; Schick, F.; Stefan, N.; Haring, H.U.; Fritsche, A. Effects of 4-week very-high-fructose/glucose diets on insulin sensitivity, visceral fat and intrahepatic lipids: An exploratory trial. Br. J. Nutr. 2011, 106, 79–86. [Google Scholar] [CrossRef]
- Hieronimus, B.; Medici, V.; Bremer, A.A.; Lee, V.; Nunez, M.V.; Sigala, D.M.; Keim, N.L.; Havel, P.J.; Stanhope, K.L. Synergistic effects of fructose and glucose on lipoprotein risk factors for cardiovascular disease in young adults. Metabolism 2020, 112, 154356. [Google Scholar] [CrossRef] [PubMed]
- Sigala, D.M.; Widaman, A.M.; Hieronimus, B.; Nunez, M.V.; Lee, V.; Benyam, Y.; Bremer, A.A.; Medici, V.; Havel, P.J.; Stanhope, K.L.; et al. Effects of Consuming Sugar-Sweetened Beverages for 2 Weeks on 24-h Circulating Leptin Profiles, Ad Libitum Food Intake and Body Weight in Young Adults. Nutrients 2020, 12, 3893. [Google Scholar] [CrossRef] [PubMed]
- Stanhope, K.L.; Bremer, A.A.; Medici, V.; Nakajima, K.; Ito, Y.; Nakano, T.; Chen, G.; Fong, T.H.; Lee, V.; Menorca, R.I.; et al. Consumption of fructose and high fructose corn syrup increase postprandial triglycerides, LDL-cholesterol, and apolipoprotein-B in young men and women. J. Clin. Endocrinol. Metab. 2011, 96, E1596–E1605. [Google Scholar] [CrossRef] [PubMed]
- Stanhope, K.L.; Medici, V.; Bremer, A.A.; Lee, V.; Lam, H.D.; Nunez, M.V.; Chen, G.X.; Keim, N.L.; Havel, P.J. A dose-response study of consuming high-fructose corn syrup-sweetened beverages on lipid/lipoprotein risk factors for cardiovascular disease in young adults. Am. J. Clin. Nutr. 2015, 101, 1144–1154. [Google Scholar] [CrossRef] [PubMed]
- Tryon, M.S.; Stanhope, K.L.; Epel, E.S.; Mason, A.E.; Brown, R.; Medici, V.; Havel, P.J.; Laugero, K.D. Excessive Sugar Consumption May Be a Difficult Habit to Break: A View From the Brain and Body. J. Clin. Endocrinol. Metab. 2015, 100, 2239–2247. [Google Scholar] [CrossRef] [PubMed]
- Mifflin, M.D.; St Jeor, S.T.; Hill, L.A.; Scott, B.J.; Daugherty, S.A.; Koh, Y.O. A new predictive equation for resting energy expenditure in healthy individuals. Am. J. Clin. Nutr. 1990, 51, 241–247. [Google Scholar] [CrossRef] [PubMed]
- Matthews, D.R.; Hosker, J.P.; Rudenski, A.S.; Naylor, B.A.; Treacher, D.F.; Turner, R.C. Homeostasis model assessment: Insulin resistance and beta-cell function from fasting plasma glucose and insulin concentrations in man. Diabetologia 1985, 28, 412–419. [Google Scholar] [CrossRef]
- Katz, A.; Nambi, S.S.; Mather, K.; Baron, A.D.; Follmann, D.A.; Sullivan, G.; Quon, M.J. Quantitative insulin sensitivity check index: A simple, accurate method for assessing insulin sensitivity in humans. J. Clin. Endocrinol. Metab. 2000, 85, 2402–2410. [Google Scholar] [CrossRef]
- Conway, J.M.; Ingwersen, L.A.; Vinyard, B.T.; Moshfegh, A.J. Effectiveness of the US Department of Agriculture 5-step multiple-pass method in assessing food intake in obese and nonobese women. Am. J. Clin. Nutr. 2003, 77, 1171–1178. [Google Scholar] [CrossRef]
- Grundy, S.M.; Cleeman, J.I.; Daniels, S.R.; Donato, K.A.; Eckel, R.H.; Franklin, B.A.; Gordon, D.J.; Krauss, R.M.; Savage, P.J.; Smith, S.C., Jr.; et al. Diagnosis and management of the metabolic syndrome: An American Heart Association/National Heart, Lung, and Blood Institute scientific statement. Curr. Opin. Cardiol. 2006, 21, 1–6. [Google Scholar] [CrossRef]
- Patarrao, R.S.; Lautt, W.W.; Macedo, M.P. Assessment of methods and indexes of insulin sensitivity. Rev. Port. Endocrinol. Diabetes Metab. 2014, 9, 65–73. [Google Scholar] [CrossRef]
- Francey, C.; Cros, J.; Rosset, R.; Creze, C.; Rey, V.; Stefanoni, N.; Schneiter, P.; Tappy, L.; Seyssel, K. The extra-splanchnic fructose escape after ingestion of a fructose-glucose drink: An exploratory study in healthy humans using a dual fructose isotope method. Clin. Nutr. ESPEN 2019, 29, 125–132. [Google Scholar] [CrossRef] [PubMed]
- Softic, S.; Stanhope, K.L.; Boucher, J.; Divanovic, S.; Lanaspa, M.A.; Johnson, R.J.; Kahn, C.R. Fructose and hepatic insulin resistance. Crit. Rev. Clin. Lab. Sci. 2020, 57, 308–322. [Google Scholar] [CrossRef] [PubMed]
- Dube, S.; Errazuriz, I.; Cobelli, C.; Basu, R.; Basu, A. Assessment of insulin action on carbohydrate metabolism: Physiological and non-physiological methods. Diabet. Med. 2013, 30, 664–670. [Google Scholar] [CrossRef] [PubMed]
- Goyal, R.; Nguyen, M.; Jialal, I. Glucose Intolerance. Available online: https://www.ncbi.nlm.nih.gov/pubmed/29763085 (accessed on 1 October 2023).
- Teff, K.L.; Grudziak, J.; Townsend, R.R.; Dunn, T.N.; Grant, R.W.; Adams, S.H.; Keim, N.L.; Cummings, B.P.; Stanhope, K.L.; Havel, P.J. Endocrine and metabolic effects of consuming fructose- and glucose-sweetened beverages with meals in obese men and women: Influence of insulin resistance on plasma triglyceride responses. J. Clin. Endocrinol. Metab. 2009, 94, 1562–1569. [Google Scholar] [CrossRef] [PubMed]
- Tappy, L.; Le, K.A. Metabolic effects of fructose and the worldwide increase in obesity. Physiol. Rev. 2010, 90, 23–46. [Google Scholar] [CrossRef] [PubMed]
- Stanhope, K.L.; Griffen, S.C.; Bremer, A.A.; Vink, R.G.; Schaefer, E.J.; Nakajima, K.; Schwarz, J.M.; Beysen, C.; Berglund, L.; Keim, N.L.; et al. Metabolic responses to prolonged consumption of glucose- and fructose-sweetened beverages are not associated with postprandial or 24-h glucose and insulin excursions. Am. J. Clin. Nutr. 2011, 94, 112–119. [Google Scholar] [CrossRef] [PubMed]
- Zierath, J.R.; Krook, A.; Wallberg-Henriksson, H. Insulin action and insulin resistance in human skeletal muscle. Diabetologia 2000, 43, 821–835. [Google Scholar] [CrossRef]
- Cen, H.H.; Hussein, B.; Botezelli, J.D.; Wang, S.; Zhang, J.A.; Noursadeghi, N.; Jessen, N.; Rodrigues, B.; Timmons, J.A.; Johnson, J.D. Human and mouse muscle transcriptomic analyses identify insulin receptor mRNA downregulation in hyperinsulinemia-associated insulin resistance. FASEB J. 2022, 36, e22088. [Google Scholar] [CrossRef]
- Schwarz, J.M.; Noworolski, S.M.; Erkin-Cakmak, A.; Korn, N.J.; Wen, M.J.; Tai, V.W.; Jones, G.M.; Palii, S.P.; Velasco-Alin, M.; Pan, K.; et al. Effects of Dietary Fructose Restriction on Liver Fat, De Novo Lipogenesis, and Insulin Kinetics in Children With Obesity. Gastroenterology 2017, 153, 743–752. [Google Scholar] [CrossRef]
- Schwimmer, J.B.; Ugalde-Nicalo, P.; Welsh, J.A.; Angeles, J.E.; Cordero, M.; Harlow, K.E.; Alazraki, A.; Durelle, J.; Knight-Scott, J.; Newton, K.P.; et al. Effect of a Low Free Sugar Diet vs Usual Diet on Nonalcoholic Fatty Liver Disease in Adolescent Boys: A Randomized Clinical Trial. JAMA 2019, 321, 256–265. [Google Scholar] [CrossRef] [PubMed]


| Outcome | 25% HFCS | 25% Sucrose | 25% Fructose | 25% Glucose | Aspartame | Effect of | p-Value |
|---|---|---|---|---|---|---|---|
| (n = 28) | (n = 24) | (n = 28) | (n = 28) | (n = 23) | |||
| Body Weight (kg) | |||||||
| Week 0 | 72.9 ± 2.7 | 71.9 ± 2.4 | 75.7 ± 2.4 | 75.5 ± 2.4 | 71.8 ± 2.2 | Beverage 1 | 0.097 |
| Week 2 | 73.7 ± 2.8 | 72.4 ± 2.5 | 75.8 ± 2.4 | 76.1 ± 2.5 | 71.7 ± 2.2 | MSRF 2 | 0.8 |
| Fasting Glucose (mmol) | |||||||
| Week 0 | 5.0 ± 0.1 | 5.2 ± 0.1 | 5.0 ± 0.1 | 5.0 ± 0.1 | 5.1 ± 0.1 | Beverage | 0.0009 |
| Week 2 | 5.0 ± 0.1 | 5.1 ± 0.1 | 5.0 ± 0.1 | 4.8 ± 0.0 | 4.9 ± 0.1 | MSRF | 0.18 |
| Fasting Insulin (pmol) | |||||||
| Week 0 | 91.5 ± 6.1 | 92.5 ± 7.0 | 101.7 ± 11.4 | 96.8 ± 6.5 | 91.3 ± 7.2 | Beverage | 0.43 |
| Week 2 | 100.6 ± 9.1 | 100.1 ± 7.7 | 115.1 ± 15.4 | 99.2 ± 6.7 | 91.2 ± 7.4 | MSRF | 0.016 |
| HOMA-IR (arbitrary units) | |||||||
| Week 0 | 3.0 ± 0.2 | 3.1 ± 0.2 | 3.3 ± 0.4 | 3.1 ± 0.2 | 3.0 ± 0.2 | Beverage | 0.19 |
| Week 2 | 3.3 ± 0.3 | 3.3 ± 0.3 | 3.7 ± 0.5 | 3.1 ± 0.2 | 2.9 ± 0.2 | MSRF | 0.012 |
| Surrogate Hepatic IRI (glucose mmol/L × 0.5 h × insulin pmol × 0.5 h) | |||||||
| Week 0 | 97.7 ± 11.9 | 112.9 ± 34.6 | 130.8 ± 23.8 | 106.9 ± 13.1 | 116.9 ± 15.6 | Beverage | 0.009 |
| Week 2 | 124.7 ± 17.1 | 93.1 ± 12.2 | 169.2 ± 36.8 | 103.4 ± 15.1 | 80.3 ± 14.6 | MSRF | 0.28 |
| OGTT Glucose AUC (mmol/L × 3 h) | |||||||
| Week 0 | 21.1 ± 0.7 | 20.6 ± 0.7 | 20.1 ± 0.6 | 20.6 ± 0.5 | 20.9 ± 0.7 | Beverage | 0.006 |
| Week 2 | 22.5 ± 0.9 | 21.5 ± 0.5 | 20.4 ± 0.8 | 21.9 ± 0.6 | 19.9 ± 0.7 | MSRF | 0.53 |
| OGTT Insulin AUC (pmol/L × 3 h) | |||||||
| Week 0 | 1335 ± 106 | 1394 ± 212 | 1821 ± 370 | 1476 ± 154 | 1392 ± 184 | Beverage | 0.007 |
| Week 2 | 1625 ± 154 | 1548 ± 161 | 1987 ± 392 | 1723 ± 228 | 1229 ± 151 | MSRF | 0.24 |
| Matsuda ISI (arbitrary units) | |||||||
| Week 0 | 3.3 ± 0.2 | 3.6 ± 0.3 | 3.3 ± 0.3 | 3.2 ± 0.2 | 3.6 ± 0.3 | Beverage | 0.01 |
| Week 2 | 3.0 ± 0.3 | 3.1 ± 0.3 | 3.1 ± 0.3 | 3.1 ± 0.3 | 3.9 ± 0.3 | MSRF | 0.041 |
| Predicted M ISI (arbitrary units) | |||||||
| Week 0 | 1.52 ± 0.05 | 1.48 ± 0.06 | 1.46 ± 0.07 | 1.46 ± 0.05 | 1.52 ± 0.06 | Beverage | 0.056 |
| Week 2 | 1.45 ± 0.06 | 1.42 ± 0.06 | 1.43 ± 0.07 | 1.39 ± 0.05 | 1.55 ± 0.05 | MSRF | 0.022 |
| Stumvoll ISI (arbitrary units) | |||||||
| Week 0 | 7.6 ± 0.5 | 7.5 ± 0.6 | 6.5 ± 1.0 | 7.1 ± 0.5 | 7.7 ± 0.5 | Beverage 3 | 0.036 |
| Week 2 | 6.4 ± 0.6 | 6.8 ± 0.6 | 6.1 ± 1.0 | 5.8 ± 0.8 | 7.7 ± 0.5 | MSRF | … |
| Fructose | Glucose | Model 1 | ||||
|---|---|---|---|---|---|---|
| Outcome | Variation (%) 2 | p-Value | Variation (%) | p-Value | Variation (%) | p-Value |
| Fasting glucose | 5 | 0.0034 | 0.075 | 0.25 | 29.7 | <0.0001 |
| Fasting insulin | 2.6 | 0.059 | 0.27 | 0.47 | 10.1 | 0.02 |
| HOMA-IR | 2.7 | 0.024 | 0.11 | 0.59 | 11.7 | 0.0076 |
| Surrogate Hepatic IRI | 6.4 | 0.002 | 0.52 | 0.37 | 19.5 | <0.0001 |
| OGTT glucose AUC | 3.8 | 0.021 | 9.4 | 0.0004 | 12.0 | 0.0065 |
| OGTT insulin AUC | 6.3 | 0.0031 | 7.8 | 0.001 | 13.3 | 0.0029 |
| Matsuda ISI | 8.3 | 0.0007 | 4.8 | 0.0098 | 10.3 | 0.0039 |
| Predicted M ISI | 3.4 | 0.0333 | 6.5 | 0.0033 | 11.2 | 0.012 |
| Stumvoll ISI | 1.1 | 0.24 | 5.8 | 0.0062 | 8.3 | 0.057 |
Disclaimer/Publisher’s Note: The statements, opinions and data contained in all publications are solely those of the individual author(s) and contributor(s) and not of MDPI and/or the editor(s). MDPI and/or the editor(s) disclaim responsibility for any injury to people or property resulting from any ideas, methods, instructions or products referred to in the content. |
© 2024 by the authors. Licensee MDPI, Basel, Switzerland. This article is an open access article distributed under the terms and conditions of the Creative Commons Attribution (CC BY) license (https://creativecommons.org/licenses/by/4.0/).
Share and Cite
Hieronimus, B.; Medici, V.; Lee, V.; Nunez, M.V.; Sigala, D.M.; Bremer, A.A.; Cox, C.L.; Keim, N.L.; Schwarz, J.-M.; Pacini, G.; et al. Effects of Consuming Beverages Sweetened with Fructose, Glucose, High-Fructose Corn Syrup, Sucrose, or Aspartame on OGTT-Derived Indices of Insulin Sensitivity in Young Adults. Nutrients 2024, 16, 151. https://doi.org/10.3390/nu16010151
Hieronimus B, Medici V, Lee V, Nunez MV, Sigala DM, Bremer AA, Cox CL, Keim NL, Schwarz J-M, Pacini G, et al. Effects of Consuming Beverages Sweetened with Fructose, Glucose, High-Fructose Corn Syrup, Sucrose, or Aspartame on OGTT-Derived Indices of Insulin Sensitivity in Young Adults. Nutrients. 2024; 16(1):151. https://doi.org/10.3390/nu16010151
Chicago/Turabian StyleHieronimus, Bettina, Valentina Medici, Vivien Lee, Marinelle V. Nunez, Desiree M. Sigala, Andrew A. Bremer, Chad L. Cox, Nancy L. Keim, Jean-Marc Schwarz, Giovanni Pacini, and et al. 2024. "Effects of Consuming Beverages Sweetened with Fructose, Glucose, High-Fructose Corn Syrup, Sucrose, or Aspartame on OGTT-Derived Indices of Insulin Sensitivity in Young Adults" Nutrients 16, no. 1: 151. https://doi.org/10.3390/nu16010151