
Dietary Milk or Isolated Legume Proteins Modulate Intestinal Microbiota Composition in Rats

Department of Animal Nutrition and Sustainable Production, Estación Experimental del Zaidin (CSIC), Profesor Abareda 1, 18008 Granada, Spain
Nutrients 2024, 16(1), 149; https://doi.org/10.3390/nu16010149
Submission received: 11 December 2023
/
Revised: 22 December 2023
/
Accepted: 28 December 2023
/
Published: 2 January 2024
(This article belongs to the Section Proteins and Amino Acids)
Abstract
:Shifts toward increased proteolytic fermentation, such as, for example, in athlete and high-protein weight loss diets, may alter the relative abundance of microbial species in the gut and generate bioactive, potentially deleterious metabolic products. In the current investigation, intestinal (caecal) microbiota composition was studied in rats fed diets differing only in their constituent proteins: milk (casein (CAS), lactalbumin (LA)) or legume (Cicer arietinum, Lupinus angustifolius) protein isolates (chickpea protein isolate (CPI), lupin protein isolate (LI)). ANOSIM and Discriminant Analysis showed significant (p < 0.05) differences at both family and genus levels in both microbiota composition and functionality as a consequence of feeding the different proteins. Differences were also significant (p < 0.05) for predicted functionality parameters as determined by PICRUSt analysis. LA induced a generally healthier microbiota composition than CAS, and higher amounts of Methanobrevibacter spp. and Methanogenic_PWY were found in the LI group. LEfSe analysis of bacterial composition and functional activities revealed a number of groups/functions able to explain the different effects found with milk and legume protein isolates. In conclusion, the mostly beneficial modulation of intestinal microbiota generally found with legume-based diets is likely to be due, at least in part, to their constituent proteins.
1. Introduction
Dietary protein accounts for up to 30% (70–100 g of protein/day) of the human diet and has a wide range of nutritional and biological functions. However, excess protein, together with peptides and free amino acids (AAs) that escape absorption of the small intestine, enter the large intestine and is fermented by the resident microbiota. Protein has received increasing attention among the various food nutrients also because the distal colon is the primary site of protein fermentation where many toxic substances, such as hydrogen sulfide, ammonia, and a series of phenolic and indolic compounds detrimental to health and implicated in colon cancer and bowel disease, are produced [1].
Shifts toward increased proteolytic fermentation (such as, for example, in athlete and high-protein weight loss diets, where protein intake may be two to five times greater than the daily dietary recommendations) may alter the relative abundance of microbial species in the gut and generate bioactive, potentially deleterious metabolic products. These metabolic products have been shown to increase inflammatory response, tissue permeability, and colitis severity in the gut. They are also implicated in the development of metabolic diseases, including colorectal cancer, obesity, diabetes, and nonalcoholic fatty liver disease [2]. To offset the negative net muscle protein balance in athletes under weight loss diets, strategies, such as increasing protein intake, are recommended. There is some evidence to support the role of whey, as a high-quality protein, in the promotion of high-quality weight loss during caloric restriction, and alpha-lactalbumin is one of the main components of whey protein [3]. However, the information on the effects that modifications of the dietary protein quality and/or quantity may have on the digestive physiology, and in particular on the intestinal microbiota composition/functionality, is still very limited. On the other hand, isolated legume storage proteins have been previously reported to be readily digested within the small intestine and individual AAs digestibility of these proteins was high. However, previous work showed that under normal feeding conditions AAs from CPI and LI are absorbed at slower rates than those from animal proteins, which might explain the lower nutritional utilization of legume storage proteins as compared with LA or CAS [4]. Lower rates of AAs portal absorption and arterial plasma in rats fed legume proteins may also contribute to a lower risk of processes such as, for example, heart failure, which has been linked to high plasma BCAAs (branch chain amino acids: valine, isoleucine, leucine) levels [5].
Future research challenges in this area of research are to identify bacteria affected by diet, food components, foods or dietary patterns that have an impact on the microbiota, and microbes that are key players in mediating the health effects of different dietary components. That information can be used to design successful dietary strategies to benefit health. In this context, many reasons advise a more detailed study of the effects of the type or amount of dietary protein on intestinal microbiota composition or metabolism. Thus, being proteins one of the major components of any daily healthy diet, and apart from nutritional considerations (what AAs and at what rate they are absorbed, etc.), as already mentioned, many of the compounds released after bacterial protein degradation are known to be toxic and detrimental to gut health [6]. In addition, metabolic cross-feeding is a central feature in anaerobic microbial communities [7], so the products of the fermentation from a given group may influence the growth/metabolism of other groups. A review focusing on current insights into changes associated with dietary protein-induced gut microbial populations and their potential roles in the metabolism, health, and disease of animals has been recently published [8].
It is currently well established that the composition of the microbial communities inhabiting the human intestine has important consequences for health, and their composition and activities are known to be strongly influenced by the diet, which has long been considered the major external modulator of the adult human intestinal microbiota in parallel with medication. In particular, microbial composition and functional activities are known to be strongly influenced by the carbohydrate content of the diet, mainly because the human digestive system cannot digest most of the plant-derived complex carbohydrates present in a normal diet, while our intestinal bacteria encode an arsenal of catabolic enzymes to degrade and ferment a wide range of polysaccharides and glycans of dietary or host origin that enter the colon. However, the colonic fermentation of protein has received much less attention than that of carbohydrates [9].
Accordingly, energy- and protein-equalized semisynthetic diets, which differed only in the composition of their constituent proteins (LA, CAS, CPI, LI), were produced to study the effects on caecal microbiota composition in rats. Diets were not supplemented with lacking essential AAs so that only the effect of the proteins themselves was measured.
2. Materials and Methods
2.1. Protein Purification
Chickpea (Cicer arietinum, kabuli var.) and lupin (Lupinus angustifolius, sweet var.) seeds were purchased locally. Protein isolates were obtained from defatted chickpea and lupin seed meals by acid precipitation at the isoelectric point, as previously described [10].
2.2. Animals and Diets
LA, casein and chemical reagents used were from Sigma Chemical Co. (Alcobendas, Madrid, Spain). The diets used were based on animal proteins (LA, CAS) or legume protein isolates (CPI and LI) and contained the same amounts of digestible energy (15.5 kJ/g) and protein (150 g/Kg). Proteins were added at the expense of maize starch so that all of them had the same composition, except for differences due to amounts of AAs in each particular protein. The diets contained (g/Kg) protein (150), maize starch (450), potato starch (150), sunflower oil (50), glucose (150), and a vitamins and minerals mix (100) to meet requirements [10]. AAs composition of the proteins used is shown in Table 1. Male weaned Wistar rats (n = 6 per treatment), matched by weight (130 ± 1.5 g), were housed individually in metabolism cages under controlled conditions of temperature (25 °C), moisture (50%) and lighting (12 h cycles). Animals were fed a control AINS93 diet and then their respective experimental diets for 5 d before the day of sampling. Water was freely available at all times. Rats were killed under pentobarbital sodium (40 mg·Kg−1 BW) anesthesia exactly 3 h after ingesting 4 g of feed, the abdomen opened, and the caecal contents were extracted and stored for less than 7 d at −20 °C until freeze-dried (Genesys SQ25EL lyophiliser, VirTisCo, New York, NY, USA). Lyophilization has been shown to improve both DNA yield and the quality of the information arising from the PCR–RFLP method of analysis [11].
The experimental protocol was reviewed and approved by the Institutional Animal Care and Use Committee of the Spanish Council for Scientific Research (CSIC, Spain), and the animals cared for in accordance with the Spanish Ministry of Agriculture guidelines (RD 53/2013).
2.3. RT-qPCR Microbiota Composition Analysis
Total DNA was isolated from freeze-dried caecal samples (40 mg) using the FavorPrep Stool DNA Isolation Mini Kit (Favorgen-Europe, Vienna, Austria) and following the manufacturer’s instructions. Eluted DNA was treated with Rnase and the DNA concentration was assessed spectrophotometrically by using a NanoDrop ND-100 Spectrophotometer (NanoDrop Technologies, Wilmington, DE, USA). Purified DNA samples were stored at −20 °C until use. Eluted DNA was treated with Rnase and the DNA concentration was assessed by using a NanoDrop ND-100 spectrophotometer (NanoDrop Technologies, Wilmington, DE, USA). Bacterial log10 number of copies was determined by using quantitative polymerase chain reaction (q-PCR) (iQ5 Cycler, Bio-Rad Laboratories, Alcobendas, Spain). The 16S rRNA gene-targeted primers and polymerase chain reaction (PCR) conditions used in this study were as described previously [14]. The different microbial groups quantified included Lactobacillus spp., Bifidobacterium spp., Blautia coccoides/Eubacterium rectale group, Clostridium leptum/Ruminococcus spp., Enterobacteriaceae, Escherichia/Shigella, Bacteroides/Prevotella spp., and total bacteria. Samples for q-PCR analysis were run in duplicate.
2.4. High-Throughput Analysis of Microbial Community
The bacterial diversity of the samples was determined using Illumina technology (MiSeq, Illumina Centre, Cambridgeshire, UK). Total DNA was isolated from freeze-dried caecal samples (40 mg) from five rats per group (n = 20) as described above. Libraries preparation was performed by amplification of the V4–V5 region of the 16S rRNA gene by using a Px2 Thermal Cycler (Thermo Electron Corporation, Waltham, MA, USA). The first amplification was performed by using primers Mi_U515 (50-GTGCCAGCMGCCGCGGTAA-30) and Mi_E786 (50–GGACTACHVGGGTWTCTAAT-30) including partially Illumina adapters Mi_E786 (50–GGACTACHVGGGTWTCTAAT-30), and PCR conditions were initial denaturalization at 98 °C 30 s, 25 cycles with denaturalization at 98 °C 10 s, annealing at 52 °C 20 s and extension at 72 °C 10 s, and a final extension at 72 °C 5 min. The second amplification included barcodes and the rest of the Illumina adapters, and PCR conditions were initial denaturalization at 98 °C 30 s, 25 cycles with denaturalization at 98 °C 10 s, annealing at 52 °C 20 s and extension at 72 °C 10 s, and a final extension at 72 °C 5 min. All amplifications were performed in duplicate. Total DNA was isolated from freeze-dried feces (20 mg) as described above. Aliquots of 10 μL of each DNA were sent to the IPBLN (CSIC, Granada, Spain) for sequencing.
2.5. Analyses of Predicted Microbial Functions
Functional gene compositions of bacterial communities were predicted using the PICRUSt (phylogenetic investigation of communities by reconstruction of unobserved states) method [15]. To generate BIOM-formatted files for PICRUSt input data, taxonomic classification was re-processed in QIIME2 version 2021.11 with the GreenGenes V13.8 database [16]. PICRUSt functionality was run using the QIIME2-produced biom files via the QIIME2. Functional prediction was made using the KEGG orthologs database [17] and summarized at the pathway hierarchy level 3.
2.6. Statistical Analysis
Results other than sequencing analysis were subjected to one-way ANOVA and Tukey’s multiple comparison test for differences between means [18]. Significance was established at p < 0.05. Results from high throughput sequencing analyses were obtained by using Quantitative Insights in Microbial Ecology (QIIME2 2021.11). Quality filtering was performed by using default parameters in QIIME2. A sub-OTU (suboperational taxonomic units) table in biom format was created using Deblur, and alignment and taxonomic assignation was performed by fragment insertion script and against the Greengenes database. Sub-OTUs obtained by Illumina analysis of caecal samples from 24 rats (six per treatment) were grouped by bacterial species (obtained from the bar plots produced by QIIME2). Multivariate statistical techniques explored the similarities in rat caecal microbiota and identified species accounting for differences observed in these bacterial communities. Bray–Curtis measures of similarity were calculated to examine similarities between gut microbial communities of rats from the high throughput and qPCR data matrices, following standardization, and square-root transformation. The Bray–Curtis similarity coefficient is a reliable measure for biological data on community structure and is not affected by joint absences, which are commonly found in microbial data. Analysis of similarity (ANOSIM) was performed to test whether gut microbial communities were significantly different between treatments. Analysis of similarity percentages (SIMPER) was done to determine the overall average similarity in caecal microbial community compositions. Discriminant analysis (DA) was used to check if the groups to which observations belong were distinct. Statistical tests for differentially abundant families, genera, and functional categories were performed using the linear discriminant analysis effect size (LEfSe) method [19] with an alpha value of 0.05 for the Kruskal–Wallis test among classes, and the threshold for the log10LDA score was set at 2.0. Microbial functions were predicted using Phylogenetic Investigation of Communities by Reconstruction of Unobserved States (PICRUSt), based on high-quality sequences [15]. OTUs were normalized by copy number, and metagenomic prediction was performed based on Kyoto Encyclopedia of Genes and Genomes (KEGG) [17] by using the QIIME2 version 2021.11 package. The Simpson (D), Shannon index (H), Evenness (E) and Chao1 (Chao1) indexes of the bacterial community were respectively calculated as:
where s is the total number of species in the community and pi is the proportion of community represented by OTU i
where pi is the abundance of each species.
where S is the total number of species.
where F1 and F2 are the count of singletons and doubletons, respectively, and Sobs is the number of observed species.
D = 1/(Σ s i = 1pi2)
H = −Σ (pi ln pi)
E = H/lnS
Chao1 = Sobs + [F1(F1 − 1)/2(F2 + 1)]
3. Results
3.1. RT-qPCR Microbiota Composition Analysis
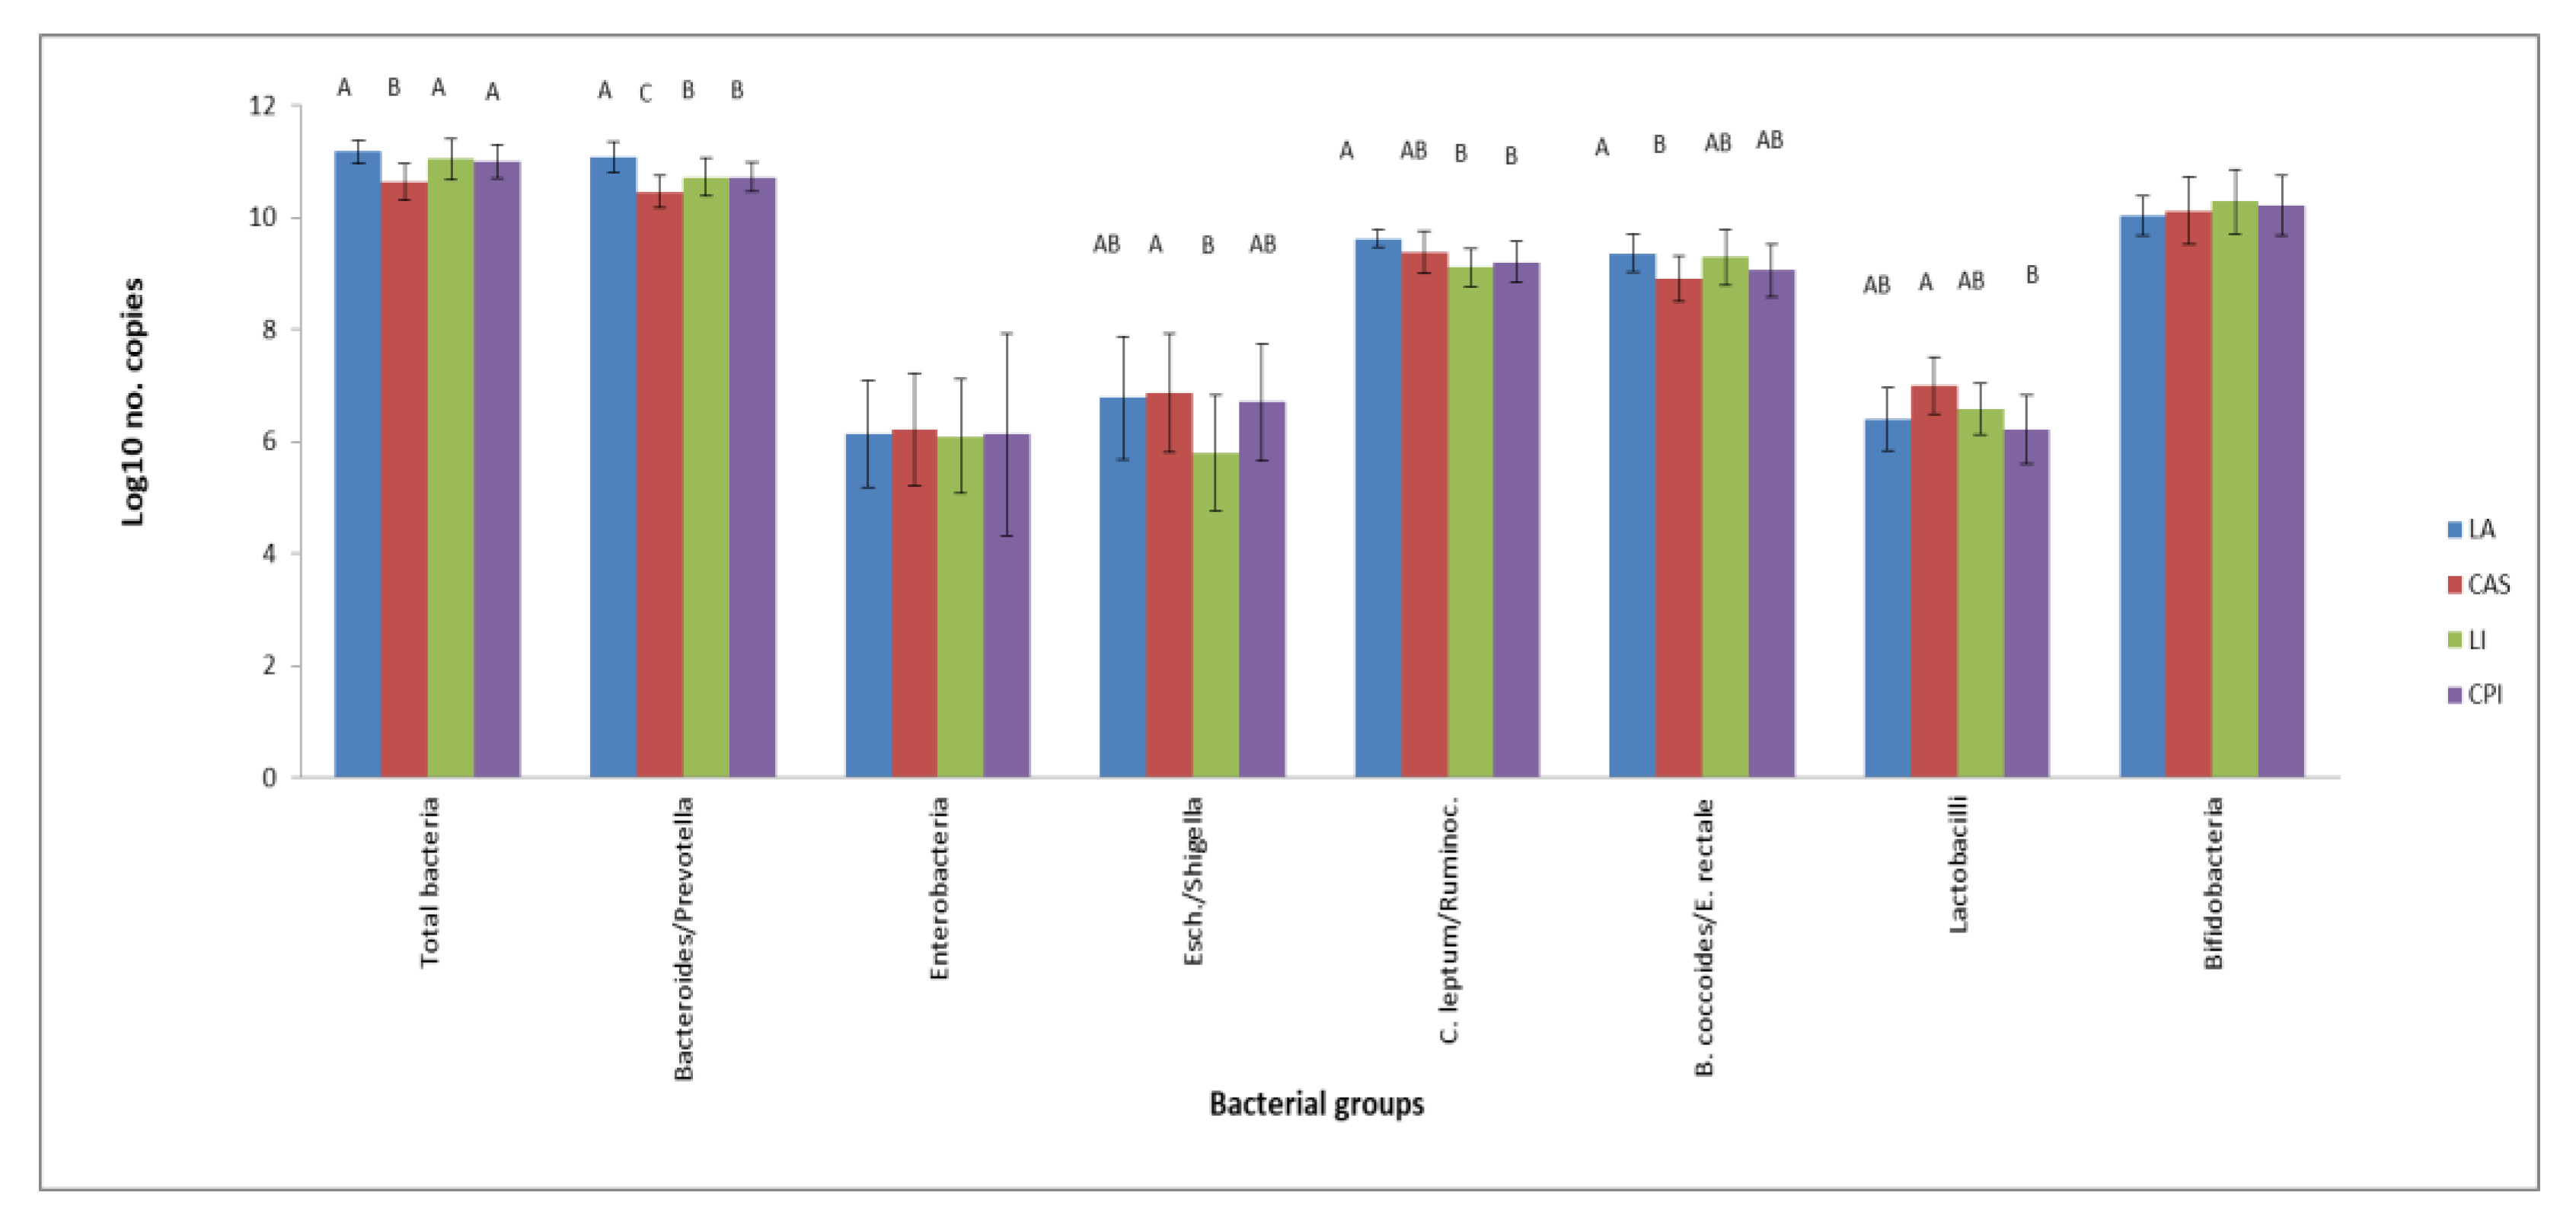
Results on caecal bacteria numbers after consumption of the experimental diets were collected in Figure 1. The CAS diet induced lower total bacteria and Bacteroides/Prevotella compared to the other groups and lower B. coccoides/E. rectale numbers with respect to the LA group. CPI and LI diets gave place to lower Bacteroides/Prevotella and C. leptum/Ruminococcus with respect to LA, but values for Bacteroides/Prevotella were higher than CAS. Rats fed the LI diet had lower Escherichia/Shigella numbers compared to the CAS diet.
3.2. High-Throughput Analysis of Microbial Community
A total of 3,149,558 reads were obtained from the 24 caecal samples processed through Illumina MiSeq technology. After Deblur, 2,548,825 good-quality sequences belonging to 1482 OTUs and 108 bacterial species were retained for subsequent analyses. A similarity percentages breakdown (SIMPER analysis) (Table S1) was used to select those bacterial groups with higher contribution to dissimilarity. Thus, 22 families (Bacteroidaceae, Spirochaetaceae, Lachnospiraceae, Bacteroidales families, Ruminococcaceae, [Paraprevotellaceae], Bifidobacteriaceae, Prevotellaceae, Clostridiales families, Helicobacteraceae, Bacteroidales families, Erysipelotrichaceae, Clostridiaceae, Methanobacteriaceae, Lactobacillaceae, Veillonellaceae, Alphaproteobacteria families, Chloroflexi families, Alcaligenaceae, Cyanobacteria families, Porphyromonadaceae and Enterobacteriaceae), and 27 genera (Treponema, Bacteroidales genera, Ruminococcus, Lachnospiraceae genera, Bacteroides, [Prevotella], Bifidobacterium, Ruminococcaceae genera, Roseburia, Helicobacter, Allobaculum, Clostridiales genera, Bacteroidales genera, Phascolarctobacterium, Lactobacillus, Prevotella, Chloroflexi genera, Alphaproteobacteria genera, Sutterella, Helicobacteraceae genera, Blautia, Coprococcus, Oscillospira, Methanobrevibacter, Parabacteroides and Cyanobacteria genera) were responsible for >95% of the dissimilarity.
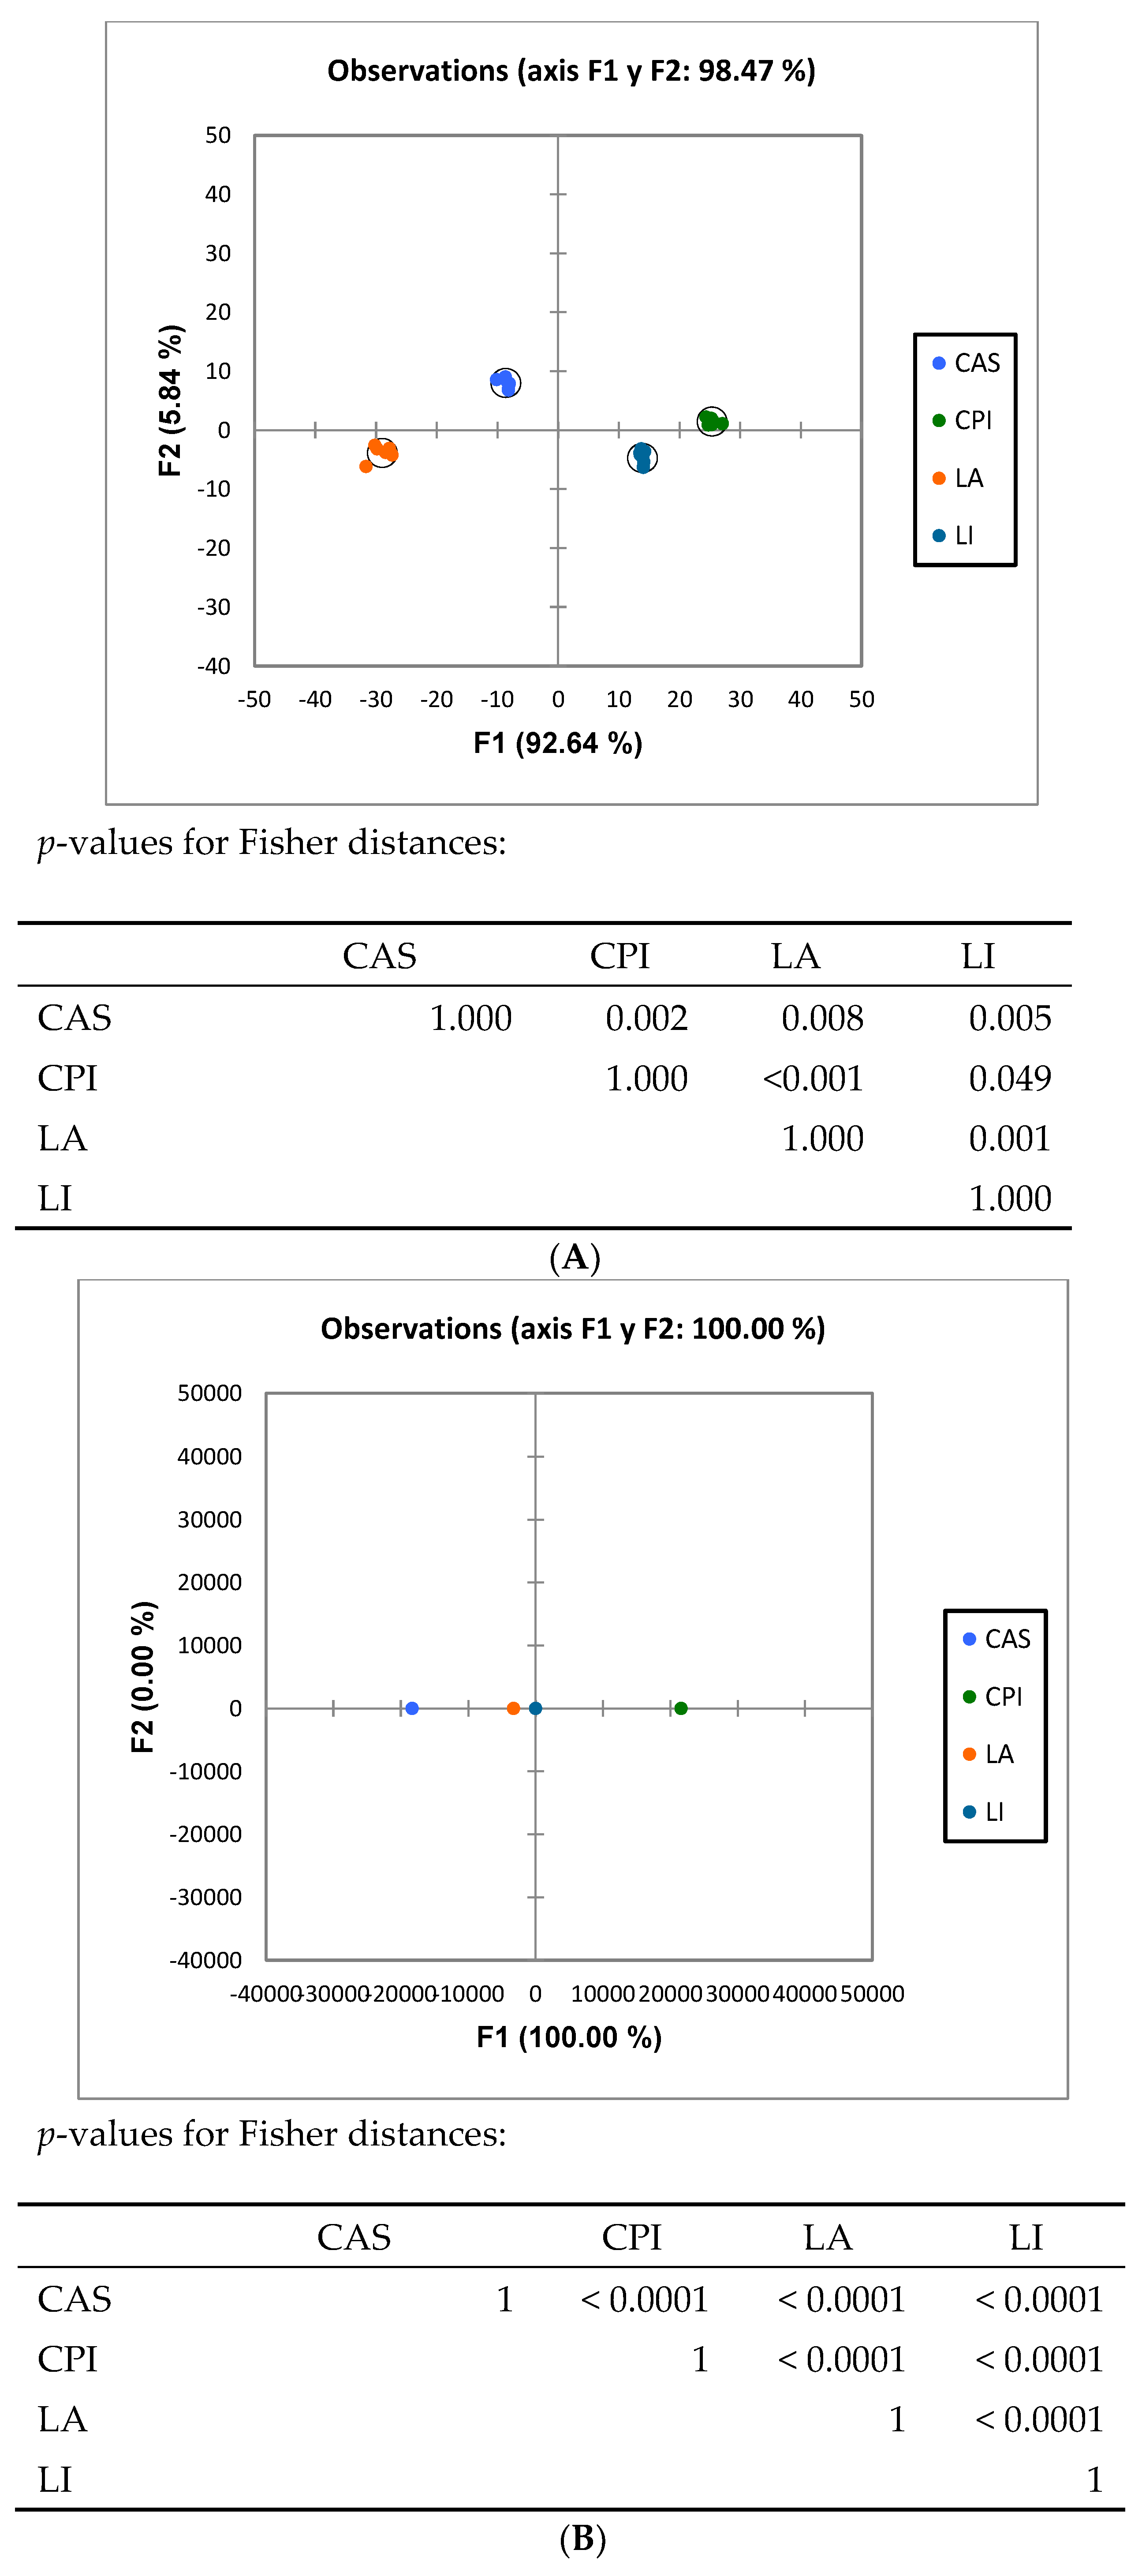
ANOSIM analysis (Table 2) analysis of the high throughput results showed that the caecal microbiota composition in rats fed the different diets was different (p < 0.01) in all cases. Discriminant analysis (Figure 2) of the pyrosequencing results showed that the rats fed the diets differing in the type of protein were grouped differently at both the family and genus levels.
Bacteroidetes, Firmicutes, Proteobacteria, Spirochaetes and Actinobacteria were the most abundant phyla in all treatments (Table 3), although Chloroflexi, Cyanobacteria and Tenericutes were also found at the different taxonomic levels. Interestingly, Euryarchaeota belonging to the Archaea domain was particularly abundant in the LI group. Significant differences (p < 0.05) were found for all phyla except for Actinobacteria. At the family level (Table 3), Ruminococcaceae (20.50%), families from Bacteroidales (19.24%), Spirochaetaceae (11.33%), Bacteroidaceae (9.94%) and Lachnospiraceae (9.65%) were generally the most abundant. In particular, Bacteroidaceae and Clostridiaceae were the most abundant (p < 0.05) in rats fed the LA diet. Rats fed the CAS diet had higher (p < 0.05) Ruminococcaceae, Veillonellaceae and Helicobacteraceae reads, and Bifidobacteriaceae tended to be higher. Feeding the CPI diet induced higher Prevotellaceae than the other groups, while families from Clostridiales and Spirochaetaceae were higher in CPI and LI diets with respect to LA and CAS diets. LI diet gave place to higher (p < 0.05) Methanobacteriaceae and Lachnospiraceae compared to the other groups.
At the genera level (Table 3), Bacteroides, Blautia (except for CPI) and Roseburia were higher (p < 0.05) in LA than in the other groups, while Treponema was lower (p < 0.05). Rats fed the CAS diet had higher (p < 0.05) Ruminococcus, Phascolarctobacterium and Helicobacter reads, and Bifidobacterium tended to be higher. Feeding the CPI and LI diets induced higher (p < 0.05) Prevotella and genera from the Clostridiales than the LA and CAS groups. The LI diet gave place to higher (p < 0.05) Methanobrevibacter values compared to the other groups. The species identified within these genera were Bacteroides uniformis, Balutia producta, Roseburia faecis, Ruminococcus gnavus, R. bromii and R. flavefaciens, Prevotella copri, Bifidobacterium animalis and B. pseudolongum.
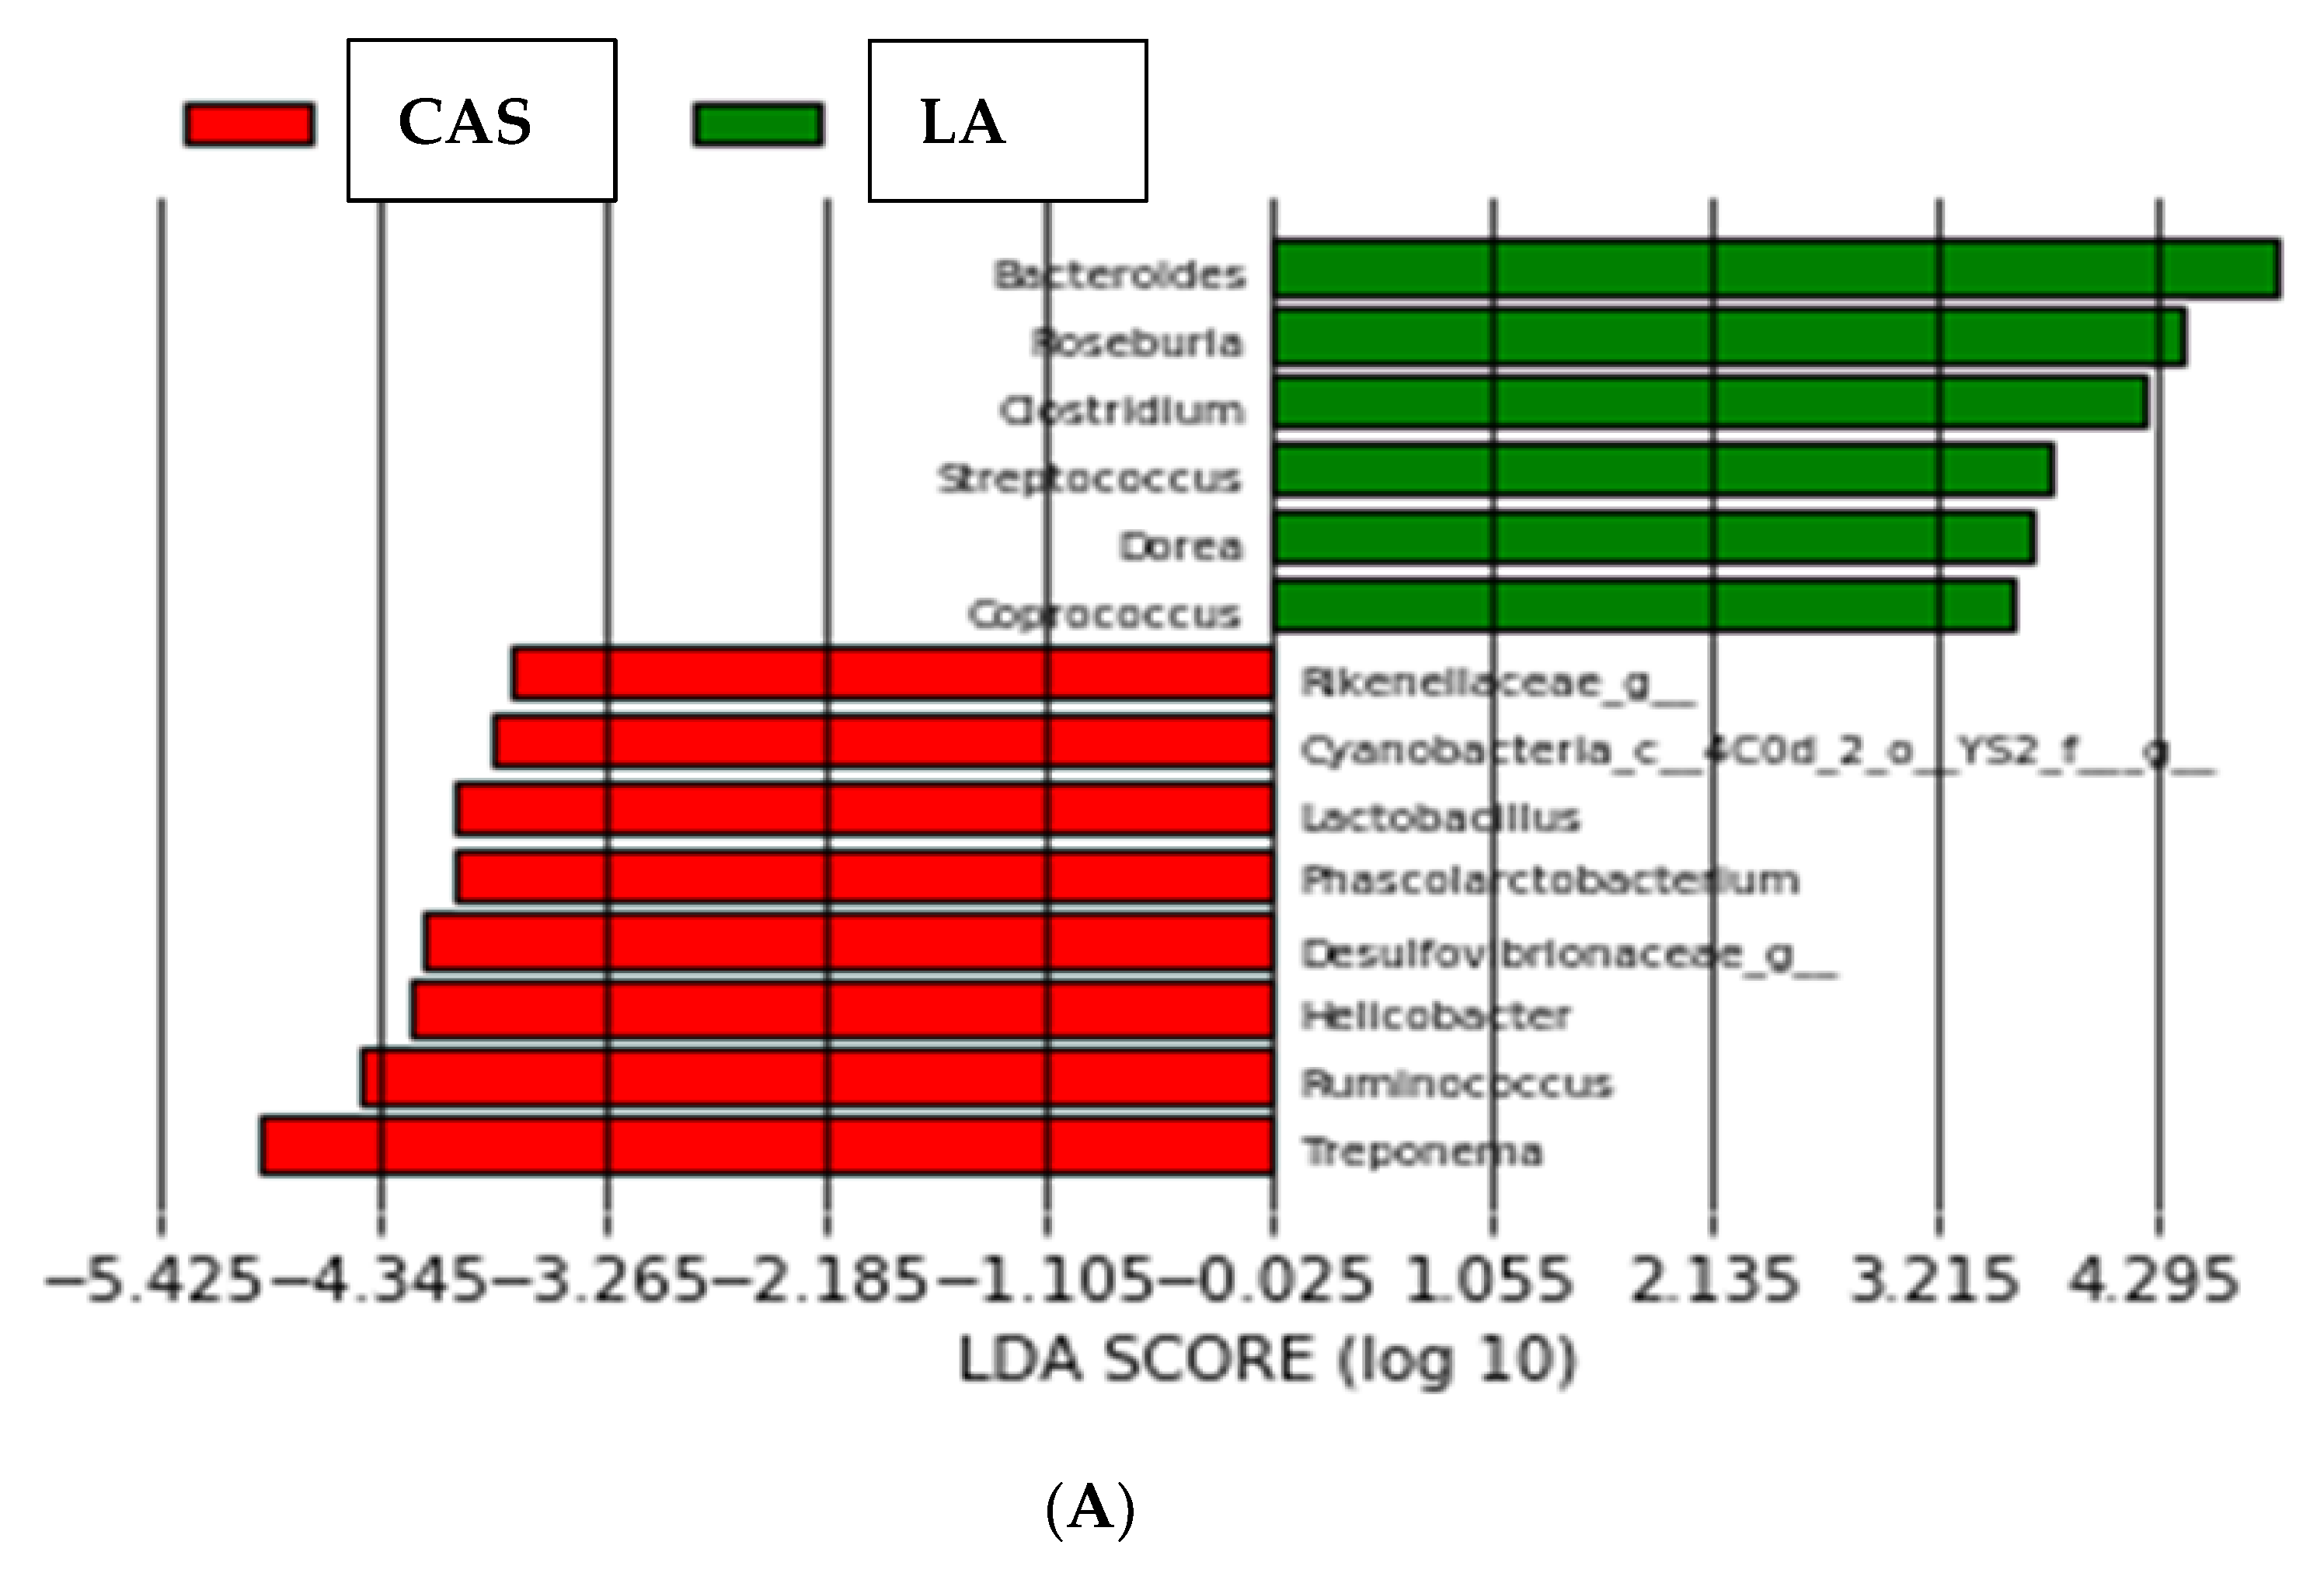
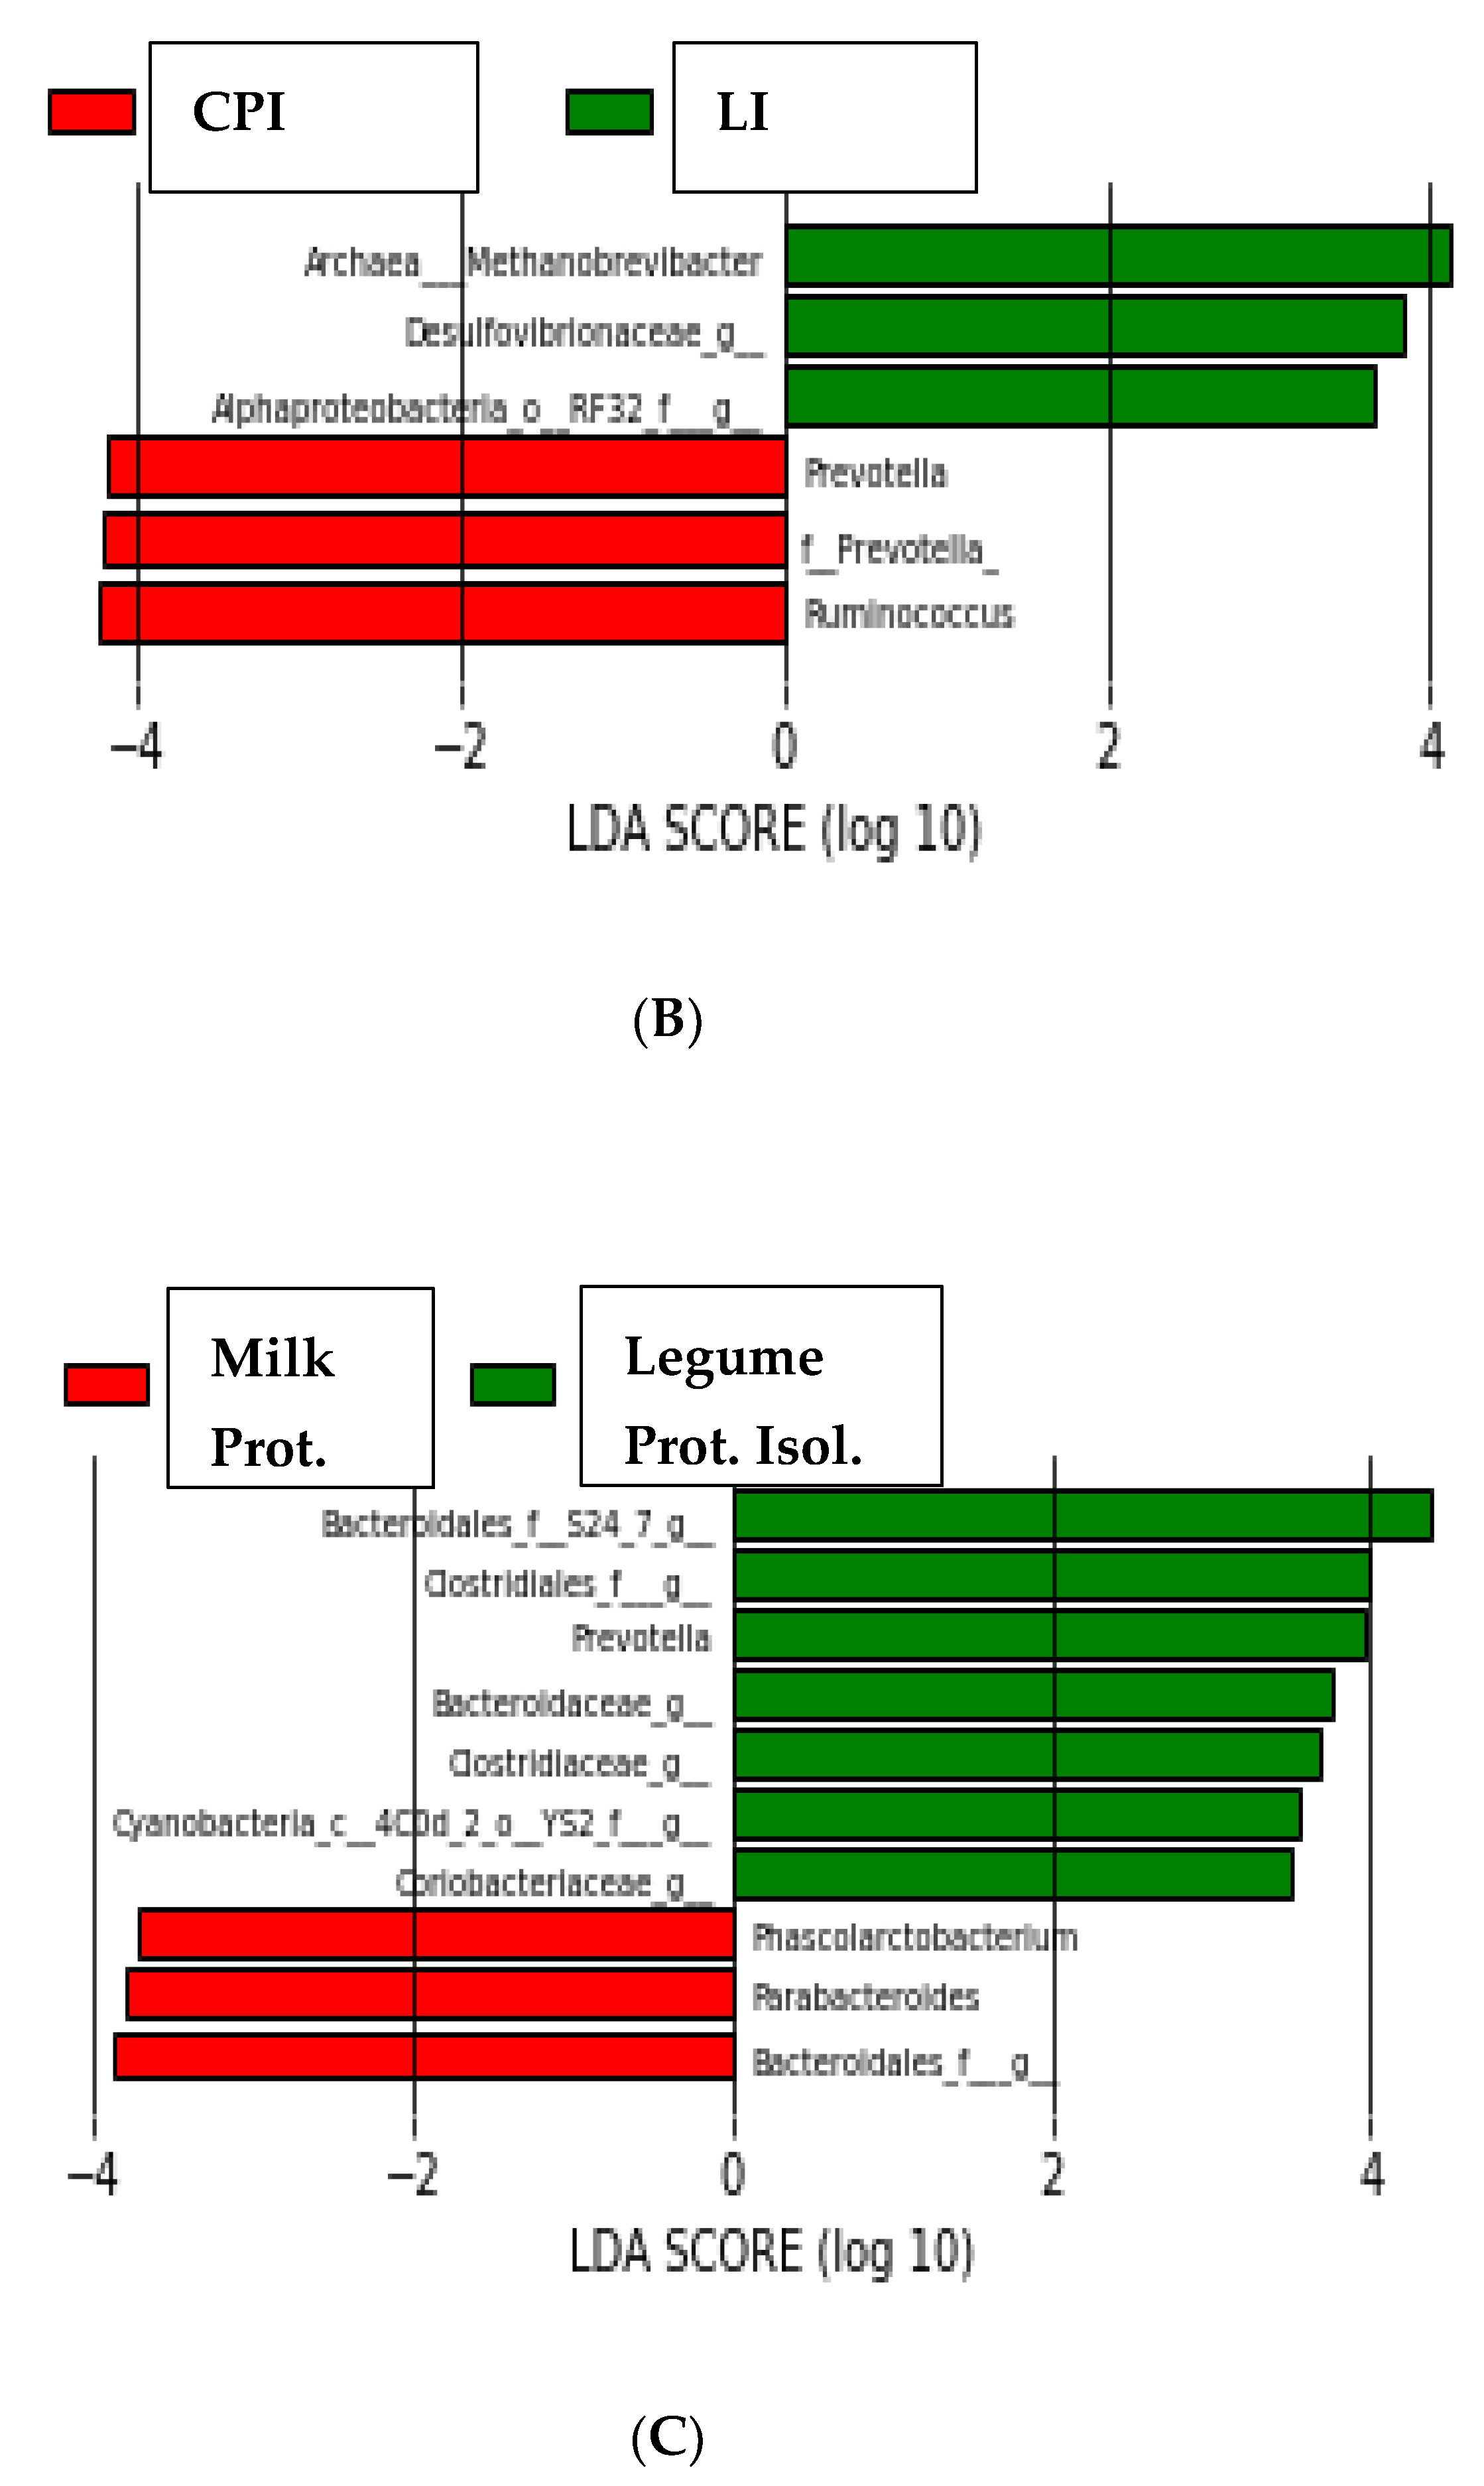
LEfSe determines the features (organisms, clades, operational taxonomic units, genes, or functions) most likely to explain differences between classes by coupling standard tests for statistical significance with additional tests encoding biological consistency and effect relevance [20]. As shown in Figure 3A, the organisms most likely to explain differences between LA and CAS were Bacteroides spp., Roseburia spp., Clostridium spp., Streptococcus spp., Dorea spp. and Coprococccus spp. for the LA group; Treponema spp., Ruminococcus spp., Helicobacter spp., genera from Desulfovibrionaceae, Phascolarctobacterium, Lactobacillus spp., genera from Cyanobacteria and genera from Rikenellaceae for the CAS group. The organisms most likely to explain differences between CPI and LI (Figure 3B) were Ruminococcus spp., genera from Prevotella and Prevotella spp. for CPI; Methanobrevibacter spp. (Archaea), genera from Desufovibrionaceae and genera from Alphaproteobacteria for LI. Finally, the organisms most likely to explain differences between animal (milk) and vegetable (legume) proteins (Figure 3C) were genera from the following order:
Bacteroidales, Parabacteroides spp. and Phascolarctobacterium spp. for the animal proteins; genera from the family S24_7, genera from the order Clostridiales, Prevotella spp., genera from Bacteroidaceae, Clostridiaceae, Cyanobacteria and Coriobacteriaceae for the vegetable proteins.
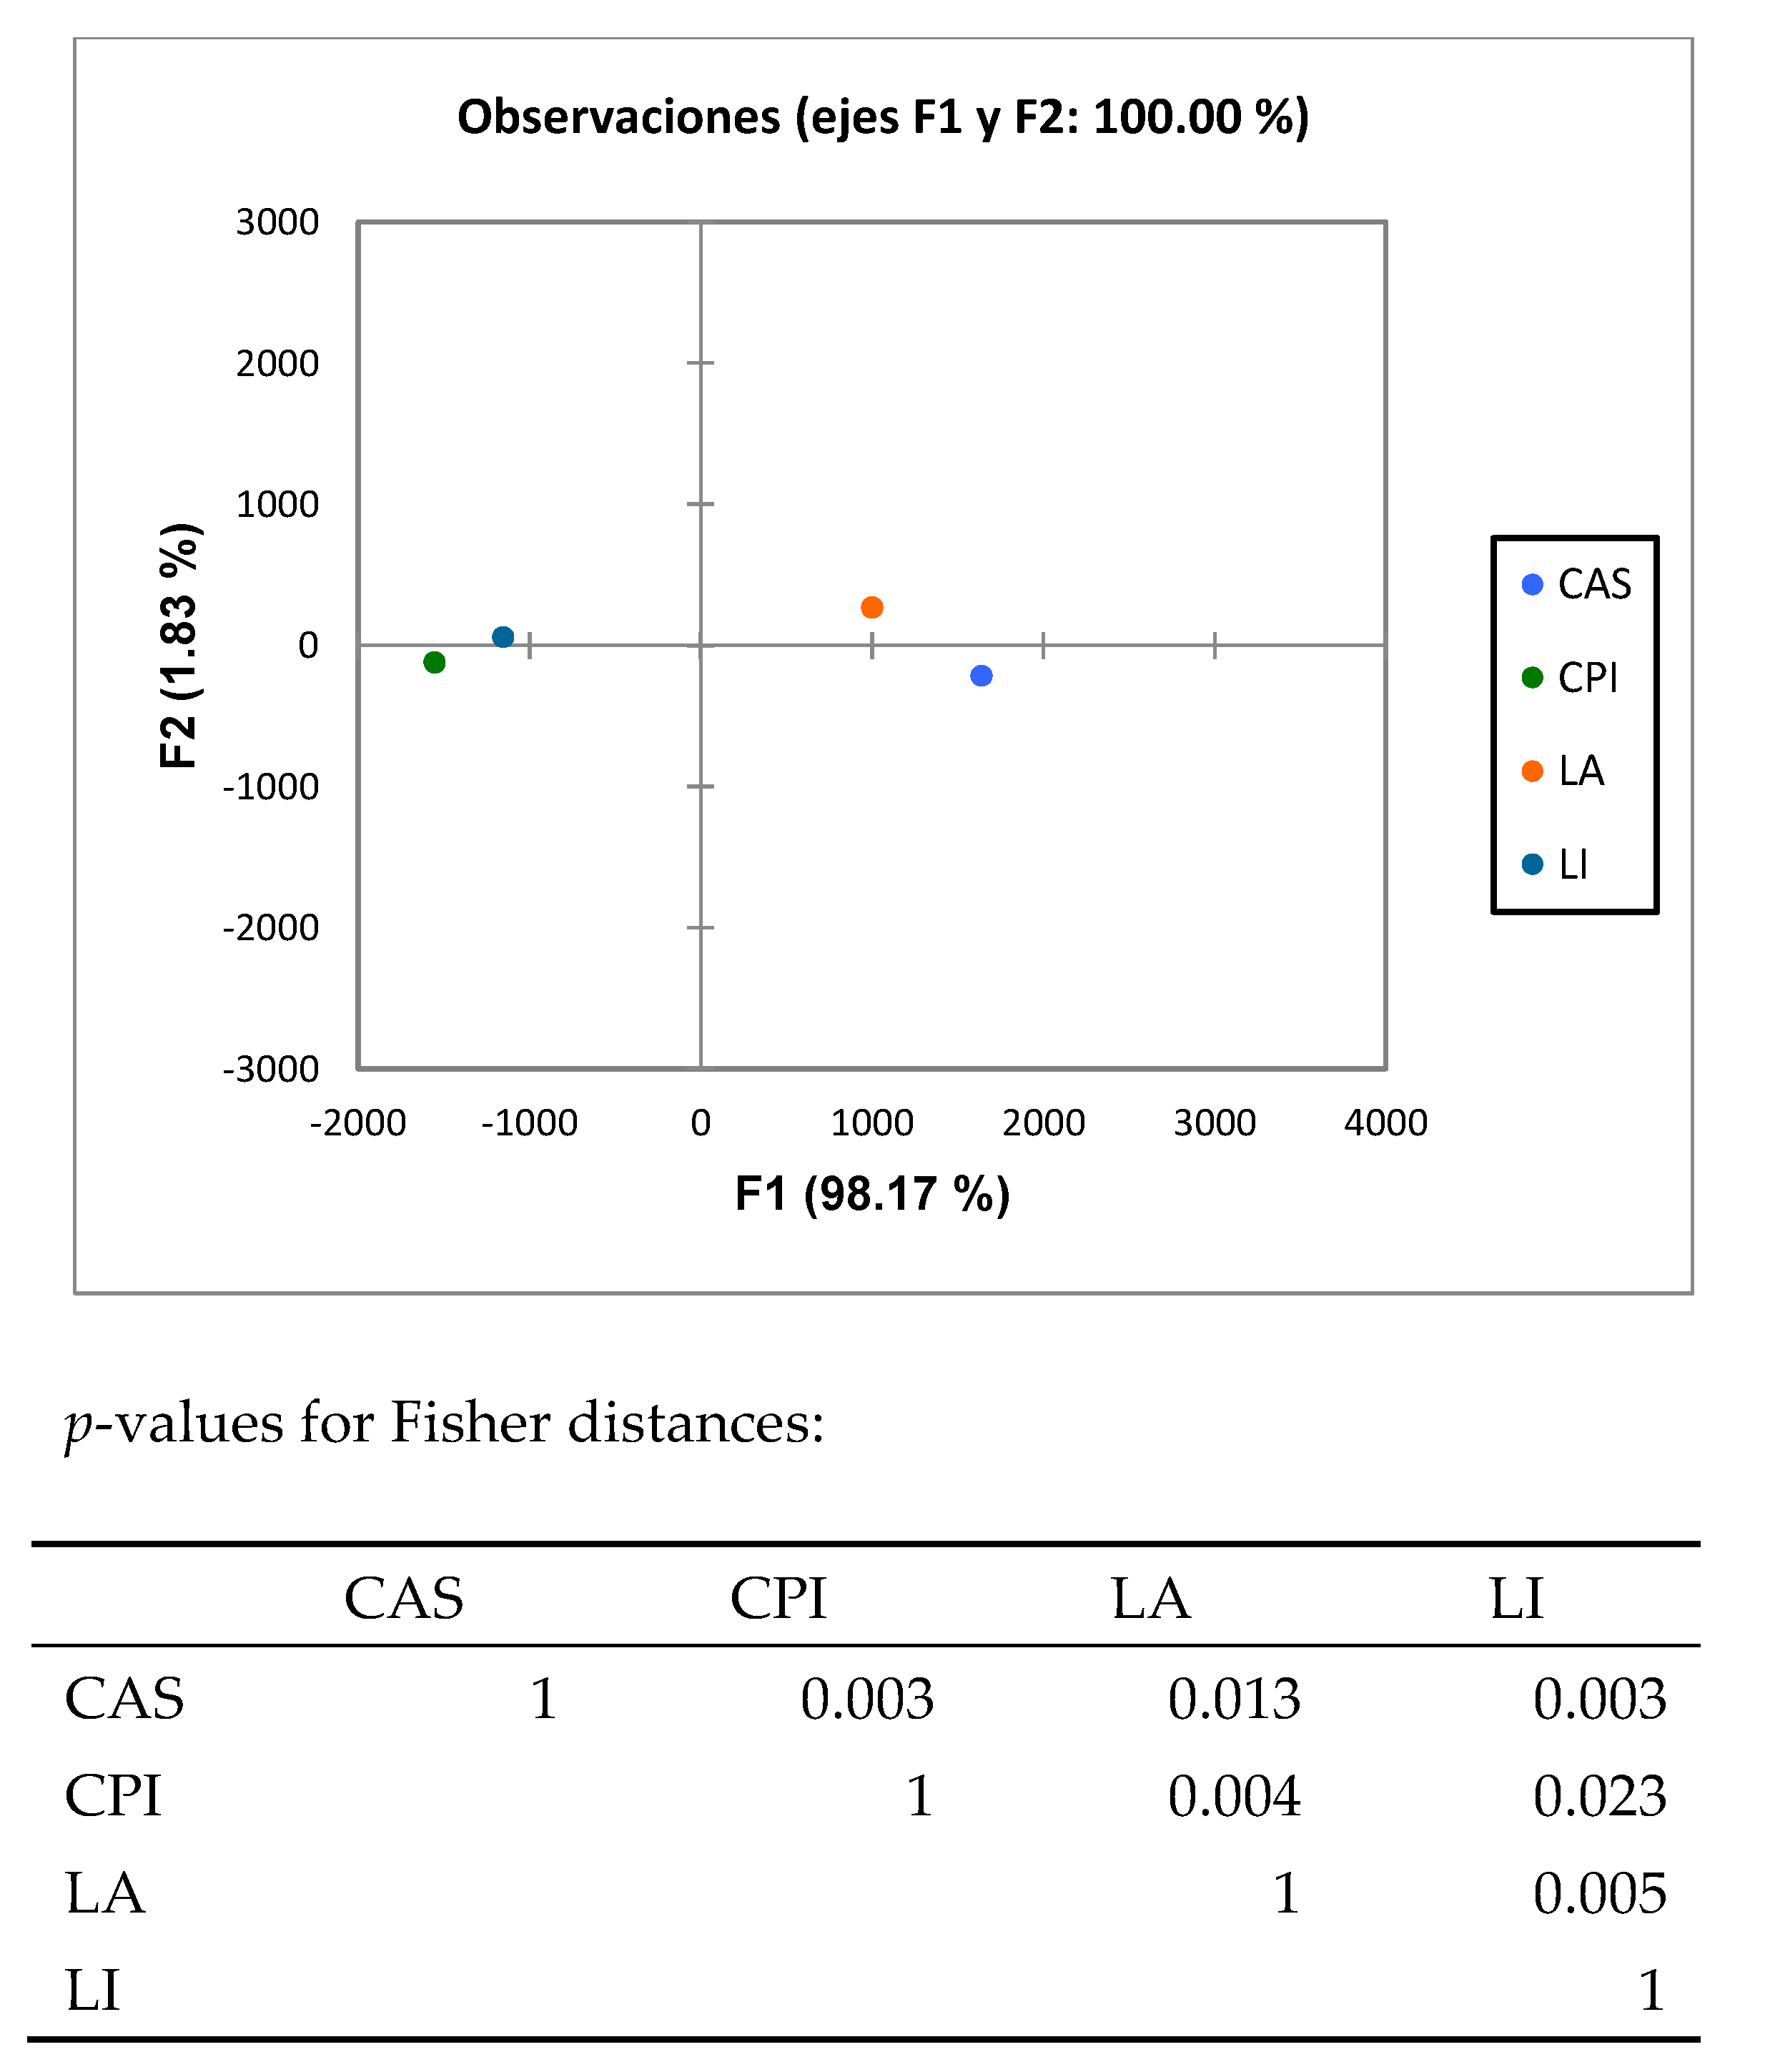
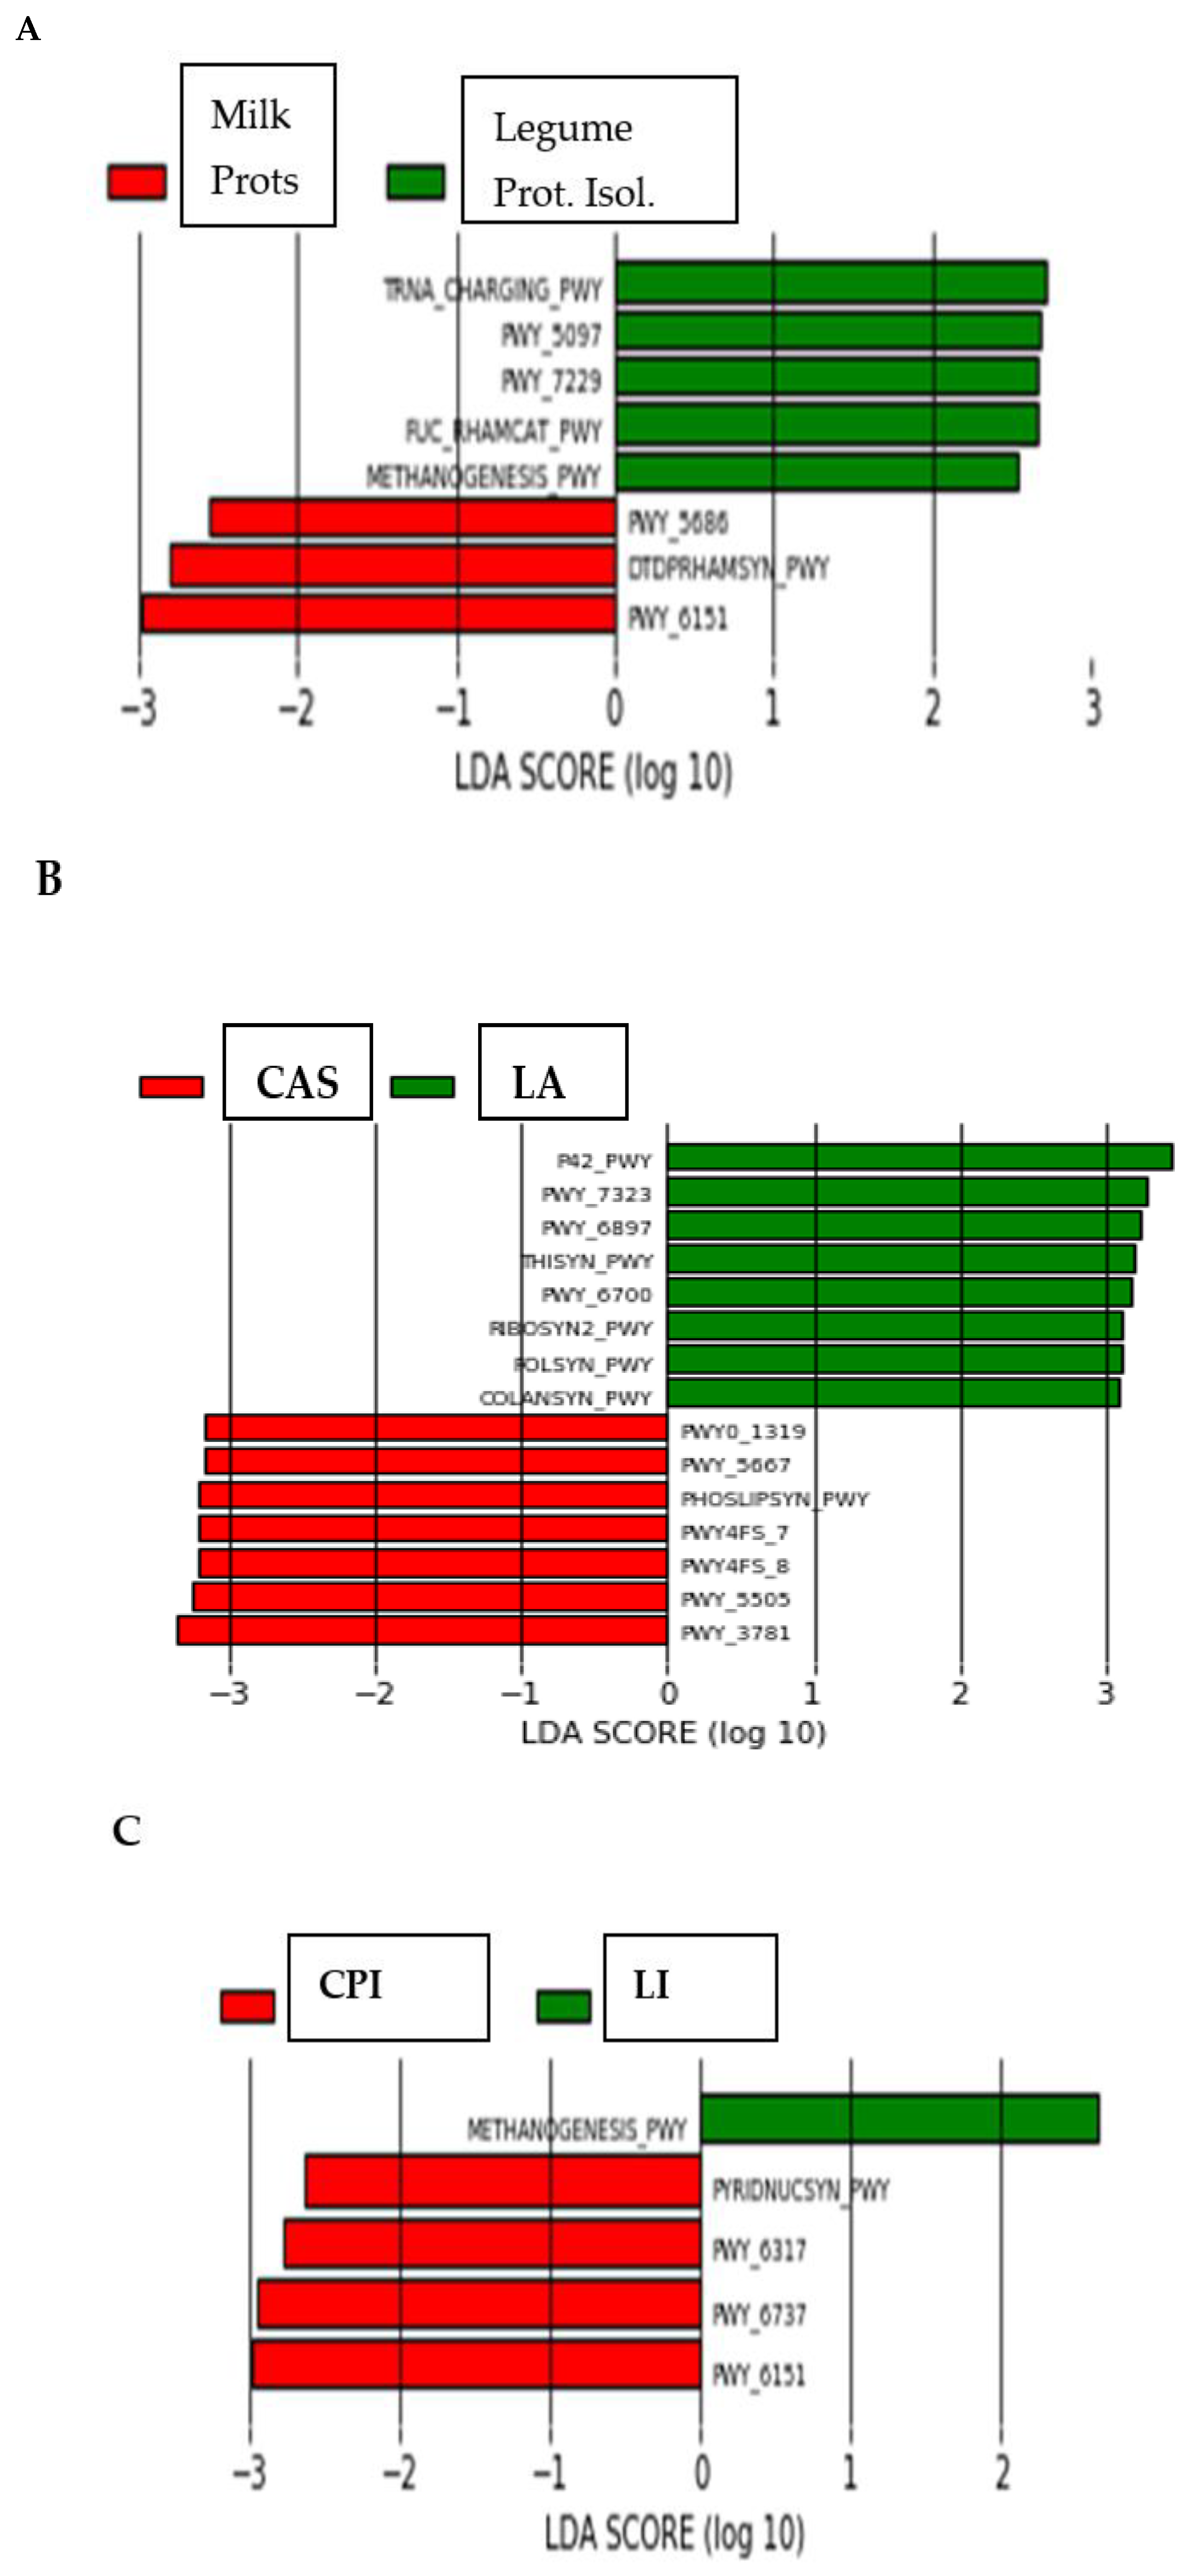
The predicted functions of the intestinal microbiota were identified by using PICRUSt. Discriminant analysis (Figure 4) of the PICRUSt analysis showed that the functionality of the intestinal microbiome in rats fed the diets differing in the type of protein differed significantly (p < 0.05). Also, most functions of the caecal microbiota were differentially enriched in the LA group (Figure S1). The exceptions were Methanogenesis_PWY, which was enriched in the LI group, and PWY_3781, which was enriched in the CAS group. The LEfSe analysis of functions (Figure 5) showed that out of the 388 identified functions, 5 functions (TRNA_charging_PWY, PWY_5097, PWY_7229, FUC_rhamcat_PWY and Methanogenesis_PWY) discriminated the vegetable (CPI and LI isolates) and 3 functions (PWY_6151, Dtdprhamsyn_PWY and PWY_5686) discriminated the animal (milk) proteins. Seven (7) and 8 functions explained differences between the CAS (PWY_3781, PWY_5505, PWY4FS_7, Phoslipsin_PWY, PWY_5667 and PWY0_1319), and LA (P42_PWY, PWY_7323, PWY_6897, Thisyn_PWY, PWY_6700, Ribosyn2_PWY, Folsyn_PWY and Colansyn_PWY) diets, respectively. Methanogenesis_PWY specifically differentiated the LI diet, and PWY_6151, PWY_6737, PWY_6317 and Piridnucsyn_PWY differentiated the CPI diet.
Regarding the diversity indexes (Table 4), there were no differences for Evenness at the family level and Simpson and Evenness at the genus level. The Simpson, Shannon and Chao1 indexes at the family level and Shannon and Chao1 at the genus level were lower (p < 0.01) for the LA diet. At the family level, Simpson, Shannon and Chao1 indexes for the LI diet were higher (p < 0.01) than LA and CAS, but not different from CPI. Shannon and Chao1 at the genus level were higher (p < 0.01) for LI compared to the LA diet.
4. Discussion
Increased proteolytic fermentation in the gut may alter the relative abundance of microbial species in the gut and generate bioactive, potentially deleterious metabolic products. However, published work specifically aimed to compare in a systematic way the effects induced in vivo by chemically defined proteins on the intestinal microbiota composition and function, without the interference of other dietary components, is as yet quite scarce. To that end, semisynthetic diets for rats differing only in their constituent proteins were formulated. The proteins utilized here were two of animal (milk) origin (LA, CAS) and two of vegetable (legume) origin (CPI, LI). Both qPCR and Illumina sequencing analysis revealed significant differences in composition and functionality as a consequence of feeding different dietary proteins. Thus, both ANOSIM and Discriminant Analysis (Table 2 and Figure 2) elicited very significant differences among the different dietary groups at both family and genus levels. Results from qPCR on microbiota composition were in line with those from sequencing. See, for example, the higher Bacteroides spp. and Blautia spp. values found in LA as compared to the CAS diet (Figure 1 and Table 3). As for the variability indexes, at the family and genus levels, the results pointed to differences mainly in the richness indices (Shannon, Chao1) more than in evenness indices (Evenness, Simpson) (Table 4). The main effect observed was lower (p < 0.05) richness values for the LA diet as compared to the other groups including CAS. So, the number of different species inhabiting the LA caecal contents was lower, while the uniformity of the microbial populations was similar between treatments. This is interesting in connection with the results obtained on functional analysis (PICRUSt) (see below).
At the family level, Bacteroidaceae and Clostridiaceae were the most abundant (p < 0.05) in rats fed the LA diet (Table 2). The main genera represented were Bacteroides (mainly Bacteroides uniformis), Blautia (mainly Blautia producta) and Roseburia (mainly Roseburia faecis). Interestingly, Treponema spp. were much lower (p < 0.0001) in the LA diet than in the other diets including CAS. Rats fed the CAS diet had higher (p < 0.05) Ruminococcaceae, Veillonellaceae and Helicobacteraceae reads, while Bifidobacteriaceae tended to be higher. The main genera represented were Ruminococcus (mainly R. gnavus, R. bromii and R. flavefaciens), Phascolarctobacterium and Helicobacter. Bifidobacterium (mainly Bifidobacterium animalis and B. pseudolongum) also tended to be higher. Feeding the CPI diet induced higher Prevotellaceae than the other groups and higher Methanobacteriaceae in the LI group, while families from Clostridiales and Spirochaetaceae were higher in CPI and LI diets with respect to LA and CAS diets. The main genera represented were Methanobrevibacter, Prevotella (mainly P. copri) and genera from the Clostridiales order. Parabacteroides spp. was higher than LI in LA and CAS diets but not different from CAS.
Growing evidence has indicated that AAs, the main products of dietary protein digestion, can affect the structure, composition, and functionality of gut microbiota. It is well known that a number of species are implicated in proteolytic fermentation in vitro, and include bacteria from the genera Clostridium, Fusobacterium, Bacteroides, Actinomyces, Propionibacterium and Peptostreptococci [20]. However, the species with the greatest capacity for proteolytic fermentation in vivo cannot be identified just in a noncompetitive in vitro environment but would require a model closer to the highly competitive intestinal environment. In addition, due to the differences in substrate abundance, community membership, and species richness in different locations of the gut, it is important not only to establish which species are participating but also to examine how processes may differ in the small and large intestines [2]. It has been reported that several microbial groups, such as Bacteroidetes, Actinobacteria, Firmicutes, Proteobacteria and Verrucomicrobia, and genera, such as Roseburia and Lactobacillus, are sensitive to peptides that result in changes in the composition and diversity of gut microbiota [21,22]. Except for Verrucomicrobia, the results found here (Table 3) are in line with these previous reports, as these mentioned microbial groups are among those significantly affected by the different diets.
LEfSe analysis (Figure 3) revealed, on the other hand, that the organisms most likely to explain differences between LA and CAS were Bacteroides spp., Roseburia spp., Clostridium spp., Streptococcus spp., Dorea spp. and Coprococcus spp. for the LA group; Treponema spp., Ruminococcus spp., Helicobacter spp., genera from Desulfovibrionaceae, Phascolarctobacterium, Lactobacillus, and genera from Cyanobacteria and Rikenellaceae for the CAS group. Most of the organisms pointed out by LEfSe for the LA group (namely Bacteroides spp., Roseburia spp., Clostridium spp., and Coprococcus spp.) have been identified as butyrate producers [23,24]. The three major SCFAs (acetate, propionate and butyrate) are the main end products from carbohydrate fermentation in the proximal colon but are also produced from AAs in the distal colon. Among the SCFAs, butyrate is the main energy source for epithelial cells, as 70–90% is metabolized in the colonocytes. Branched-chain fatty acids (BCFAs, i.e., isobutyrate, 2-methybutyrate and isovalerate), which also belong to SCFAs and represent between 5 and 10% of total SCFAs are originated by the microbiota exclusively from BCAAs. SCFAs supply intestinal epithelial cells with energy, exert anti-inflammatory effects and regulate metabolism through binding to G-protein coupled receptors. Production of SCFAs lowers the luminal pH of the colon, which markedly affects the composition of the colonic microbiota by preventing overgrowth of pH-sensitive pathogenic bacteria such as Escherichia and some Clostridia [1]. On the contrary, a number of species from some of the groups pointed out for CAS (Treponema spp., Helicobacter spp., and genera from Rikenellaceae) have been reported as pathogenic. Thus, for example, some Treponema spp. as Treponema pallidum (Phylum Spirochaetota) is known to be responsible for diseases such as syphilis [24]; Helicobacter pylori is the main agent in peptic ulcer disease [25]; and members of the Rikenellaceae family have been implicated in both beneficial [26] and pathological processes (colorectal cancer) [27]. Even more, Treponema spp. were much lower in the LA diet than in the other diets including CAS. Thus, according to the current research, and in the absence of other dietary components, LA appears to induce a generally healthier microbiota composition than CAS and would then be preferable in high-protein diets.
There are three situations where high protein intake is most commonly utilized: in muscle hypertrophy, particularly among bodybuilders, powerlifters and other strength athletes; during energy-restricted weight loss diets; and in recovery from intense exercise. Apart from other metabolic risks advocated for high protein diets (renal dysfunction, loss of bone mass, atherogenesis), the main potential problem with this type of diet is the substitution of proteins for other macronutrients, particularly carbohydrates [28]. This is relevant in the present context because the proportion of protein to carbohydrate contents in the diet is usually regarded as the main driver of intestinal microbiota composition [9] and, as already mentioned, SCFAs (the main energy source for epithelial cells) are the main end products from carbohydrates fermentation in the proximal colon [29]. Therefore, high-protein diets are likely to have direct implications due to the composition of the proteins themselves and also indirect consequences as a result of changes in the proportions of other dietary components, particularly carbohydrates.
Piglets with highly digestible casein-based diets have been shown to present a higher count of Enterobacteriaceae than piglets fed on less digestible soybean meal-based diets [30]. This is in agreement with previous work by our group [31], where the number of copies in animals fed a casein-based diet was lower than soybean for Lactobacilli and Bacteroides, but was higher than soybean for Bifidobacteria, Enterobacteria and the Escherichia/Shigella group. However, since pure proteins were not used in diet formulation in these and most other reports, the main difficulty in ascribing these effects to the protein component of the diets mainly lies in the fact that they also differed in the carbohydrate fraction. The dietary proportion of protein to carbohydrate contents is usually regarded as the main driver of intestinal microbiota composition [9]. Thus, for example, the proportion of the families Lachnospiraceae and Ruminococcaceae were decreased, while the proportions of the genus Bacteroides and Parabacteroides were increased in mice fed with a high-protein and low-carbohydrate diet, which may result in a deleterious gut environment [32]. However, as other components, such as polyphenols, are known to have a substantial effect [9], it is necessary to establish what effects are mainly or only related to the protein fraction of the diet.
As for the legume PIs, the LI diet resulted in lower qPCR Escherichia/Shigella values than LA and CAS (Figure 1). This is in agreement with previous work by our group, where lower Enterobacteria and Escherichia/Shigella have been reported in legume-fed rats or pigs [14,31,33]. Several genera belonging to the Enterobacteriaceae Family have been considered fatal pathogens because of their resistance to antibiotics and their implication in a variety of diseases [34]. Sequencing and LEfSe analysis revealed that the genera most likely to explain differences between CPI and LI were Ruminococcus, Prevotella and other genera from Prevotella for CPI; Methanobrevibacter spp. (Archaea), and genera from Desufovibrionaceae and Alphaproteobacteria for LI. Finally, the organisms most likely to explain the differences between animal (milk) and vegetable (legume) proteins were genera from the order Bacteroidales, Parabacteroides spp. and Phascolarctobacterium spp. for the animal proteins; genera from the family S24_7 and from the order Clostridiales, Prevotella spp., genera from Bacteroidaceae, Clostridiaceae, Cyanobacteria and Coriobacteriaceae for the vegetable proteins. Higher Prevotella spp. in the legume PI groups with respect to the milk protein groups (Table 3) is also in line with previous reports with legume-fed rats, where cowpea-based diets modulated the intestinal microbiota to the Prevotella enterotype, which has been linked to lower colon inflammation markers [35,36]. In addition, the effect found on Methanobrevibacter spp. (see Table 3 and Figure 3) by the LI diet is remarkable and, to our knowledge, not previously reported. Methanogens have been shown to participate in the reduction of methyl compounds (mono, di and trimethylamine (TMA)) to produce methane. This could be important, considering that TMA, produced through the metabolism of choline and L-carnitine by gut microorganisms, is subsequently oxidized in the liver into the proatherogenic trimethylamine oxide (TMAO). Based on this consideration, it has been hypothesized that dietary supplementation with so-called “Archaebiotics” could prevent cardiovascular diseases in at-risk subjects [37]. Therefore, the mostly beneficial modulation of intestinal microbiota found in legume-fed animals is likely to be due, at least in part, to the protein fraction of the meal. However, it is important to indicate at this point that the current work has the limitation that only semisynthetic diets with highly purified proteins were used here. The putative effects of the different proteins in a complex diet with a variety of ingredients would also be modulated by interactions among dietary chemical fractions, microbial degradation of other dietary fractions, microbial cross feeding phenomena, etc. The present investigation was just a first approach to the issue of understanding, in a design as simple as possible, the behavior of some dietary proteins in the absence of other dietary components.
Finally, the discriminant analysis (Figure 4) of the PICRUSt analysis showed that the functionality of the intestinal microbiome in rats fed the diets differing in the type of protein differed significantly (p < 0.05). Also, most functions of the caecal microbiota were differentially enriched in the LA group (Figure S1). The exceptions were Methanogenesis_PWY, which was enriched in the LI group (in line with the increased Methanobrevibacter spp. in this group), and PWY_3781 which was enriched in the CAS group. It is noteworthy that this differentially enriched functionality observed in the LA group was accompanied by a lower richness (Table 4) in this group. An enriched functionality is, therefore, not necessarily linked to a higher bacterial richness. The LEfSe analysis (Figure 5) of predicted functions outlined a number of functions discriminating animal (milk) from vegetable (legume PIs) but also CAS from LA.
5. Conclusions
Both qPCR and Illumina sequencing analysis revealed significant differences in intestinal microbiota composition and functionality as a consequence of feeding rats with diets that differed only in their constituent proteins. Lower richness values for the LA diet as compared to the other groups including CAS were observed. According to current research, and in the absence of other dietary components, LA appears to induce a generally healthier microbiota composition than CAS and would be then preferable in high-protein diets. Also, Methanogens (Methanobrevibacter spp.) and Methanogenic_PWY functionality have been outlined in the LI group, which might be relevant in cardiovascular at-risk subjects. LEfSe analysis of predicted functions (as determined by PICRUSt) discriminated animal (milk) from vegetable (legume PIs) proteins, but also CAS from LA. The mostly beneficial modulation of intestinal microbiota generally found with legume-based diets in vivo is likely to be due, at least in part, to the constituent protein fraction of the meal.
Supplementary Materials
The following supporting information can be downloaded at: https://www.mdpi.com/article/10.3390/nu16010149/s1, Figure S1. ANOVA of PICRUSt functional analysis after SEMPER (50% dissimilarity) analysis, using the default parameters (LDA score = 2). Table S1. SIMPER analysis at different taxonomic levels of caecal bacterial community in rats fed diets based in milk (LA, CAS) or legume proteins isolates (CPI, LI) as the only protein source. “f__”, “g__” and “s__” indicate unknown Family, Genus and Species, respectively.
Funding
This research was supported by Consejo Superior de Investigaciones Científicas (CSIC), and the Spanish Ministry of Science and Innovation under the projects RTC-2017-6540-1, RTI2018-100934-B-I00 and AGL2017-83772-R. The work was also partially supported by the Fondo Europeo de Desarrollo Regional (FEDER) and Fondo Social Europeo (FSE) funds from the European Union.
Institutional Review Board Statement
The experimental protocol was reviewed and approved by the Institutional Animal Care and Use Committee of the Spanish Council for Scientific Research (CSIC, Spain) (J. Andal. 17-03-15-209, approval date: 17 March 2015), and the animals cared for in accordance with the Spanish Ministry of Agriculture guidelines (RD 53/2013).
Informed Consent Statement
Not applicable.
Data Availability Statement
Data are contained within the article and supplementary materials.
Acknowledgments
The technical work by I. Aranda, M.A. Felipe and M. Espinar is gratefully acknowledged.
Conflicts of Interest
The author declares no conflict of interest.
Abbreviations
AA, amino acids; CAS, casein; CPI, chickpea protein isolate; LA, lactalbumin; LI, lupin protein isolate; PI, protein isolate; SCFA, short chain fatty acids.
References
- Fan, P.; Li, L.; Rezaei, A.; Eslamfam, S.; Che, D.; Ma, X. Metabolites of dietary protein and peptides by intestinal microbes and their impacts on gut. Curr. Prot. Pept. Sci. 2015, 16, 646–654. [Google Scholar] [CrossRef] [PubMed]
- Diether, N.; Willing, B. Microbial fermentation of dietary protein: An important factor in diet–microbe–host interaction. Microorganisms 2019, 7, 19. [Google Scholar] [CrossRef] [PubMed]
- Hector, A.J.; Phillips, S.M. Protein recommendations for weight loss in elite athletes: A focus on body composition and performance. Int. J. Sport Nutr. Exerc. Metab. 2018, 28, 170–177. [Google Scholar] [CrossRef] [PubMed]
- Rubio, L.A.; Clemente, A. In Vivo (rat) and in vitro (Caco-2 cells) absorption of amino acids from legume as compared to animal proteins. Arch. Anim. Nutr. 2009, 63, 413–426. [Google Scholar] [CrossRef]
- Gao, C.; Hou, L. Branched chain amino acids metabolism in heart failure. Front. Nutr. 2003, 10, 1279066. [Google Scholar] [CrossRef]
- Windey, K.; De Preter, V.; Verbeke, K. Relevance of protein fermentation to gut health. Mol. Nutr. Food Res. 2012, 56, 184–196. [Google Scholar] [CrossRef]
- Flint, H.J.; Scott, K.P.; Duncan, S.H.; Louis, P.; Forano, E. Microbial degradation of complex carbohydrates in the gut. Gut Microbes 2012, 3, 289–306. [Google Scholar] [CrossRef]
- Wu, S.; Bhat, Z.F.; Gounder, R.S.; Ahmed, I.A.M.; Al-Juhaimi, F.Y.; Ding, Y.; Bekhit, A.E.-D.A. Effect of dietary protein and processing on gut microbiota—A systematic review. Nutrients 2022, 14, 453. [Google Scholar] [CrossRef]
- Salonen, A.; de Vos, W.M. Impact of diet on human intestinal microbiota and health. Annu. Rev. Food Sci. Technol. 2014, 5, 239–562. [Google Scholar] [CrossRef]
- Sánchez-Vioque, R.; Clemente, A.; Vioque, J.; Bautista, J.; Millán, F. Protein isolates from chickpea (Cicer arietinum L.): Chemical composition, functional properties and protein characterization. Food Chem. 1999, 64, 237–243. [Google Scholar] [CrossRef]
- Ruiz, R.; Rubio, L.A. Lyophilisation improves the extraction of PCR-quality community DNA from pig faecal samples. J. Sci. Food Agric. 2009, 89, 723–727. [Google Scholar] [CrossRef]
- NRC. Nutrients Requirements of Laboratory Animals; National Academies Press: Washington, DC, USA, 1995. [Google Scholar]
- van Barneveld, R.J. Understanding the nutritional chemistry of lupin (Lupinus spp.) seed to improve livestock production efficiency. Nutr. Res. Rev. 1999, 12, 203–230. [Google Scholar] [CrossRef] [PubMed]
- Rubio, L.A.; Aranda-Olmedo, I.; Contreras, S.; Góngora, T.; Domínguez, G.; Peralta-Sánchez, J.M.; Martín-Pedrosa, M. Inclusion of limited amounts of extruded legumes plus cereal mixes in normocaloric or obesogenic diets for rats: Effects on intestinal microbiota composition. J. Sci. Food Agric. 2020, 100, 5546–5557. [Google Scholar] [CrossRef] [PubMed]
- Langille, M.G.I.; Jesse, Z.; Gregory, J.; Daniel, M.D.; Dan, K.; Reyes, J.A.; Clemente, J.C.; Burkepile, D.E.; Vega Thurber, R.L.; Knight, R.; et al. Predictive functional profiling of microbial communities using 16S rRNA marker gene sequences. Nat. Biotechnol. 2013, 31, 814. [Google Scholar] [CrossRef] [PubMed]
- DeSantis, T.Z.; Hugenholtz, P.; Larsen, N.; Rojas, M.; Brodie, E.L.; Keller, K.; Huber, T.; Dalevi, D.; Hu, P.; Andersen, G.L. Greengenes, a Chimera-Checked 16S rRNA Gene Database and Workbench Compatible with ARB. Appl. Environ. Microbiol. 2006, 7, 5069–5072. [Google Scholar] [CrossRef]
- Kanehisa, M.; Goto, S.; Sato, Y.; Furumichi, M.; Tanabe, M. KEGG for integration and interpretation of large-scale molecular data sets. Nucleic Acids Res. 2012, 40, 109–114. [Google Scholar] [CrossRef]
- XLSTAT. Addinsoft. 2017. Available online: https://www.xlstat.com/es/soluciones/base (accessed on 10 December 2023).
- Segata, N.; Izard, J.; Waldron, L.; Gevers, D.; Miropolsky, L.; Garrett, W.S.; Huttenhower, C. Metagenomic biomarker discovery and explanation. Genome Biol. 2011, 12, R60. [Google Scholar] [CrossRef]
- Smith, E.; Macfarlane, G. Enumeration of amino acid fermenting bacteria in the human large intestine: Effects of pH and starch on peptide metabolism and dissimilation of amino acids. FEMS Microbiol. Ecol. 1988, 25, 355–368. [Google Scholar] [CrossRef]
- Zhao, J.; Zhang, X.; Liu, H.; Brown, M.A.; Qiao, S. Dietary protein and gut microbiota composition and function. Curr. Prot. Pept. Sci. 2019, 20, 145. [Google Scholar] [CrossRef]
- Wu, S.; Bekhit, A.E.A.; Wu, Q.; Chen, M.; Liao, X.; Wang, J.; Ding, Y. Bioactive peptides and gut microbiota: Candidates for a novel strategy for reduction and control of neurodegenerative diseases. Trends Food Sci. Technol. 2021, 108, 164–176. [Google Scholar] [CrossRef]
- Fujio-Vejar, S.; Vasquez, Y.; Morales, P.; Magne, F.; Vera-Wolf, P.; Ugalde, J.A.; Navarrete, P.; Gotteland, M. The gut microbiota of healthy chilean subjects reveals a high abundance of the phylum Verrucomicrobia. Front. Microbiol. 2017, 8, 1221. [Google Scholar] [CrossRef] [PubMed]
- Antal, G.M.; Lukehart, S.A.; Meheus, A.Z. The endemic treponematoses. Microbes Infect. 2002, 4, 83–94. [Google Scholar] [CrossRef] [PubMed]
- Chan, F.K.L.; Lau, J.Y.W. Gastrointestinal and Liver Disease, 11th ed.; Feldman, M., Friedman, L.S., Brandt, L.J., Eds.; Elsevier: Philadelphia, PA, USA, 2021; Chapter 53. [Google Scholar]
- Tavella, T.; Rampelli, S.; Guidarelli, G.; Bazzocchi, A.; Gasperini, C.; Pujos-Guillot, E.; Comte, B.; Barone, M.; Biagi, E.; Candela, M.; et al. Elevated gut microbiome abundance of Christensenellaceae, Porphyromonadaceae and Rikenellaceae is associated with reduced visceral adipose tissue and healthier metabolic profile in Italian elderly. Gut Microbes 2021, 13, 1880221. [Google Scholar] [CrossRef] [PubMed]
- Hoang, T.; Kim, M.J.; Park, J.W.; Jeong, S.-Y.; Lee, J.; Shin, A. Nutrition-wide association study of microbiome diversity and composition in colorectal cancer patients. BMC Cancer 2022, 22, 656. [Google Scholar] [CrossRef] [PubMed]
- Tipton, K.D. Efficacy and consequences of very-high-protein diets for athletes and exercisers. Proc. Nutr. Soc. 2011, 70, 205–214. [Google Scholar] [CrossRef] [PubMed]
- Louis, P.; Flint, H.J. Diversity, metabolism and microbial ecology of butyrate-producing bacteria from the human large intestine. FEMS Microbiol. Lett. 2009, 294, 1–8. [Google Scholar] [CrossRef] [PubMed]
- Rist, V.T.S.; Weiss, E.; Sauer, N.; Mosenthin, R.; Eklund, M. Effect of dietary protein supply originating from soybean meal or casein on the intestinal microbiota of piglets. Anaerobe 2014, 25, 72–79. [Google Scholar] [CrossRef]
- Rubio, L.A.; Peinado, M.J. Replacement of soybean meal with lupin or chickpea seed meal in diets for fattening Iberian pigs promotes a healthier ileal microbiota composition. Adv. Microbiol. 2014, 4, 498–503. [Google Scholar] [CrossRef]
- Kim, E.; Kim, D.; Park, J. Changes of mouse gut microbiota diversity and composition by modulating dietary protein and carbohydrate contents: A pilot study. Prev. Nutr. Food Sci. 2016, 21, 57–61. [Google Scholar] [CrossRef]
- Rubio, L.A.; Ruiz, R.; Peinado, M.J.; Martin-Pedrosa, M.; Fernández-Fígares, I.; Porres, J. Carbohydrates digestibility and faecal microbiota composition in rats fed diets based on raw or fermented Vigna unguiculata seed meal as the only protein source. Food Chem. Adv. 2022, 1, 100022. [Google Scholar]
- Davin-Regli, A.; Lavigne, J.P.; Pages, J.M. Enterobacter spp.: Update on Taxonomy, Clinical Aspects, and Emerging Antimicrobial Resistance. Clin. Microbiol. Rev. 2019, 32, e00002-19. [Google Scholar] [CrossRef] [PubMed]
- Arumugam, M.; Raes, J.; Pelletier, E.; Le Paslier, D.; Yamada, T.; Mende, D.R.; Fernandes, G.R.; Tap, J.; Bruls, T.; Batto, J.M.; et al. Enterotypes of the human gut microbiome. Nature 2011, 473, 174–180. [Google Scholar] [CrossRef] [PubMed]
- Utrilla, M.P.; Peinado, M.J.; Ruiz, R.; Rodríguez-Nogales, A.; Algieri, F.; Rodríguez-Cabezas, M.E.; Rubio, L.A. Pea (Pisum sativum L.) seed albumin extracts show anti-inflammatory effect in a DSS model of mouse colitis. Mol. Nutr. Food Res. 2015, 59, 807–819. [Google Scholar] [CrossRef] [PubMed]
- Gaci, N.; Borrel, G.; Tottey, W.; O’Toole, P.W.; Brugère, J.F. Archaea and the human gut: New beginning of an old story. World J. Gastroenterol. 2014, 20, 16062–16078. [Google Scholar] [CrossRef]
Figure 1.
RT-qPCR bacterial counts (log10 copies of the 16 S-rRNA gene mg-1 dry content) in the caecal content of rats fed based on milk (LA, CAS) or legume protein isolates (CPI, LI) as the only protein source. Values are means (n = 6) with SD in bars. Different letters indicate significant (p < 0.05) differences.

Figure 2.
Discriminant Analysis of bacterial groups analyzed by Illumina sequencing. LA, la ctalbumin; CA S, casein; CPI, chickpea protein isolate; LI, lupin protein isolate. (A) Family level, (B) genera level.
Figure 2.
Discriminant Analysis of bacterial groups analyzed by Illumina sequencing. LA, la ctalbumin; CA S, casein; CPI, chickpea protein isolate; LI, lupin protein isolate. (A) Family level, (B) genera level.

Figure 3.
Linear discriminant analysis coupled with effect size (LEfSe) of bacterial groups after SEMPER analysis, using the default parameters (LDA score = 2). (A) Different taxa between CAS and LA. (B) Different taxa between CPI and LI. (C) Different taxa between animal (milk) and vegetable (legume) proteins.


Figure 4.
Discriminant analysis of predicted functions (PICRUSt analysis) of the intestinal microbiota bacterial groups analyzed by Illumina sequencing; LA, lactalbumin; CAS, casein; CPI, chickpea protein isolate; LI, lupin protein isolate.
Figure 4.
Discriminant analysis of predicted functions (PICRUSt analysis) of the intestinal microbiota bacterial groups analyzed by Illumina sequencing; LA, lactalbumin; CAS, casein; CPI, chickpea protein isolate; LI, lupin protein isolate.

Figure 5.
Linear discriminant analysis coupled with effect size (LEfSe) of predicted functions (PICRUSt analysis) after SIMPER analysis, using the default parameters (LDA score = 2). (A) Different taxa between animal (milk) and vegetable (legume) proteins. (B) Different taxa between CAS and LA. (C) Different taxa between CPI and LI.


Table 1.
AAs composition (mg/g) of the dietary proteins used (as in [4]).
Table 1.
AAs composition (mg/g) of the dietary proteins used (as in [4]).
| LA 1 | CAS | CPI | LI | |
|---|---|---|---|---|
| Asp | 98.4 | 58.9 | 92.7 | 93.7 |
| Glu | 142.9 | 184.1 | 123.3 | 185.3 |
| Ser | 39.6 | 49.1 | 39.1 | 43.9 |
| Gly | 18.9 | 16.5 | 27.9 | 34.6 |
| His | 17.2 | 27.5 | 19.1 | 21.4 |
| Arg | 28.5 | 37.4 | 58.9 | 80.4 |
| Thr | 45.3 | 39.6 | 26.4 | 30.3 |
| Ala | 51.2 | 32.6 | 33.5 | 30.7 |
| Pro | 51.7 | 82.8 | 38.9 | 44.5 |
| Tyr | 38.1 | 49.0 | 24.8 | 38.7 |
| Val | 55.2 | 53.3 | 38.5 | 38.9 |
| Met | 15.4 | 24.5 | 15.9 | 6.8 |
| Cys | 23.3 | 3.4 | 12.3 | 10.0 |
| Ile | 54.0 | 40.9 | 40.5 | 44.7 |
| Leu | 118.8 | 74.9 | 68.7 | 70.9 |
| Phe | 37.7 | 46.9 | 55.8 | 42.4 |
| Trp 2 | 16.7 | 10.2 | 5.5 | 8.8 |
| Lys | 89.3 | 97.9 | 50.4 | 41.6 |
Table 2.
ANOSIM (distance measure: Bray–Curtis, Bonferroni corrected p-values) of Illumina sequencing results at different taxonomic levels of samples from the caecal bacterial community of rats fed diets based on milk (LA, CAS) or legume protein isolates (CPI, LI) as the only protein source.
Table 2.
ANOSIM (distance measure: Bray–Curtis, Bonferroni corrected p-values) of Illumina sequencing results at different taxonomic levels of samples from the caecal bacterial community of rats fed diets based on milk (LA, CAS) or legume protein isolates (CPI, LI) as the only protein source.
| Diet 1 | ||||
|---|---|---|---|---|
| LA | CAS | LI | CPI | |
| Family | ||||
| LA | 0 | 0.0003 | 0.0014 | 0.0002 |
| CAS | 0 | 0.0076 | 0.0009 | |
| LPI | 0 | 0.0438 | ||
| CPI | 0 | |||
| Genus | ||||
| LA | 0 | 0.0007 | 0.0006 | 0.0004 |
| CAS | 0 | 0.0049 | 0.0003 | |
| LPI | 0 | 0.001 | ||
| CPI | 0 | |||
1 LA, la ctalbumin; CA S, casein; CPI, chickpea protein isolate; LPI, lupin protein isolate.
Table 3.
Proportions of Illumina sequencing reads at different taxonomic levels of the caecal bacterial community of rats fed diets based on milk (LA, CAS) or legume protein isolates (CPI, LI) as the only protein source. “f__”, “g__” and “s__” indicate unknown family, genus and species, respectively.
| Diet 1 | |||||
|---|---|---|---|---|---|
| LA 2 | CAS | CPI | LI | p-Values 3 | |
| Phylum | |||||
| Euryarchaeota | 2 b | 0 b | 4 b | 103 a | <0.0001 |
| Actinobacteria | 80 | 216 | 193 | 108 | 0.216 |
| Bacteroidetes | 2196 a | 1208 c | 1658 b | 1393 bc | <0.0001 |
| Firmicutes | 1480 b | 1562 ab | 1470 b | 1717 a | 0.058 |
| Proteobacteria | 177 b | 285 a | 183 b | 236 ab | 0.027 |
| Spirochaetes | 0 b | 661 a | 619 a | 420 a | <0.0001 |
| Family | |||||
| Methanobacteriaceae | 2 b | 0 b | 5 b | 100 a | 0.000 |
| Bifidobacteriaceae | 52 b | 216 a | 165 ab | 113 ab | 0.103 |
| Bacteroidales;f__ | 93 a | 76 a | 48 a | 39 a | 0.144 |
| Bacteroidaceae | 667 a | 179 b | 302 b | 324 b | 0.037 |
| Porphyromonadaceae | 45 | 56 | 37 | 31 | 0.184 |
| Prevotellaceae | 5 c | 0 c | 94 a | 35 b | 0.002 |
| Bacteroidales;f__S24-7 | 670 | 660 | 802 | 792 | 0.592 |
| [Paraprevotellaceae] | 386 a | 177 ab | 196 ab | 129 b | 0.070 |
| Cyanobacteria;f__ | 0 | 7 | 9 | 21 | 0.220 |
| Lactobacillaceae | 12 | 41 | 14 | 33 | 0.175 |
| Clostridiales;f__ | 70 b | 92 ab | 152 a | 142 a | 0.025 |
| Clostridiaceae | 98 a | 12 b | 20 b | 25 b | 0.015 |
| Lachnospiraceae | 342 ab | 139 b | 331 ab | 582 a | 0.013 |
| Ruminococcaceae | 773 b | 996 a | 745 bc | 619 c | 0.000 |
| Veillonellaceae | 90 b | 156 a | 90 b | 84 b | 0.007 |
| Erysipelotrichaceae | 77 | 52 | 102 | 116 | 0.204 |
| Alphaproteobacteria;o__RF32;f__ | 5 | 33 | 15 | 34 | 0.241 |
| Alcaligenaceae | 70 | 56 | 45 | 57 | 0.595 |
| Helicobacteraceae | 51 c | 173 a | 96 bc | 115 ab | 0.004 |
| Enterobacteriaceae | 6 a | 12 | 6 | 4 | 0.334 |
| Spirochaetaceae | 0 b | 6 a | 609 a | 428 a | <0.0001 |
| Genera | |||||
| Archaea;__Methanobrevibacter | 00 b | 0 b | 2 b | 71 a | <0.0001 |
| Bifidobacterium | 53 a | 159 a | 168 a | 97 a | 0.103 |
| Bacteroidales;f__;g__ | 104 a | 75 ab | 40 b | 60 ab | 0.134 |
| Bacteroides | 523 a | 193 b | 204 b | 300 b | 0.013 |
| Parabacteroides | 46 a | 55 a | 32 ab | 18 b | 0.028 |
| Prevotella | 0 b | 0 b | 115 a | 35 b | <0.0001 |
| Bacteroidales;f__S24-7;g__ | 676 | 663 | 803 | 784 | 0.642 |
| [Prevotella] | 1 b | 149 a | 191 a | 25 b | <0.0001 |
| Chloroflexi;c__S085;o__;f__;g__ | 24 b | 60 a | 3 b | 12 b | 0.013 |
| Cyanobacteria;c__4C0d;g__ | 0 b | 7 ab | 9 ab | 22 a | 0.143 |
| Lactobacillus | 12 a | 42 a | 14 a | 33 a | 0.128 |
| Clostridiales;f__;g__ | 63 b | 94 b | 152 a | 143 a | 0.002 |
| Lachnospiraceae;g__ | 75 a | 96 a | 204 a | 259 a | 0.256 |
| Blautia | 57 a | 21 b | 32 ab | 17 b | 0.069 |
| Coprococcus | 30 ab | 8 b | 31 ab | 47 a | 0.115 |
| Roseburia | 137 a | 10 b | 23 b | 17 b | <0.0001 |
| Ruminococcaceae;g__ | 306 bc | 240 c | 331 ab | 387 a | 0.006 |
| Oscillospira | 55 | 51 | 51 | 60 | 0.910 |
| Ruminococcus | 452 b | 651 a | 474 b | 226 c | <0.0001 |
| Phascolarctobacterium | 89 b | 147 a | 91 b | 83 b | 0.016 |
| Allobaculum | 73 | 49 | 97 | 114 | 0.197 |
| Alphaproteobacteria;o__RF32;f__;g_ | 3 b | 32 ab | 15 ab | 38 a | 0.105 |
| Sutterella | 69 | 56 | 45 | 58 | 0.626 |
| Helicobacteraceae;g__ | 22 | 24 | 54 | 51 | 0.235 |
| Helicobacter | 29 b | 136 a | 43 b | 30 b | <0.0001 |
| Treponema | 9 c | 644 a | 667 a | 436 b | <0.0001 |
1 LA, lactalbumin; CA S, casein; CPI, chickpea protei n isolate; LPI, lupin protein isolate. 2 Values are means of 6 animals per group. 3 Values with different superscript letters differ significantly. Groups with significant differences have been highlighted in bold.
Table 4.
Diversity indices Simpson, Shannon, Evenness and Chao1 at different taxonomic levels of sequencing analysis on proportions of samples from the caecal bacterial community of rats fed diets based on milk (LA, CAS) or legume protein isolates (CPI, LI) as the only protein source.
Table 4.
Diversity indices Simpson, Shannon, Evenness and Chao1 at different taxonomic levels of sequencing analysis on proportions of samples from the caecal bacterial community of rats fed diets based on milk (LA, CAS) or legume protein isolates (CPI, LI) as the only protein source.
| Diet 1 | |||||
|---|---|---|---|---|---|
| LA 2 | CAS | LI | CPI | p-Values 3 | |
| Family | |||||
| Simpson | 0.829 c | 0.842 bc | 0.865 a | 0.862 ab | 0.003 |
| Shannon | 2.070 c | 2.200 b | 2.330 a | 2.275 ab | 0.000 |
| Evenness | 0.480 | 0.482 | 0.505 | 0.501 | 0.743 |
| Chao1 | 16.571 c | 18.929 b | 20.375 a | 19.750 ab | <0.0001 |
| Genus | |||||
| Simpson | 0.854 | 0.874 | 0.877 | 0.880 | 0.136 |
| Shannon | 2.301 b | 2.438 a | 2.500 a | 2.469 a | 0.008 |
| Evenness | 0.479 | 0.498 | 0.487 | 0.493 | 0.933 |
| Chao1 | 21.143 c | 23.286 b | 25.125 a | 24.167 ab | <0.0001 |
1 LA, lactalbumin; CAS, casein; CPI, chickpea protein isolate; LPI, lupin protein isolate. 2 Values are means of 6 animals per group. 3 Values with different superscript letters differ significantly.
Disclaimer/Publisher’s Note: The statements, opinions and data contained in all publications are solely those of the individual author(s) and contributor(s) and not of MDPI and/or the editor(s). MDPI and/or the editor(s) disclaim responsibility for any injury to people or property resulting from any ideas, methods, instructions or products referred to in the content. |
© 2024 by the author. Licensee MDPI, Basel, Switzerland. This article is an open access article distributed under the terms and conditions of the Creative Commons Attribution (CC BY) license (https://creativecommons.org/licenses/by/4.0/).
Share and Cite
MDPI and ACS Style
Rubio, L.A. Dietary Milk or Isolated Legume Proteins Modulate Intestinal Microbiota Composition in Rats. Nutrients 2024, 16, 149. https://doi.org/10.3390/nu16010149
AMA Style
Rubio LA. Dietary Milk or Isolated Legume Proteins Modulate Intestinal Microbiota Composition in Rats. Nutrients. 2024; 16(1):149. https://doi.org/10.3390/nu16010149
Chicago/Turabian StyleRubio, Luis A. 2024. "Dietary Milk or Isolated Legume Proteins Modulate Intestinal Microbiota Composition in Rats" Nutrients 16, no. 1: 149. https://doi.org/10.3390/nu16010149
Note that from the first issue of 2016, this journal uses article numbers instead of page numbers. See further details here.