
Blood Microbiota Profile Is Associated with the Responsiveness of Postprandial Lipemia to Platycodi radix Beverage: A Randomized Controlled Trial in Healthy Subjects
 , ,
, ,
Abstract
:1. Introduction
2. Materials and Methods
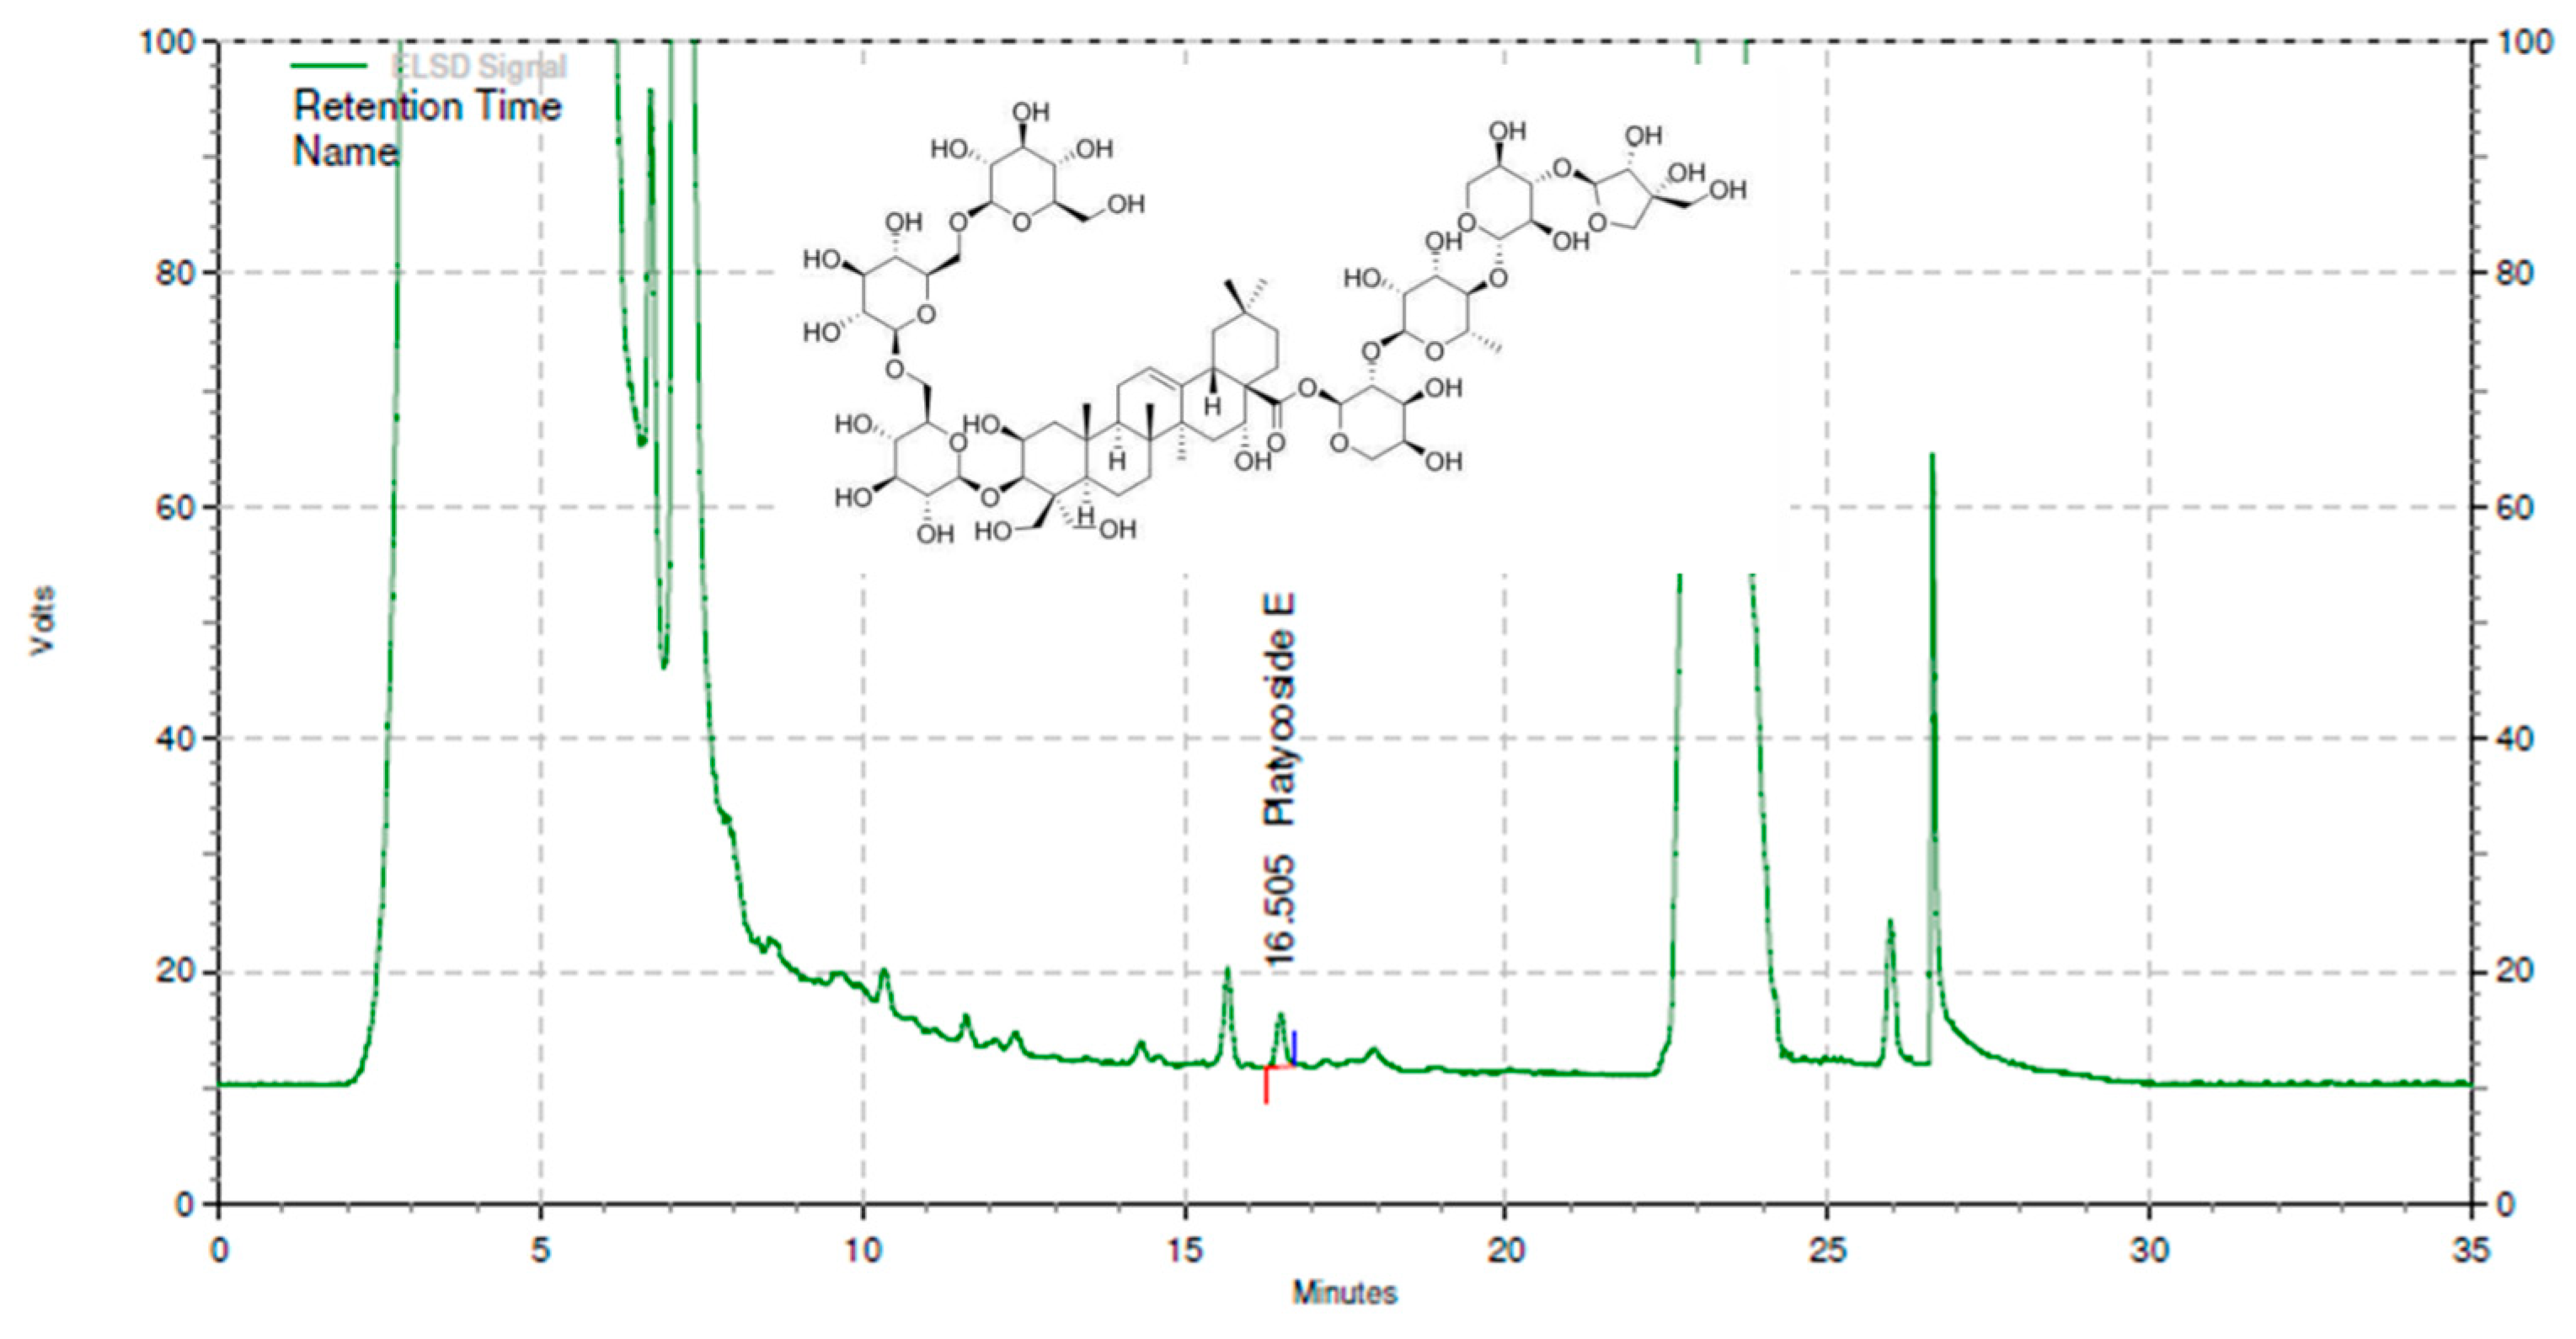
2.1. Test Material
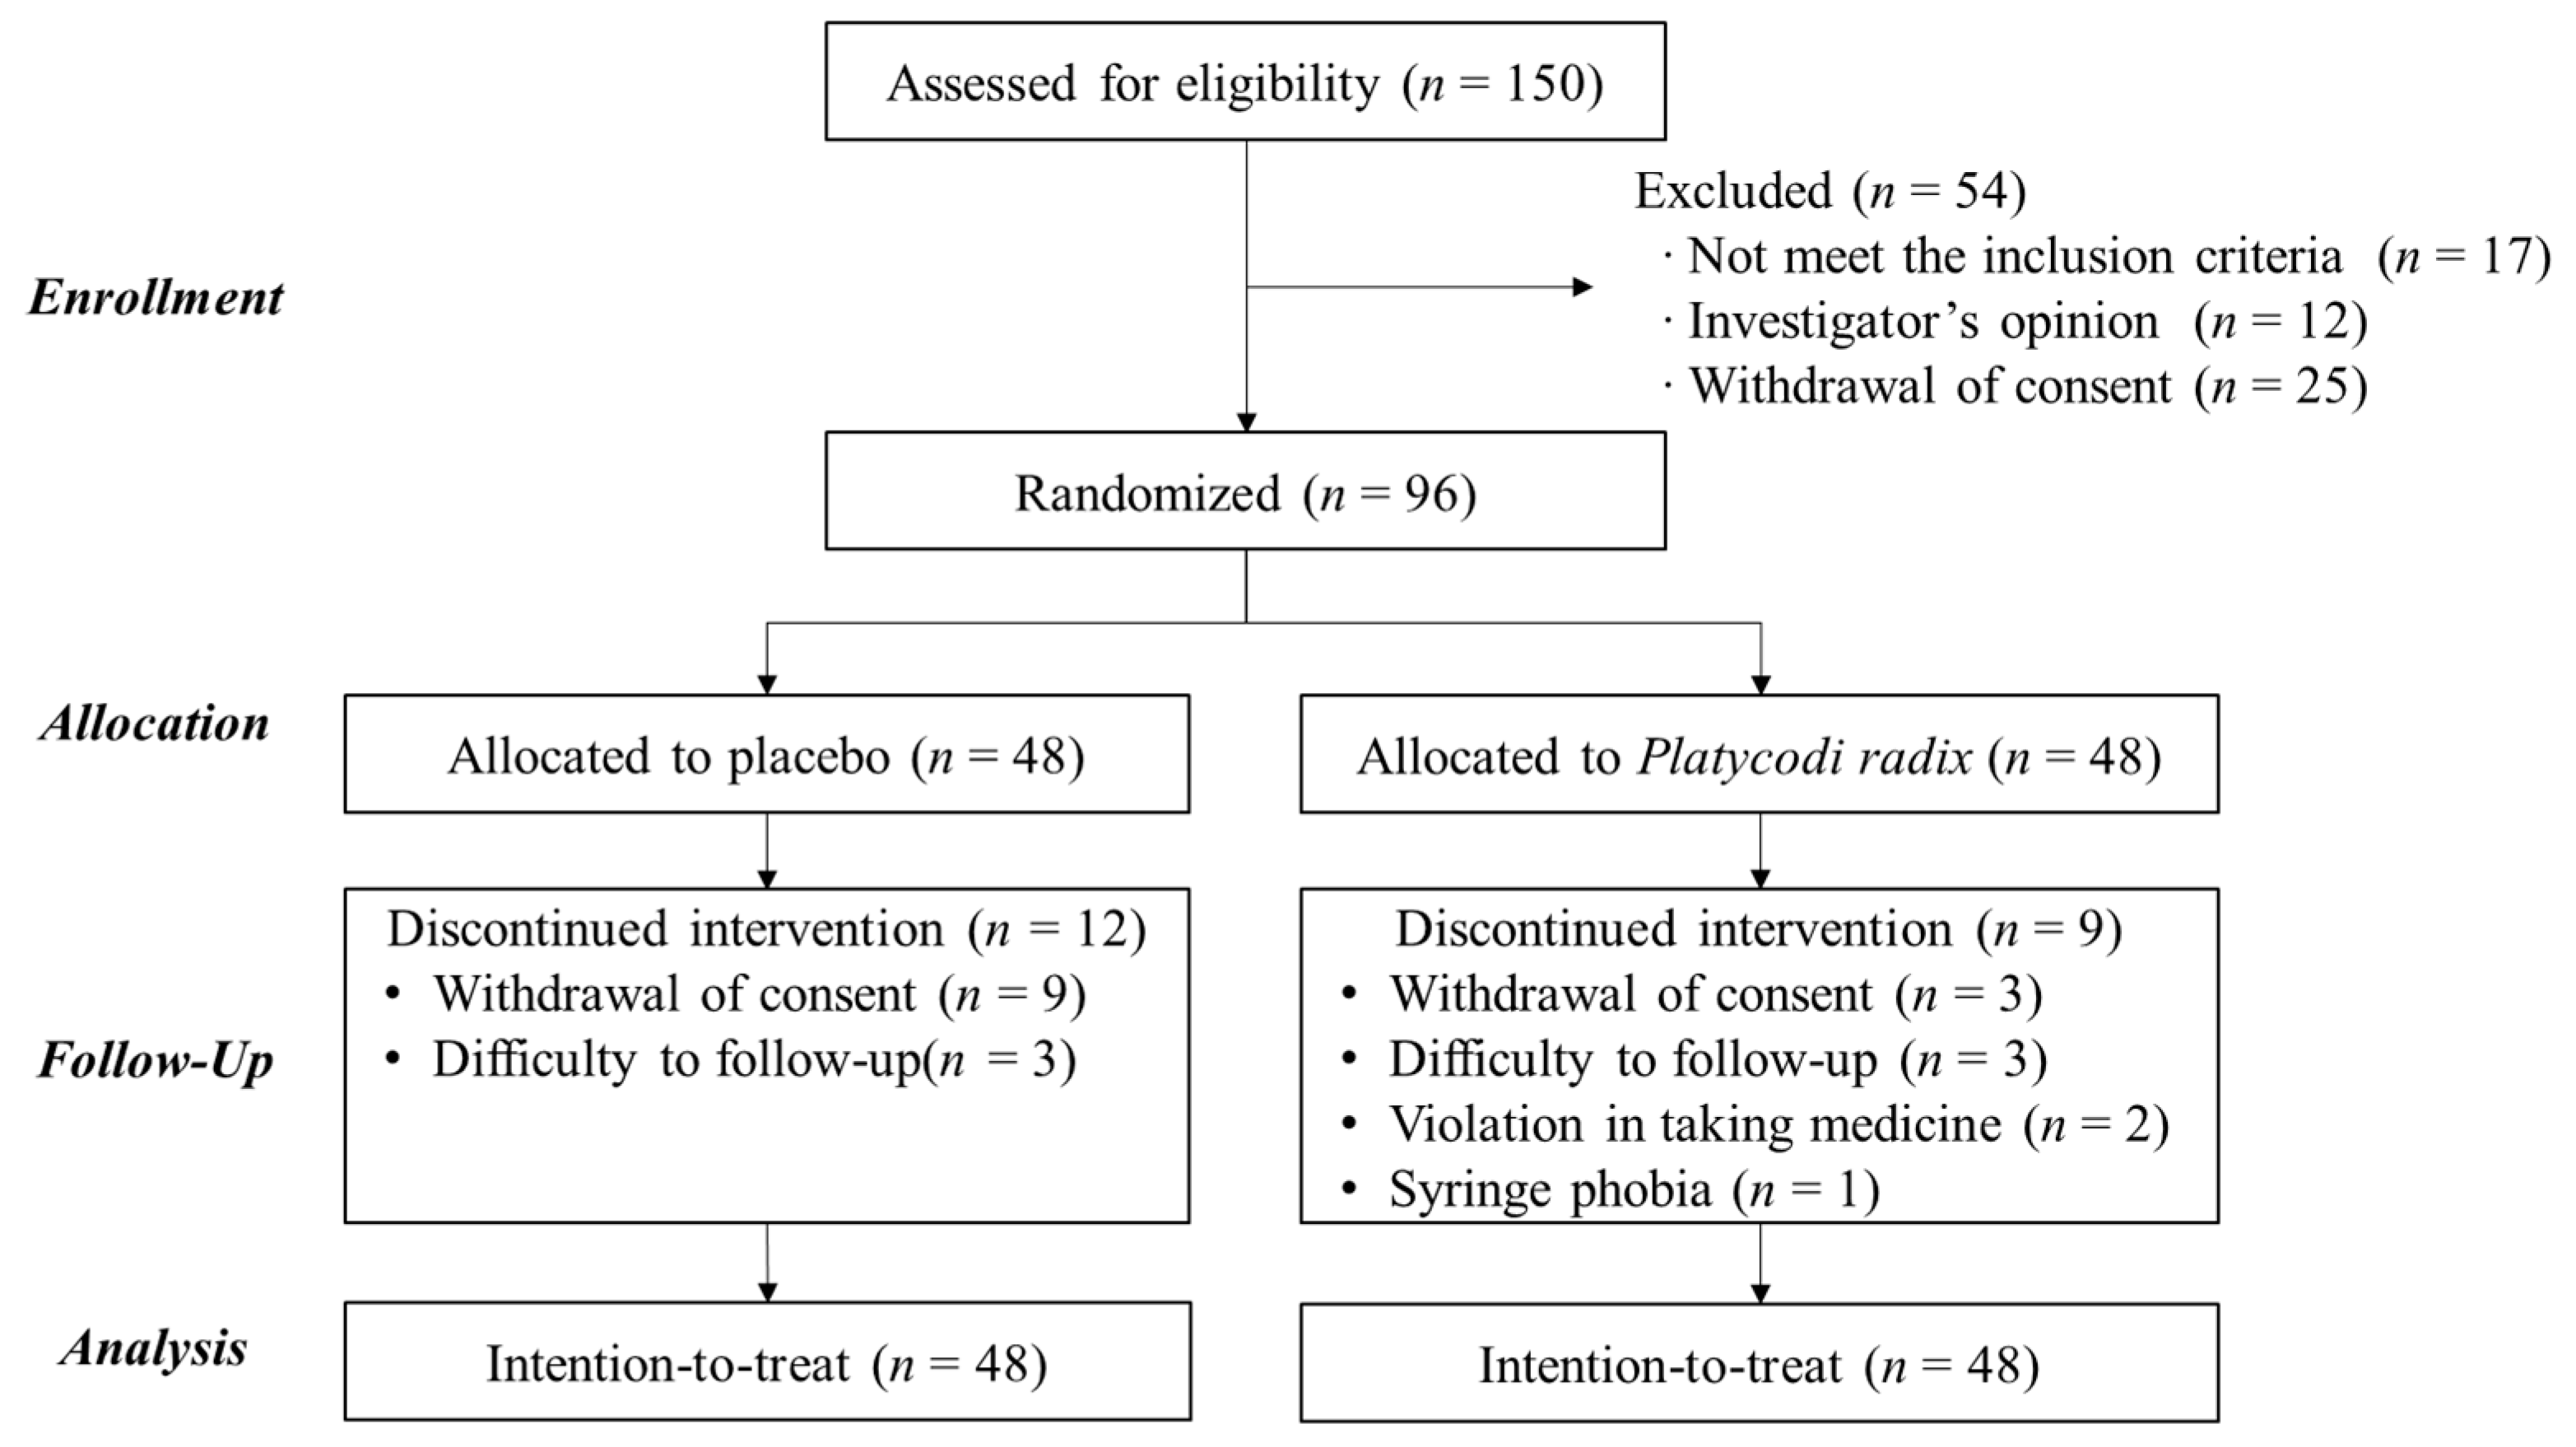
2.2. Participants
2.3. Clinical Trial Design
2.4. Biochemical Analyses
2.5. DNA Extraction from Plasma Samples
2.6. 16S Amplicon Sequencing and Taxonomic Assignments
2.7. Statistical Analyses
3. Results
3.1. Baseline Characteristics of the Participants
3.2. Effects of PR on the Alterations in Postprandial TRL Clearance
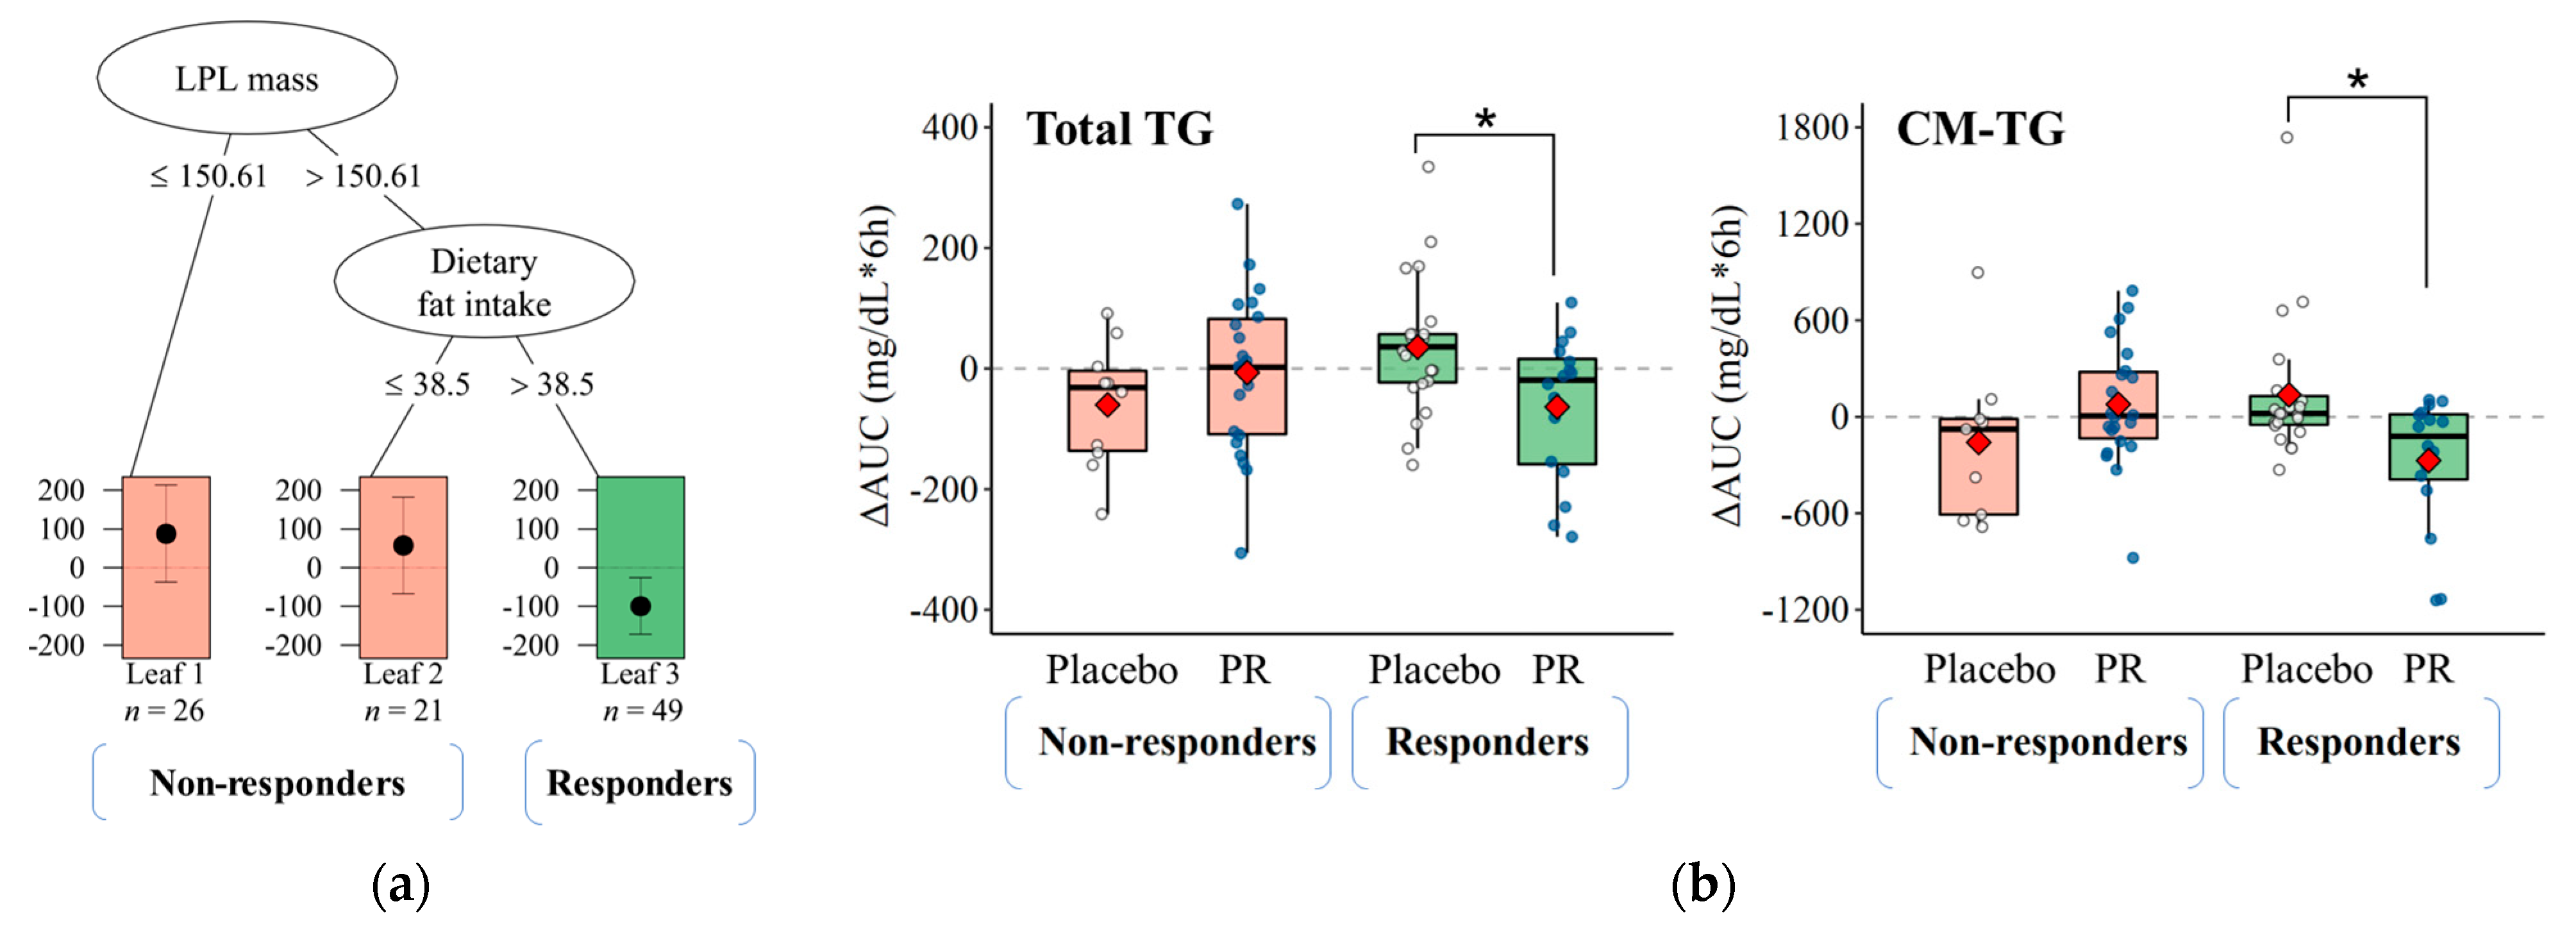
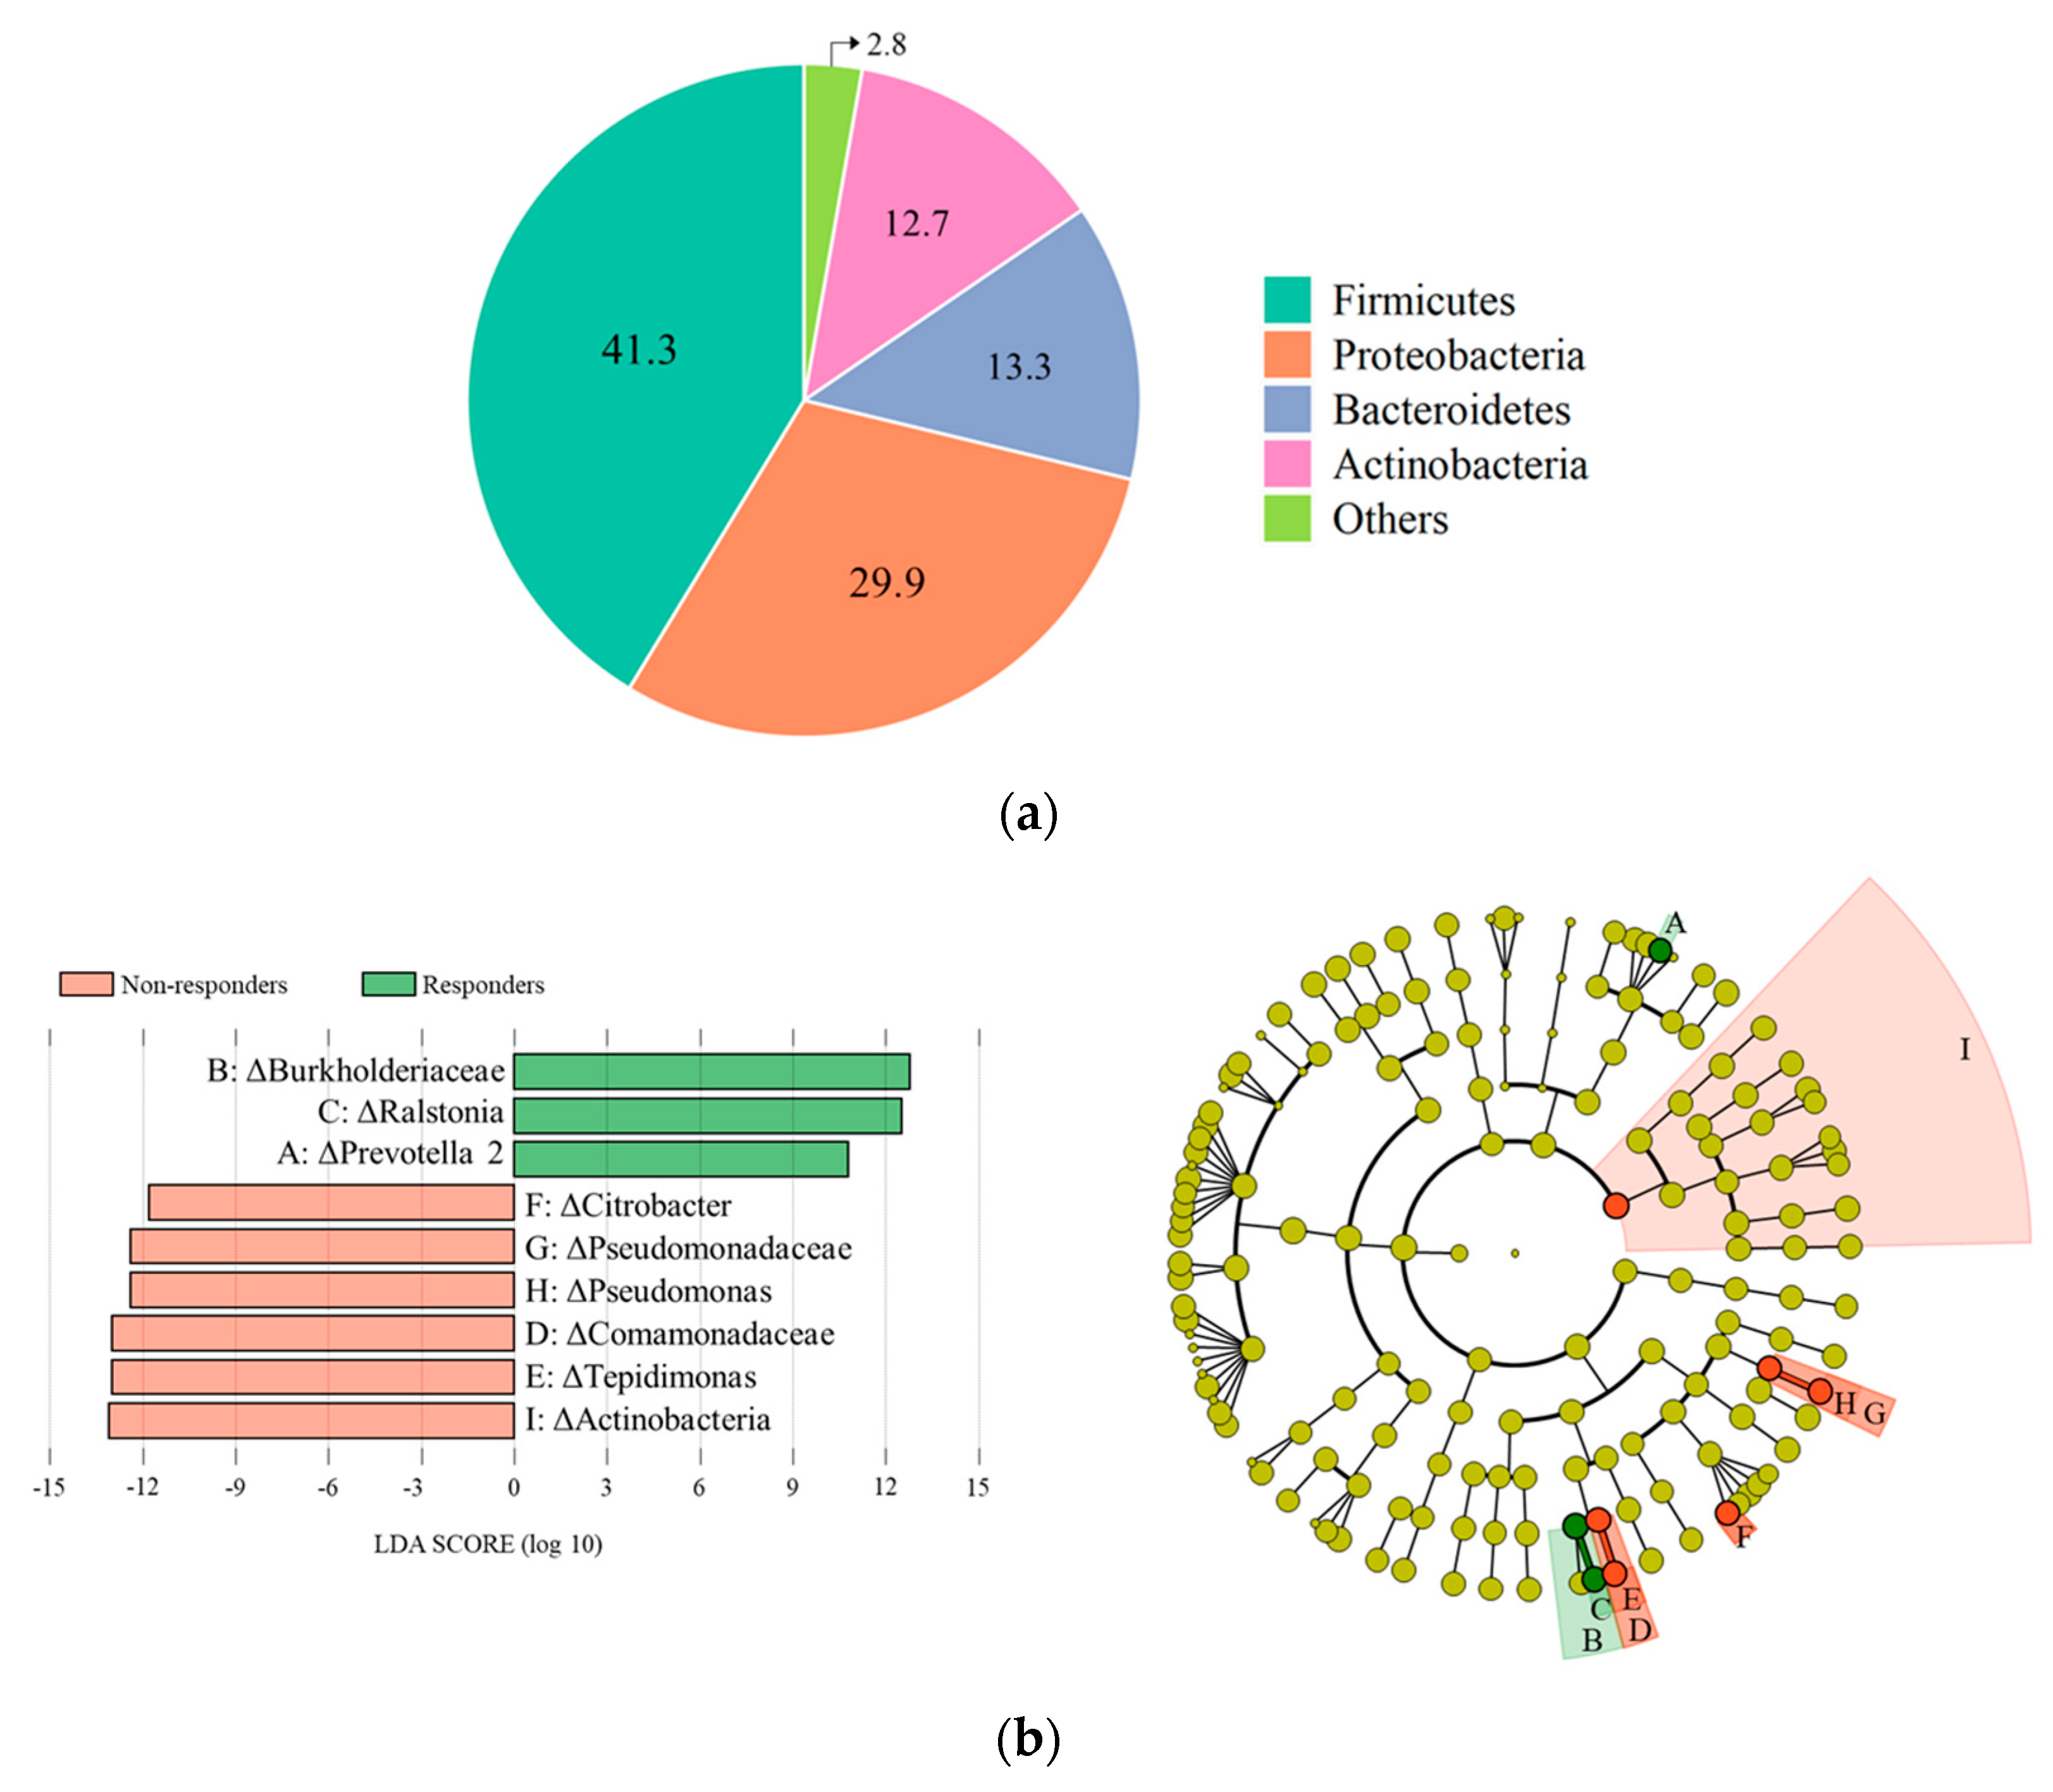
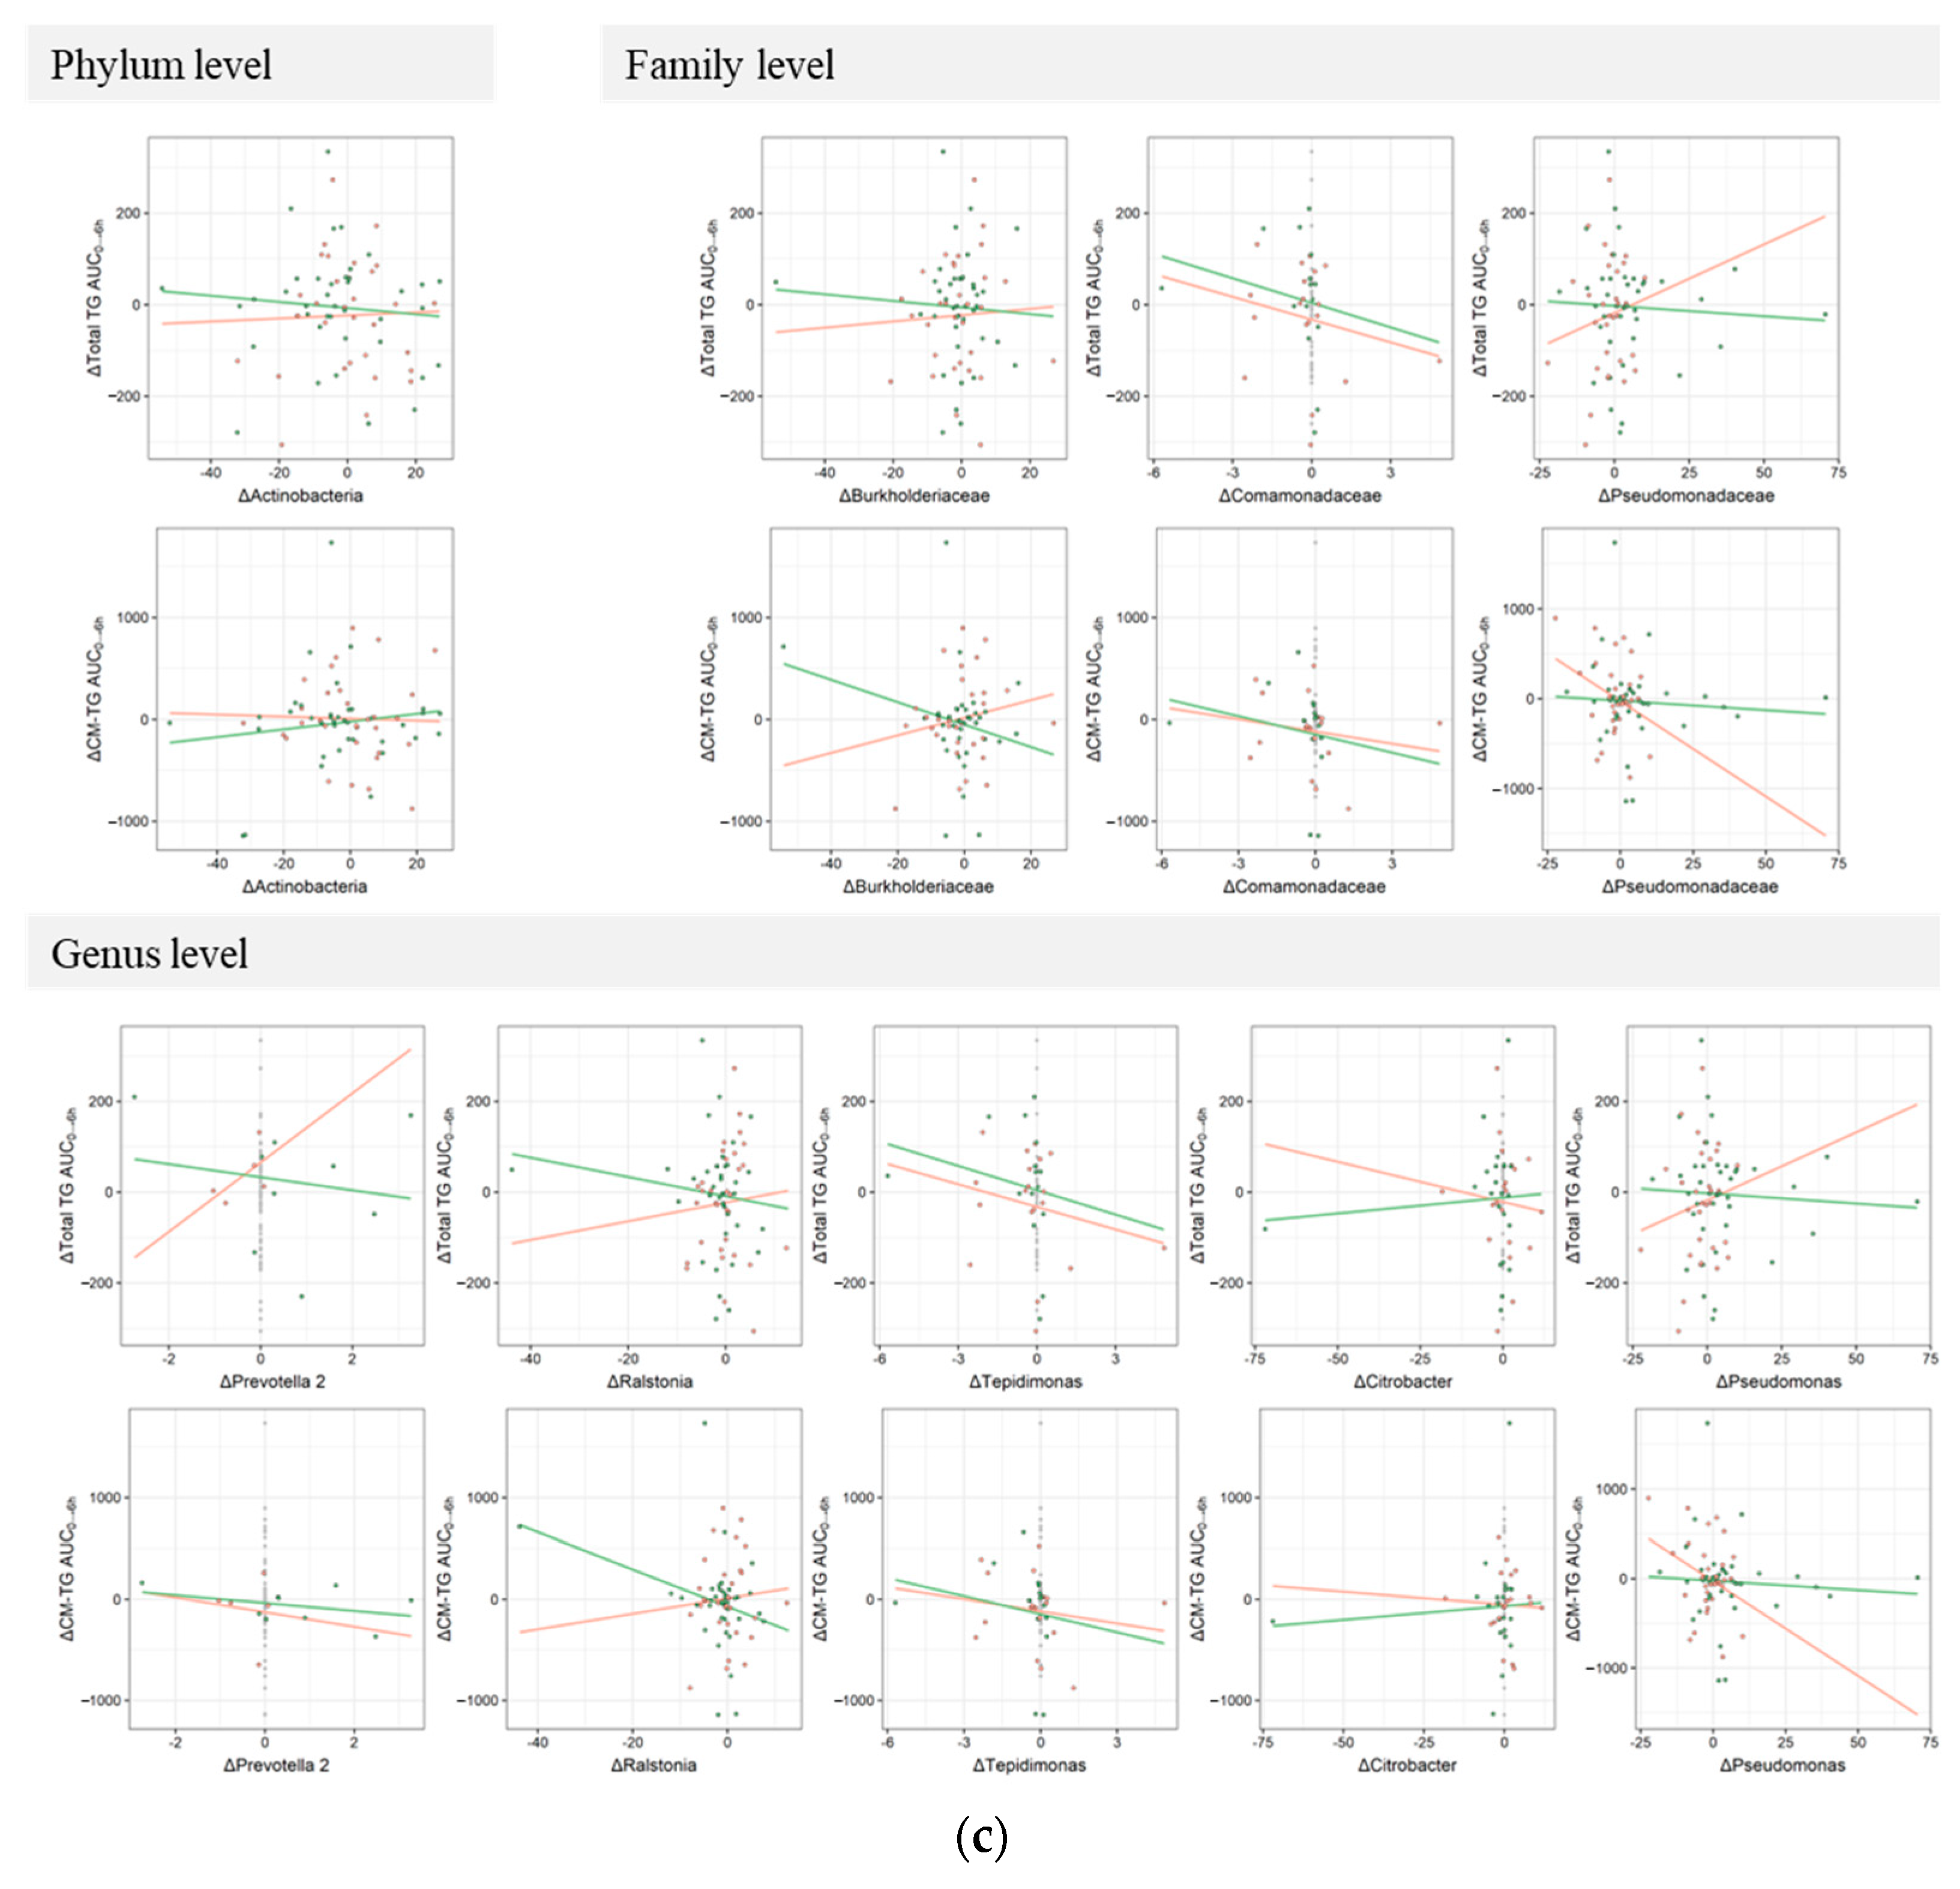
3.3. Responsiveness to Treatment on Postprandial TRL Clearance and Changes in Blood Microbiota Profiles
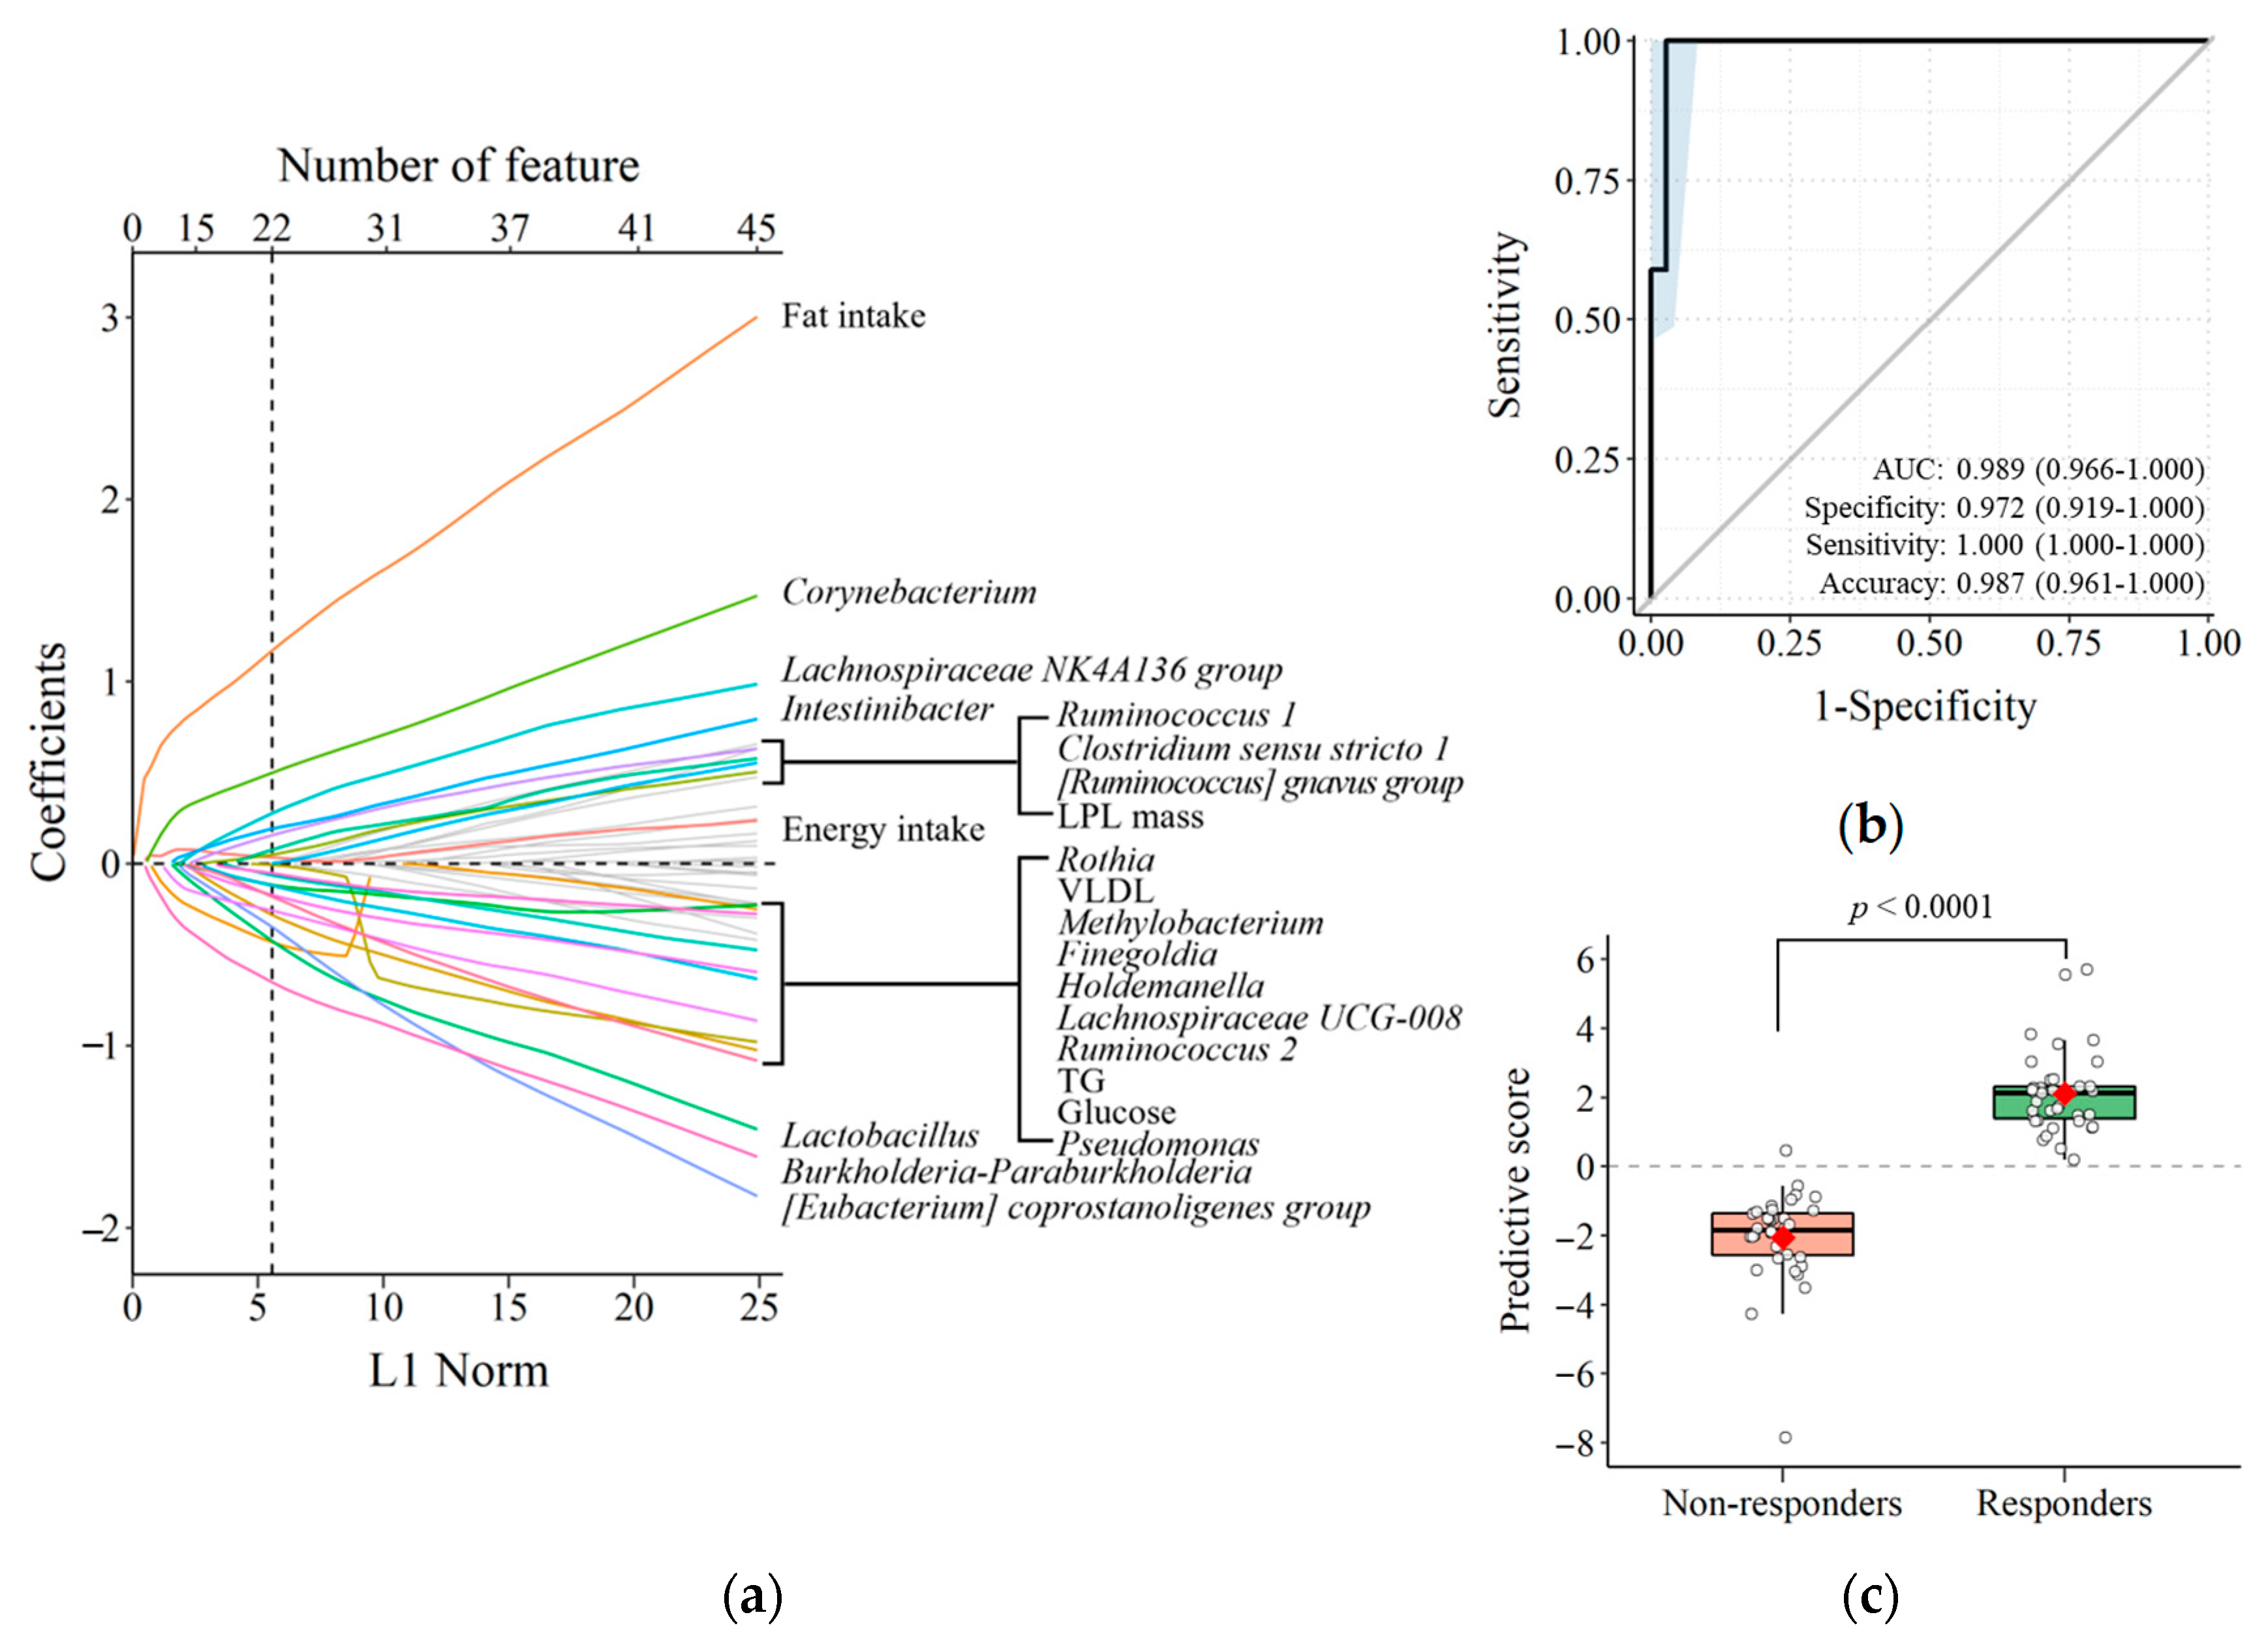
3.4. Predicting TRL Clearance Based on Background Characteristics
4. Discussion
Supplementary Materials
Author Contributions
Funding
Institutional Review Board Statement
Informed Consent Statement
Data Availability Statement
Conflicts of Interest
References
- World Health Organization. Cardiovascular Diseases (Cvds). Available online: https://www.who.int/news-room/fact-sheets/detail/cardiovascular-diseases-(cvds) (accessed on 11 June 2021).
- Stein, E.A.; Raal, F.J. Targeting ldl: Is lower better and is it safe? Best Pract. Res. Clin. Endocrinol. Metab. 2014, 28, 309–324. [Google Scholar] [CrossRef] [PubMed]
- Montserrat-de la Paz, S.; Bermudez, B.; Cardelo, M.P.; Lopez, S.; Abia, R.; Muriana, F.J. Olive oil and postprandial hyperlipidemia: Implications for atherosclerosis and metabolic syndrome. Food Funct. 2016, 7, 4734–4744. [Google Scholar] [CrossRef] [PubMed] [Green Version]
- Jackson, K.G.; Poppitt, S.D.; Minihane, A.M. Postprandial lipemia and cardiovascular disease risk: Interrelationships between dietary, physiological and genetic determinants. Atherosclerosis 2012, 220, 22–33. [Google Scholar] [CrossRef]
- Nakajima, K.; Nakano, T.; Moon, H.D.; Nagamine, T.; Stanhope, K.L.; Havel, P.J.; Warnick, G.R. The correlation between tg vs. remnant lipoproteins in the fasting and postprandial plasma of 23 volunteers. Clin. Chim. Acta 2009, 404, 124–127. [Google Scholar] [CrossRef] [PubMed] [Green Version]
- Xenoulis, P.G.; Steiner, J.M. Canine hyperlipidaemia. J. Small Anim. Pract. 2015, 56, 595–605. [Google Scholar] [CrossRef] [PubMed] [Green Version]
- Proctor, S.D.; Vine, D.F.; Mamo, J.C. Arterial retention of apolipoprotein b(48)- and b(100)-containing lipoproteins in atherogenesis. Curr. Opin. Lipidol. 2002, 13, 461–470. [Google Scholar] [CrossRef]
- Bentley, C.; Hathaway, N.; Widdows, J.; Bejta, F.; De Pascale, C.; Avella, M.; Wheeler-Jones, C.P.; Botham, K.M.; Lawson, C. Influence of chylomicron remnants on human monocyte activation in vitro. Nutr. Metab. Cardiovasc. Dis. 2011, 21, 871–878. [Google Scholar] [CrossRef] [Green Version]
- Trautwein, E.A.; McKay, S. The role of specific components of a plant-based diet in management of dyslipidemia and the impact on cardiovascular risk. Nutrients 2020, 12, 2671. [Google Scholar] [CrossRef]
- Nyakudya, E.; Jeong, J.H.; Lee, N.K.; Jeong, Y.S. Platycosides from the roots of platycodon grandiflorum and their health benefits. Prev. Nutr. Food Sci. 2014, 19, 59–68. [Google Scholar] [CrossRef]
- Zhang, L.; Wang, Y.; Yang, D.; Zhang, C.; Zhang, N.; Li, M.; Liu, Y. Platycodon grandiflorus—An ethnopharmacological, phytochemical and pharmacological review. J. Ethnopharmacol. 2015, 164, 147–161. [Google Scholar] [CrossRef]
- Choi, Y.; Choi, S.; Han, X.; Men, X.; Jang, G.; Kwon, H.; Park, B.; Kim, J.; Lee, O.H. Validation of analytical method for platycoside e and platycodin d in fermented platycodon grandiflorum root extract. J. Agric. Life Environ. Sci. 2020, 32, 116–126. [Google Scholar]
- Lee, H.; Lim, Y.; Park, S.Y.; Cho, S.M.; Choe, J.S.; Jeong, S.; Kwak, J.S.; Kwon, O. Platycodi radix beverage ameliorates postprandial lipemia response through lipid clearance of triglyceride-rich lipoprotein: A randomized controlled study in healthy subjects with a high-fat load. Nutr. Res. Pract. 2018, 12, 371–377. [Google Scholar] [CrossRef] [PubMed]
- Illiano, P.; Brambilla, R.; Parolini, C. The mutual interplay of gut microbiota, diet and human disease. FEBS J. 2020, 287, 833–855. [Google Scholar] [CrossRef] [PubMed] [Green Version]
- Guinane, C.M.; Cotter, P.D. Role of the gut microbiota in health and chronic gastrointestinal disease: Understanding a hidden metabolic organ. Therap. Adv. Gastroenterol. 2013, 6, 295–308. [Google Scholar] [CrossRef] [Green Version]
- Nikkari, S.; McLaughlin, I.J.; Bi, W.; Dodge, D.E.; Relman, D.A. Does blood of healthy subjects contain bacterial ribosomal DNA? J. Clin. Microbiol. 2001, 39, 1956–1959. [Google Scholar] [CrossRef] [Green Version]
- Velmurugan, G.; Dinakaran, V.; Rajendhran, J.; Swaminathan, K. Blood microbiota and circulating microbial metabolites in diabetes and cardiovascular disease. Trends Endocrinol. Metab. 2020, 31, 835–847. [Google Scholar] [CrossRef]
- Kim, J.Y.; Yang, Y.J.; Yang, Y.K.; Oh, S.Y.; Hong, Y.C.; Lee, E.K.; Kwon, O. Diet quality scores and oxidative stress in korean adults. Eur. J. Clin. Nutr. 2011, 65, 1271–1278. [Google Scholar] [CrossRef] [Green Version]
- Kris-Etherton, P.; Eissenstat, B.; Jaax, S.; Srinath, U.; Scott, L.; Rader, J.; Pearson, T. Validation for medficts, a dietary assessment instrument for evaluating adherence to total and saturated fat recommendations of the national cholesterol education program step 1 and step 2 diets. J. Am. Diet. Assoc. 2001, 101, 81–86. [Google Scholar] [CrossRef]
- Lim, Y.; Song, T.J.; Hwang, W.; Kim, J.Y.; Lee, D.; Kim, Y.J.; Kwon, O. Synergistic effects of sanghuang(-)danshen bioactives on arterial stiffness in a randomized clinical trial of healthy smokers: An integrative approach to in silico network analysis. Nutrients 2019, 11, 108. [Google Scholar] [CrossRef] [Green Version]
- Tsai, M.Y.; Georgopoulos, A.; Otvos, J.D.; Ordovas, J.M.; Hanson, N.Q.; Peacock, J.M.; Arnett, D.K. Comparison of ultracentrifugation and nuclear magnetic resonance spectroscopy in the quantification of triglyceride-rich lipoproteins after an oral fat load. Clin. Chem. 2004, 50, 1201–1204. [Google Scholar] [CrossRef] [Green Version]
- Rognes, T.; Flouri, T.; Nichols, B.; Quince, C.; Mahé, F. Vsearch: A versatile open source tool for metagenomics. PeerJ 2016, 4, e2584. [Google Scholar] [CrossRef] [PubMed] [Green Version]
- Herman, E.; Strang, G.; Radulovich, W.; Rutter, E.A.; Smith, D.; Messer, K.R.; Mulzet, A.K.; Bila, N.V.; Boyd, S.J.; Debnath, J. Calculus Volume 2; OpenStax: Houston, TX, USA, 2016; Volume 2, pp. 318–319. [Google Scholar]
- Dusseldorp, E.; Van Mechelen, I. Qualitative interaction trees: A tool to identify qualitative treatment-subgroup interactions. Stat. Med. 2014, 33, 219–237. [Google Scholar] [CrossRef] [PubMed]
- Dusseldorp, E.; Doove, L.; Mechelen, I. Quint: An r package for the identification of subgroups of clients who differ in which treatment alternative is best for them. Behav. Res. Methods 2016, 48, 650–663. [Google Scholar] [CrossRef] [Green Version]
- Tiihonen, K.; Rautonen, N.; Alhoniemi, E.; Ahotupa, M.; Stowell, J.; Vasankari, T. Postprandial triglyceride response in normolipidemic, hyperlipidemic and obese subjects—The influence of polydextrose, a non-digestible carbohydrate. Nutr. J. 2015, 14, 23. [Google Scholar] [CrossRef] [Green Version]
- Lopez-Miranda, J.; Williams, C.; Lairon, D. Dietary, physiological, genetic and pathological influences on postprandial lipid metabolism. Br. J. Nutr. 2007, 98, 458–473. [Google Scholar] [CrossRef] [PubMed] [Green Version]
- Dubois, C.; Beaumier, G.; Juhel, C.; Armand, M.; Portugal, H.; Pauli, A.M.; Borel, P.; Latge, C.; Lairon, D. Effects of graded amounts (0–50 g) of dietary fat on postprandial lipemia and lipoproteins in normolipidemic adults. Am. J. Clin. Nutr. 1998, 67, 31–38. [Google Scholar] [CrossRef] [PubMed] [Green Version]
- Zhang, Z.; Seibold, H.; Vettore, M.V.; Song, W.J.; Francois, V. Subgroup identification in clinical trials: An overview of available methods and their implementations with r. Ann. Transl. Med. 2018, 6, 122. [Google Scholar] [CrossRef]
- Zhao, H.L.; Kim, Y.S. Determination of the kinetic properties of platycodin d for the inhibition of pancreatic lipase using a 1,2-diglyceride-based colorimetric assay. Arch. Pharmacal Res. 2004, 27, 968–972. [Google Scholar] [CrossRef]
- Zhan, Q.; Zhang, F.; Gao, S.H.; Cai, F.; Jiang, B.; Sun, L.N.; Chen, W.S. An hplc-ms/ms method for the quantitative determination of platycodin d in rat plasma and its application to the pharmacokinetics of platycodi radix extract. Chin. J. Nat. Med. 2014, 12, 154–160. [Google Scholar] [CrossRef]
- Kim, Y.; Kim, Y.; Hwang, J.; van den Broek, T.J.; Oh, B.; Kim, J.Y.; Wopereis, S.; Bouwman, J.; Kwon, O. A machine learning algorithm for quantitatively diagnosing oxidative stress risks in healthy adult individuals based on health space methodology: A proof-of-concept study using korean cross-sectional cohort data. Antioxidants 2021, 10, 1132. [Google Scholar] [CrossRef]
- Vabalas, A.; Gowen, E.; Poliakoff, E.; Casson, A.J. Machine learning algorithm validation with a limited sample size. PLoS ONE 2019, 14, e0224365. [Google Scholar] [CrossRef] [PubMed]
- Steyerberg, E.W.; Harrell, F.E., Jr.; Borsboom, G.J.; Eijkemans, M.J.; Vergouwe, Y.; Habbema, J.D. Internal validation of predictive models: Efficiency of some procedures for logistic regression analysis. J. Clin. Epidemiol. 2001, 54, 774–781. [Google Scholar] [CrossRef]
- Carter, J.V.; Pan, J.; Rai, S.N.; Galandiuk, S. Roc-ing along: Evaluation and interpretation of receiver operating characteristic curves. Surgery 2016, 159, 1638–1645. [Google Scholar] [CrossRef] [PubMed]
- Crovesy, L.; Masterson, D.; Rosado, E.L. Profile of the gut microbiota of adults with obesity: A systematic review. Eur. J. Clin. Nutr. 2020, 74, 1251–1262. [Google Scholar] [CrossRef] [PubMed]
- Vientos-Plotts, A.I.; Ericsson, A.C.; Rindt, H.; Grobman, M.E.; Graham, A.; Bishop, K.; Cohn, L.A.; Reinero, C.R. Dynamic changes of the respiratory microbiota and its relationship to fecal and blood microbiota in healthy young cats. PLoS ONE 2017, 12, e0173818. [Google Scholar] [CrossRef] [PubMed]
- Su, X.; Liu, Y.; Han, L.; Wang, Z.; Cao, M.; Wu, L.; Jiang, W.; Meng, F.; Guo, X.; Yu, N.; et al. A candidate gene identified in converting platycoside e to platycodin d from platycodon grandiflorus by transcriptome and main metabolites analysis. Sci. Rep. 2021, 11, 9810. [Google Scholar] [CrossRef] [PubMed]


| Variables | Placebo (n = 48) | PR (n = 48) | p-Value 1 |
|---|---|---|---|
| Age (years) | 30.1 ± 1.6 | 29.8 ± 1.4 | 0.881 |
| Sex (male/female, n) | 18/30 | 18/30 | 1.000 |
| Body weight (kg) | 66.1 ± 1.5 | 63.0 ± 1.5 | 0.141 |
| Height (cm) | 167.4 ± 1.2 | 165.8 ± 1.4 | 0.381 |
| Waist circumference (cm) | 78.7 ± 1.1 | 76.2 ± 1.1 | 0.127 |
| BMI (kg/m2) | 23.5 ± 0.3 | 22.8 ± 0.3 | 0.159 |
| SBP (mmHg) | 117.3 ± 1.6 | 117.6 ± 1.6 | 0.867 |
| DBP (mmHg) | 72.1 ± 1.1 | 73.4 ± 1.2 | 0.432 |
| Pulse rate (beats/min) | 83.2 ± 1.5 | 84.7 ± 1.7 | 0.518 |
| TG (mg/dL) | 114.4 ± 11.0 | 102.8 ± 5.9 | 0.354 |
| Total cholesterol (mg/dL) | 187.4 ± 5.3 | 182.8 ± 4.5 | 0.507 |
| LPL mass (ng/dL) | 771.9 ± 257.5 | 635.5 ± 206.4 | 0.680 |
| CM (mg/dL) | 155.0 ± 31.5 | 125.5 ± 21.2 | 0.439 |
| VLDL (mg/dL) | 36.2 ± 4.3 | 43.0 ± 4.2 | 0.258 |
| LDL (mg/dL) | 116.1 ± 4.4 | 113.6 ± 4.3 | 0.686 |
| HDL (mg/dL) | 66.1 ± 2.4 | 65.9 ± 2.4 | 0.951 |
| Smoker (n, %) | 7 (7.29) | 10 (10.42) | 0.423 |
| Alcohol drinker (n, %) | 29 (30.21) | 26 (27.08) | 0.536 |
| Physical activity (MET min/week) | 1703.2 ± 228.0 | 1751.0 ± 298.5 | 0.899 |
| Dietary fat intake (g/day) | 46.0 ± 2.4 | 46.8 ± 2.0 | 0.809 |
| RFS | 16.0 ± 1.1 | 15.3 ± 1.0 | 0.610 |
| MEDFICTS | 50.0 ± 3.1 | 45.8 ± 2.5 | 0.291 |
| Variables | Placebo | PR | β 2 | p-Value | ||||||
|---|---|---|---|---|---|---|---|---|---|---|
| Baseline (n = 48) | Endpoint (n = 36) | β 1 | p-Value | Baseline (n = 48) | Endpoint (n = 39) | β | p-Value | |||
| Total TG (mg/dL × 3 h) | 28.0 ± 6.6 | 40.1 ± 8.7 | 12.1 | 0.126 | 43.6 ± 6.4 | 31.1 ± 8.4 | −12.4 | 0.098 | −24.6 | 0.025 |
| CM-TG (mg/dL × 3 h) | 44.8 ± 16.0 | 63.4 ± 19.8 | 18.6 | 0.431 | 91.4 ± 15.3 | 41.9 ± 18.2 | −49.5 | 0.025 | −68.1 | 0.036 |
| VLDL-TG (mg/dL × 3 h) | 16.2 ± 3.3 | 12.5 ± 3.4 | −3.7 | 0.415 | 9.5 ± 3.2 | 8.1 ± 3.2 | −1.4 | 0.747 | 2.3 | 0.716 |
| LPL mass (ng/mL × 3 h) | 39.5 ± 15.4 | 28.3 ± 15.7 | −11.1 | 0.451 | 32.9 ± 15.0 | 44.4 ± 15.1 | 11.5 | 0.418 | 22.6 | 0.270 |
| Total TG (mg/dL × 6 h) | 171.1 ± 20.0 | 185.0 ± 25.5 | 13.9 | 0.520 | 208.0 ± 19.6 | 177.0 ± 24.7 | −31.1 | 0.130 | −44.9 | 0.132 |
| CM-TG (mg/dL × 6 h) | 334.6 ± 60.8 | 357.4 ± 66.2 | 22.8 | 0.763 | 387.7 ± 58.3 | 310.9 ± 61.0 | −76.8 | 0.274 | −99.7 | 0.335 |
| VLDL-TG (mg/dL × 6 h) | 51.0 ± 8.8 | 51.6 ± 11.1 | 0.6 | 0.965 | 33.6 ± 8.7 | 32.4 ± 10.5 | −1.2 | 0.928 | −1.8 | 0.925 |
| LPL mass (ng/mL × 6 h) | 98.6 ± 43.0 | 105.1 ± 42.7 | 6.6 | 0.877 | 105.5 ± 42.0 | 128.5 ± 41.2 | 23.0 | 0.573 | 16.5 | 0.779 |
| BMI (kg/m2) | 23.5 ± 0.3 | 23.5 ± 0.3 | −0.03 | 0.758 | 22.8 ± 0.3 | 22.8 ± 0.3 | −0.01 | 0.906 | 0.02 | 0.888 |
| Fasting glucose (mg/dL) | 86.2 ± 1.2 | 87.1 ± 1.1 | 0.86 | 0.367 | 87.2 ± 1.2 | 85.7 ± 1.0 | −1.46 | 0.111 | −2.32 | 0.081 |
| Fasting insulin (uU/mL) | 7.44 ± 0.53 | 7.37 ± 0.60 | −0.08 | 0.877 | 7.18 ± 0.53 | 7.04 ± 0.59 | −0.14 | 0.775 | −0.06 | 0.931 |
| HOMA-IR | 1.64 ± 0.12 | 1.62 ± 0.14 | −0.02 | 0.878 | 1.56 ± 0.12 | 1.50 ± 0.13 | −0.06 | 0.585 | −0.04 | 0.787 |
Disclaimer/Publisher’s Note: The statements, opinions and data contained in all publications are solely those of the individual author(s) and contributor(s) and not of MDPI and/or the editor(s). MDPI and/or the editor(s) disclaim responsibility for any injury to people or property resulting from any ideas, methods, instructions or products referred to in the content. |
© 2023 by the authors. Licensee MDPI, Basel, Switzerland. This article is an open access article distributed under the terms and conditions of the Creative Commons Attribution (CC BY) license (https://creativecommons.org/licenses/by/4.0/).
Share and Cite
Kang, S.; Lee, I.; Park, S.-y.; Kim, J.Y.; Kim, Y.; Choe, J.-S.; Kwon, O. Blood Microbiota Profile Is Associated with the Responsiveness of Postprandial Lipemia to Platycodi radix Beverage: A Randomized Controlled Trial in Healthy Subjects. Nutrients 2023, 15, 3267. https://doi.org/10.3390/nu15143267
Kang S, Lee I, Park S-y, Kim JY, Kim Y, Choe J-S, Kwon O. Blood Microbiota Profile Is Associated with the Responsiveness of Postprandial Lipemia to Platycodi radix Beverage: A Randomized Controlled Trial in Healthy Subjects. Nutrients. 2023; 15(14):3267. https://doi.org/10.3390/nu15143267
Chicago/Turabian StyleKang, Seunghee, Inhye Lee, Soo-yeon Park, Ji Yeon Kim, Youjin Kim, Jeong-Sook Choe, and Oran Kwon. 2023. "Blood Microbiota Profile Is Associated with the Responsiveness of Postprandial Lipemia to Platycodi radix Beverage: A Randomized Controlled Trial in Healthy Subjects" Nutrients 15, no. 14: 3267. https://doi.org/10.3390/nu15143267