Article

Association between Dietary Patterns and Depression in Chinese Older Adults: A Longitudinal Study Based on CLHLS

1
Centre for Health Management and Policy Research, School of Public Health, Cheeloo College of Medicine, Shandong University, Jinan 250012, China
2
National Health Commission Key Laboratory of Health Economics and Policy Research, Cheeloo College of Medicine, Shandong University, Jinan 250012, China
3
Shandong University Center for Health Economics Experiment and Public Policy Research, Jinan 250012, China
*
Author to whom correspondence should be addressed.
Nutrients 2022, 14(24), 5230; https://doi.org/10.3390/nu14245230
Submission received: 6 October 2022 / Revised: 21 November 2022 / Accepted: 4 December 2022 / Published: 8 December 2022
(This article belongs to the Section Geriatric Nutrition)

Abstract

:
(1) Objective: This study aimed to investigate the relationship between dietary patterns and depression in Chinese older adults. (2) Method: A cohort study was conducted on the relationship between dietary patterns and the risk of depression in older adults based on the China Health and Longevity Longitudinal Survey (CLHLS) from 2011 to 2014. Exploratory factor analysis was used to identify dietary patterns. The relationship between dietary patterns and the risk of depression after four years was examined using logistic regression, and subgroup analysis was carried out to determine whether the association differed by gender. (3) Results: A total of 2873 older adults were included in our cohort study. Three dietary patterns were identified: vegetable–egg–bean–milk pattern, meat–fish pattern, and salt-preserved vegetable–garlic pattern. The vegetable–egg–beans–milk pattern was negatively correlated with the risk of geriatric depression development (adjusted OR = 0.65 (95%CI: 0.49–0.87)), and the salt-preserved vegetable–garlic pattern was positively associated with aged depression risk (adjusted OR = 1.33 (95CI: 1.00–1.77)). The meat–fish pattern was not associated with the risk of depression in older adults. These associations were consistent in both men and women. (4) Conclusions: In this cohort study, the vegetable–egg–beans–milk dietary pattern was associated with lower risk of depression, while the salt-preserved vegetable–garlic dietary pattern was associated with higher risk of depression, and there were no gender differences in these associations.

1. Introduction

Population aging has become a key social issue in China. According to the seventh National Census statistics, China’s population aged 60 and above has reached 260 million, accounting for 18.7% of the total population, with 190 million aged 65 and above accounting for 13.5% of the total population [1]. The proportion of the elderly aged 65 and above in the total population is expected to rise to around 26.9% by 2050 [2]. The health of older adults needs urgent attention in the context of aging.
Depression refers to emotional disorders centered on low mood, mainly manifesting as sadness, emptiness or irritability, accompanied by various cognitive and physical symptoms, and it is one of the common mental disorders in the elderly [3]. In China, 4.46% of the elderly suffer from depression, while 35.19% have depressive symptoms [4]. Geriatric depression has a detrimental impact on the elderly’ quality of life and raises their care demands. It also promotes suicide behavior, resulting in primary unfavorable health outcomes, bringing a significant burden to families and society [5]. Therefore, the problem of depression in the elderly cannot be overlooked.
Compared with young people, the condition of depression in the elderly is more likely to be modified by lifestyle factors [6,7]. As a modifiable lifestyle, diet is an essential determinant of old-age health and well-being [8]. Since diet can affect some physiological mechanisms underlying depression, such as inflammation, oxidative stress, brain plasticity, function and stress-response systems [9], diet may play a significant role in the onset and progression of depression.
Many studies have shown the association of certain foods or nutrients with depression [10,11,12,13,14]. However, in real life, people usually eat a diet of multiple food combinations rather than isolated nutrients or foods because the components of dietary patterns may interact with each other and produce a synergistic effect, which may more effectively control depression [15]. Previous studies have explored the relationship between some dietary patterns and depression [16,17,18,19,20,21,22,23,24]. However, diet is culturally specific, and existing studies’ conclusions may not apply to the Chinese population. At the same time, there were limited data on the association between dietary patterns and depression in China. Most relevant studies focused on adults or were limited by cross-sectional designs [21,22,23,24].
Due to the limited studies, we explored the longitudinal association between dietary patterns and the risk of depression in Chinese older adults based on the Chinese Longitudinal Health and Longevity Survey (CLHLS) cohort data from 2011 to 2014.

2. Materials and Method

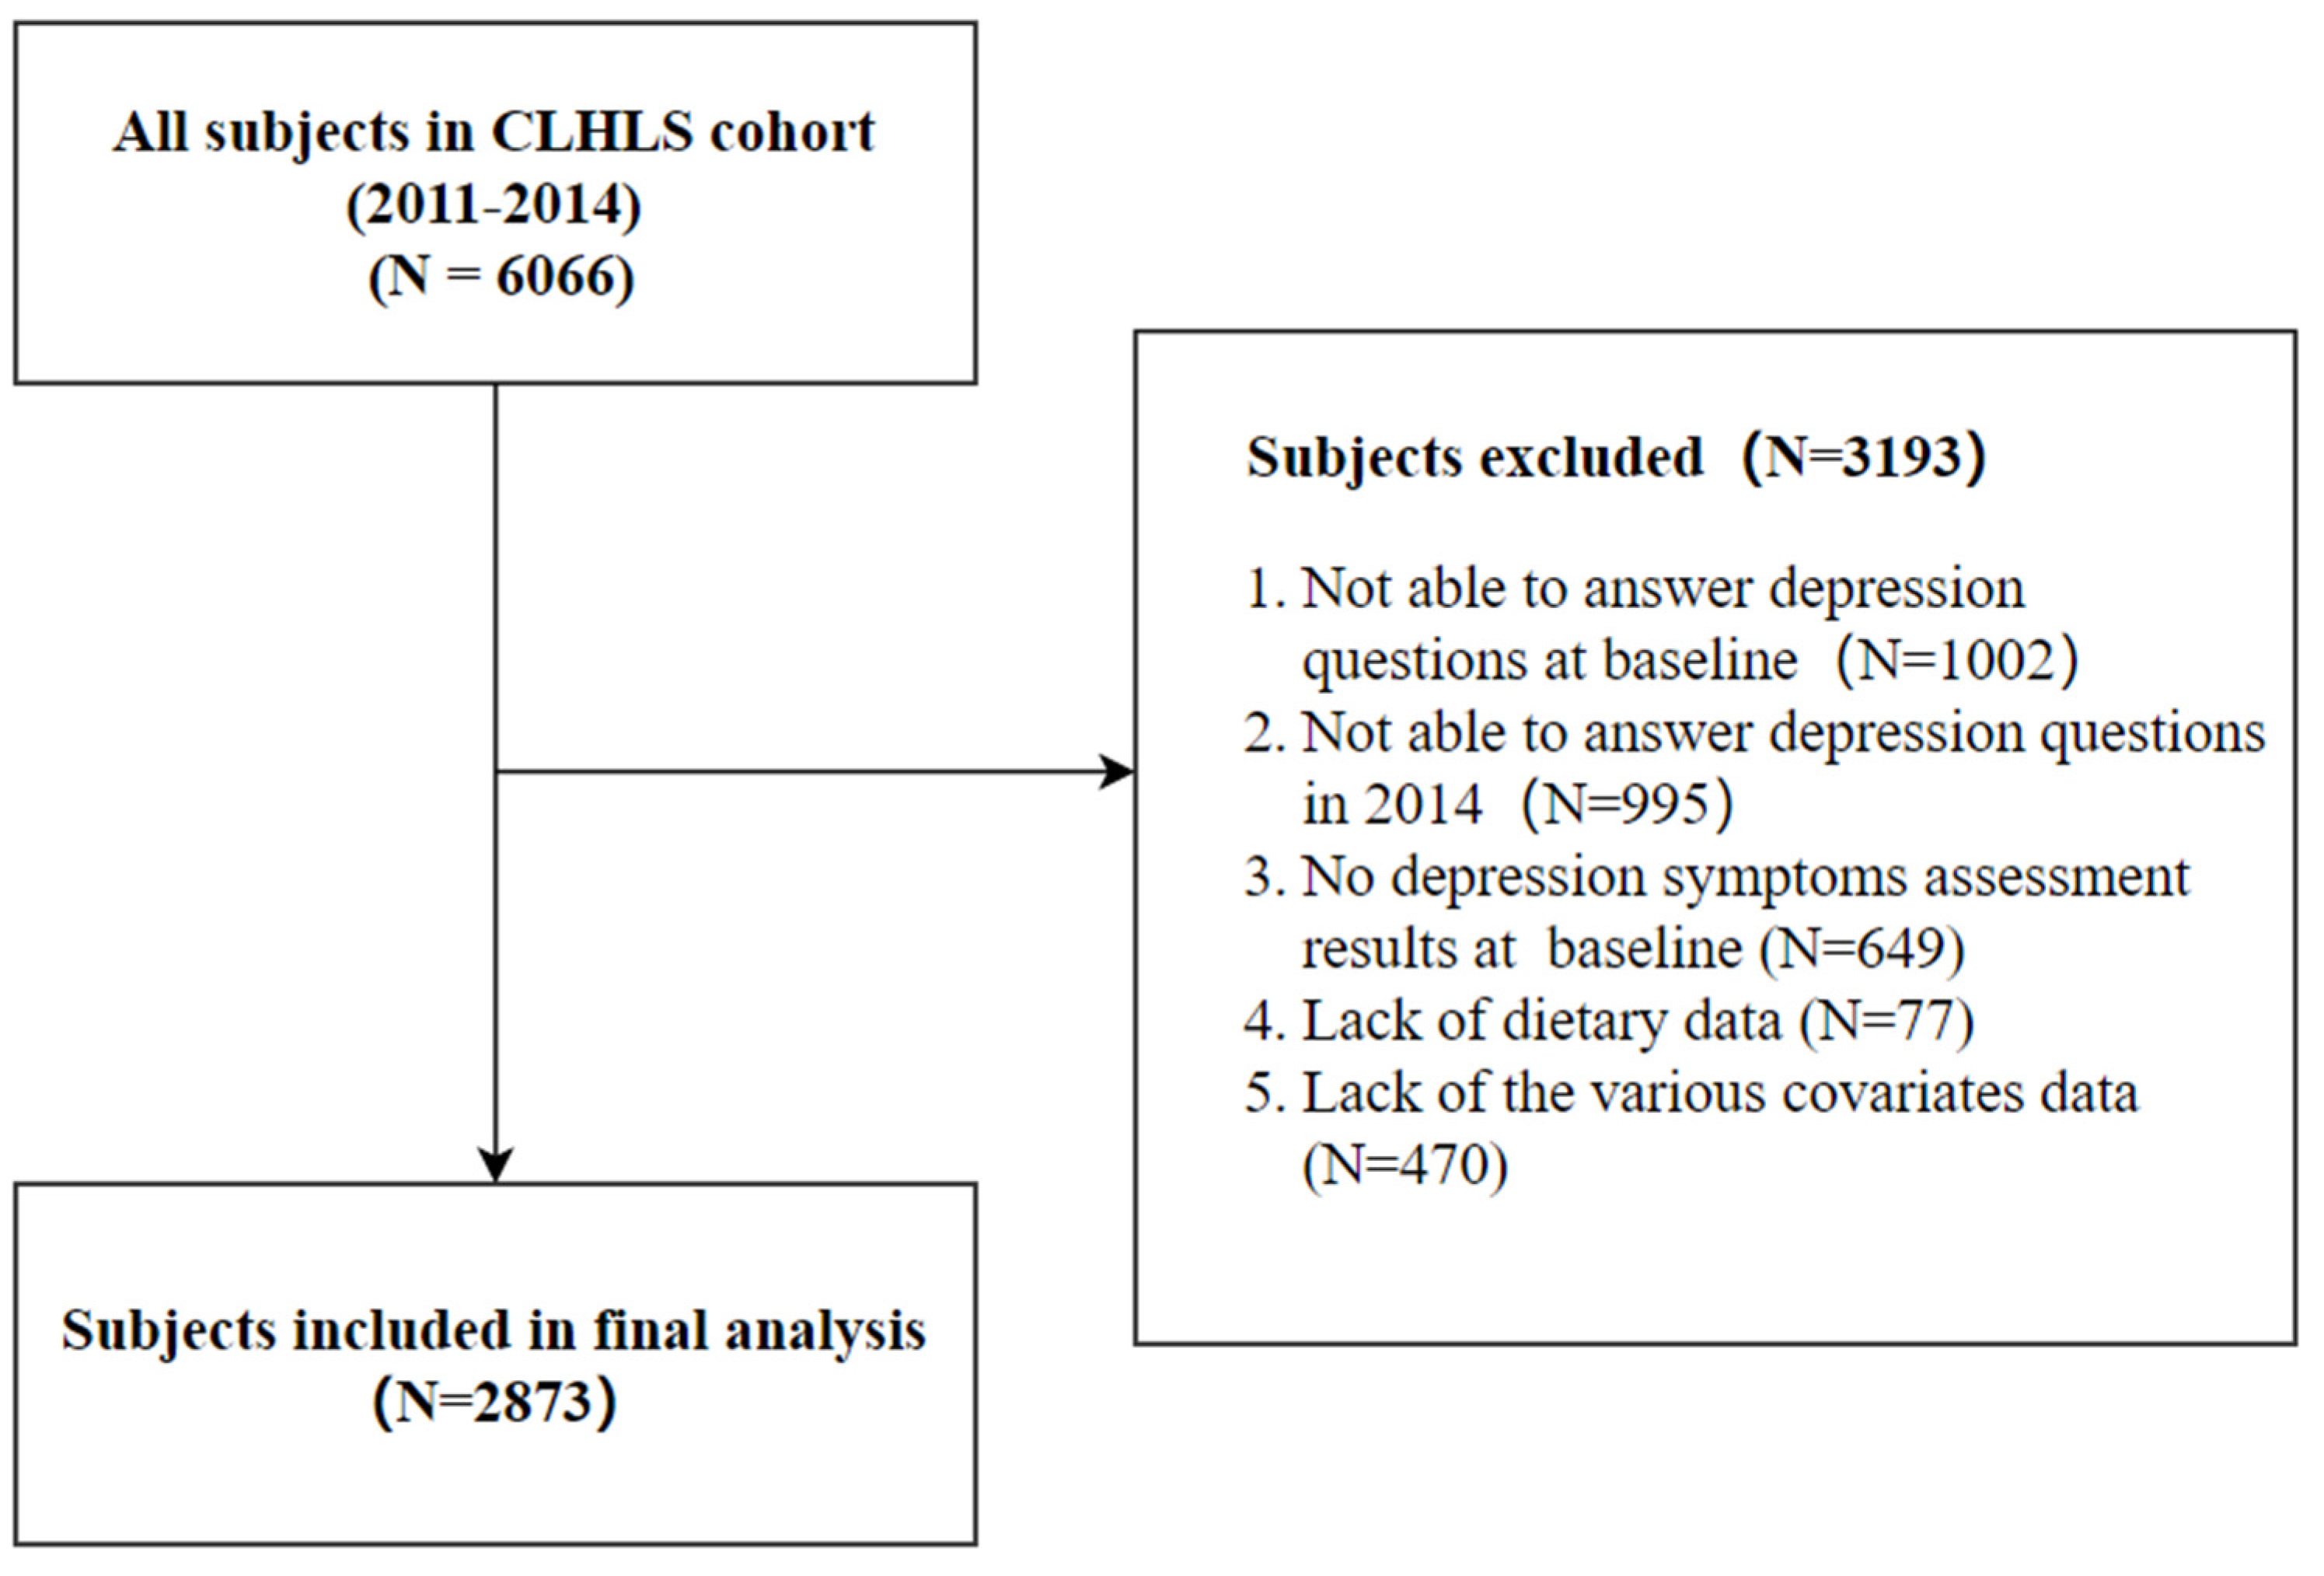
2.1. Data Source and Subjects

The data in this cohort study were derived from the Chinese Longitudinal Healthy Longevity Survey (CLHLS, 1998–2018). The CLHLS is an ongoing prospective cohort study of the elderly aged 60 years and above. A multi-stage cluster random sampling method was used to survey the elderly aged 60 and above and their adult children in 23 provinces of China. The baseline survey was conducted in 1998, followed by follow-up surveys in 2000, 2002, 2005, 2008–2009, 2011–2012, 2014 and 2017–2018.
To reflect the latest dietary patterns and depression situation of Chinese older adults in CLHLS, our cohort study utilized the data from 2011 to 2014 due to the modification of the depression scale in the 2018 CLHLS questionnaire, which resulted in the inconsistency between the 2014 and 2018 depression scales. The study included dietary-related data, depression, sociodemographic information, physical health, and some chronic disease history of the subjects in the 2011–2014 cohort [25]. After screening according to the inclusion and exclusion criteria in Figure 1, a total of 2873 subjects were finally included in this study.
All subjects signed informed consent for baseline and follow-up surveys. The project was approved by the Biomedical Ethics Committee of Peking University, China (IRB00001052-13074).

2.2. Assessment of Dietary Pattern

To determine the main dietary patterns, based on the 13 food groups in CLHLS research, we used the principal component analysis method of exploratory factor analysis, according to Kaiser’ criterion, factors with eigenvalues greater >1 were extracted, and an orthogonal transformation was performed to rotate the factors (varimax rotation) to simplify the structure and to obtain greater interpretability. The naming of dietary patterns was based on the characteristics of the food groups in each factor combined with the interpretation of previous studies.
The factor scores for each pattern (dietary pattern score) were calculated by weighting the intake of food groups by their factor loadings. Higher dietary pattern scores indicated a higher preference for a specific dietary pattern. The subjects were divided into low-to high-tertile groups (Tertile 1, Tertile 2 and Tertile 3) based on their dietary pattern score in 2011.

2.3. Assessment of Depression

The PhenX (consensus measures for Phenotypes and eXposures) Toolkit was employed by CLHLS to assess depression (PhenX code: 120500). PhenX utilized the Composite International Diagnostic Interview Screening Scales (CIDI-SC), which was developed by the criteria of the Diagnostic and Statistical Manual of Mental Disorders (5th ed.; DSM-5). PhenX is a two-item, short self-report screening tool, which includes two levels of indicators, with a “yes” answer to any question indicating a representation of depression. This measurement has been applied to some previous studies [26,27]. The two questions were as follows:
Question 1: Have you had a time in last 12 months when you felt sad, blue, or depressed for two weeks or more? (Yes = 1; No = 0)
Question 2: Have you had a time in last 12 months lasting two weeks or more when you lost interest in most things like hobbies, work, or activities that usually give you pleasure? (Yes = 1; No = 0)
We used the Spearman–Brown coefficient instead of using Cronbach’s alpha to assess the reliability of the Phen X [28]. The Spearman–Brown coefficient was 0.712, indicating the good reliability and internal consistency of the tool for measuring depression.

2.4. Assessment of Covariates

According to the previous studies, we included sociodemographic information (gender, age, residence, living conditions, marital status, region residence, family income), physical health, living habits (body mass index (BMI), alcohol consumption, smoking status, exercise), and the number of chronic diseases (hypertension, diabetes, heart disease, stroke or cardiovascular disease (CVD), arthritis, rheumatism or rheumatoid disease, dyslipidemia, etc.) at baseline as covariates of this study.

2.5. Statistical Analyses

The initial fundamental characteristics of the groups, including gender, age, region of residence, marital status, family income, living conditions, BMI, alcohol consumption status, smoking status, exercise and the number of chronic diseases, were examined using independent chi-square testing.
The association between dietary patterns and risk of depression was summarized with odds ratios (OR) and their 95% confidence interval (CI) obtained from logistic regression. Two logistic models were built: the first one was adjusted for gender, age, marital status, region residence, family income and living conditions, and the second model was additionally adjusted for the rest of the variables described above. Adherence to the empirically derived dietary pattern was classified into tertiles, and the lowest tertile was used as the reference group. Because the conclusions of previous studies on male–female differences between dietary patterns and depression were inconsistent [29,30], subgroup analysis was performed by gender at baseline to test the differences in the association between dietary patterns and the risk of depression among men and women. Interactions were formally tested using the adjusted Wald test.
Database establishment, data cleaning, and statistical analysis were all completed by SPSS 26.0 and Stata 11.0. p < 0.05 was considered statistically significant.

3. Results

This study passed the Kaiser–Meyer–Olkin test, and the sampling adequacy value of the 13 food groups was 0.796 > 0.7. The result of the Bartlett sphere test showed that χ2 = 4839.439 (p < 0.001), indicating that the 13 food groups were not independent and were strongly correlated so that principal component analysis could be performed. Kaiser’ criterion finally identified three factors. The eigenvalues of the three factors after maximum rotation were 2.068, 1.708 and 1.627, respectively, and they explained 15.906%, 13.135% and 12.515% of the total variance; the cumulative contribution rate was 41.555% (Table A1 and Table A2).
According to the food characteristics of each of the three patterns, they were named the vegetable–egg–beans–milk pattern (fresh vegetable, eggs, bean products, and milk products), meat–fish pattern (meat and fish), and salt-preserved vegetable–garlic pattern (salt-preserved vegetables and garlic) (Table A3 and Table A4).
A total of 2873 subjects without depression symptoms at baseline were included in this study. Their mean age was (80.30 ± 0.18), 46.26% were female, 82.25% were rural residents, and the mean BMI was 22.05 kg/m2. For the vegetable–egg–beans–milk pattern, there were differences in the distribution of age, region of residence, family income, living conditions, BMI, smoking status, alcohol consumption status, exercise and the number of chronic diseases. For the meat–fish pattern, there were differences in the distribution of gender, age, marital status, region of residence, family income, living conditions, BMI, smoking status, alcohol consumption status and exercise. For the salt-preserved vegetable–garlic pattern, there were differences in the distribution of gender, age, marital status, region of residence, family income (except for Tertile 1), living conditions, BMI, smoking status, alcohol consumption status and exercise (Table 1).
During a mean follow-up of four years, we ascertained 346 subjects with depressive symptoms. Results from models with partial (model 1) and full (model 2) adjustments were rather similar. After controlling all the covariates, subjects in the second and third tertile of the vegetable–egg–beans–milk pattern score had a reduced risk of depression compared to subjects in the lowest tertile (OR = 0.61, p < 0.001) (OR = 0.65, p < 0.001). Subjects with the second tertile of the salt-preserved vegetable–garlic pattern score in 2014 had a higher risk of depression after 4 years than those in the lowest tertile (OR = 1.33, p < 0.001). No association was observed between meat-fish pattern and depression. (Table 2).
Subgroup analysis showed that the protective effect of the vegetable-egg-beans-milk pattern on depression was consistent in both men and women (p = 0.440). As shown in Table 3, the second tertile of the salt-preserved vegetable–garlic pattern score was significantly associated with depression in men (1.63 (1.06–2.49)), and the relationship between the third tertile of the pattern score and depression was borderline significant in women (1.34 (0.91–1.98)). The results of the men and women interaction term showed that the negative effect of the salt-preserved vegetable–garlic pattern on depression may not differ by gender either (p = 0.170).

4. Discussion

In this cohort study of old adults in China, we used exploratory factor analysis to identify three dietary patterns: the vegetable–egg–beans–milk pattern, meat–fish pattern, and salt-preserved vegetable–garlic pattern. Then, we examined the association between these three dietary patterns and the risk of depression in older adults. Our results showed that the vegetable–egg–beans–milk pattern score was associated with lower risk of depression after 4 years, the salt-preserved vegetable–garlic pattern was associated with higher risk of depression over time, and the meat–fish pattern was not observed to be related to the risk of depression in older adults. At the same time, there were no gender differences in these associations.
In this study, the vegetable–egg–beans–milk pattern was associated with reduced risk of depression. Our finding was similar to the other results. A cross-sectional study conducted in Australia found a link between high intake of a plant-based diet related to the Mediterranean diet and fewer depression symptoms [31], and a systematic review also showed that adherence to vegetables might reduce the development and progression of depression [32]. The protective effects of this pattern may include a variety of plant chemicals such as folic acid, dietary fiber, and antioxidant compounds, which can be used by participating in the synthesis and metabolism of neurotransmitters to relieve inflammation and stimulate the stress response system to regulate emotions [12,33,34]. It was also possible that these nutrients work together to produce a synergistic response to influence the likelihood of the depression arising [35]. At the same time, studies have proved that eggs included tryptophan, which may be converted to serotonin to regulate mood. At the same time, egg yolk is a good source of vitamin D and plays a vital role in reducing symptoms in elderly depressed patients [36,37,38]. Moreover, increasing the intake of milk and dairy products, especially low-fat milk intake, was also associated with a better mood [39]. Beans, which were also tryptophan-rich, have also been shown to reduce the risk of depression [40], and the trace element in the beans, especially zinc, was a nutrient widely associated with depression [41]. A study of Chinese adults found that moderate consumption of soy foods may reduce depressive symptoms, while relatively higher intakes may have the opposite effect [42]. However, the mechanism of the joint effect of different food on depression needs further clinical trials to examine.
We also observed no significant correlation between the risk of depression in the meat–fish pattern. Current evidence showed inconsistent results for the association between fish [43,44], omega-3 fatty acid intake [14,45,46] and depression. There are also controversial reports on meat intake and depressive symptoms [47,48]. The uncertain association between this pattern and psychological factors may be due to cultural differences in diet, lower meat consumption in the Chinese population, especially older people compared to Westerners, and the relatively narrower range of variation in animal food intake in our population than other reports [49,50]. Thus, the relationship between the meat–fish pattern and depression needs further exploration.
Salt-preserved vegetables and garlic are common on Chinese dining tables. Our analysis suggested that the salt-preserved vegetable–garlic pattern was associated with increased risk of depression. To our knowledge, there were no studies on the relationship between salt-preserved vegetables and depression. Even so, a cohort study reported a positive association between processed dietary patterns (such as preserved food) and the risk of depression in women [51]. It is well known that a large intake of salt-preserved vegetables may increase the risk of cardiovascular disease due to the high amount of salt. Patients with cardiovascular disease are more depressed than the general population [52], suggesting another way for the diet to regulate mental health. As for garlic, an experimental study demonstrated that garlic extract inhibited the monoamine oxidase levels, thus reducing the risk of depression due to the depletion of the monoamine neurotransmitters [53]. However, since our study explored the combined pattern in which these two food categories were the dominant characteristics, it was unclear whether garlic played a positive role in this dietary pattern and should be further explored in the future.
Previous studies of the relationship between dietary patterns and depression have yielded inconsistent results regarding differences between men and women. A Japanese cross-sectional study reported that the plant-based food–fish product pattern and meat pattern were significantly associated with depression in men, but no association was observed in women [29]. A cross-sectional study in the US reported that the dietary pattern of vegetables, fruits, fish, and whole grains was significantly associated with depression scores in women after adjusting for covariates. In contrast, this association was not observed in men [30]. Even so, the dietary patterns they explored may be suitable for only part of the population, our study found that the vegetable–egg–beans–milk pattern was associated with a lower risk of depression in older adults, and this association had no gender difference. Moreover, the salt-preserved vegetable–garlic pattern was associated with a higher risk of depression in men and it may be also associated with increased depression risk in women, and this negative effect may be greater in men. More studies should be conducted to further examine the gender differences in this pattern.
More randomized controlled trials are needed to further prove the validity of the dietary patterns explored in observational studies. Previous clinical trials have confirmed the effectiveness of the Mediterranean dietary pattern and nutritional supplements in improving depression [54,55], but some of the dietary patterns defined by later studies also need to be validated. Moreover, how to make older adults adhere to a beneficial diet against depression is also a point worth exploring. In a trial study, an intervention based on individual telephone calls and personalized dietary advice increased adherence to the Mediterranean dietary pattern among patients with coronary artery disease [56]. However, there are few studies on interventions to increase dietary pattern adherence in the elderly, and this research field needs to be expanded in the future.
The strength of this study was that it was a 4-year cohort study rather than focusing only on cross-sectional dietary intake, which allowed us to investigate the impact of long-term dietary patterns on the risk of sensitivity to depression. Second, the CLHLS, which covers 23 provinces or municipalities, provided the data. These regions varied in geography, economic development, public resources and health indicators and were more representative of Chinese residents.
Several limitations also existed in this study. First, all the answers to the questionnaire were self-reported by the subjects, which were prone to recall bias. Second, the questionnaire included only the frequency of food intake without the amount of food intake. The frequency may not completely match the total intake, but intake frequency may be more important than the intake amount [57]. Third, this study was conducted on older Chinese adults, and the results cannot be extrapolated to other races. Finally, although we have adjusted for many potential confounders, due to the common risk factors, this observational study cannot exclude the existence of possible reverse causality and the influence of residual confounding.

5. Conclusions

In conclusion, our longitudinal study revealed that the vegetable–egg–beans–milk dietary pattern was associated with a lower risk of depression among Chinese older adults, as well as the salt-preserved vegetable–garlic dietary pattern was associated with a higher risk of depression. The meat–fish pattern was not found to associate with depression in the elderly. Moreover, there were no gender differences in these findings. This study provided evidence that a diet was conducive to preventing depression in the elderly.

Author Contributions

Conceptualization, Z.P., J.Z. and L.X.; methodology, Z.P. and J.Z.; software, Z.P.; validation, W.Q. and F.H.; formal analysis, L.X.; investigation, Z.P. and J.Z.; writing—original draft, Z.P.; writing—review and editing, W.Q., F.H. and L.X.; visualization, J.Z., Y.Z., X.Z., X.C., C.L., W.Q. and F.H.; project administration, L.X. All authors have read and agreed to the published version of the manuscript.

Funding

This research was funded by the National Natural Science Foundation of China (71974118).

Institutional Review Board Statement

This study was conducted according to the guidelines laid down in the Declaration of Helsinki, and all procedures involving research study participants were approved by the biomedical ethics committee of Peking University (IRB00001052–24713074).

Informed Consent Statement

Informed consent was obtained from all subjects involved in this study.

Data Availability Statement

The raw data supporting the conclusions of this article can be found here: https://opendata.pku.edu.cn/dataverse/CHADS (accessed on 4 October 2022).

Acknowledgments

We wish to thank the National Natural Science Foundation of China (71974118), the National Natural Science Foundation of China (71233001), United States Department of Health and Human Services, National Institutes of Health, National Institute on Aging (R01 AG023627) and National Basic Research Program of China (2013CB530700).

Conflicts of Interest

The authors declare no conflict of interest.

Appendix A

Table A1. Kaiser–Meyer–Olkin Measure of Sampling Adequacy.
Kaiser–Meyer–Olkin
Measure of Sampling
Adequacy
0.796
Bartlett’s Test of SphericityApprox. chi-Square4839.439
df79
Sig.<0.001
Table A2. Total Variance Explained.
ComponentRotation Sums of Squared Loadings
Total% of VarianceCumulative %
12.06815.90615.906
21.70813.13529.041
31.62712.51541.555
Table A3. The rotated composition matrix.
Food GroupsComponent
Vegetable–Egg–Beans–Milk PatternMeat-Fish PatternSalt-Preserved Vegetable–Garlic Pattern
Fresh vegetable0.505--
Fresh fruit---
Meat-0.741-
Fish-0.699-
Eggs0.684--
Bean products0.524--
Salt-preserved vegetable--0.744
Sugar---
Tea---
Garlic--0.616
Milk products0.739--
Nut products---
Mushroom or algae---
Extraction Method: principal component analysis. Rotation Method: Varimax with Kaiser Normalization. Coefficient display format: Small coefficients with absolute value <0.5 are not displayed.
Table A4. Factor load matrix of dietary pattern.
Food GroupsComponent
Vegetable–Egg–Beans–Milk PatternMeat–Fish PatternSalt-Preserved Vegetable–Garlic Pattern
Fresh vegetable0.2340.185−0.150
Fresh fruit−0.1130.3090.061
Meat−0.1140.3090.061
Fish0.0000.045−0.138
Eggs0.395−0.113−0.083
Bean products0.257−0.0680.055
Salt-preserved vegetable−0.220−0.0280.558
Sugar0.073−0.1560.266
Tea−0.1060.1920.209
Garlic−0.031−0.0370.402
Milk products0.448−0.138−0.140
Nut products0.0950.0420.207
Mushroom or algae0.1810.0520.133
Extraction Method: principal component analysis. Rotation Method: Varimax with Kaiser Normalization.

References

  1. National Bureau of Statistics. Bulletin of the Seventh National Census (No. 5)—Population Age Composition; China Statistics: Beijing, China, 2021; pp. 10–11.
  2. Fang, E.F.; Scheibye-Knudsen, M.; Jahn, H.J.; Li, J.; Ling, L.; Guo, H.; Zhu, X.; Preedy, V.; Lu, H.; Bohr, V.A.; et al. A Research Agenda for Aging in China in the 21st Century. Ageing Res. Rev. 2015, 24, 197–205. [Google Scholar] [CrossRef] [PubMed] [Green Version]
  3. Regier, D.A.; Sussman, N. The Developmental Process for the Diagnostic and Statistical Manual of Mental Disorders, Fifth Edition. CNS Spectr. 2008, 13, 120–124. [Google Scholar] [CrossRef] [PubMed]
  4. Zhou, L.; Ma, X.; Wang, W. Relationship between Cognitive Performance and Depressive Symptoms in Chinese Older Adults: The China Health and Retirement Longitudinal Study (CHARLS). J. Affect. Disord. 2021, 281, 454–458. [Google Scholar] [CrossRef]
  5. Ponte, C.; Almeida, V.; Fernandes, L. Suicidal Ideation, Depression and Quality of Life in the Elderly: Study in a Gerontopsychiatric Consultation. Span. J. Psychol. 2014, 17, E14. [Google Scholar] [CrossRef] [PubMed]
  6. Fiske, A.; Wetherell, J.L.; Gatz, M. Depression in Older Adults. Annu. Rev. Clin. Psychol. 2009, 5, 363–389. [Google Scholar] [CrossRef] [PubMed]
  7. Leggett, A.; Zarit, S.H. Prevention of Mental Disorder in Older Adults: Recent Innovations and Future Directions. Generations 2014, 8, 45–52. [Google Scholar] [PubMed]
  8. Black, M.; Bowman, M. Nutrition and Healthy Aging. Clin. Geriatr. Med. 2020, 36, 655–669. [Google Scholar] [CrossRef]
  9. Jacka, F.N.; Mykletun, A.; Berk, M.; Bjelland, I.; Tell, G.S. The Association between Habitual Diet Quality and the Common Mental Disorders in Community-Dwelling Adults: The Hordaland Health Study. Psychosom. Med. 2011, 73, 483–490. [Google Scholar] [CrossRef]
  10. Opie, R.S.; Itsiopoulos, C.; Parletta, N.; Sanchez-Villegas, A.; Akbaraly, T.N.; Ruusunen, A.; Jacka, F.N. Dietary Recommendations for the Prevention of Depression. Nutr. Neurosci. 2017, 20, 161–171. [Google Scholar] [CrossRef]
  11. Saghafian, F.; Malmir, H.; Saneei, P.; Milajerdi, A.; Larijani, B.; Esmaillzadeh, A. Fruit and Vegetable Consumption and Risk of Depression: Accumulative Evidence from an Updated Systematic Review and Meta-Analysis of Epidemiological Studies. Br. J. Nutr. 2018, 119, 1087–1101. [Google Scholar] [CrossRef]
  12. Rogers, P.J. A Healthy Body, a Healthy Mind: Long-Term Impact of Diet on Mood and Cognitive Function. Proc. Nutr. Soc. 2001, 60, 135–143. [Google Scholar] [CrossRef] [PubMed] [Green Version]
  13. Almeida, O.P.; Ford, A.H.; Flicker, L. Systematic Review and Meta-Analysis of Randomized Placebo-Controlled Trials of Folate and Vitamin B12 for Depression. Int. Psychogeriatr. 2015, 27, 727–737. [Google Scholar] [CrossRef] [PubMed]
  14. Mocking, R.J.T.; Harmsen, I.; Assies, J.; Koeter, M.W.J.; Ruhé, H.G.; Schene, A.H. Meta-Analysis and Meta-Regression of Omega-3 Polyunsaturated Fatty Acid Supplementation for Major Depressive Disorder. Transl. Psychiatry 2016, 6, e756. [Google Scholar] [CrossRef] [Green Version]
  15. Hu, F.B. Dietary Pattern Analysis: A New Direction in Nutritional Epidemiology. Curr. Opin. Lipidol. 2002, 13, 3–9. [Google Scholar] [CrossRef] [PubMed]
  16. Yin, W.; Löf, M.; Chen, R.; Hultman, C.M.; Fang, F.; Sandin, S. Mediterranean Diet and Depression: A Population-Based Cohort Study. Int. J. Behav. Nutr. Phys. Act. 2021, 18, 153. [Google Scholar] [CrossRef] [PubMed]
  17. Lassale, C.; Batty, G.D.; Baghdadli, A.; Jacka, F.; Sánchez-Villegas, A.; Kivimäki, M.; Akbaraly, T. Healthy Dietary Indices and Risk of Depressive Outcomes: A Systematic Review and Meta-Analysis of Observational Studies. Mol. Psychiatry 2019, 24, 965–986. [Google Scholar] [CrossRef] [PubMed] [Green Version]
  18. Gregório, M.J.; Rodrigues, A.M.; Eusébio, M.; Sousa, R.D.; Dias, S.; André, B.; Grønning, K.; Coelho, P.S.; Mendes, J.M.; Graça, P.; et al. Dietary Patterns Characterized by High Meat Consumption Are Associated with Other Unhealthy Life Styles and Depression Symptoms. Front. Nutr. 2017, 4, 25. [Google Scholar] [CrossRef] [PubMed] [Green Version]
  19. Miki, T.; Eguchi, M.; Akter, S.; Kochi, T.; Kuwahara, K.; Kashino, I.; Hu, H.; Kabe, I.; Kawakami, N.; Nanri, A.; et al. Longitudinal Adherence to a Dietary Pattern and Risk of Depressive Symptoms: The Furukawa Nutrition and Health Study. Nutrition 2018, 48, 48–54. [Google Scholar] [CrossRef]
  20. Chan, R.; Chan, D.; Woo, J. A Prospective Cohort Study to Examine the Association between Dietary Patterns and Depressive Symptoms in Older Chinese People in Hong Kong. PLoS ONE 2014, 9, e105760. [Google Scholar] [CrossRef]
  21. Ma, Y.; Li, R.; Zhan, W.; Huang, X.; Zhang, L.; Liu, Z. The Joint Association Between Multiple Dietary Patterns and Depressive Symptoms in Adults Aged 55 and Over in Northern China. Front. Nutr. 2022, 9, 849384. [Google Scholar] [CrossRef]
  22. Xia, Y.; Wang, N.; Yu, B.; Zhang, Q.; Liu, L.; Meng, G.; Wu, H.; Du, H.; Shi, H.; Guo, X.; et al. Dietary Patterns Are Associated with Depressive Symptoms among Chinese Adults: A Case-Control Study with Propensity Score Matching. Eur. J. Nutr. 2017, 56, 2577–2587. [Google Scholar] [CrossRef] [PubMed]
  23. Liao, K.; Gu, Y.; Liu, M.; Fu, J.; Wang, X.; Yang, G.; Zhang, Q.; Liu, L.; Meng, G.; Yao, Z.; et al. Association of Dietary Patterns with Depressive Symptoms in Chinese Postmenopausal Women. Br. J. Nutr. 2019, 122, 1168–1174. [Google Scholar] [CrossRef] [PubMed]
  24. Yan, J.; Ren, Q.; Lin, H.; Liu, Q.; Fu, J.; Sun, C.; Li, W.; Ma, F.; Zhu, Y.; Li, Z.; et al. Association between Dietary Patterns and the Risk of Depressive Symptoms in the Older Adults in Rural China. Nutrients 2022, 14, 3538. [Google Scholar] [CrossRef] [PubMed]
  25. Center for Healthy Aging and Development Studies. The Chinese Longitudinal Healthy Longevity Survey (CLHLS)-Longitudinal Data (1998–2018). Peking University Open Research Data Platform. 2020. Available online: http://opendata.pku.edu.cn/dataset.xhtml?persistentId=doi:10.18170/DVN/WBO7LK (accessed on 7 December 2022).
  26. Su, D.; Zhang, X.; He, K.; Chen, Y. Use of Machine Learning Approach to Predict Depression in the Elderly in China: A Longitudinal Study. J. Affect. Disord. 2021, 282, 289–298. [Google Scholar] [CrossRef]
  27. Hao, Z.; Ruggiano, N.; Li, Q.; Guo, Y.; Pan, X. Disparities in Depression among Chinese Older Adults with Neurodegenerative Diseases. Aging Ment. Health 2022, 26, 632–638. [Google Scholar] [CrossRef]
  28. Eisinga, R.; Grotenhuis, M.; Pelzer, B. The Reliability of a Two-Item Scale: Pearson, Cronbach, or Spearman-Brown? Int. J. Public Health 2013, 58, 637–642. [Google Scholar] [CrossRef]
  29. Noguchi, R.; Hiraoka, M.; Watanabe, Y.; Kagawa, Y. Relationship between Dietary Patterns and Depressive Symptoms: Difference by Gender, and Unipolar and Bipolar Depression. J. Nutr. Sci. Vitaminol. 2013, 59, 115–122. [Google Scholar] [CrossRef] [Green Version]
  30. Kim, W.K.; Shin, D.; Song, W.O. Are Dietary Patterns Associated with Depression in U.S. Adults? J. Med. Food 2016, 19, 1074–1084. [Google Scholar] [CrossRef]
  31. Crichton, G.E.; Bryan, J.; Hodgson, J.M.; Murphy, K.J. Mediterranean Diet Adherence and Self-Reported Psychological Functioning in an Australian Sample. Appetite 2013, 70, 53–59. [Google Scholar] [CrossRef]
  32. Matison, A.P.; Mather, K.A.; Flood, V.M.; Reppermund, S. Associations between Nutrition and the Incidence of Depression in Middle-Aged and Older Adults: A Systematic Review and Meta-Analysis of Prospective Observational Population-Based Studies. Ageing Res. Rev. 2021, 70, 101403. [Google Scholar] [CrossRef]
  33. Bodnar, L.M.; Wisner, K.L. Nutrition and Depression: Implications for Improving Mental Health among Childbearing-Aged Women. Biol. Psychiatry 2005, 58, 679–685. [Google Scholar] [CrossRef] [PubMed] [Green Version]
  34. El-Naga, R.N.; Ahmed, H.I.; Abd Al Haleem, E.N. Effects of Indole-3-Carbinol on Clonidine-Induced Neurotoxicity in Rats: Impact on Oxidative Stress, Inflammation, Apoptosis and Monoamine Levels. Neurotoxicology 2014, 44, 48–57. [Google Scholar] [CrossRef] [PubMed]
  35. Jacka, F.; Berk, M. Food for Thought. Acta Neuropsychiatr. 2007, 19, 321–323. [Google Scholar] [CrossRef]
  36. Lieberman, H.R.; Agarwal, S.; Fulgoni, V.L. Tryptophan Intake in the US Adult Population Is Not Related to Liver or Kidney Function but Is Associated with Depression and Sleep Outcomes. J. Nutr. 2016, 146, 2609S–2615S. [Google Scholar] [CrossRef] [PubMed]
  37. Shafiei, F.; Keshteli, A.H.; Pouraram, H.; Afshar, H.; Salari-Moghaddam, A.; Esmaillzadeh, A.; Adibi, P. Egg Consumption and Prevalence of Psychological Disorders in Adults. Eur. J. Nutr. 2019, 58, 1923–1932. [Google Scholar] [CrossRef] [PubMed]
  38. Alavi, N.M.; Khademalhoseini, S.; Vakili, Z.; Assarian, F. Effect of Vitamin D Supplementation on Depression in Elderly Patients: A Randomized Clinical Trial. Clin. Nutr. 2019, 38, 2065–2070. [Google Scholar] [CrossRef] [PubMed]
  39. Camfield, D.A.; Owen, L.; Scholey, A.B.; Pipingas, A.; Stough, C. Dairy Constituents and Neurocognitive Health in Ageing. Br. J. Nutr. 2011, 106, 159–174. [Google Scholar] [CrossRef] [Green Version]
  40. de Meller, F.O.; Manosso, L.M.; Schäfer, A.A. The Influence of Diet Quality on Depression among Adults and Elderly: A Population-Based Study. J. Affect. Disord. 2021, 282, 1076–1081. [Google Scholar] [CrossRef]
  41. Vashum, K.P.; McEvoy, M.; Milton, A.H.; McElduff, P.; Hure, A.; Byles, J.; Attia, J. Dietary Zinc Is Associated with a Lower Incidence of Depression: Findings from Two Australian Cohorts. J. Affect. Disord. 2014, 166, 249–257. [Google Scholar] [CrossRef]
  42. Yu, B.; Yu, F.; Su, Q.; Zhang, Q.; Liu, L.; Meng, G.; Wu, H.; Xia, Y.; Bao, X.; Shi, H.; et al. A J-Shaped Association between Soy Food Intake and Depressive Symptoms in Chinese Adults. Clin. Nutr. 2018, 37, 1013–1018. [Google Scholar] [CrossRef]
  43. Albanese, E.; Lombardo, F.L.; Dangour, A.D.; Guerra, M.; Acosta, D.; Huang, Y.; Jacob, K.S.; de Llibre Rodriguez, J.J.; Salas, A.; Schönborn, C.; et al. No Association between Fish Intake and Depression in over 15,000 Older Adults from Seven Low and Middle Income Countries--the 10/66 Study. PLoS ONE 2012, 7, e38879. [Google Scholar] [CrossRef] [PubMed]
  44. Smith, K.J.; Sanderson, K.; McNaughton, S.A.; Gall, S.L.; Dwyer, T.; Venn, A.J. Longitudinal Associations between Fish Consumption and Depression in Young Adults. Am. J. Epidemiol. 2014, 179, 1228–1235. [Google Scholar] [CrossRef] [PubMed]
  45. Zhu, J.; Xiang, Y.-B.; Cai, H.; Li, H.; Gao, Y.-T.; Zheng, W.; Shu, X.-O. A Prospective Investigation of Dietary Intake and Functional Impairments Among the Elderly. Am. J. Epidemiol. 2018, 187, 2372–2386. [Google Scholar] [CrossRef] [PubMed]
  46. Chang, J.P.-C.; Chang, S.-S.; Yang, H.-T.; Chen, H.-T.; Chien, Y.-C.; Yang, B.; Su, H.; Su, K.-P. Omega-3 Polyunsaturated Fatty Acids in Cardiovascular Diseases Comorbid Major Depressive Disorder—Results from a Randomized Controlled Trial. Brain Behav. Immun. 2020, 85, 14–20. [Google Scholar] [CrossRef] [PubMed]
  47. Nucci, D.; Fatigoni, C.; Amerio, A.; Odone, A.; Gianfredi, V. Red and Processed Meat Consumption and Risk of Depression: A Systematic Review and Meta-Analysis. Int. J. Environ. Res. Public Health 2020, 17, 6686. [Google Scholar] [CrossRef] [PubMed]
  48. Chen, R.; Wei, L.; Hu, Z.; Qin, X.; Copeland, J.R.M.; Hemingway, H. Depression in Older People in Rural China. Arch. Intern. Med. 2005, 165, 2019–2025. [Google Scholar] [CrossRef] [Green Version]
  49. Zhang, C.-X.; Ho, S.C.; Chen, Y.-M.; Lin, F.-Y.; Fu, J.-H.; Cheng, S.-Z. Meat and Egg Consumption and Risk of Breast Cancer among Chinese Women. Cancer Causes Control 2009, 20, 1845–1853. [Google Scholar] [CrossRef]
  50. Dai, Q.; Shu, X.-O.; Jin, F.; Gao, Y.-T.; Ruan, Z.-X.; Zheng, W. Consumption of Animal Foods, Cooking Methods, and Risk of Breast Cancer. Cancer Epidemiol. Biomark. Prev. 2002, 11, 801–808. [Google Scholar]
  51. Liu, Z.-M.; Ho, S.C.; Xie, Y.J.; Chen, Y.-J.; Chen, Y.-M.; Chen, B.; Wong, S.Y.-S.; Chan, D.; Wong, C.K.M.; He, Q.; et al. Associations between Dietary Patterns and Psychological Factors: A Cross-Sectional Study among Chinese Postmenopausal Women. Menopause 2016, 23, 1294–1302. [Google Scholar] [CrossRef]
  52. Hare, D.L.; Toukhsati, S.R.; Johansson, P.; Jaarsma, T. Depression and Cardiovascular Disease: A Clinical Review. Eur. Heart J. 2014, 35, 1365–1372. [Google Scholar] [CrossRef] [Green Version]
  53. Dhingra, D.; Kumar, V. Evidences for the Involvement of Monoaminergic and GABAergic Systems in Antidepressant-like Activity of Garlic Extract in Mice. Indian J. Pharmacol. 2008, 40, 175–179. [Google Scholar] [CrossRef]
  54. Sánchez-Villegas, A.; Martínez-González, M.A.; Estruch, R.; Salas-Salvadó, J.; Corella, D.; Covas, M.I.; Arós, F.; Romaguera, D.; Gómez-Gracia, E.; Lapetra, J.; et al. Mediterranean Dietary Pattern and Depression: The PREDIMED Randomized Trial. BMC Med. 2013, 11, 208. [Google Scholar] [CrossRef] [PubMed] [Green Version]
  55. Parletta, N.; Zarnowiecki, D.; Cho, J.; Wilson, A.; Bogomolova, S.; Villani, A.; Itsiopoulos, C.; Niyonsenga, T.; Blunden, S.; Meyer, B.; et al. A Mediterranean-Style Dietary Intervention Supplemented with Fish Oil Improves Diet Quality and Mental Health in People with Depression: A Randomized Controlled Trial (HELFIMED). Nutr. Neurosci. 2019, 22, 474–487. [Google Scholar] [CrossRef] [PubMed] [Green Version]
  56. Quintana-Navarro, G.M.; Alcala-Diaz, J.F.; Lopez-Moreno, J.; Perez-Corral, I.; Leon-Acuña, A.; Torres-Peña, J.D.; Rangel-Zuñiga, O.A.; Arenas de Larriva, A.P.; Corina, A.; Camargo, A.; et al. Long-Term Dietary Adherence and Changes in Dietary Intake in Coronary Patients after Intervention with a Mediterranean Diet or a Low-Fat Diet: The CORDIOPREV Randomized Trial. Eur. J. Nutr. 2020, 59, 2099–2110. [Google Scholar] [CrossRef] [PubMed]
  57. Ashfield-Watt, P.L.; Welch, A.A.; Day, N.E.; Bingham, S.A. Is “five-a-Day” an Effective Way of Increasing Fruit and Vegetable Intakes? Public Health Nutr. 2004, 7, 257–261. [Google Scholar] [CrossRef] [PubMed]
Figure 1. Selection process of subjects.
Nutrients 14 05230 g001
Table 1. Characteristics of the non-depression population at baseline by adherence to the dietary pattern.
CharacteristicVegetable–Egg–Beans–Milk PatternMeat–Fish PatternSalt-Preserved Vegetable–Garlic Pattern
Tertile1Tertile2Tertile3Tertile1Tertile2Tertile3Tertile1Tertile2Tertile3
Gender, %
 Male54.1052.5054.5047.1054.3059.8047.7055.5058.00
 Female45.9047.5045.5052.9045.7040.2052.3044.5042.00
Age, %
 ≥60 and <7532.8038.1031.3031.3030.3v40.6027.0035.7039.50
 ≥75 to <8535.7034.3032.7033.5037.8031.3032.7034.4035.50
 ≥8531.5027.6036.0035.1031.9028.1040.3029.9025.00
Marital status, %
 Married or partnered50.9054.5054.1046.6052.1061.2044.8055.3059.60
 Unmarried or others49.1045.5045.9053.4047.1038.8055.2044.7040.40
Region of residence, %
 Urban community7.2014.4031.0012.5017.9022.9015.1017.6020.50
 Rural village92.8085.6069.0087.5082.1077.1084.9082.4079.50
Family income, %
 Quintile 1 (lowest)25.1020.4015.1031.2016.5012.7023.1022.1015.40
 Quintile 224.2019.8014.8021.2021.0016.4020.2019.2019.30
 Quintile 318.0021.2020.2017.1021.4020.9017.9019.8021.80
 Quintile 414.7020.0026.2015.7021.4024.0020.2019.4021.40
 Quintile5 (highest)17.9018.6023.7014.8019.7026.0018.7019.5022.10
Living conditions, %
 Alone77.1083.9081.5075.8081.0085.8076.1080.7085.80
 Not alone22.9016.1018.5024.2019.0014.2023.9019.3014.20
BMI, %
 Underweight19.8017.8013.8017.8017.9015.4021.6016.6013.10
 Normal57.6055.6054.6058.7055.7053.4054.8055.4057.50
 Overweight17.5020.1023.0017.4019.5023.8017.5021.3021.90
 Obese5.106.508.606.106.907.406.106.707.50
Smoking status, %
 Current26.8023.5018.9020.3022.3026.6016.2025.3027.50
 Former13.4012.6019.7014.1014.2017.6013.3014.6017.80
 Never59.8063.9061.4065.6063.5055.8070.5060.1054.60
Alcohol consumption status, %
 Current21.7021.6018.115.920.7024.8012.7020.6027.90
 Former12.4011.3017.011.813.3015.7010.5014.4015.80
 Never65.9067.1064.972.366.0059.5076.8065.0056.30
Exercise, %
 Yes38.2037.3055.337.543.4050.4039.4044.4047.30
 No61.8062.7044.762.556.6049.6060.6055.6052.70
No. of chronic diseases, %
 054.6053.7045.748.653.0052.2052.6051.6049.60
 132.3028.3034.133.630.9030.2031.3030.0033.30
 ≥213.1018.0020.217.816.1017.6016.1018.4017.10
Note: Bold font represented different statistical distribution between characteristics and dietary patterns.
Table 2. Association between dietary patterns and risk of depression during a 4-year follow-up of older adults.
ModelVegetable–Egg–Beans–Milk PatternMeat–Fish PatternSalt-Preserved Vegetable–Garlic Pattern
Tertile1Tertile2Tertile3Tertile1Tertile2Tertile3Tertile1Tertile2Tertile3
OR (95%CI)OR (95%CI)OR (95%CI)OR (95%CI)OR (95%CI)OR (95%CI)OR (95%CI)OR (95%CI)OR (95%CI)
Crude modelRef.0.65 (0.49–0.86) *0.78 (0.60–1.02)Ref.0.81 (0.61–1.07)0.97 (0.74–1.28)Ref.1.31 (0.99–1.73)1.25 (0.95–1.66)
Adjusted
model 1
Ref.0.61 (0.46–0.81) *0.66 (0.50–0.88) *Ref.0.80 (0.60–1.07)0.95 (0.72–1.26)Ref.1.32 (0.99–1.76)1.25 (0.95–1.68)
Adjusted
model 2
Ref.0.61 (0.46–0.82) *0.65 (0.49–0.87) *Ref.0.82 (0.62–1.09)0.97 (0.73–1.29)Ref.1.33 (1.00–1.77) *1.27 (0.95–1.70)
Note: *: p < 0.05. Crude model: no adjustment; Model 1, adjusted for gender, age, marital status, region residence, family income and living conditions; Model 2, Model 1 + BMI, smoking status, alcohol consumption status, exercise and the number of chronic diseases.
Table 3. Differences in the association between dietary patterns and the risk of depression among men and women.
GroupVegetable–Egg–Beans–Milk Patternp Value for
Interaction
Tertile 1Tertile 2Tertile 3
Gender 0.440
 MaleRef.0.71 (0.47–1.06)0.63 (0.41–0.97) *
 FemaleRef.0.53 (0.35–0.80) *0.63 (0.43–0.97) *
Meat–Fish Patternp Value for
Interaction
Tertile 1Tertile 2Tertile 3
Gender 0.870
 MaleRef.0.95 (0.62–1.45)1.14 (0.75–1.73)
 FemaleRef.0.71 (0.48–1.06)0.85 (0.57–1.26)
Salt-PreservedVegetable–Garlic Patternp Value for
Interaction
Tertile 1Tertile 2Tertile 3
Gender 0.170
 MaleRef.1.63 (1.06–2.49) *1.29 (0.82–2.01)
 FemaleRef.1.08 (0.72–1.61)1.34 (0.91–1.98)
Note: *: p < 0.05. All models adjusted for age, marital status, region residence, family income, living conditions, BMI, smoking status, alcohol consumption status, exercise and the number of chronic diseases.
Publisher’s Note: MDPI stays neutral with regard to jurisdictional claims in published maps and institutional affiliations.

