
Added Sugar, Sugar-Sweetened Beverages, and Artificially Sweetened Beverages and Risk of Cardiovascular Disease: Findings from the Women’s Health Initiative and a Network Meta-Analysis of Prospective Studies

 , ,
, ,  and
and
Abstract
:1. Introduction
2. Materials and Methods
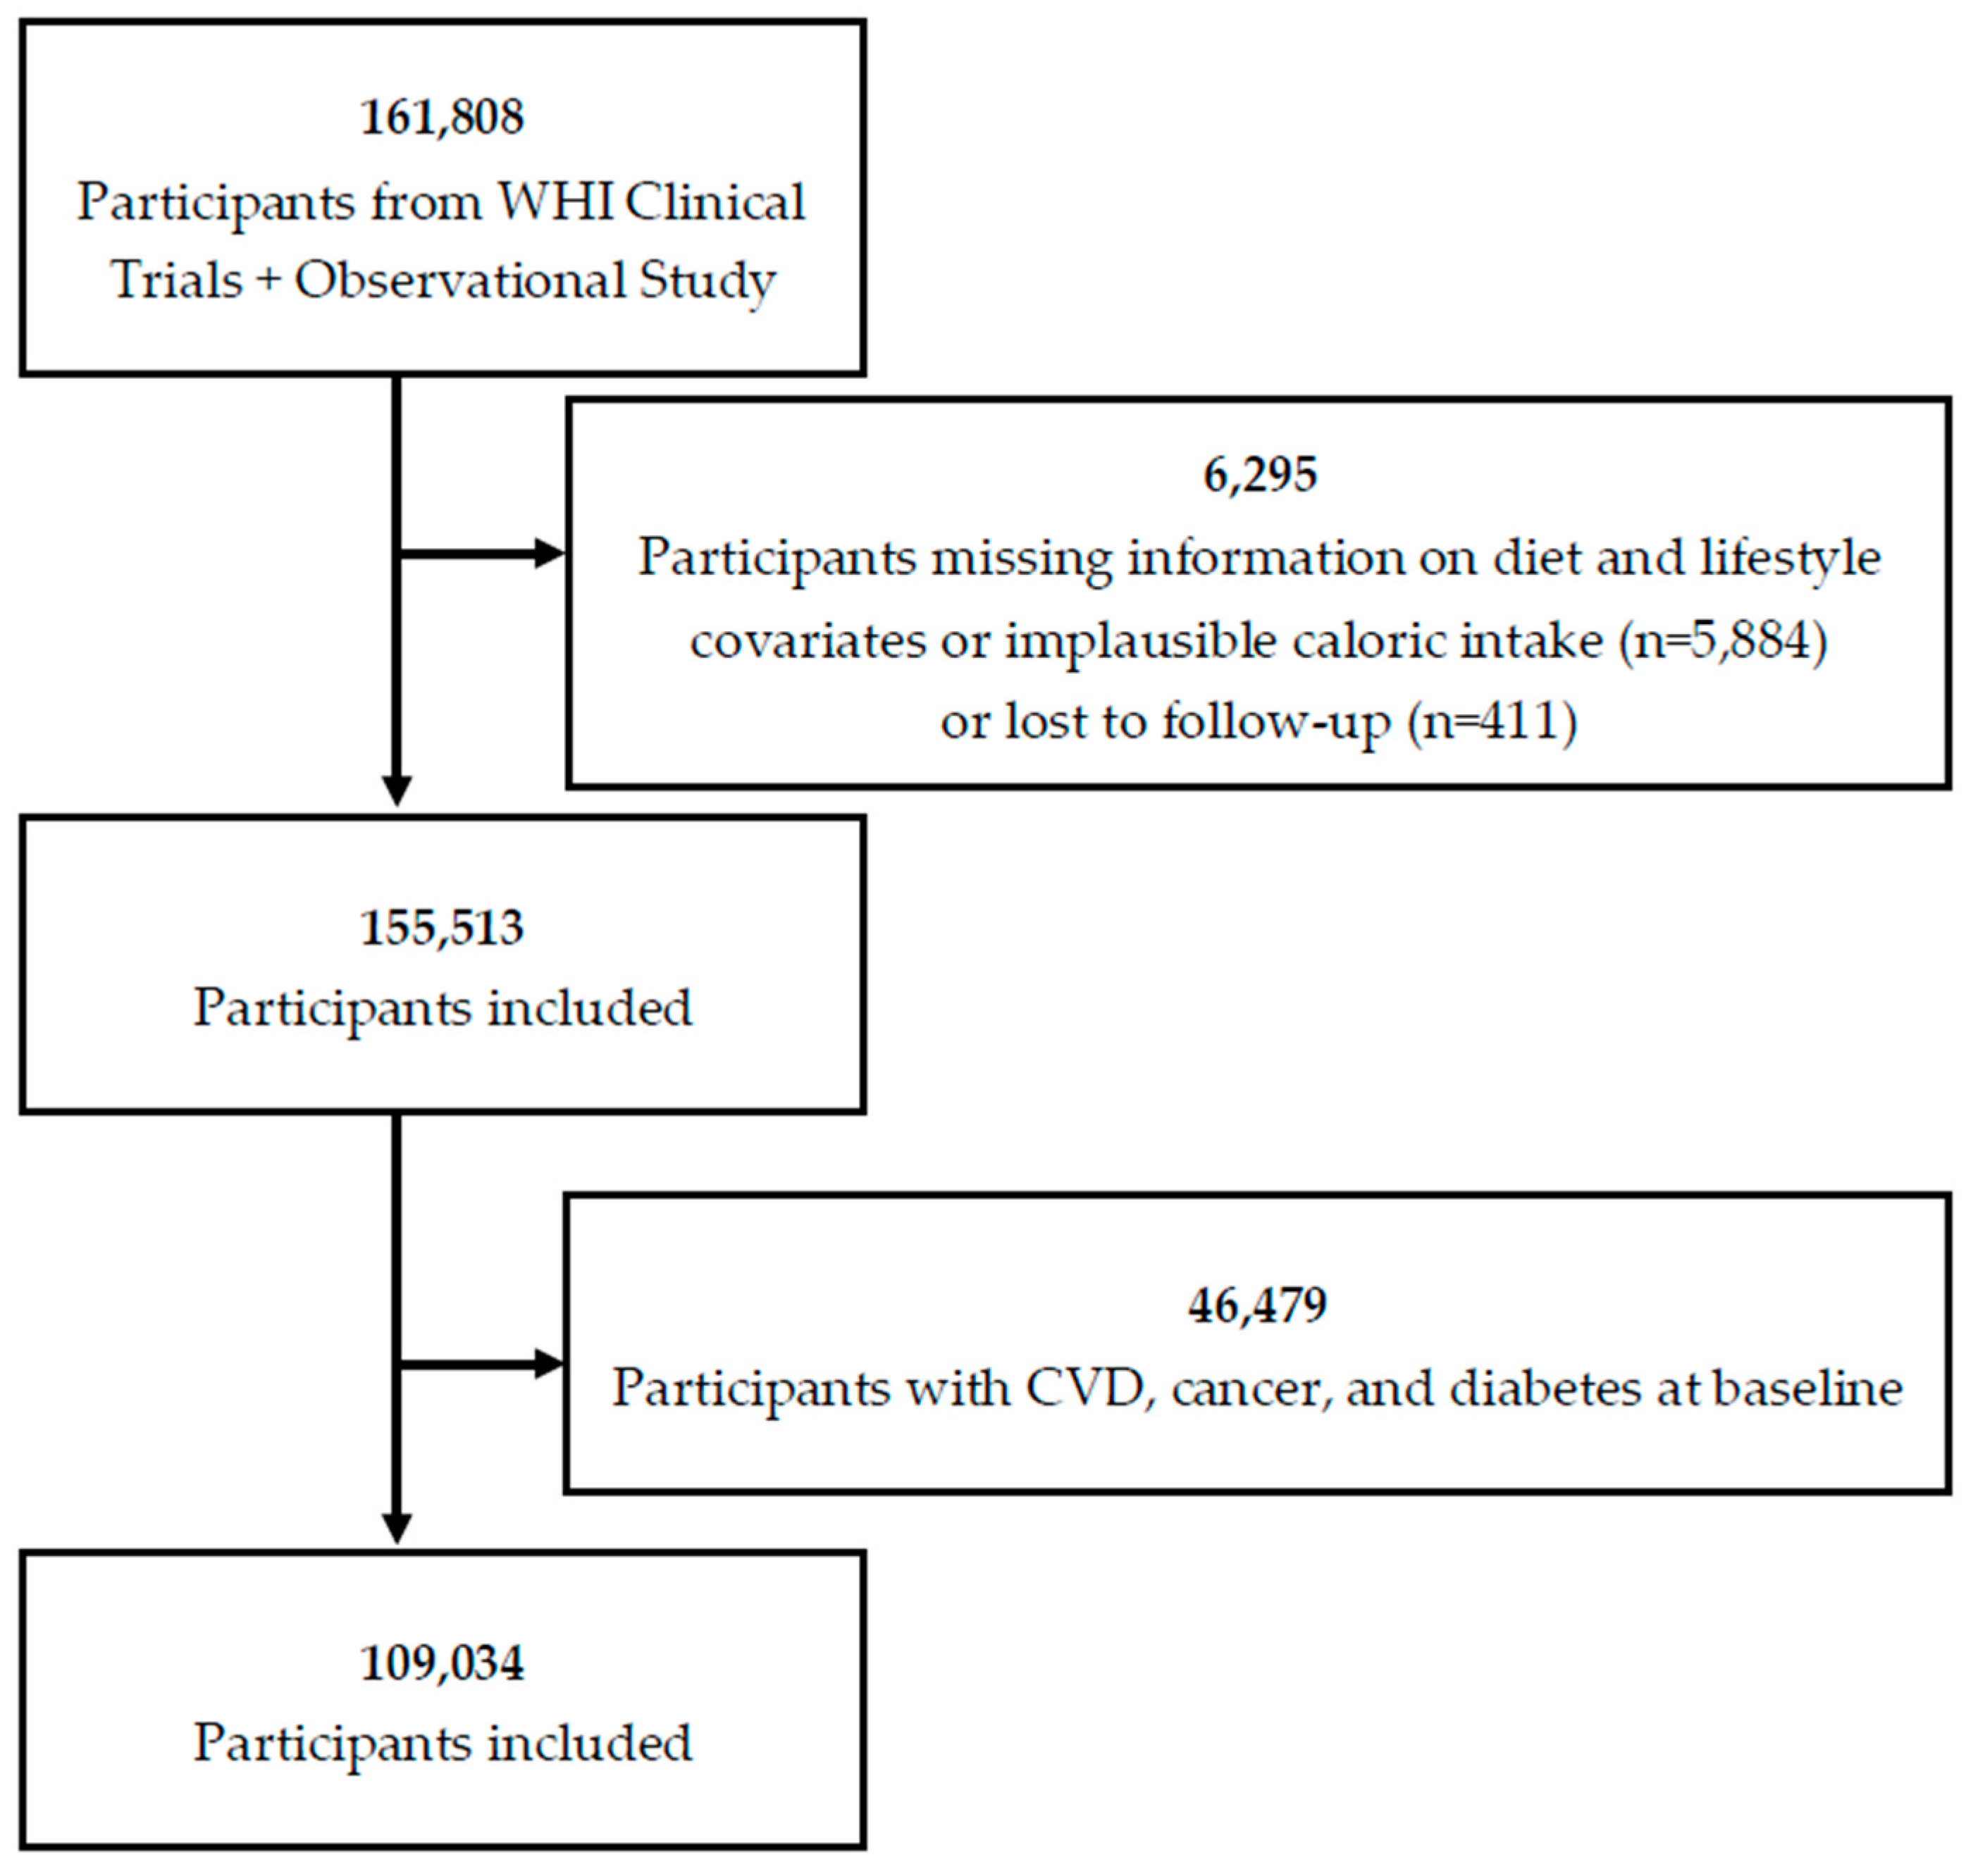
2.1. Study Population and Design
2.2. Outcome Variables
2.3. Exposure Variables
2.4. Covariates
2.5. Statistical Method for Cohort Analysis
2.6. A Network Meta-Analysis of Prospective Cohorts
3. Results
3.1. Demographic Features of Included Participants
3.2. Associations between Added Sugar, SSBs, ASBs, and CVD Risk
3.3. Subgroup and Sensitivity Analyses
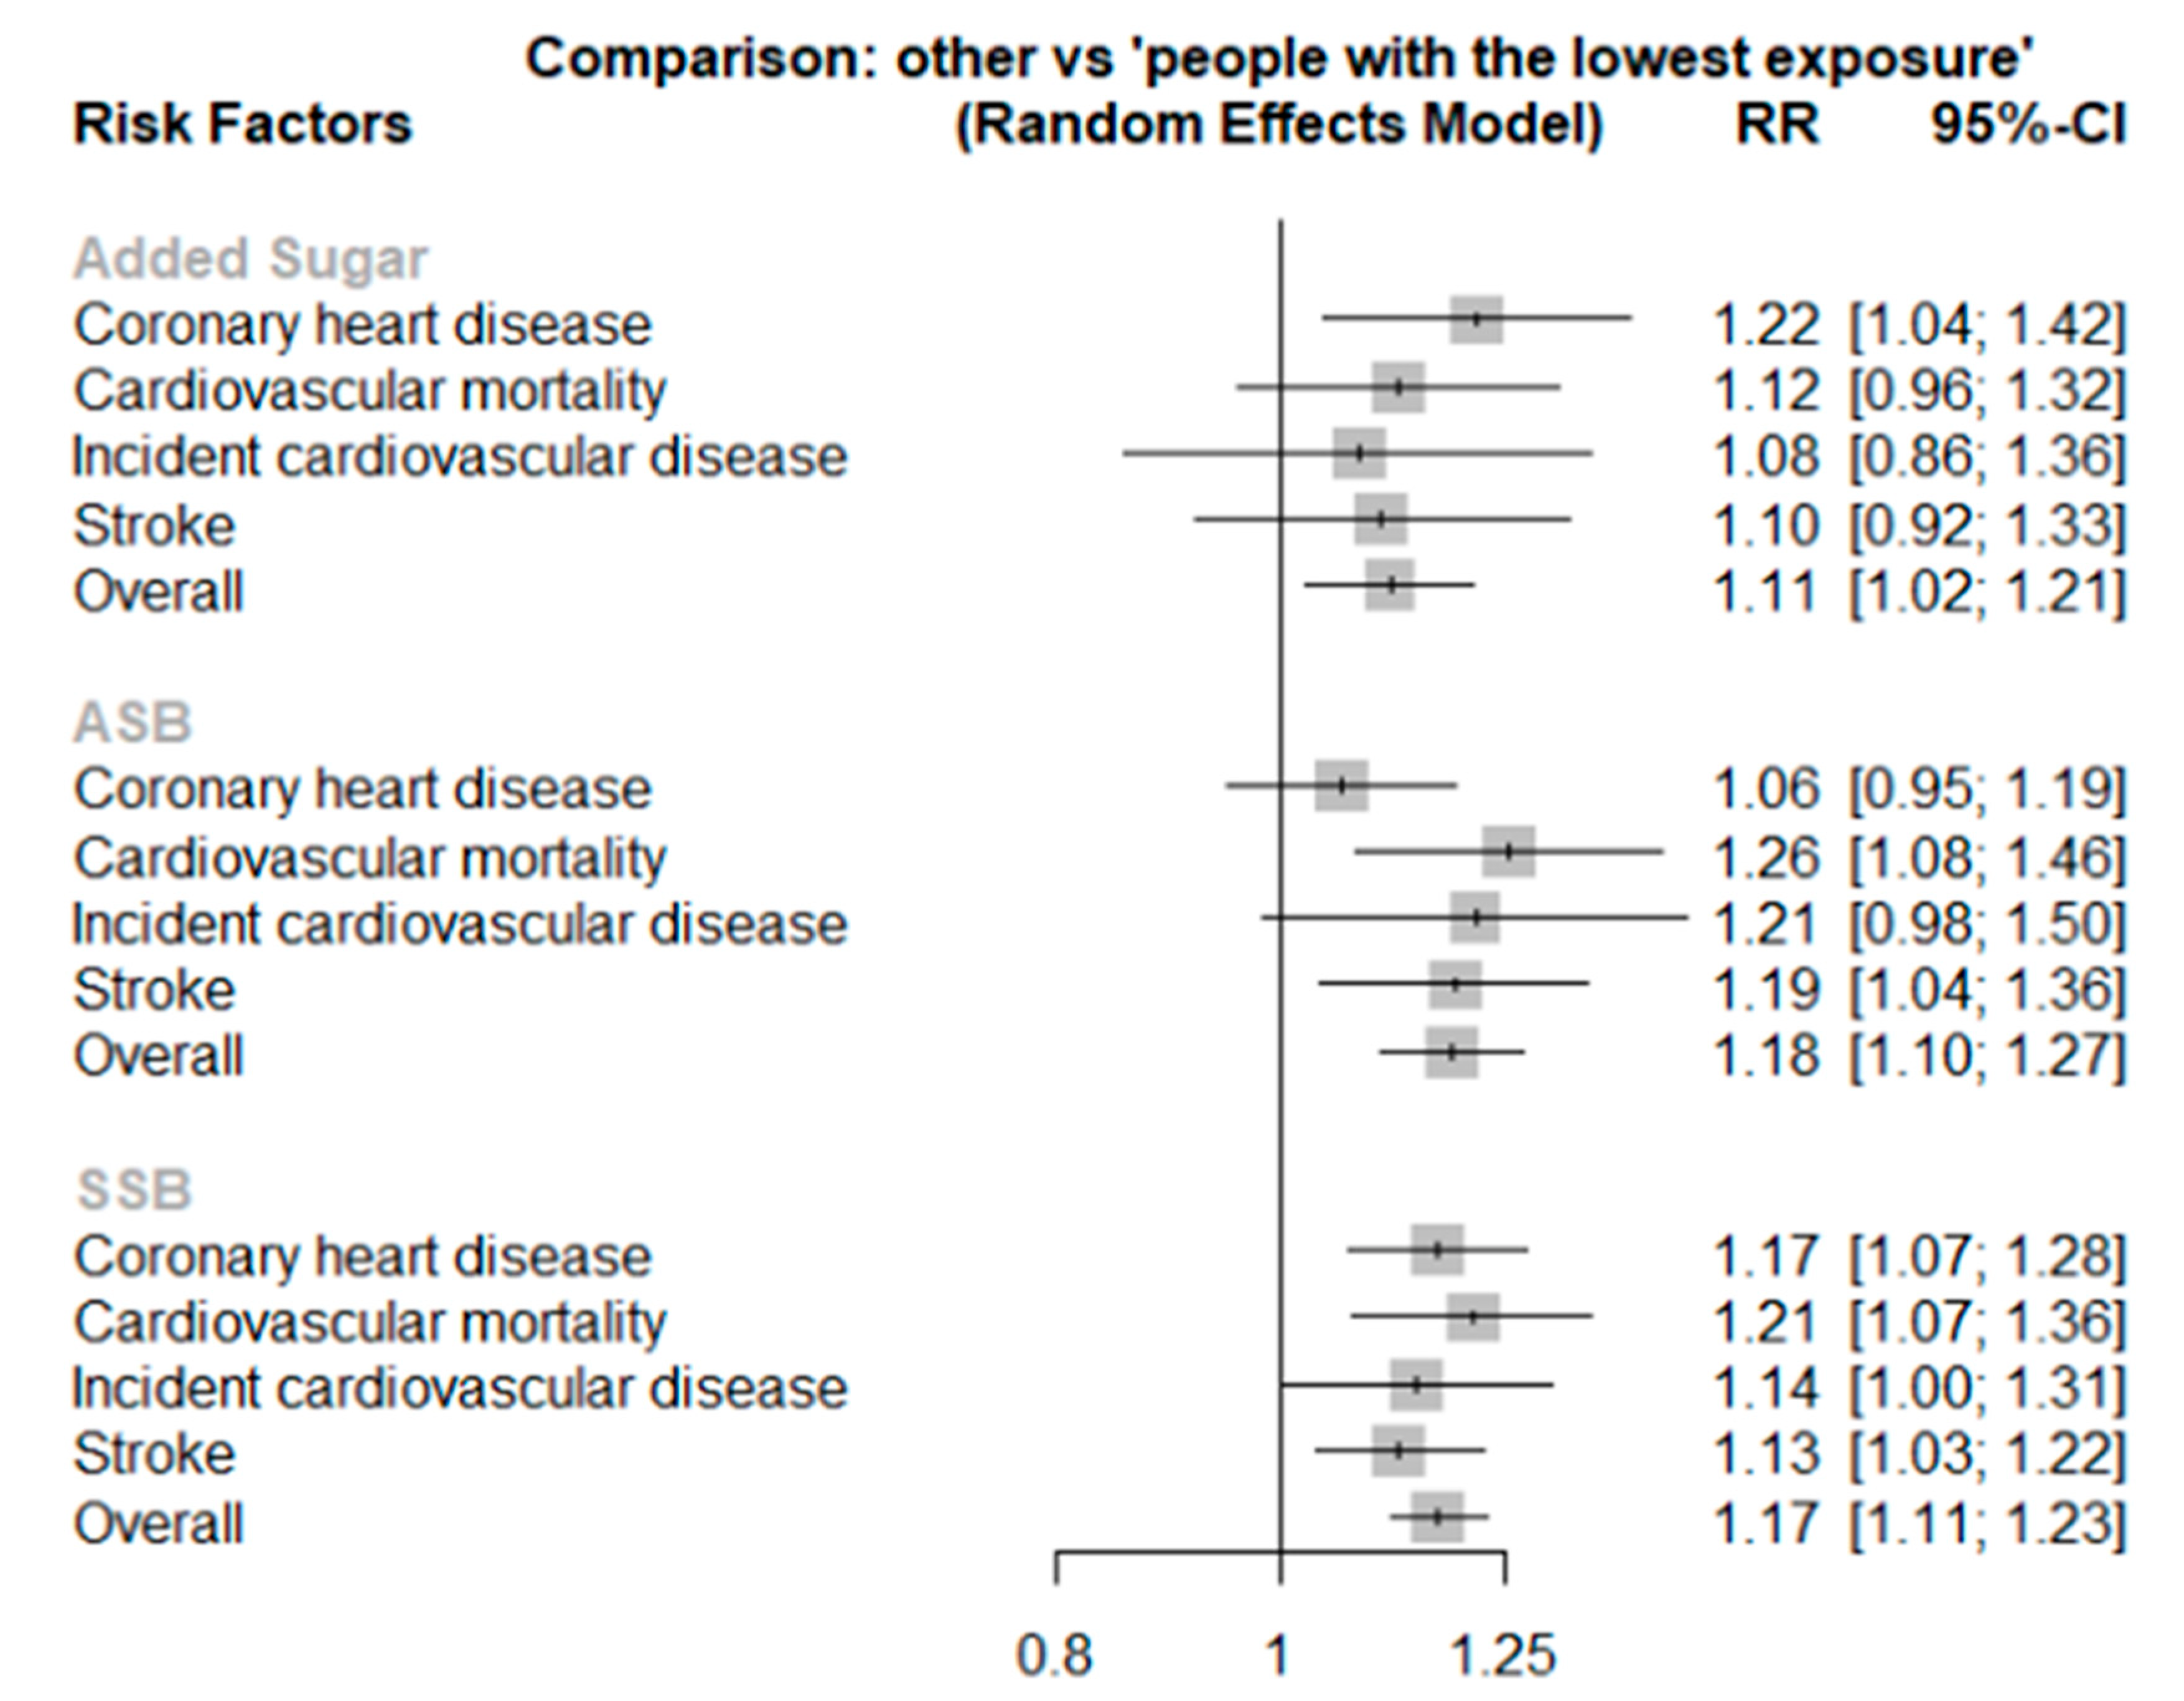
3.4. Results from the Network Meta-Analyses
4. Discussion
4.1. Interpretation of Main Findings
4.2. Strengths and Limitations
5. Conclusions
Supplementary Materials
Author Contributions
Funding
Institutional Review Board Statement
Informed Consent Statement
Data Availability Statement
Acknowledgments
Conflicts of Interest
References
- Institute of Medicine. Dietary Reference Intakes for Energy, Carbohydrate, Fiber, Fat, Fatty Acids, Cholesterol, Protein, and Amino Acids; Panel on Macronutrients; National Academics Press: Washington, DC, USA, 2005. [Google Scholar]
- Bailey, R.L.; Fulgoni, V.L.; Cowan, A.E.; Gaine, P.C. Sources of Added Sugars in Young Children, Adolescents, and Adults with Low and High Intakes of Added Sugars. Nutrients 2018, 10, 102. [Google Scholar] [CrossRef] [PubMed] [Green Version]
- Khan, T.A.; Tayyiba, M.; Agarwal, A.; Mejia, S.B.; de Souza, R.J.; Wolever, T.M.S.; Leiter, L.A.; Kendall, C.W.C.; Jenkins, D.J.A.; Sievenpiper, J.L. Relation of Total Sugars, Sucrose, Fructose, and Added Sugars With the Risk of Cardiovascular Disease: A Systematic Review and Dose-Response Meta-analysis of Prospective Cohort Studies. Mayo Clin. Proc. 2019, 94, 2399–2414. [Google Scholar] [CrossRef] [PubMed] [Green Version]
- Yang, Q.; Zhang, Z.; Gregg, E.W.; Flanders, W.D.; Merritt, R.; Hu, F.B. Added sugar intake and cardiovascular diseases mortality among US adults. JAMA Intern. Med. 2014, 174, 516–524. [Google Scholar] [CrossRef] [Green Version]
- Tasevska, N.; Park, Y.; Jiao, L.; Hollenbeck, A.; Subar, A.F.; Potischman, N. Sugars and risk of mortality in the NIH-AARP Diet and Health Study. Am. J. Clin. Nutr. 2014, 99, 1077–1088. [Google Scholar] [CrossRef] [PubMed] [Green Version]
- Song, S.; Shim, J.E.; Song, Y. Association of added sugar intake with all-cause and cardiovascular disease mortality: A systematic review of cohort studies. Nutr. Res. Pract. 2022, 16, S21–S36. [Google Scholar] [CrossRef] [PubMed]
- Ramne, S.; Alves Dias, J.; Gonzalez-Padilla, E.; Olsson, K.; Lindahl, B.; Engstrom, G.; Ericson, U.; Johansson, I.; Sonestedt, E. Association between added sugar intake and mortality is nonlinear and dependent on sugar source in 2 Swedish population-based prospective cohorts. Am. J. Clin. Nutr. 2019, 109, 411–423. [Google Scholar] [CrossRef] [Green Version]
- Janzi, S.; Ramne, S.; Gonzalez-Padilla, E.; Johnson, L.; Sonestedt, E. Associations Between Added Sugar Intake and Risk of Four Different Cardiovascular Diseases in a Swedish Population-Based Prospective Cohort Study. Front. Nutr. 2020, 7, 603653. [Google Scholar] [CrossRef]
- Liu, Z.M.; Tse, L.A.; Chan, D.; Wong, C.; Wong, S.Y.S. Dietary sugar intake was associated with increased body fatness but decreased cardiovascular mortality in Chinese elderly: An 11-year prospective study of Mr and Ms OS of Hong Kong. Int. J. Obes. 2018, 42, 808–816. [Google Scholar] [CrossRef] [PubMed]
- Johnson, R.K.; Lichtenstein, A.H.; Anderson, C.A.M.; Carson, J.A.; Despres, J.P.; Hu, F.B.; Kris-Etherton, P.M.; Otten, J.J.; Towfighi, A.; Wylie-Rosett, J.; et al. Low-Calorie Sweetened Beverages and Cardiometabolic Health: A Science Advisory From the American Heart Association. Circulation 2018, 138, e126–e140. [Google Scholar] [CrossRef]
- McGlynn, N.D.; Khan, T.A.; Wang, L.; Zhang, R.; Chiavaroli, L.; Au-Yeung, F.; Lee, J.J.; Noronha, J.C.; Comelli, E.M.; Blanco Mejia, S.; et al. Association of Low-and No-Calorie Sweetened Beverages as a Replacement for Sugar-Sweetened Beverages With Body Weight and Cardiometabolic Risk: A Systematic Review and Meta-analysis. JAMA Netw. Open 2022, 5, e222092. [Google Scholar] [CrossRef]
- Yin, J.; Zhu, Y.; Malik, V.; Li, X.; Peng, X.; Zhang, F.F.; Shan, Z.; Liu, L. Intake of Sugar-Sweetened and Low-Calorie Sweetened Beverages and Risk of Cardiovascular Disease: A Meta-Analysis and Systematic Review. Adv. Nutr. 2021, 12, 89–101. [Google Scholar] [CrossRef]
- Guasch-Ferré, M.; Hu, F. Are Fruit Juices Just as Unhealthy as Sugar-Sweetened Beverages? JAMA Netw. Open 2019, 2, e193109. [Google Scholar] [CrossRef]
- Imamura, F.; O’Connor, L.; Ye, Z.; Mursu, J.; Hayashino, Y.; Bhupathiraju, S.N.; Forouhi, N.G. Consumption of sugar sweetened beverages, artificially sweetened beverages, and fruit juice and incidence of type 2 diabetes: Systematic review, meta-analysis, and estimation of population attributable fraction. BMJ 2015, 351, h3576. [Google Scholar] [CrossRef] [Green Version]
- Pan, B.; Ge, L.; Lai, H.; Wang, Q.; Wang, Q.; Zhang, Q.; Yin, M.; Li, S.; Tian, J.; Yang, K.; et al. Association of soft drink and 100% fruit juice consumption with all-cause mortality, cardiovascular diseases mortality, and cancer mortality: A systematic review and dose-response meta-analysis of prospective cohort studies. Crit. Rev. Food Sci. Nutr. 2021, 1–12. Available online: https://pubmed.ncbi.nlm.nih.gov/34121531/ (accessed on 22 September 2022).
- Kannel, W.B.; Hjortland, M.C.; McNamara, P.M.; Gordon, T. Menopause and risk of cardiovascular disease: The Framingham study. Ann. Intern. Med. 1976, 85, 447–452. [Google Scholar] [CrossRef]
- Demel, S.L.; Kittner, S.; Ley, S.H.; McDermott, M.; Rexrode, K.M. Stroke Risk Factors Unique to Women. Stroke 2018, 49, 518–523. [Google Scholar] [CrossRef] [Green Version]
- Prentice, R.R.J.; Furberg, C.; Johnson, S.; Henderson, M.; Cummings, S.; Manson, J.; Freedman, L.; Oberman, A.; Kuller, L. Design of the WHI Clinical Trial and Observational Study. Control. Clin. Trials 1998, 19, 61–109. [Google Scholar]
- Hays, J.; Hunt, J.R.; Hubbell, F.A.; Anderson, G.L.; Limacher, M.; Allen, C.; Rossouw, J.E. The Women’s Health Initiative recruitment methods and results. Ann. Epidemiol. 2003, 13, S18–S77. [Google Scholar] [CrossRef]
- Langer, R.D.; White, E.; Lewis, C.E.; Kotchen, J.M.; Hendrix, S.L.; Trevisan, M. The Women’s Health Initiative Observational Study: Baseline characteristics of participants and reliability of baseline measures. Ann. Epidemiol. 2003, 13, S107–S121. [Google Scholar] [CrossRef]
- Belin, R.J.; Greenland, P.; Allison, M.; Martin, L.; Shikany, J.M.; Larson, J.; Tinker, L.; Howard, B.V.; Lloyd-Jones, D.; Van Horn, L. Diet quality and the risk of cardiovascular disease: The Women’s Health Initiative (WHI). Am. J. Clin. Nutr. 2011, 94, 49–57. [Google Scholar] [CrossRef] [Green Version]
- Curb, J.D.; McTiernan, A.; Heckbert, S.R.; Kooperberg, C.; Stanford, J.; Nevitt, M.; Johnson, K.C.; Proulx-Burns, L.; Pastore, L.; Criqui, M.; et al. Outcomes ascertainment and adjudication methods in the Women’s Health Initiative. Ann. Epidemiol. 2003, 13, S122–S128. [Google Scholar] [CrossRef]
- Schakel, S.F.; Sievert, Y.A.; Buzzard, I.M. Sources of data for developing and maintaining a nutrient database. J. Am. Diet. Assoc. 1988, 88, 1268–1271. [Google Scholar] [CrossRef]
- Nishida, C.; Uauy, R.; Kumanyika, S.; Shetty, P. The joint WHO/FAO expert consultation on diet, nutrition and the prevention of chronic diseases: Process, product and policy implications. Public Health Nutr. 2004, 7, 245–250. [Google Scholar] [CrossRef] [Green Version]
- Huang, M.; Quddus, A.; Stinson, L.; Shikany, J.M.; Howard, B.V.; Kutob, R.M.; Lu, B.; Manson, J.E.; Eaton, C.B. Artificially sweetened beverages, sugar-sweetened beverages, plain water, and incident diabetes mellitus in postmenopausal women: The prospective Women’s Health Initiative observational study. Am. J. Clin. Nutr. 2017, 106, 614–622. [Google Scholar] [CrossRef] [Green Version]
- Mossavar-Rahmani, Y.; Kamensky, V.; Manson, J.E.; Silver, B.; Rapp, S.R.; Haring, B.; Beresford, S.A.A.; Snetselaar, L.; Wassertheil-Smoller, S. Artificially Sweetened Beverages and Stroke, Coronary Heart Disease, and All-Cause Mortality in the Women’s Health Initiative. Stroke 2019, 50, 555–562. [Google Scholar] [CrossRef]
- Ma, Y.; Hebert, J.R.; Balasubramanian, R.; Wedick, N.M.; Howard, B.V.; Rosal, M.C.; Liu, S.; Bird, C.E.; Olendzki, B.C.; Ockene, J.K.; et al. All-cause, cardiovascular, and cancer mortality rates in postmenopausal white, black, Hispanic, and Asian women with and without diabetes in the United States: The Women’s Health Initiative, 1993–2009. Am. J. Epidemiol. 2013, 178, 1533–1541. [Google Scholar] [CrossRef] [Green Version]
- Seth, A.; Mossavar-Rahmani, Y.; Kamensky, V.; Silver, B.; Lakshminarayan, K.; Prentice, R.; Van Horn, L.; Wassertheil-Smoller, S. Potassium intake and risk of stroke in women with hypertension and nonhypertension in the Women’s Health Initiative. Stroke 2014, 45, 2874–2880. [Google Scholar] [CrossRef] [Green Version]
- Guenther, P.M.; Reedy, J.; Krebs-Smith, S.M. Development of the Healthy Eating Index-2005. J. Am. Diet. Assoc. 2008, 108, 1896–1901. [Google Scholar] [CrossRef]
- Cameron, C.; Fireman, B.; Hutton, B.; Clifford, T.; Coyle, D.; Wells, G.; Dormuth, C.R.; Platt, R.; Toh, S. Network meta-analysis incorporating randomized controlled trials and non-randomized comparative cohort studies for assessing the safety and effectiveness of medical treatments: Challenges and opportunities. Syst. Rev. 2015, 4, 147. [Google Scholar] [CrossRef] [Green Version]
- Higgins, J.P.T.; Green, S. Cochrane Handbook for Systematic Reviews of Interventions Version 5.1.0; The Cochrane Collaboration: London, UK, 2011. [Google Scholar]
- Pase, M.P.; Himali, J.J.; Beiser, A.S.; Aparicio, H.J.; Satizabal, C.L.; Vasan, R.S.; Seshadri, S.; Jacques, P.F. Sugar- and Artificially Sweetened Beverages and the Risks of Incident Stroke and Dementia: A Prospective Cohort Study. Stroke 2017, 48, 1139–1146. [Google Scholar] [CrossRef] [Green Version]
- Malik, V.S.; Li, Y.; Pan, A.; De Koning, L.; Schernhammer, E.; Willett, W.C.; Hu, F.B. Long-Term Consumption of Sugar-Sweetened and Artificially Sweetened Beverages and Risk of Mortality in US Adults. Circulation 2019, 139, 2113–2125. [Google Scholar] [CrossRef]
- Gardener, H.; Rundek, T.; Markert, M.; Wright, C.B.; Elkind, M.S.; Sacco, R.L. Diet soft drink consumption is associated with an increased risk of vascular events in the Northern Manhattan Study. J. Gen. Intern. Med. 2012, 27, 1120–1126. [Google Scholar] [CrossRef] [PubMed]
- Collin, L.J.; Judd, S.; Safford, M.; Vaccarino, V.; Welsh, J.A. Association of Sugary Beverage Consumption With Mortality Risk in US Adults: A Secondary Analysis of Data From the REGARDS Study. JAMA Netw. Open 2019, 2, e193121. [Google Scholar] [CrossRef] [PubMed]
- Odegaard, A.O.; Koh, W.P.; Yuan, J.M.; Pereira, M.A. Beverage habits and mortality in Chinese adults. J. Nutr. 2015, 145, 595–604. [Google Scholar] [CrossRef] [PubMed] [Green Version]
- Barrington, W.E.; White, E. Mortality outcomes associated with intake of fast-food items and sugar-sweetened drinks among older adults in the Vitamins and Lifestyle (VITAL) study. Public Health Nutr. 2016, 19, 3319–3326. [Google Scholar] [CrossRef] [Green Version]
- Mullee, A.; Romaguera, D.; Pearson-Stuttard, J.; Viallon, V.; Stepien, M.; Freisling, H.; Fagherazzi, G.; Mancini, F.R.; Boutron-Ruault, M.C.; Kuhn, T.; et al. Association Between Soft Drink Consumption and Mortality in 10 European Countries. JAMA Intern. Med. 2019, 179, 1479–1490. [Google Scholar] [CrossRef] [PubMed] [Green Version]
- Sonestedt, E.; Hellstrand, S.; Schulz, C.A.; Wallstrom, P.; Drake, I.; Ericson, U.; Gullberg, B.; Hedblad, B.; Orho-Melander, M. The association between carbohydrate-rich foods and risk of cardiovascular disease is not modified by genetic susceptibility to dyslipidemia as determined by 80 validated variants. PLoS ONE 2015, 10, e0126104. [Google Scholar] [CrossRef] [PubMed]
- De Koning, L.; Malik, V.S.; Kellogg, M.D.; Rimm, E.B.; Willett, W.C.; Hu, F.B. Sweetened beverage consumption, incident coronary heart disease, and biomarkers of risk in men. Circulation 2012, 125, 1735–1741. [Google Scholar] [CrossRef] [Green Version]
- Eshak, E.S.; Iso, H.; Kokubo, Y.; Saito, I.; Yamagishi, K.; Inoue, M.; Tsugane, S. Soft drink intake in relation to incident ischemic heart disease, stroke, and stroke subtypes in Japanese men and women: The Japan Public Health Centre-based study cohort I. Am. J. Clin. Nutr. 2012, 96, 1390–1397. [Google Scholar] [CrossRef] [Green Version]
- Fung, T.T.; Malik, V.; Rexrode, K.M.; Manson, J.E.; Willett, W.C.; Hu, F.B. Sweetened beverage consumption and risk of coronary heart disease in women. Am. J. Clin. Nutr. 2009, 89, 1037–1042. [Google Scholar] [CrossRef] [Green Version]
- Bernstein, A.M.; de Koning, L.; Flint, A.J.; Rexrode, K.M.; Willett, W.C. Soda consumption and the risk of stroke in men and women. Am. J. Clin. Nutr. 2012, 95, 1190–1199. [Google Scholar] [CrossRef] [Green Version]
- Larsson, S.C.; Akesson, A.; Wolk, A. Sweetened beverage consumption is associated with increased risk of stroke in women and men. J. Nutr. 2014, 144, 856–860. [Google Scholar] [CrossRef]
- Pacheco, L.S.; Lacey, J.V., Jr.; Martinez, M.E.; Lemus, H.; Araneta, M.R.G.; Sears, D.D.; Talavera, G.A.; Anderson, C.A.M. Sugar-Sweetened Beverage Intake and Cardiovascular Disease Risk in the California Teachers Study. J. Am. Heart Assoc. 2020, 9, e014883. [Google Scholar] [CrossRef]
- Zhang, Y.B.; Chen, J.X.; Jiang, Y.W.; Xia, P.F.; Pan, A. Association of sugar-sweetened beverage and artificially sweetened beverage intakes with mortality: An analysis of US National Health and Nutrition Examination Survey. Eur. J. Nutr. 2020, 60, 1945–1955. [Google Scholar] [CrossRef]
- Vyas, A.; Rubenstein, L.; Robinson, J.; Seguin, R.A.; Vitolins, M.Z.; Kazlauskaite, R.; Shikany, J.M.; Johnson, K.C.; Snetselaar, L.; Wallace, R. Diet drink consumption and the risk of cardiovascular events: A report from the Women’s Health Initiative. J. Gen. Intern. Med. 2015, 30, 462–468. [Google Scholar] [CrossRef]
- Yeung, C.H.C.; Louie, J.C.Y. Methodology for the assessment of added/free sugar intake in epidemiological studies. Curr. Opin. Clin. Nutr. Metab. Care 2019, 22, 271–277. [Google Scholar] [CrossRef]
- Brand-Miller, J.C.; Thomas, M.; Swan, V.; Ahmad, Z.I.; Petocz, P.; Colagiuri, S. Physiological validation of the concept of glycemic load in lean young adults. J. Nutr. 2003, 133, 2728–2732. [Google Scholar] [CrossRef] [Green Version]
- Louie, J.C.Y. Objective Biomarkers for Total Added Sugar Intake—Are We on a Wild Goose Chase? Adv. Nutr. 2020, 11, 1429–1436. [Google Scholar] [CrossRef]
- Lee, J.J.; Khan, T.A.; McGlynn, N.; Malik, V.S.; Hill, J.O.; Leiter, L.A.; Jeppesen, P.B.; Rahelic, D.; Kahleova, H.; Salas-Salvado, J.; et al. Relation of Change or Substitution of Low- and No-Calorie Sweetened Beverages With Cardiometabolic Outcomes: A Systematic Review and Meta-analysis of Prospective Cohort Studies. Diabetes Care 2022, 45, 1917–1930. [Google Scholar] [CrossRef]
- Janssens, J.P.; Shapira, N.; Debeuf, P.; Michiels, L.; Putman, R.; Bruckers, L.; Renard, D.; Molenberghs, G. Effects of soft drink and table beer consumption on insulin response in normal teenagers and carbohydrate drink in youngsters. Eur. J. Cancer Prev. 1999, 8, 289–295. [Google Scholar] [CrossRef]
- Ludwig, D.S. The glycemic index: Physiological mechanisms relating to obesity, diabetes, and cardiovascular disease. JAMA 2002, 287, 2414–2423. [Google Scholar] [CrossRef]
- Malik, V.S.; Hu, F.B. Sugar-Sweetened Beverages and Cardiometabolic Health: An Update of the Evidence. Nutrients 2019, 11, 1840. [Google Scholar] [CrossRef] [PubMed]
- Brown, I.J.; Stamler, J.; Van Horn, L.; Robertson, C.E.; Chan, Q.; Dyer, A.R.; Huang, C.C.; Rodriguez, B.L.; Zhao, L.; Daviglus, M.L.; et al. Sugar-sweetened beverage, sugar intake of individuals, and their blood pressure: International study of macro/micronutrients and blood pressure. Hypertension 2011, 57, 695–701. [Google Scholar] [CrossRef] [PubMed] [Green Version]
- Fried, S.K.; Rao, S.P. Sugars, hypertriglyceridemia, and cardiovascular disease. Am. J. Clin. Nutr. 2003, 78, 873S–880S. [Google Scholar] [CrossRef] [Green Version]
- Blundell, J.E.; Hill, A.J. Paradoxical effects of an intense sweetener (aspartame) on appetite. Lancet 1986, 1, 1092–1093. [Google Scholar] [CrossRef]
- Swithers, S.E. Artificial sweeteners are not the answer to childhood obesity. Appetite 2015, 93, 85–90. [Google Scholar] [CrossRef] [PubMed]
- Schulze, M.B.; Manson, J.E.; Ludwig, D.S.; Colditz, G.A.; Stampfer, M.J.; Willett, W.C.; Hu, F.B. Sugar-sweetened beverages, weight gain, and incidence of type 2 diabetes in young and middle-aged women. JAMA 2004, 292, 927–934. [Google Scholar] [CrossRef] [PubMed]


| % Energy from Added Sugar (%EAS) | ||||
|---|---|---|---|---|
| Mean (SD)/No. (%) | <10.0% (N = 48,537) | 10.0–14.9% (N = 39,857) | ≥15.0% (N = 20,640) | p-Value |
| Time to event/censored in years | 17.5 (7.1) | 17.6 (7.2) | 16.9 (7.4) | <0.001 |
| Age, years | 62.8 (7.0) | 62.6 (7.1) | 61.6 (7.2) | <0.001 |
| Body mass index, kg/m2 | 26.4 (5.6) | 27.6 (5.7) | 28.2 (6.0) | <0.001 |
| Physical activity, MET hours per week | 13.8 (14.3) | 12.9 (13.8) | 11.1 (13.5) | <0.001 |
| Dietary Energy, kcal/day | 1628 (619) | 1672 (634) | 1629 (691) | <0.001 |
| Region in U.S. | <0.001 | |||
| Northeast | 10,237 (21) | 9946 (25) | 5285 (26) | |
| South | 11,266 (23) | 9912 (25) | 6239 (30) | |
| Midwest | 10,836 (22) | 8863 (22) | 4254 (21) | |
| West | 16,198 (33) | 11,134 (28) | 4863 (24) | |
| Self-identified race and ethnicity | <0.001 | |||
| White | 41,607 (86) | 34,215 (86) | 15,986 (78) | |
| Black or African American | 2665 (5) | 2810 (7) | 3037 (15) | |
| Hispanic | 2015 (4) | 1364 (4) | 941 (5) | |
| Asian | 1633 (3) | 950 (2) | 398 (2) | |
| Marital status, present relationship | 32,234 (67) | 25,672 (65) | 12,051 (59) | <0.001 |
| 7+ alcoholic drinks per week | 9286 (19) | 3414 (9) | 971 (5) | <0.001 |
| Hormone therapy use | <0.001 | |||
| Never used | 14,799 (32) | 12,560 (33) | 7116 (35) | |
| Past user | 9764 (21) | 8272 (21) | 4594 (23) | |
| Current user | 22,363 (48) | 17,753 (46) | 8344 (42) | |
| Treated high cholesterol | 4686 (10) | 4193 (11) | 2356 (12) | <0.001 |
| History of hypertension | 13,763 (29) | 10,980 (28) | 5927 (29) | 0.004 |
| Family history of diabetes | 14,373 (30) | 12,092 (31) | 6299 (31) | <0.001 |
| Family history of CVD | 31,311 (65) | 25,910 (65) | 13,158 (64) | 0.006 |
| Smoking status | <0.001 | |||
| Nevers | 3991 (50) | 21,039 (53) | 10,490 (52) | |
| Past smoker | 20,734 (43) | 16,117 (41) | 7967 (39) | |
| Current smoker | 3199 (7) | 2240 (6) | 1906 (9) | |
| College education or above | 34,347 (71) | 27,383 (69) | 12,886 (63) | <0.001 |
| HT arm | <0.001 | |||
| Not randomized to HT | 40,024 (83) | 32,785 (83) | 16,249 (79) | |
| E alone | 1520 (3) | 1116 (3) | 855 (4) | |
| E alone control | 1460 (3) | 1310 (3) | 866 (4) | |
| E + P intervention | 2820 (6) | 2355 (6) | 1375 (7) | |
| E + P control | 2713 (6) | 2241 (6) | 1295 (6) | |
| DM arm | <0.001 | |||
| Not randomized to DM | 32,270 (66) | 26,556 (67) | 14,198 (69) | |
| Intervention | 6489 (13) | 5333 (13) | 2586 (12) | |
| Control | 9778 (20) | 7968 (20) | 3856 (19) | |
| CaD arm | 0.789 | |||
| Not randomized to CaD | 36,445 (75) | 29,943 (75) | 15,446 (75) | |
| Intervention | 6026 (12) | 4989 (12) | 2633 (13) | |
| Control | 6066 (12) | 4925 (12) | 2561 (12) | |
| SSB consumption in servings | <0.001 | |||
| <1/week | 19,840 (41) | 13,464 (34) | 4681 (23) | |
| 1/week to <1/day | 27,603 (57) | 24,548 (62) | 11,806 (57) | |
| ≥1 serving/day | 1094 (2) | 1845 (5) | 4153 (20) | |
| ASB consumption in servings 1 | <0.001 | |||
| <1/week | 16,102 (68) | 12,212 (62) | 5917 (63) | |
| 1/week to <1/day | 5172 (22) | 4866 (25) | 2010 (21) | |
| ≥1 serving/day | 2586 (11) | 2390 (12) | 1499 (16) | |
| Fruit juice in servings | <0.001 | |||
| <1 serving/week | 22,659 (47) | 18,689 (47) | 10,911 (53) | |
| ≥1 serving/week | 25,878 (53) | 21,168 (53) | 9729 (47) | |
| Fruit drinks in servings | <0.001 | |||
| <1 serving/week | 47,801 (98) | 37,971 (95) | 18,354 (89) | |
| ≥1 serving/week | 736 (2) | 1886 (5) | 2286 (11) | |
| Soft drinks in servings | <0.001 | |||
| <1 serving/week | 45,549 (94) | 31,178 (78) | 9920 (48) | |
| ≥1 serving/week | 2998 (6) | 8679 (22) | 10,720 (52) | |
| Model 1 * | Model 2 ** | Model 3 *** | Model 4 **** | |||||||
|---|---|---|---|---|---|---|---|---|---|---|
| Cases/ Total | Person-Years | HR (95% CI) | p-Value | HR (95% CI) | p Value | HR (95% CI) | p-Value | HR (95% CI) | p Value | |
| TOTAL CARDIOVASCULAR DISEASE | ||||||||||
| %EAS | ||||||||||
| <10% | 5057/ 48,537 | 816,087 | 1.00 reference | 1.00 reference | 1.00 reference | 1.00 reference | ||||
| 10-14.9% | 4209/ 39,857 | 669,565 | 1.03 (0.99, 1.07) | 0.18 | 1.01 (0.97, 1.06) | 0.65 | 1.00 (0.96, 1.06) | 0.74 | 1.01 (0.97, 1.06) | 0.62 |
| ≥15.0% | 2331/ 20,640 | 331,972 | 1.18 (1.12, 1.24) | <0.001 | 1.08 (1.02, 1.14) | 0.01 | 1.08 (1.01, 1.15) | 0.02 | 1.08 (1.01, 1.15) | 0.02 |
| Total SSBs | ||||||||||
| <1/week | 4089/ 37,985 | 635,576 | 1.00 reference | 1.00 reference | 1.00 reference | 1.00 reference | ||||
| 1/week to <1 day | 6713/ 63,957 | 1,068,255 | 1.02 (0.98, 1.07) | 0.25 | 1.00 (0.96, 1.05) | 0.99 | 0.99 (0.95, 1.04) | 0.85 | 1.00 (0.96, 1.05) | 0.91 |
| ≥ 1/day | 795/ 7092 | 113,793 | 1.45 (1.34, 1.56) | <0.001 | 1.27 (1.17, 1.36) | <0.001 | 1.30 (1.18, 1.42) | <0.001 | 1.29 (1.17, 1.42) | <0.001 |
| Fruit Juices | ||||||||||
| <1/week | 5669/ 52,259 | 864,018 | 1.00 reference | 1.00 reference | 1.00 reference | 1.00 reference | ||||
| ≥1/week | 5928/ 56,775 | 953,607 | 0.98 (0.95, 1.02) | 0.37 | 0.99 (0.94, 1.03) | 0.50 | 0.97 (0.94, 1.02) | 0.33 | 0.99 (0.95, 1.03) | 0.56 |
| Fruit drinks | ||||||||||
| <1/week | 11,020/ 104,126 | 1,742,044 | 1.00 reference | 1.00 reference | 1.00 reference | 1.00 reference | ||||
| ≥1/week | 577/ 4908 | 75,581 | 1.30 (1.19, 1.41) | <0.001 | 1.14 (1.03, 1.25) | 0.01 | 1.14 (1.03, 1.25) | <0.001 | 1.13 (1.03, 1.25) | 0.01 |
| Soft drinks | ||||||||||
| <1/week | 9126/ 86,647 | 1,460,115 | 1.00 reference | 1.00 reference | 1.00 reference | 1.00 reference | ||||
| ≥1/week | 2471/ 22,387 | 357,510 | 1.24 (1.18, 1.30) | <0.001 | 1.11 (1.06, 1.17) | <0.001 | 1.10 (1.05, 1.17) | <0.001 | 1.10 (1.04, 1.16) | <0.001 |
| CORONARY HEART DISEASE | ||||||||||
| %EAS | ||||||||||
| <10% | 2055/ 48,537 | 840,422 | 1.00 reference | 1.00 reference | 1.00 reference | 1.00 reference | ||||
| 10-14.9% | 1657/ 39,857 | 689,954 | 1.00 (0.94, 1.07) | 0.96 | 0.99 (0.23, 1.07) | 0.83 | 1.01 (0.94, 1.09) | 0.77 | 1.02 (0.94, 1.09) | 0.69 |
| ≥15.0% | 983/ 20,640 | 342,816 | 1.22 (1.13, 1.32) | <0.001 | 1.14 (1.04, 1.24) | <0.01 | 1.19 (1.08, 1.31) | <0.001 | 1.20 (1.09, 1.32) | <0.001 |
| Total SSBs | ||||||||||
| <1/week | 1703/ 37,985 | 654,137 | 1.00 reference | 1.00 reference | 1.00 reference | 1.00 reference | ||||
| 1/week to <1 day | 2670/ 63,957 | 1,101,210 | 0.99 (0.93, 1.05) | 0.72 | 0.96 (0.90, 1.03) | 0.27 | 0.97 (0.90, 1.04) | 0.42 | 0.98 (0.91, 1.05) | 0.52 |
| ≥ 1/day | 322/ 7092 | 117,846 | 1.44 (1.27, 1.63) | <0.001 | 1.26 (1.10, 1.45) | <0.001 | 1.34 (1.16, 1.56) | <0.001 | 1.35 (1.16, 1.57) | <0.001 |
| Fruit Juices | ||||||||||
| <1/week | 2369/ 52,259 | 889,998 | 1.00 reference | 1.00 reference | 1.00 reference | 1.00 reference | ||||
| ≥1/week | 2326/ 56,775 | 983,195 | 0.93 (0.88, 0.99) | 0.02 | 0.92 (0.86, 0.98) | 0.01 | 0.92 (0.86, 0.99) | 0.02 | 0.93 (0.87, 0.99) | 0.03 |
| Fruit drinks | ||||||||||
| <1/week | 4472/ 104,126 | 1,794,920 | 1.00 reference | 1.00 reference | 1.00 reference | 1.00 reference | ||||
| ≥1/week | 223/ 4908 | 78,273 | 1.24 (1.08, 1.42) | <0.001 | 0.98 (0.84, 1.15) | 0.85 | 1.00 (0.86, 1.17) | 0.98 | 0.99 (0.85, 1.17) | 0.94 |
| Soft drinks | ||||||||||
| <1/week | 3683/ 86,647 | 1,503,955 | 1.00 reference | 1.00 reference | 1.00 reference | 1.00 reference | ||||
| ≥1/week | 1012/ 22,387 | 369,238 | 1.27 (1.18, 1.37) | <0.001 | 1.16 (1.07, 1.26) | <0.001 | 1.17 (1.08, 1.28) | <0.001 | 1.17 (1.08, 1.27) | <0.001 |
| HEART FAILURE | ||||||||||
| %EAS | ||||||||||
| <10% | 646/ 48,537 | 848,296 | 1.00 reference | 1.00 reference | 1.00 reference | 1.00 reference | ||||
| 10-14.9% | 496/ 39,857 | 696,141 | 0.96 (0.86, 1.09) | 0.54 | 0.96 (0.84, 1.10) | 0.57 | 0.94 (0.82 1.08) | 0.37 | 0.96 (0.84, 1.10) | 0.56 |
| ≥15.0% | 279/ 20,640 | 364,555 | 1.10 (0.95, 1.27) | 0.19 | 1.02 (0.87, 1.20) | 0.81 | 0.99 (0.83, 1.19) | 0.95 | 1.01 (0.84, 1.20) | 0.94 |
| Total SSBs | ||||||||||
| <1/week | 469/ 37,985 | 661,580 | 1.00 reference | 1.00 reference | 1.00 reference | 1.00 reference | ||||
| 1/week to <1 day | 853/ 63,957 | 1,110,471 | 1.07 (0.95, 1.20) | 0.24 | 1.03 (0.90, 1.17) | 0.70 | 1.01 (0.88, 1.15) | 0.91 | 1.03 (0.90, 1.18) | 0.64 |
| ≥ 1/day | 99/ 7092 | 118,942 | 1.51 (1.21, 1.89) | <0.001 | 1.32 (1.03 1.69) | 0.03 | 1.33 (1.02, 1.73) | 0.03 | 1.35 (1.03, 1.76) | 0.03 |
| Fruit Juices | ||||||||||
| <1/week | 644/ 52,259 | 899,899 | 1.00 reference | 1.00 reference | 1.00 reference | 1.00 reference | ||||
| ≥1/week | 777/ 56,775 | 991,093 | 1.06 (0.95, 1.18) | 0.29 | 1.07 (0.95, 1.21) | 0.26 | 1.05 (0.93, 1.19) | 0.44 | 1.08 (0.96, 1.22) | 0.22 |
| Fruit drinks | ||||||||||
| <1/week | 1336/ 104,126 | 1,812,274 | 1.00 reference | 1.00 reference | 1.00 reference | 1.00 reference | ||||
| ≥1/week | 85/ 4908 | 78,720 | 1.61 (1.29, 2.01) | <0.001 | 1.61 (1.29, 2.05) | <0.001 | 1.64 (1.28, 2.09) | <0.001 | 1.61 (1.26, 2.06) | <0.001 |
| Soft drinks | ||||||||||
| <1/week | 1108/ 86,647 | 1,518,384 | 1.00 reference | 1.00 reference | 1.00 reference | 1.00 reference | ||||
| ≥1/week | 313/ 22,387 | 372,609 | 1.32 (1.16, 1.50) | <0.001 | 1.09 (0.94, 1.27) | 0.26 | 1.09 (0.94, 1.28) | 0.26 | 1.07 (0.92, 1.26) | 0.37 |
| Model 1 * | Model 2 ** | Model 3 *** | Model 4 **** | |||||||
|---|---|---|---|---|---|---|---|---|---|---|
| Cases/ Total | Person Years | HR (95% CI) | p Value | HR (95% CI) | p Value | HR (95% CI) | p Value | HR (95% CI) | p Value | |
| STROKE | ||||||||||
| %EAS | ||||||||||
| <10% | 1876/ 48,537 | 842,491 | 1.00 reference | 1.00 reference | 1.00 reference | 1.00 reference | ||||
| 10-14.9% | 1518/ 39,857 | 691,427 | 1.00 (0.93, 1.07) | 0.98 | 0.98 (0.91, 1.06) | 0.59 | 0.97 (0.89, 1.05) | 0.40 | 0.97 (0.90, 1.05) | 0.49 |
| ≥15.0% | 821/ 20,640 | 344,125 | 1.13 (1.04, 1.22) | <0.01 | 1.01 (0.92, 1.11) | 0.83 | 0.99 (0.89, 1.10) | 0.84 | 0.99 (0.89, 1.10) | 0.83 |
| Total SSBs | ||||||||||
| <1/week | 1469/ 37,985 | 657,070 | 1.00 reference | 1.00 reference | 1.00 reference | 1.00 reference | ||||
| 1/week to <1 day | 2459/ 63,957 | 110,294 | 1.07 (1.00, 1.14) | 0.06 | 1.02 (0.95, 1.10) | 0.63 | 1.02 (0.94, 1.10) | 0.64 | 1.02 (0.95, 1.10) | 0.61 |
| ≥ 1/day | 287/ 7092 | 118,026 | 1.54 (1.36, 1.76) | <0.001 | 1.29 (1.11, 1.50) | <0.01 | 1.32 (1.13, 1.56) | 0.001 | 1.30 (1.10, 1.53) | <0.01 |
| Fruit Juices | ||||||||||
| <1/week | 2025/ 52,259 | 893,601 | 1.00 reference | 1.00 reference | 1.00 reference | 1.00 reference | ||||
| ≥1/week | 2190/ 56,775 | 984,442 | 1.04 (0.98, 1.11) | 0.20 | 1.03 (0.96, 1.10) | 0.44 | 1.03 (0.96, 1.10) | 0.45 | 1.03 (0.96, 1.10) | 0.44 |
| Fruit drinks | ||||||||||
| <1/week | 3995/ 104,126 | 1,799,783 | 1.00 reference | 1.00 reference | 1.00 reference | 1.00 reference | ||||
| ≥1/week | 220/ 4908 | 78,280 | 1.37 (1.20, 1.57) | <0.001 | 1.19 (1.02, 1.39) | 0.03 | 1.19 (1.02, 1.39) | 0.03 | 1.19 (1.01, 1.39) | 0.03 |
| Soft drinks | ||||||||||
| <1/week | 3340/ 86,647 | 1,508,172 | 1.00 reference | 1.00 reference | 1.00 reference | 1.00 reference | ||||
| ≥1/week | 875/ 22,387 | 369,871 | 1.22 (1.13, 1.31) | <0.001 | 1.08 (0.99, 1.18) | 0.09 | 1.06 (0.98, 1.16) | 0.20 | 1.06 (0.97, 1.17) | 0.20 |
| ISCHEMIC STROKE | ||||||||||
| %EAS | ||||||||||
| <10% | 1413/ 48,537 | 843,547 | 1.00 reference | 1.00 reference | 1.00 reference | 1.00 reference | ||||
| 10-14.9% | 1092/ 39,857 | 692,535 | 0.95 (0.88, 1.03) | 0.25 | 0.92 (0.84, 1.01) | 0.07 | 0.90 (0.83, 0.99) | 0.03 | 0.91 (0.83, 1.00) | 0.04 |
| ≥15.0% | 609/ 20,640 | 344,799 | 1.11 (1.01, 1.23) | 0.03 | 0.98 (0.88, 1.09) | 0.70 | 0.94 (0.85, 1.06) | 0.36 | 0.94 (0.83, 1.06) | 0.34 |
| Total SSBs | ||||||||||
| <1/week | 1073/ 37,985 | 658,074 | 1.00 reference | 1.00 reference | 1.00 reference | 1.00 reference | ||||
| 1/week to <1 day | 1820/ 63,957 | 110,457 | 1.09 (1.01, 1.17) | 0.04 | 1.03 (0.94, 1.12) | 0.53 | 1.02 (0.94, 1.12) | 0.72 | 1.03 (0.94, 1.13) | 0.51 |
| ≥ 1/day | 221/ 7092 | 118,236 | 1.63 (1.41, 1.89) | <0.001 | 1.31 (1.10, 1.56) | <0.01 | 1.35 (1.11, 1.62) | 0.002 | 1.32 (1.09, 1.59) | <0.01 |
| Fruit Juices | ||||||||||
| <1/week | 1493/ 52,259 | 894,973 | 1.00 reference | 1.00 reference | 1.00 reference | 1.00 reference | ||||
| ≥1/week | 1621/ 56,775 | 985,907 | 1.05 (0.98, 1.13) | 0.16 | 1.04 (0.96, 1.13) | 0.35 | 1.10 (0.96, 1.13) | 0.36 | 1.04 (0.96, 1.13) | 0.34 |
| Fruit drinks | ||||||||||
| <1/week | 2951/ 104,126 | 1,802,449 | 1.00 reference | 1.00 reference | 1.00 reference | 1.00 reference | ||||
| ≥1/week | 163/ 4908 | 78,432 | 1.38 (1.17, 1.61) | <0.001 | 1.19 (1.00, 1.43) | 0.05 | 1.19 (0.99, 1.43) | 0.06 | 1.19 (0.99, 1.42) | 0.07 |
| Soft drinks | ||||||||||
| <1/week | 2452/ 86,647 | 1,510,389 | 1.00 reference | 1.00 reference | 1.00 reference | 1.00 reference | ||||
| ≥1/week | 662/ 22,387 | 370,492 | 1.25 (1.14, 1.36) | <0.001 | 1.07 (0.97, 1.19) | 0.19 | 1.06 (0.95, 1.18) | 0.31 | 1.05 (0.94, 1.17) | 0.37 |
| HEMORRHAGIC STROKE | ||||||||||
| %EAS | ||||||||||
| <10% | 268/ 48,537 | 851,915 | 1.00 reference | 1.00 reference | 1.00 reference | 1.00 reference | ||||
| 10-14.9% | 253/ 39,640 | 698,695 | 1.16 (0.97, 1.38) | 0.09 | 1.21 (0.99, 1.47) | 0.06 | 1.20 (0.98, 1.46) | 0.08 | 1.22 (1.00, 1.50) | 0.05 |
| ≥15.0% | 129/ 20,640 | 348,013 | 1.18 (0.96, 1.46) | 0.12 | 1.20 (0.94, 1.53) | 0.14 | 1.22 (0.94, 1.59) | 0.14 | 1.23 (0.94, 1.61) | 0.13 |
| Total SSBs | ||||||||||
| <1/week | 230/ 37,985 | 663,865 | 1.00 reference | 1.00 reference | 1.00 reference | 1.00 reference | ||||
| 1/week to <1 day | 377/ 63,957 | 1,115,239 | 1.01 (0.85, 1.19) | 0.93 | 1.00 (0.83, 1.22) | 0.96 | 0.99 (0.82, 1.21) | 0.94 | 1.00 (0.82, 1.22) | 0.97 |
| ≥ 1/day | 43/ 7092 | 119,519 | 1.29 (0.93, 1.80) | 0.13 | 1.37 (0.94, 1.98) | 0.10 | 1.35 (0.91, 2.00) | 0.14 | 1.37 (0.92, 2.04) | 0.13 |
| Fruit Juices | ||||||||||
| <1/week | 308/ 52,259 | 903,166 | 1.00 reference | 1.00 reference | 1.00 reference | 1.00 reference | ||||
| ≥1/week | 342/ 56,775 | 995,457 | 1.04 (0.89, 1.22) | 0.64 | 1.00 (0.84, 1.20) | 0.99 | 1.08 (1.07, 1.09) | 0.90 | 0.99 (0.82, 1.19) | 0.92 |
| Fruit drinks | ||||||||||
| <1/week | 613/ 104,126 | 1,819,355 | 1.00 reference | 1.00 reference | 1.00 reference | 1.00 reference | ||||
| ≥1/week | 37/ 4908 | 79,268 | 1.44 (1.03, 2.01) | 0.03 | 1.41 (0.97, 2.05) | 0.07 | 1.37 (0.94, 2.01) | 0.09 | 1.39 (0.95, 2.04) | 0.09 |
| Soft drinks | ||||||||||
| <1/week | 523/ 86,647 | 1,524,368 | 1.00 reference | 1.00 reference | 1.00 reference | 1.00 reference | ||||
| ≥1/week | 127/ 22,387 | 374,255 | 1.08 (0.89, 1.31) | 0.45 | 1.12 (0.89, 1.40) | 0.34 | 1.09 (0.86, 1.37) | 0.49 | 1.11 (0.88, 1.41) | 0.37 |
| Model 1 * | Model 2 ** | Model 3 *** | Model 4 **** | |||||||
|---|---|---|---|---|---|---|---|---|---|---|
| Cases/ Total | Person Years | HR (95% CI) | p Value | HR (95% CI) | p Value | HR (95% CI) | p Value | HR (95% CI) | p Value | |
| TOTAL CARDIOVASCULAR DISEASE | ||||||||||
| <1/week | 2994/ 34,231 | 579,025 | 1.00 reference | 1.00 reference | 1.00 reference | 1.00 reference | ||||
| 1/week to <1 day | 971/ 12,048 | 206,631 | 1.06 (0.98, 1.14) | 0.14 | 0.97 (0.89, 1.05) | 0.41 | 0.98 (0.92, 1.08) | 0.95 | 0.97 (0.90, 1.05) | 0.44 |
| ≥ 1 serving/day | 536/ 6475 | 112,782 | 1.26 (1.15, 1.39) | <0.001 | 1.15 (1.04, 1.27) | 0.01 | 1.20 (1.09, 1.33) | <0.001 | 1.14 (1.03, 1.26) | 0.01 |
| CORONARY HEART DISEASE | ||||||||||
| <1/week | 1139/ 34,231 | 594,854 | 1.00 reference | 1.00 reference | 1.00 reference | 1.00 reference | ||||
| 1/week to <1 day | 365/ 12,048 | 212,095 | 1.04 (0.92, 1.17) | 0.51 | 0.97 (0.85, 1.10) | 0.65 | 1.00 (0.88, 1.14) | 0.93 | 0.97 (0.85, 1.10) | 0.65 |
| ≥ 1 serving/day | 194/ 6475 | 115,749 | 1.20 (1.02, 1.40) | 0.02 | 1.13 (0.95, 1.33) | 0.16 | 1.17 (0.99, 1.37) | 0.06 | 1.12 (0.95, 1.32) | 0.17 |
| HEART FAILURE | ||||||||||
| <1/week | 409/ 34,231 | 599,710 | 1.00 reference | 1.00 reference | 1.00 reference | 1.00 reference | ||||
| 1/week to <1 day | 133/ 12,048 | 213,761 | 1.12 (0.92, 1.37) | 0.26 | 0.90 (0.72, 1.12) | 0.35 | 0.96 (0.71, 1.19) | 0.71 | 0.90 (0.72, 1.12) | 0.35 |
| ≥ 1 serving/day | 67/ 6475 | 116,649 | 1.26 (0.97, 1.64) | 0.09 | 0.97 (0.73, 1.28) | 0.81 | 1.11 (0.84, 1.47) | 0.45 | 0.96 (0.72, 1.28) | 0.79 |
| STROKE | ||||||||||
| <1/week | 1013/ 34,231 | 596,504 | 1.00 reference | 1.00 reference | 1.00 reference | 1.00 reference | ||||
| 1/week to <1 day | 317/ 12,048 | 212,689 | 1.01 (0.89, 1.14) | 0.92 | 0.98 (0.85, 1.12) | 0.75 | 0.99 (0.87, 1.14) | 0.93 | 0.98 (0.85, 1.13) | 0.78 |
| ≥ 1 serving/day | 184/ 6475 | 115,884 | 1.31 (1.11, 1.54) | <0.001 | 1.25 (1.05, 1.49) | 0.01 | 1.28 (1.08, 1.52) | 0.004 | 1.24 (1.04, 1.48) | 0.01 |
| ISCHEMIC STROKE | ||||||||||
| <1/week | 777/ 34,231 | 597,236 | 1.00 reference | 1.00 reference | 1.00 reference | 1.00 reference | ||||
| 1/week to <1 day | 241/ 12,048 | 212,919 | 1.00 (0.86, 1.15) | 0.97 | 0.98 (0.83, 1.14) | 0.77 | 1.00 (0.86, 1.17) | 0.96 | 0.98 (0.84, 1.15) | 0.79 |
| ≥ 1 serving/day | 136/ 6475 | 116,056 | 1.25 (1.04, 1.51) | 0.02 | 1.18 (0.97, 1.45) | 0.11 | 1.23 (1.00, 1.50) | 0.05 | 1.18 (0.96, 1.44) | 0.11 |
| HEMORRHAGIC STROKE | ||||||||||
| <1/week | 150/ 34,231 | 602,073 | 1.00 reference | 1.00 reference | 1.00 reference | 1.00 reference | ||||
| 1/week to <1 day | 53/ 12,048 | 214,496 | 1.08 (0.79, 1.49) | 0.62 | 1.07 (0.76, 1.52) | 0.69 | 1.02 (0.73, 1.45) | 0.88 | 1.07 (0.76, 1.52) | 0.69 |
| ≥ 1 serving/day | 31/ 6475 | 116,922 | 1.37 (0.92, 2.02) | 0.12 | 1.29 (0.83, 2.01) | 0.25 | 1.27 (0.83, 1.95) | 0.27 | 1.29 (0.83, 2.01) | 0.25 |
| RR (95% CI) 1 | ||||
|---|---|---|---|---|
| Incident Cardiovascular Disease | Cardiovascular Mortality | Coronary Heart Disease | Stroke | |
| ASB | 1.21 (0.98–1.50) n = 2 | 1.26 (1.08–1.46) * n = 6 | 1.06 (0.95, 1.19) n = 4 | 1.19 (1.04, 1.36) * n = 5 |
| SSB | 1.14 (1.00–1.31) * n = 4 | 1.21 (1.07–1.36) * n = 10 | 1.17 (1.07–1.28) * n = 10 | 1.13 (1.03, 1.22) * n = 12 |
| Added sugar | 1.08 (0.86–1.36) n = 1 | 1.12 (0.96–1.32) n = 8 | 1.22 (1.04–1.42) * n = 2 | 1.10 (0.92, 1.33) n = 2 |
| I-squared (p value) | 71.3% * (<0.01) | 62.4% * (<0.01) | 38.2% (0.09) | 43.6% * (0.03) |
Publisher’s Note: MDPI stays neutral with regard to jurisdictional claims in published maps and institutional affiliations. |
© 2022 by the authors. Licensee MDPI, Basel, Switzerland. This article is an open access article distributed under the terms and conditions of the Creative Commons Attribution (CC BY) license (https://creativecommons.org/licenses/by/4.0/).
Share and Cite
Yang, B.; Glenn, A.J.; Liu, Q.; Madsen, T.; Allison, M.A.; Shikany, J.M.; Manson, J.E.; Chan, K.H.K.; Wu, W.-C.; Li, J.; et al. Added Sugar, Sugar-Sweetened Beverages, and Artificially Sweetened Beverages and Risk of Cardiovascular Disease: Findings from the Women’s Health Initiative and a Network Meta-Analysis of Prospective Studies. Nutrients 2022, 14, 4226. https://doi.org/10.3390/nu14204226
Yang B, Glenn AJ, Liu Q, Madsen T, Allison MA, Shikany JM, Manson JE, Chan KHK, Wu W-C, Li J, et al. Added Sugar, Sugar-Sweetened Beverages, and Artificially Sweetened Beverages and Risk of Cardiovascular Disease: Findings from the Women’s Health Initiative and a Network Meta-Analysis of Prospective Studies. Nutrients. 2022; 14(20):4226. https://doi.org/10.3390/nu14204226
Chicago/Turabian StyleYang, Bo, Andrea J. Glenn, Qing Liu, Tracy Madsen, Matthew A. Allison, James M. Shikany, JoAnn E. Manson, Kei Hang Katie Chan, Wen-Chih Wu, Jie Li, and et al. 2022. "Added Sugar, Sugar-Sweetened Beverages, and Artificially Sweetened Beverages and Risk of Cardiovascular Disease: Findings from the Women’s Health Initiative and a Network Meta-Analysis of Prospective Studies" Nutrients 14, no. 20: 4226. https://doi.org/10.3390/nu14204226