Article

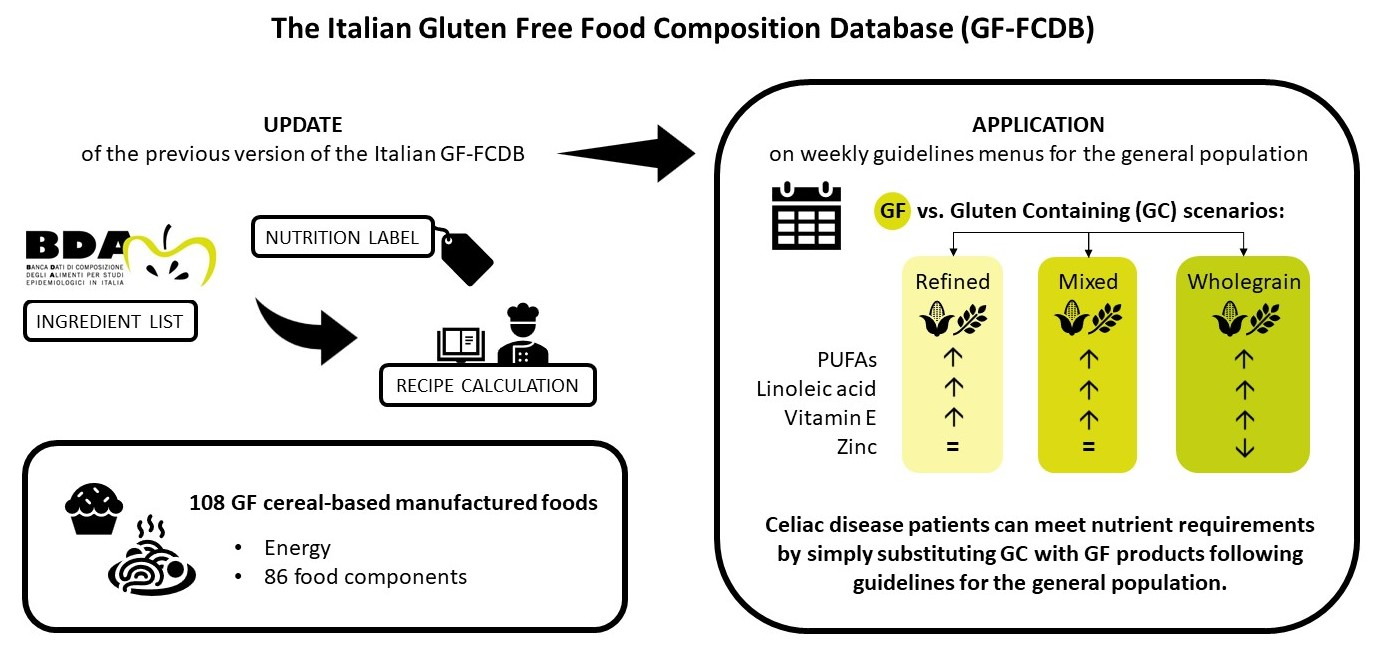
The Update of the Italian Food Composition Database of Gluten-Free Products and Its Application in Food-Based Dietary Guidelines Menus

1
Department of Medicine, University of Udine, 33100 Udine, Italy
2
Food and Drug Department, University of Parma, 43124 Parma, Italy
3
Department of Agricultural, Food, Environmental and Animal Sciences, University of Udine, 33100 Udine, Italy
*
Author to whom correspondence should be addressed.
Nutrients 2022, 14(19), 4171; https://doi.org/10.3390/nu14194171
Submission received: 26 August 2022 / Revised: 2 October 2022 / Accepted: 5 October 2022 / Published: 7 October 2022
(This article belongs to the Section Nutrition and Public Health)

Abstract

:
Complete food composition databases (FCDBs) on gluten-free (GF) foods are needed to assess the nutrient intakes of celiac disease patients. The aim of the present work was to update the previously developed version of the Italian GF-FCDB and to apply it to a theoretical GF diet. The updated GF-FCDB includes the composition of 108 GF cereal-based foods, as sold, in terms of energy and macro- and micro-nutrients, imputed using food label information combined with the standard recipe approach. Three scenarios (i.e., refined, mixed, and wholegrain cereals) of the weekly guideline menu for the general Italian population were analyzed for energy and nutrient content in a theoretical dietary assessment using traditional gluten-containing (GC) foods and the corresponding GF substitutes. All GF menus were higher than the corresponding GC menus in polyunsaturated fatty acids, linoleic acid, and vitamin E. Zinc was lower in GF than in GC menus only in the wholegrain-cereal scenario. Thanks to the application of the updated GF-FCDB including a comprehensive list of micronutrients, we observed that it is possible for celiac disease patients to meet nutrient requirements by simply substituting GC with GF cereal-based products following recommendations for the general population.

Graphical Abstract

1. Introduction

Celiac disease is a chronic immune-mediated enteropathy occurring in genetically susceptible individuals characterized by a specific serological and histological profile triggered by gluten ingestion [1]. It is one of the most common autoimmune disorders, with a reported global prevalence of 0.7% and 1.4% based on serologic tests and biopsy, respectively, and a high prevalence (0.8%) in European countries [2]. The complete exclusion from the diet of gluten, which is a protein complex present in some cereal products such as wheat, rye, barley, oats, spelt, and their hybridized strains, currently represents the only treatment for celiac disease. The gluten-free (GF) diet is characterized by: naturally occurring GF foods (unprocessed meat and fish, dairy products, eggs, legumes, fruit, and vegetables), GF cereals and pseudo cereals, and specifically formulated substitutes of cereal-based products (e.g., bread, pasta, biscuits, cakes, and ready-to-eat meals) with a gluten content lower than 20 ppm, as stated in the European Implementing Regulation (EU) no. 828/2014 [3]. Such formulated GF products should adequately replace gluten-containing (GC) products in the diet of celiac patients, as GC cereals and their derivates represent an important energy and nutrient source in Italy [4] and worldwide [5].
Manufactured GF products’ ease of access has dramatically increased in the last decade with GF products available in mass retail channels [6]. Such products are largely consumed by celiac disease patients [7] but also to some extent by the general population [8,9]. As a result, a food composition database (FCDB) containing data on the GF cereal-based products available on the market is needed to evaluate the energy and nutrient intakes of GF foods’ consumers and the nutritional adequacy of the GF diet which is still debated. In this regard, our group was the first to develop a GF-FCDB attempting to calculate micronutrient composition. In 2015, we published the first version of the Italian FCDB of GF products [10], which reported the composition of 60 GF products present on the market in 2013. However, frequent updates based on international standards [11] are needed in FCDB to compile quality data representing the composition of foods in a specific time period and region of interest. This is particularly true for databases containing data on GF products whose formulations and nutritional values may considerably change over time due to the constant advance in food technology [12].
Previous studies have shown that GF foods and “free-from”-labelled food products are perceived as healthier than their traditional counterparts by the general population regardless of their declared nutritional composition [13,14]. The misperception of the healthiness of manufactured food products may lead to the overconsumption of such products, regardless of their nutritional quality [15] and the low consumption of naturally GF foods [16]. According to recent Italian studies, celiac patients consume higher quantities of biscuits and bread substitutes such as crackers [17] and are less adherent to the Mediterranean diet [16,18] than their healthy counterparts. Regarding macro- and micro-nutrient intake, celiac disease adults have shown higher fat and sugar intake, lower fiber intake, and lower micronutrient intakes [19,20,21]. As a result, poor vitamin D, calcium, iron, vitamin B12, and folate status has been detected in several studies in patients following a long-term GF diet [21]. However, the low adequacy of the GF diet may be the result of both the overall dietary habits of celiac patients and the inadequacy of the nutrient composition of GF food substitutes. When comparing hypothetical menus developed based on MyPlate guidelines using GC foods and the corresponding GF substitutes, the GF menu was significantly lower in protein, magnesium, potassium, vitamin E, folate, and sodium, with suggestive lower calcium and higher lipids [22]. However, a similar approach has never been applied in Italy.
The first aim of the present work was to present an updated version of the Italian GF-FCDB to represent the composition of GF products available on the market in 2020–2021 in Italy. The second aim was to compare theoretical daily energy and nutrient intakes provided by a weekly food-based dietary guideline menu replacing GC with GF cereal-based products. Since at present there is no specific dietary guideline for celiac patients in Italy, the food-based recommendations applied are those for the general population [23].

2. Materials and Methods

2.1. Update of the Gluten-Free Food Composition Database

To search for the GF products available on the Italian market in 2020–2021, we started by consulting the Nielsen database of GF products (the Nielsen, US, 2013–2014) that was integrated with the cereal-based product selection from the major retailers present in the Italian market offering a home-shopping section in their website, deeply described elsewhere [24,25,26,27]. The five brands identified in the previous version of the database [10] were integrated with new GF specialized brands (n = 2) and non-specialized national brand leaders (n = 5) that entered the market recently. When less than 2 products of the selected 12 brands were found for a food item present in the original database [10], other minor brands from the online marketplace were considered. All products considered for the update were certified with the Crossed Grain Trademark. Products that presented an incomplete or incoherent ingredient list and/or nutritional declaration within the brand or supermarket website were excluded.
The food categories considered for the update were: cookies, breakfast products, sweet products, breads, pizzas, savory snacks, flours, and pasta dishes. A new “ready-to-eat dishes” category was created in response to the presence on the online marketplace of such products. Each food category included different GF food items, representing the composition of multiple GF food products from different brands having similar characteristics.
To estimate the complete composition of the selected GF manufactured products, we used ingredients list to develop a recipe [10]. The nutrient composition of each ingredient was mainly derived from the Italian FCDB for epidemiological studies [28]. When an ingredient was not present in the latter database (e.g., leavening agents, gums, and protein isolates), the composition was estimated from calculations, or borrowed from international FCDBs [29,30]. Missing data in the composition of cereal and cereal-based ingredients were compiled in accordance with standard methodology [28].
To calculate the nutrient composition of each GF product, ingredient weights were imputed based on their ranking and percentage contribution (if available) stated on the label. The ingredients’ weights were adjusted using a trial-and-error approach until the calculation results matched the mandatory nutritional declaration (the European Regulation (EU) no. 1169/2011) [31]. The sum of all the ingredients considered the possible loss in water due to food processing. When applicable, the micronutrient composition of each ingredient was adjusted for losses due to heating or other food processing steps [32].
The described process was repeated for all branded foods collected within a single GF food item. The final nutrient composition of each food item was calculated combining the mean nutritional label data and the mean data calculated as above described. Further calculations were performed to adjust the overall nutrient composition, such as proportioning the animal and vegetable protein/lipids estimated from the recipe calculations on the total protein/lipids from the nutrition label; proportioning the amino acids, fatty acids, and single sugars on total protein, lipids, and soluble carbohydrates, respectively; recalculating starch by the difference from available and soluble carbohydrates. In addition, the energy content was calculated based on the macronutrient specific conversion factors, including fiber [28,33]. The water content was calculated by difference, or analytically determined following the official method [34] for 42 food items (over 108 total items). Finally, informatic checks were performed to control for possible errors and/or omissions.

2.2. Energy and Nutrient Content Evaluation of Food-Based Guidelines Menus

Based on the methodology proposed by Taetzsch and colleagues [22], we performed a theoretical analysis to estimate the daily energy and nutrient content in Italian weekly reference menus for a 2000 kcal daily diet [23] containing either GF or GC foods. Complex recipes were disassembled into simple ingredients [35]. Three scenarios were developed: The Refined Cereals (RC) scenario, the Wholegrain Cereals (WC) scenario, and the Mixed Cereals (MC) scenario. The MC menu was developed considering the recommendation [23] to prefer wholegrains and to vary the food choices (we used about 60% wholegrain and 40% refined cereal-based products). The other two menus contained only refined (RC) and wholegrain (WC) cereal-based products. The complete food list with the identified GF and GC food equivalences is reported in Table S1. The food list is identical in each scenario apart from cereal-based products. Each scenario was developed in double using traditional GC foods and the corresponding GF substitutes, respectively. The nutrient composition calculations on the GC menus were performed using the Microdiet software (Microdiet software version 4.1—Downlee Systems Ltd., High Peak, UK), which contains the Italian FCDB for epidemiological studies [28]. The newly updated GF database was then applied to replace the GC cereal-based products with the most equivalent GF substitutes in the Microsoft Excel export of GC menus.

2.3. Statistical Analysis

To compare the energy and nutrient content of the different GC and GF scenarios, we determined the theoretical daily intake of energy (calculated from macronutrients, including fiber) and 30 food components having no missing data in the Italian database [28]. The distribution of each nutrient per day was evaluated with the Shapiro–Wilk test for normality. A paired t-test and Wilcox signed-rank test were used to evaluate the differences between the GC and GF menus for normally and non-normally distributed nutrients, respectively. Statistical significance was set at p < 0.05.

3. Results

3.1. Update of the Gluten-Free Food Composition Database

The database includes the composition per 100 g of 108 GF foods, as sold, in terms of energy and the full range of macro- and micro-nutrients present in the latest version of the Italian FCDB [28]. The energy content and macronutrient composition are presented for: 17 GF cookies and 4 GF breakfast products (Table 1); 11 GF cakes and desserts, 21 GF sweet snack products (Table 2); 13 GF breads, 4 GF pizzas, 10 GF savory snacks, and 5 GF flours (Table 3); 16 GF pasta dishes and 7 GF ready-to eat dishes (Table 4). The fatty acids and micronutrient composition of the GF items are shown in Tables S2 and S3, respectively.
Chocolate-coated wafers had the highest content of energy, lipids, and soluble carbohydrates, and the lowest content of available carbohydrates among all GF biscuits (Table 1). The protein content was the highest in “cantucci”, while chocolate wafers had the highest saturated fatty acids (SFAs) (Table S2). Among all GF biscuits, wafers had the lowest sodium content (Table S3). Muesli had the highest soluble carbohydrates, lipids, protein, SFAs, and energy content but the lowest sodium content among all GF breakfast products (Table 1, Table S2 and S3).
In the GF cakes and desserts category (Table 2, Table S2 and S3), “tiramisù” had the highest lipid and SFAs content, and the lowest PUFAs. Sponge cake had the highest protein content and the lowest SFAs and sodium content. The highest PUFAs and sodium content were found in chocolate cake. Chocolate-coated snack bar showed the highest energy, lipid, and SFAs content among all the GF sweet snacks (Table 2 and Table S2). Sodium content was the lowest in “cornetto” ice cream, and the highest in puff pastry, plum cake, and plain muffin (>300 mg/100 g) (Table S3). Plain muffin had the highest PUFAs (Table S2).
Hamburger/hotdog-type bread had the highest soluble carbohydrates and the lowest fiber content among GF breads (Table 3). Rustic bread with seeds had the highest content of protein, lipids (Table 3), and PUFAs (Table S2). All breads contained less than 2.2 g/100 g SFAs and more than 1.4 g/100 g PUFAs. The sodium content was more than 400 mg/100 g in all breads (Table S3).
GF cooked pizza dough and “focaccia” had the highest energy and available carbohydrates and the lowest water content in the GF pizzas category (Table 3). In addition, they had lower protein than other pizzas. “Focaccia” had the lowest SFAs content (Table S2) and the highest sodium content (Table S3), while “calzone” had the highest SFAs content and the lowest sodium content.
In the GF savory snacks category (Table 3 and Table S2), crackers snacks and “taralli” had the highest lipids, and, together with wholemeal breadsticks, the highest PUFAs. Wholemeal crackers had the highest fiber and the lowest sodium content (Table S3). Saltines snacks contained the highest amount of sodium. GF flour for pasta had the highest protein and the lowest lipid content in the GF flours category (Table 3), while rustic flour had the highest lipid, fiber, and sodium content (Table S3).
GF pasta dishes (Table 4, Table S2 and S3) included gnocchi, dry pasta, fresh pasta, and filled pasta. The latter pasta type had the highest sodium and lipid content. Gnocchi had the lowest lipid and protein content. Legume pasta had the highest protein content.
Finally, there was great variability in the composition of GF ready-to-eat products (Table 4, Table S2 and S3), due to the different types and formulations of foods included.

3.2. Comparison between Gluten-Free and Gluten-Containing Guideline Menus

Table 5 shows the mean/median daily energy and nutrient content of the GC and GF equivalent one-week guideline menus calculated for each scenario (RC, MC, and WC).
No significant differences were found in the macronutrient composition of the MC and WC scenario, except for lipids, which were significantly higher in the GF version of the WC scenario than in the corresponding GC menu. A suggestive trend for higher lipid content in the GF alternative menu was also observed in the MC scenario. On the other hand, in the RC scenario, the GF alternative menu was significantly lower in available carbohydrates and starch content, with a suggestive trend for lower energy content than in the GC menu (p = 0.054 and p = 0.067 for energy expressed in kcal and kJ, respectively).
The main differences between GF and GC corresponding menus were observed in the fatty acid composition, particularly in the WC scenario. The GF menu of the WC scenario was higher than the corresponding GC menu in MUFAs, PUFAs, oleic, and linoleic acids, with a suggestive trend also for higher linolenic acid. Statistically significant differences were also observed between the GF and GC menus in the MC and RC scenarios regarding PUFAs and linoleic acid content.
The GF alternative menu of each scenario showed a micronutrient composition similar to the corresponding GC version, except for vitamin E, which was significantly higher in all GF menus, and zinc, which was significantly lower in the GF version of the WC scenario.

4. Discussion

The present paper presents a revised version of the Italian GF-FCDB and applies it to evaluate the nutritional adequacy of a theoretical GF diet. For this purpose, GC products were substituted with GF counterparts in the weekly reference menu for a 2000 kcal/day diet compiled using the recommendations of Italian food-based dietary guidelines [23]. This update was justified by the quick changes in the formulation of GF products consequent to the huge research in this field. The ongoing development of such products in turn replies to the high demand of the food market.

4.1. The Gluten-Free Food Composition Database

The first version of the Italian GF-FCDB originated from the need to develop a suitable database to assess the nutritional intakes of celiac disease patients in Italy. That was necessary since limited nutritional composition data of GF foods were available in FCDBs. Moreover, previous dietary assessment studies did not clearly describe the process applied to calculate the composition of GF products used to estimate nutritional intakes in celiac disease patients [10]. At present, most dietary assessment studies used GF food composition data from published GF-specific FCDBs [36,37] from databases collecting only mandatory nutrient label data [38] or from imputation procedures [39,40]. However, a large amount of missing data in the micronutrient composition of GF foods may lead to biases in the dietary assessment, especially when the missing data are in the frequently consumed foods. Recently, some national databases have included a few analytical values for a limited list of GF products, mainly bread [30,41,42,43]. Up to now, other GF label-based FCDBs have been published [12,44,45], and several studies have collected and compared GF and GC food composition data declared on nutrition labels in several countries [46,47,48,49,50]. However, only Missbach and colleagues [44] and Jamieson and colleagues [45] presented in their database a comprehensive list of nutrient values imputed from the ingredient list reported on the label using an approach comparable to ours.
The approach proposed in the present work slightly modifies the one proposed in the first version of the database. First, recipes were created using ingredients from the Italian FCDB for epidemiological studies in its new version [28], and the residual missing data on cereal-based ingredients were filled using standard methods [11]. The present GF-FCDB is still based on the ingredient list reported on the food label and it uses retention factors to calculate nutrient losses due to cooking procedures, as described elsewhere [10]. However, contrarily to the previous version, the target values from the mandatory nutrition labels were used as reported on the label and recalculated only on analytically determined dry matter, when available. Indeed, another key difference is that in the present GF-FCDB version, we performed analytical moisture determinations for 42 items (i.e., breads (n = 10), pizzas (n = 3); pasta dishes (n = 3), cookies (n = 7), cakes and desserts (n = 6), sweet snacks (n = 12), and savory snacks (n = 1)). Knowing the water content in food is very important because variation in water content is the main determinant of the content of other components [33]. Moreover, it is known that the hydrocolloids (mainly hydroxypropyl methylcellulose, xanthan gum, psyllium, and guar gum), which are commonly used to compensate for the lack of the gluten structure in GF products, hold a huge amount of water, leading to higher water content in GF than in GC corresponding foods [51]. In addition, water was the first ingredient on the declared list in more than 70% of the GF products used to create the bread items of the present database. As a result, the water content of traditional wheat products cannot be used to adjust the nutrient composition of the corresponding GF food items in FCDBs, and since nutritional label accuracy is mostly unknown [52], it may also be inaccurate to calculate water by difference from macronutrients.
The supply of GF products largely increased in the past decade. We found several products labeled as wholemeal, a great variety of formulations among the same food items, and several traditional products, such as “taralli”, “friselle”, “colomba”, “cantucci”, and “canestrelli”, that were not present in the previous version of the database. Overall, the macronutrient contents of GF food items, which were already present in the previous GF-FCDB, did not considerably change, with some exceptions. In biscuits, we observed a trend in the increased content of fiber, calcium, potassium, phosphorus, and folates. Moreover, there was a huge increase in the item number (more than twice). Wafers and biscuits of different types and flavors were added to the current database. This great increase in number reflects the high consumption of cookies by celiac patients reported in a previous Italian study [17]. Similarly, the sweet products category of the previous version of the database changed substantially in terms of item numerosity (32 vs. 18 products in current and previous GF-FCDB, respectively). As a result, in the current database, sweet products were divided into two categories: cakes and desserts, and sweet snacks. The added items were tarts, and different versions of same products. Sweet snacks and cakes showed a similar or higher fiber content (except for puff pastry) and lower lipids (except for “pandoro”, “panettone”, plain muffins, chocolate, and jam pastries) in the current version than in the previous GF-FCDB. Bread and savory snacks items generally had higher fiber content compared to previous similar items, except for wholemeal bread, whose fiber content decreased from 6.4 g/100 g to 5.1 g/100 g. Breads also contained more calcium and phosphorus, and in some cases more iron and zinc, than in the first version of the database. Furthermore, we observed a very variable composition among foods of the same group due to different formulations, as previously observed [53]. GF products are highly differentiated to meet consumer preferences and needs [6]. As an example, dry pasta composed of cereals such as rice, corn, and mixed cereals showed a similar macro and micronutrient composition as in the previous GF-FCDB. However, new pasta types including legumes in their formulations are now widespread on the market [24]. As an example, in the present database, legume pasta and pasta with mixed cereal and legumes were created from 12 and 4 branded product labels, respectively. The use of legumes in GF pasta formulations may substantially enhance the nutritional profile. Indeed, pasta with legume flours has a very different composition than traditional GF pasta with more proteins, fiber, minerals, and vitamins [24,54].
The main limitations of the present GF-FCDB are the prevalent use of non-analytical data, and the impossibility to apply the recipe method to all GF products available on the market. As an example, GF beers, which may be reported on a dietary record of a celiac disease patient, are not included in the present database. Moreover, the database does not include data on the non-specifically formulated GF products where cereal flours are only used as additives. However, errors in nutrient intake estimations using the composition of the corresponding GC products will plausibly be negligible due to infrequent consumption (in the case of beer) or irrelevant differences in the composition (in the case of non-specifically formulated GF products). Despite these limitations, the main features of the present database are the comprehensiveness of nutrient composition derived from standardized calculation procedures, the use of retention factors to adjust nutrient composition accounting for losses during processing, and the large sample of branded products from multiple brands considered for items construction. As an example, biscuit composition was derived from at least 4 different branded products—for coconut biscuits, “cantucci”, and “canestrelli”— up to 21 different products—for chocolate and plain biscuits. In the case of bread with olives, the composition was obtained from 2 products, whereas 15 different branded products were used for sliced white bread. Furthermore, in the literature, there is limited knowledge of the micronutrient composition of GF foods [55], and the present database is the only one representing the complete composition of GF products available in Italy. Since product availability and formulations may change over time because the GF market is fast changing, the present database provides an important update allowing its use in present-day dietary assessment studies.

4.2. Nutritional Adequacy of a GF Menu from General Dietary Guidelines

Previous studies showed that GF diets were generally ineffective in counteracting the mineral and vitamin deficiencies observed at diagnosis in celiac disease patients [56,57]. In addition, celiac patients adhering to a strict GF diet have lower micronutrient intakes than their healthy counterparts [19,20,21]. However, the micronutrient composition of manufactured GF foods is mostly unknown, so caution must be taken to draw conclusions on micronutrient intakes in celiac disease patients [20].
In the present theoretical assessment, when the Italian dietary guidelines were used to plan one-week GF menus, only a few differences were found between the nutrient intakes provided by the GC and GF menus. The main differences were observed in the content of lipid components, particularly in PUFAs, linoleic acid, and vitamin E.
The GF menus contained more total lipids than the corresponding GC menus in the WC scenario, with a suggestive trend for higher lipids also found in the MC scenario. Differences in lipid composition between GF and GC menus are probably due to the high recommended frequency of bread consumption, which has been previously found to contain more lipids in its GF version than its GC counterpart [25,53,58]. Indeed, fat is commonly used as an ingredient in GF leavened products to enhance the texture of the crumb, stabilize the gas bubbles in the dough, and minimize starch retrogradation [51]. In a similar theoretical assessment, Taetzsch and colleagues [22] found a suggestive trend of higher lipids in GF MyPlate menus than in the corresponding GC menus. Accordingly, most of the previous dietary assessment studies reported a higher lipid intake in celiac patients than in their healthy counterparts [20,21], except for a very recent study on the National Health and Nutrition Examination Survey (NHANES) [59]. Some previous studies on celiac disease patients also observed a higher SFAs intake compared to their healthy counterparts [20]. On the contrary, in the present theoretical assessment, the SFAs content was similar in GF and GC menus, but the PUFAs content was higher in all GF scenarios, and the MUFAs were higher in the GF-WC scenario. This may be explained by the higher MUFAs and PUFAs contents of the GF manufactured products than those of the corresponding GC foods [28]. In addition, in the present assessment, linoleic acid was found to be significantly higher in GF than in GC menus in each scenario. As a result, the PUFAs’ percentage contribution to daily energy intake was found to meet the Italian reference values (5–10 %E) [60] only in GF menus (ranging from 5.2 to 6.5 %E, in the RC and WC scenario, respectively).
Protein content was above the Italian population reference intake (PRI) [60] in all GC and GF scenarios. On the contrary, in the theoretical assessment performed by Taetzsch and colleagues, the GF diet was significantly lower in protein than the GC diet [22]. Previous studies reported an overall lower protein content of GF manufactured foods than their GC counterparts [24,25,26,49]. As a result, the adequate protein content of the GF menus found in the present assessment is likely dependent on the considerable presence of other protein sources in the guideline menu. Therefore, Italian omnivorous celiac disease patients may easily reach the recommended protein intake even if cereal-based products are known to be important protein sources [4]. More caution is needed when protein sources of animal origin are limited or excluded, as in the case of vegetarian or vegan celiac disease patients.
Independently from the cereal-type scenario, the fiber recommendation [60] was met mainly due to the high fruit and vegetable frequency of consumption indicated in the guideline menu. On the contrary, most dietary assessments on celiac patients found inadequate fiber intake and high soluble carbohydrate intakes [20,21], which may be explained, for example, by a low intake of fruit [16] and a high consumption of processed products [17].
In the present theoretical application of the GF-FCDB on the one-week dietary guidelines menu, we observed that it is possible to meet the micronutrient requirements proposed for the adult Italian population [60] by simply substituting GC cereal-based products with the corresponding GF alternatives. However, we found that in the GF diet, attention should be paid regarding zinc and iron intakes, irrespectively of the considered scenario. The zinc average requirement (AR) (10 mg/day), but not the PRI (12 mg/day) recommended for men [60], was met in the GF version of the guideline menus. Similarly, the iron AR (10 mg/day), but not the PRI (18 mg/day) recommended for premenopausal women [60], was met in the GF menus. It is also worth mentioning that the iron content was lower than the PRI for young women also in GC menus, excluding the WC scenario. On the other hand, the zinc content was found to be significantly lower in GF than in GC menus only in the WC scenario. This difference reflects the lower zinc content in wholemeal GF items than in traditional wholemeal bread; in the present GF-FCDB, the zinc content of wholemeal bread and pasta was approximately half that in the corresponding items of the Italian FCDB [28]. In addition, the imputed iron and zinc content of the GF items included in the present GF-FCDB was comparable to recent analytical data [55,61].
No differences were found between the GF and GC menus of each scenario on other critical nutrients, such as calcium and folates, which are notoriously deficient in celiac patients [21]. Therefore, the role of GF food micronutrient composition in patients’ deficiencies is likely marginal. To support this statement, micronutrient deficiencies were found in long-term GF diets mainly as a result of unhealthy dietary habits [62].
Finally, it must be noted that the sodium content was alarmingly high in each scenario, ranging from 2947 mg/day (about 7.4 g of salt per day) to 3288 mg/day (about 8.2 g of salt per day) in the GF-RC scenario and in the GC-RC scenario, respectively. This value is anyway higher than the one indicated as the upper limit of the suggested dietary target for sodium (<2000 mg/day) [60] and likely depends on the excessive content of salt found in both GC and GF cereal-based manufactured products [25,63]. Indeed, in the present GF-FCDB, no bread item met the World Health Organization (WHO) benchmark for sodium content in leavened breads, set at 330 mg/100 g [64]. Since Italian guideline menus for the general population present a considerable daily consumption of bread, product reformulations are needed to achieve WHO benchmarks and consequently reduce dietary sodium intake in the Italian population [64].

5. Conclusions

FCDBs for epidemiological purposes require good quality and comprehensive food composition data. The present updated database is the only one to provide a comprehensive overview of the macro- and micronutrient composition of GF manufactured products representative of GF food items available on the Italian market. The use of standardized and well-documented procedures allowed us to obtain a reliable database for epidemiological studies. Using the updated GF-FCDB to perform a theoretical assessment of the dietary intakes of a GF diet based on Italian guideline menus for the general population, we observed that it is possible for celiac disease patients to meet nutrient requirements by simply substituting GC foods with GF cereal-based products. Therefore, more effort should be put into educating celiac disease patients in following the dietary recommendations. This updated GF-FCDB will be a useful tool for assessing the nutrient adequacy of the actual diet of the Italian celiac disease population and for spotting potential nutrient deficiencies.

Supplementary Materials

The following supporting information can be downloaded at: https://www.mdpi.com/article/10.3390/nu14194171/s1, Table S1: Gluten-free and gluten-containing menus with substitutions for each cereal based products scenario; Table S2: Fatty acid composition per 100 g of gluten-free foods from the categories: cookies, breakfast products, cakes and desserts, sweet snacks, breads, pizzas, savory snacks, flours, pasta dishes, ready-to-eat dishes; Table S3: Micronutrient composition per 100 g of gluten-free foods from the following categories: cookies, breakfast products, cakes and desserts, sweet snacks, breads, pizzas, savory snacks, flours, pasta dishes, ready-to-eat dishes.

Author Contributions

Conceptualization, N.P.; methodology, F.F., M.P., F.M. and N.P.; formal analysis, F.F.; investigation, F.F., M.P. and N.P.; resources, N.P. and M.P.; data curation, F.F. and F.M.; writing—original draft preparation, F.F.; writing—review and editing, M.P. and N.P.; visualization, F.F. and N.P.; supervision, M.P. and N.P.; project administration, N.P. All authors have read and agreed to the published version of the manuscript.

Funding

This research received no external funding.

Institutional Review Board Statement

Not applicable.

Informed Consent Statement

Not applicable.

Data Availability Statement

The data presented in this study are available within the article and supplementary material.

Acknowledgments

The authors wish to thank all students who participated in the development of the dataset.

Conflicts of Interest

The authors declare no conflict of interest.

References

  1. Caio, G.; Volta, U.; Sapone, A.; Leffler, D.A.; De Giorgio, R.; Catassi, C.; Fasano, A. Celiac disease: A comprehensive current review. BMC Med. 2019, 17, 142. [Google Scholar] [CrossRef] [Green Version]
  2. Singh, P.; Arora, A.; Strand, T.A.; Leffler, D.A.; Catassi, C.; Green, P.H.; Kelly, C.P.; Ahuja, V.; Makharia, G.K. Global prevalence of celiac disease: Systematic review and meta-analysis. Clin. Gastroenterol. Hepatol. Off. Clin. Pract. J. Am. Gastroenterol. Assoc. 2018, 16, 823–836.e2. [Google Scholar] [CrossRef] [PubMed] [Green Version]
  3. European Parliament. Council of the European Union Commission Implementing Regulation (EU) N. 828/2014 of 30 July 2014 on the Requirements for the Provision of Information to Consumers on the Absence or Reduced Presence of Gluten in Food. Off. J. Eur. Union 2014. Available online: https://eur-lex.europa.eu/eli/reg_impl/2014/828/oj (accessed on 5 August 2022).
  4. Sette, S.; Le Donne, C.; Piccinelli, R.; Mistura, L.; Ferrari, M.; Leclercq, C.; Arcella, D.; Bevilacqua, N.; Buonocore, P.; Capriotti, M.; et al. The third National Food Consumption Survey, INRAN-SCAI 2005-06: Major dietary sources of nutrients in Italy. Int. J. Food Sci. Nutr. 2013, 64, 1014–1021. [Google Scholar] [CrossRef] [PubMed]
  5. Aljada, B.; Zohni, A.; El-Matary, W. The gluten-free diet for celiac disease and beyond. Nutrients 2021, 13, 3993. [Google Scholar] [CrossRef] [PubMed]
  6. Gorgitano, M.T.; Sodano, V. Gluten-free products: From dietary necessity to premium price extraction tool. Nutrients 2019, 11, 1997. [Google Scholar] [CrossRef] [PubMed] [Green Version]
  7. Gibert, A.; Espadaler, M.; Angel Canela, M.; Sánchez, A.; Vaqué, C.; Rafecas, M. Consumption of gluten-free products: Should the threshold value for trace amounts of gluten be at 20, 100 or 200 p.p.m.? Eur. J. Gastroenterol. Hepatol. 2006, 18, 1187–1195. [Google Scholar] [CrossRef] [PubMed]
  8. Lerner, B.A.; Green, P.H.R.; Lebwohl, B. Going against the grains: Gluten-free diets in patients without celiac disease-worthwhile or not? Dig. Dis. Sci. 2019, 64, 1740–1747. [Google Scholar] [CrossRef] [PubMed]
  9. Perrin, L.; Allès, B.; Buscail, C.; Ravel, C.; Hercberg, S.; Julia, C.; Kesse-Guyot, E. Gluten-free diet in French adults without coeliac disease: Sociodemographic characteristics, motives and dietary profile. Br. J. Nutr. 2019, 122, 231–239. [Google Scholar] [CrossRef] [PubMed]
  10. Mazzeo, T.; Cauzzi, S.; Brighenti, F.; Pellegrini, N. The development of a composition database of gluten-free products. Public Health Nutr. 2015, 18, 1353–1357. [Google Scholar] [CrossRef] [PubMed] [Green Version]
  11. Westenbrink, S.; Roe, M.; Oseredczuk, M.; Castanheira, I.; Finglas, P. EuroFIR quality approach for managing food composition data; Where are we in 2014? Food Chem. 2016, 193, 69–74. [Google Scholar] [CrossRef] [PubMed]
  12. Fajardo, V.; González, M.P.; Martínez, M.; de Samaniego-Vaesken, M.L.; Achón, M.; Úbeda, N.; Alonso-Aperte, E. Updated food composition database for cereal-based gluten free products in spain: Is reformulation moving on? Nutrients 2020, 12, 2369. [Google Scholar] [CrossRef]
  13. Dunn, C.; House, L.; Shelnutt, K.P. Consumer perceptions of gluten-free products and the healthfulness of gluten-free diets. J. Nutr. Educ. Behav. 2014, 46, S184–S185. [Google Scholar] [CrossRef] [Green Version]
  14. Hartmann, C.; Hieke, S.; Taper, C.; Siegrist, M. European consumer healthiness evaluation of ‘free-from’ labelled food products. Food Qual. Prefer. 2018, 68, 377–388. [Google Scholar] [CrossRef]
  15. Oostenbach, L.H.; Slits, E.; Robinson, E.; Sacks, G. Systematic review of the impact of nutrition claims related to fat, sugar and energy content on food choices and energy intake. BMC Public Health 2019, 19, 1269. [Google Scholar] [CrossRef] [Green Version]
  16. Morreale, F.; Agnoli, C.; Roncoroni, L.; Sieri, S.; Lombardo, V.; Mazzeo, T.; Elli, L.; Bardella, M.T.; Agostoni, C.; Doneda, L.; et al. Are the dietary habits of treated individuals with celiac disease adherent to a Mediterranean diet? Nutr. Metab. Cardiovasc. Dis. 2018, 28, 1148–1154. [Google Scholar] [CrossRef]
  17. Valitutti, F.; Iorfida, D.; Anania, C.; Trovato, C.M.; Montuori, M.; Cucchiara, S.; Catassi, C. Cereal consumption among subjects with celiac disease: A snapshot for nutritional considerations. Nutrients 2017, 9, 396. [Google Scholar] [CrossRef] [PubMed] [Green Version]
  18. Lionetti, E.; Antonucci, N.; Marinelli, M.; Bartolomei, B.; Franceschini, E.; Gatti, S.; Catassi, G.N.; Verma, A.K.; Monachesi, C.; Catassi, C. Nutritional status, dietary intake, and adherence to the mediterranean diet of children with celiac disease on a gluten-free diet: A case-control prospective study. Nutrients 2020, 12, 143. [Google Scholar] [CrossRef] [PubMed] [Green Version]
  19. El Khoury, D.; Balfour-Ducharme, S.; Joye, I.J. A review on the gluten-free diet: Technological and nutritional challenges. Nutrients 2018, 10, 1410. [Google Scholar] [CrossRef] [PubMed] [Green Version]
  20. Cardo, A.; Churruca, I.; Lasa, A.; Navarro, V.; Vazquez-Polo, M.; Perez-Junkera, G.; Larretxi, I. Nutritional imbalances in adult celiac patients following a gluten-free diet. Nutrients 2021, 13, 2877. [Google Scholar] [CrossRef] [PubMed]
  21. Melini, V.; Melini, F. Gluten-free diet: Gaps and needs for a healthier diet. Nutrients 2019, 11, 170. [Google Scholar] [CrossRef] [PubMed]
  22. Taetzsch, A.; Das, S.K.; Brown, C.; Krauss, A.; Silver, R.E.; Roberts, S.B. Are gluten-free diets more nutritious? An evaluation of self-selected and recommended gluten-free and gluten-containing dietary patterns. Nutrients 2018, 10, 1881. [Google Scholar] [CrossRef] [PubMed] [Green Version]
  23. CREA. Linee Guida per una sana Alimentazione Italiana. Revisione. 2018. Available online: http://www.salute.gov.it/imgs/C_17_pubblicazioni_2915_allegato.pdf (accessed on 28 July 2022).
  24. Dello Russo, M.; Spagnuolo, C.; Moccia, S.; Angelino, D.; Pellegrini, N.; Martini, D. Nutritional quality of pasta sold on the Italian market: The food labelling of Italian products (FLIP) study. Nutrients 2021, 13, 171. [Google Scholar] [CrossRef]
  25. Angelino, D.; Rosi, A.; Ruggiero, E.; Nucci, D.; Paolella, G.; Pignone, V.; Pellegrini, N.; Martini, D. Analysis of food labels to evaluate the nutritional quality of bread products and substitutes sold in italy: Results from the food labelling of italian products (FLIP) study. Foods 2020, 9, 1905. [Google Scholar] [CrossRef]
  26. Dall’Asta, M.; Rosi, A.; Angelino, D.; Pellegrini, N.; Martini, D. Evaluation of nutritional quality of biscuits and sweet snacks sold on the Italian market: The Food Labelling of Italian Products (FLIP) study. Public Health Nutr. 2020, 23, 2811–2818. [Google Scholar] [CrossRef]
  27. Angelino, D.; Rosi, A.; Dall’Asta, M.; Pellegrini, N.; Martini, D. Evaluation of the nutritional quality of breakfast cereals sold on the Italian market: The Food Labelling of Italian Products (FLIP) study. Nutrients 2019, 11, 2827. [Google Scholar] [CrossRef] [Green Version]
  28. Gnagnarella, P.; Salvini, S.; Parpinel, M. Food Composition Database for Epidemiological Studies in Italy. Version 1. 2015. Available online: www.bda-ieo.it (accessed on 28 January 2022).
  29. McCance and Widdowson’s. The Composition of Foods Integrated Dataset Public Health England 2021. Available online: https://www.gov.uk/government/publications/composition-of-foods-integrated-dataset-cofid (accessed on 28 July 2022).
  30. Haytowitz, D.B.; Ahuja, J.K.C.; Wu, X.; Somanchi, M.; Nickle, M.; Nguyen, Q.A.; Roseland, J.M.; Williams, J.R.; Patterson, K.Y.; Li, Y.; et al. USDA National Nutrient Database for Standard Reference, Legacy Release. Nutrient Data Laboratory, Beltsville Human Nutrition Research Center, ARS, USDA. 2019. Available online: https://data.nal.usda.gov/dataset/usda-national-nutrient-database-standard-reference-legacy-release (accessed on 28 July 2022).
  31. European Parliament. Council of the European Union Regulation (EU) N. 1169/2011 of the European Parliament and of the Council of 25 October 2011 on the Provision of Food Information to Consumers. 2011. Available online: https://eur-lex.europa.eu/legal-content/EN/TXT/?uri=CELEX%3A02011R1169-20180101 (accessed on 5 August 2022).
  32. Vásquez-Caicedo, A.; Bell, S.; Hartmann, B. Report on Collection of Rules on Use of Recipe Calculation Procedures Including the Use of Yield and Retention Factors for Imputing Nutrient Values for Composite Foods; WP2.2 Composite Foods; European Food Information Resource Network: Brussels, Belgium, 2008. [Google Scholar]
  33. Greenfield, H.; Southgate, D.A.T. Food Composition Data. Production Management and Use, 2nd ed.; FAO, Ed.; FAO: Rome, Italy, 2003. [Google Scholar]
  34. AACC International. 44-15.02 Moisture—Air-Oven Methods. In Approved Methods of Analysis, 11th ed.; AACC International: St. Paul, MN, USA, 1999. [Google Scholar]
  35. Turconi, G.; Roggi, C. Atlante Fotografico Alimentare—Uno Strumento per le Indagini Nutrizionali; Edizioni Mediche Scientifiche Internazionali: Città di Castello, Italy, 2007. [Google Scholar]
  36. Lasa, A.; Larretxi, I.; Simón, E.; Churruca, I.; Navarro, V.; Martínez, O.; Bustamante, M.Á.; Miranda, J. New software for gluten-free diet evaluation and nutritional education. Nutrients 2019, 11, 2505. [Google Scholar] [CrossRef] [PubMed] [Green Version]
  37. Bascuñán, K.A.; Elli, L.; Pellegrini, N.; Scricciolo, A.; Lombardo, V.; Doneda, L.; Vecchi, M.; Scarpa, C.; Araya, M.; Roncoroni, L. Impact of FODMAP content restrictions on the quality of diet for patients with celiac disease on a gluten-free diet. Nutrients 2019, 11, 2220. [Google Scholar] [CrossRef] [Green Version]
  38. Ballestero-Fernández, C.; Varela-Moreiras, G.; Úbeda, N.; Alonso-Aperte, E. Nutritional status in spanish adults with celiac disease following a long-term gluten-free diet is similar to non-celiac. Nutrients 2021, 13, 1626. [Google Scholar] [CrossRef]
  39. González, T.; Larretxi, I.; Vitoria, J.C.; Castaño, L.; Simón, E.; Churruca, I.; Navarro, V.; Lasa, A. Celiac male’s gluten-free diet profile: Comparison to that of the control population and celiac women. Nutrients 2018, 10, 1713. [Google Scholar] [CrossRef] [PubMed] [Green Version]
  40. Jamieson, J.A.; Neufeld, A. Food sources of energy and nutrients among Canadian adults following a gluten-free diet. PeerJ 2020, 8, e9590. [Google Scholar] [CrossRef]
  41. Ciqual. French Food Composition Table 2020. ANSES. Available online: https://ciqual.anses.fr/ (accessed on 8 August 2022).
  42. Norwegian Food Composition Database 2021. Norwegian Food Safety Authority. Available online: https://matvaretabellen.no/?language=en (accessed on 8 August 2022).
  43. NEVO Online Version 2021/7.0, RIVM, Bilthoven. Available online: https://www.rivm.nl/en/dutch-food-composition-database/access-nevo-data/request-dataset (accessed on 8 August 2022).
  44. Missbach, B.; Schwingshackl, L.; Billmann, A.; Mystek, A.; Hickelsberger, M.; Bauer, G.; König, J. Gluten-free food database: The nutritional quality and cost of packaged gluten-free foods. PeerJ 2015, 3, e1337. [Google Scholar] [CrossRef]
  45. Jamieson, J.A.; Gill, K.; Fisher, S.; English, M. Development of a Canadian food composition database of gluten-free products. Foods 2022, 11, 2215. [Google Scholar] [CrossRef] [PubMed]
  46. Babio, N.; Lladó-Bellette, N.; Besora-Moreno, M.; Castillejo, G.; Guillén, N.; Martínez-Cerezo, F.; Vilchez, E.; Roger, E.; Hernández-Alonso, P.; Salas-Salvadó, J. A comparison of the nutritional profile and price of gluten-free products and their gluten-containing counterparts available in the spanish market. Nutr. Hosp. 2020, 37, 814–822. [Google Scholar] [CrossRef] [PubMed]
  47. De Las Heras-Delgado, S.; de Alías-Guerrero, A.L.N.; Cendra-Duarte, E.; Salas-Salvadó, J.; Vilchez, E.; Roger, E.; Hernández-Alonso, P.; Babio, N. Assessment of price and nutritional quality of gluten-free products versus their analogues with gluten through the algorithm of the nutri-score front-of-package labeling system. Food Funct. 2021, 12, 4424–4433. [Google Scholar] [CrossRef]
  48. Fry, L.; Madden, A.M.; Fallaize, R. An investigation into the nutritional composition and cost of gluten-free versus regular food products in the UK. J. Hum. Nutr. Diet. 2018, 31, 108–120. [Google Scholar] [CrossRef] [Green Version]
  49. Cornicelli, M.; Saba, M.; Machello, N.; Silano, M.; Neuhold, S. Nutritional composition of gluten-free food versus regular food sold in the Italian market. Dig. Liver Dis. 2018, 50, 1305–1308. [Google Scholar] [CrossRef]
  50. Vergeer, L.; Franco-Arellano, B.; Tjong, G.B.; Bernstein, J.T.; L’abbé, M.R. The level of processing, nutritional composition and prices of canadian packaged foods and beverages with and without gluten-free claims. Nutrients 2021, 13, 1183. [Google Scholar] [CrossRef]
  51. Roman, L.; Belorio, M.; Gomez, M. Gluten-free breads: The gap between research and commercial reality. Compr. Rev. Food Sci. Food Saf. 2019, 18, 690–702. [Google Scholar] [CrossRef] [Green Version]
  52. Traka, M.H.; Plumb, J.; Berry, R.; Pinchen, H.; Finglas, P.M. Maintaining and updating food composition datasets for multiple users and novel technologies: Current challenges from a UK perspective. Nutr. Bull. 2020, 45, 230–240. [Google Scholar] [CrossRef]
  53. Tres, A.; Tarnovska, N.; Varona, E.; Quintanilla-Casas, B.; Vichi, S.; Gibert, A.; Vilchez, E.; Guardiola, F. Determination and comparison of the lipid profile and sodium content of gluten-free and gluten-containing breads from the spanish market. Plant Foods Hum. Nutr. 2020, 75, 344–354. [Google Scholar] [CrossRef]
  54. Trevisan, S.; Pasini, G.; Simonato, B. An overview of expected glycaemic response of one ingredient commercial gluten free pasta. LWT 2019, 109, 13–16. [Google Scholar] [CrossRef]
  55. Rybicka, I.; Gliszczyńska-Świgło, A. Minerals in grain gluten-free products. The content of calcium, potassium, magnesium, sodium, copper, iron, manganese, and zinc. J. Food Compos. Anal. 2017, 59, 61–67. [Google Scholar] [CrossRef]
  56. Shepherd, S.J.; Gibson, P.R. Nutritional inadequacies of the gluten-free diet in both recently-diagnosed and long-term patients with coeliac disease. J. Hum. Nutr. Diet. 2013, 26, 349–358. [Google Scholar] [CrossRef] [PubMed]
  57. Sue, A.; Dehlsen, K.; Ooi, C.Y. Paediatric patients with coeliac disease on a gluten-free diet: Nutritional adequacy and macro- and micronutrient imbalances. Curr. Gastroenterol. Rep. 2018, 20, 2. [Google Scholar] [CrossRef] [PubMed]
  58. Miranda, J.; Lasa, A.; Bustamante, M.A.; Churruca, I.; Simon, E. Nutritional differences between a gluten-free diet and a diet containing equivalent products with gluten. Plant Foods Hum. Nutr. 2014, 69, 182–187. [Google Scholar] [CrossRef]
  59. Unalp-Arida, A.; Liu, R.; Ruhl, C.E. Nutrient intake differs among persons with celiac disease and gluten-related disorders in the United States. Sci. Rep. 2022, 12, 5566. [Google Scholar] [CrossRef]
  60. Italian Society of Human Nutrition (SINU). Livelli di Assunzione di Riferimento ed Energia per la Popolazione Italiana (LARN); SICS: Milan, Italy, 2014; ISBN 9788890685224. [Google Scholar]
  61. Jeanes, Y.; Spitale, A.; Nicolini, G.; Bergmann, V.; Fagbemi, L.; Rasheid, R.; Hovland, C.; Costabile, A. Calcium and iron content of cereal-based gluten-free products. Foods 2022, 11, 2001. [Google Scholar] [CrossRef]
  62. Larretxi, I.; Simon, E.; Benjumea, L.; Miranda, J.; Bustamante, M.A.; Lasa, A.; Eizaguirre, F.J.; Churruca, I. Gluten-free-rendered products contribute to imbalanced diets in children and adolescents with celiac disease. Eur. J. Nutr. 2019, 58, 775–783. [Google Scholar] [CrossRef]
  63. Martini, D.; Strazzullo, P.; Serafini, M.; Porrini, M.; Pellegrini, N.; Angelino, D. Sodium content in cereal-based products sold in Italy: How far are we from the global benchmarks? Nutrients 2022, 14, 3088. [Google Scholar] [CrossRef]
  64. World Health Organization (WHO). WHO Global Sodium Benchmarks for Different Food Categories. Available online: https://www.who.int/publications/i/item/9789240025097 (accessed on 5 August 2022).
Table 1. Energy and macronutrient composition per 100 g of GF biscuits and breakfast products, as sold.
Energy (kJ)Energy
(kcal)
Water
(g)
Av. Carb. (g)Sol. Carb.
(g)
Fiber
(g)
Protein
(g)
Lipids
(g)
BISCUITS
Biscuits, “canestrelli”18504407.967.722.51.43.818.7
Biscuits, “cantucci”18994522.464.126.04.39.918.1
Biscuits, “cantucci”, with chocolate16663959.169.933.03.45.111.8
Biscuits, chocolate-coated20344852.263.435.73.65.524.2
Biscuits, ladyfinger16223834.877.335.72.97.46.4
Biscuits, plain18824472.373.522.01.94.416.7
Biscuits, wholemeal19594672.067.220.25.56.018.1
Biscuits, with chocolate18734467.566.624.83.24.717.2
Biscuits, with coconut19214574.768.221.02.14.320.0
Biscuits, with jam163638813.766.227.22.83.013.6
Breakfast biscuits18554400.975.919.22.84.214.8
Filled biscuits19954763.466.034.42.54.222.9
Tea biscuits19774712.368.527.42.54.521.2
Wafers, chocolate21365111.860.226.83.94.328.9
Wafers, chocolate-coated23095541.555.639.22.75.433.8
Wafers, hazelnut21105041.962.824.32.84.027.4
Wafers, vanilla20734940.769.230.31.83.224.3
BREAKFAST PRODUCTS
Cereal rusks15563686.074.32.46.49.22.3
Melba toast16083804.075.25.76.64.47.5
Melba toast, wholemeal16994034.074.34.27.93.98.3
Muesli165739412.157.720.25.39.514.3
Abbreviations: Av. Carb, available carbohydrates; Sol. Carb, soluble carbohydrates.
Table 2. Energy and macronutrient composition per 100 g of GF cakes, desserts, and sweet snacks, as sold.
Energy (kJ)Energy
(kcal)
Water
(g)
Av. Carb. (g)Sol. Carb.
(g)
Fiber
(g)
Protein
(g)
Lipids
(g)
CAKES AND DESSERTS
Cake, “colomba”180243015.053.730.92.84.922.7
Cake, “margherita”151936222.953.327.03.83.515.6
Cake, “pandoro”153436626.546.718.73.14.318.6
Cake, “panettone”139033129.647.124.54.04.114.4
Cake, “panettone”, with chocolate138232929.647.219.93.75.013.8
Cake, chocolate172941319.049.526.53.54.522.5
Dessert, “tiramisù”125630249.919.516.02.84.223.0
Sponge cake120328534.349.428.21.36.67.8
Sweet bread114127137.049.012.64.22.96.0
Tart, with chocolate and hazelnut146935028.247.125.82.54.916.6
Tart, with jam162338512.569.932.31.83.411.7
SWEET SNACKS
Croissant136632527.950.616.44.53.712.4
Croissant, with chocolate133731831.147.714.84.02.913.3
Croissant, with jam126230033.448.117.63.72.811.2
Ice cream, “cornetto”129330939.836.323.32.83.617.0
Ice cream, sandwich-type127730436.345.023.81.04.013.0
Muffin, plain166939819.152.626.32.84.519.7
Muffin, with chocolate19994775.163.530.51.44.924.0
Muffin, with fruit167039817.555.929.33.34.018.4
Pastries, plain180743216.652.727.72.45.721.5
Pastries, with chocolate173741417.152.631.32.85.421.1
Pastries, with jam156437219.958.532.32.33.914.7
Pastries, with milk159437920.357.033.81.04.416.2
Pastries, without added sugars162738819.850.81.14.84.818.8
Plum cake172741217.952.623.82.24.921.2
Plum cake, with chocolate160938425.844.423.72.64.621.6
Puff pastry150036034.633.51.64.42.424.0
Snack bar, cereals and chocolate16613959.260.629.49.85.614.0
Snack bar, cereals and nuts17254096.369.037.73.28.012.4
Snack bar, chocolate-coated21465132.257.740.33.46.529.3
Snack roll, “cannolo”19444635.366.734.62.95.718.6
Wafer cone, for ice cream16904001.280.117.07.25.64.8
Abbreviations: Av. Carb, available carbohydrates; Sol. Carb, soluble carbohydrates.
Table 3. Energy and macronutrient composition per 100 g of GF breads, pizzas, savory snacks, and flours, as sold.
Energy (kJ)Energy
(kcal)
Water
(g)
Av. Carb. (g)Sol. Carb.
(g)
Fiber
(g)
Protein
(g)
Lipids
(g)
BREADS
“Piadina” 126830129.553.82.54.33.17.2
“Piadina”, wholemeal123429329.551.20.56.83.36.8
Bread, “ciabatta”, “baguette”, “sfilatino”116927733.549.84.55.83.75.7
Bread, “rosetta”, “tartaruga”106225236.848.93.06.33.13.5
Bread, hamburger/hotdog type104724839.646.46.53.03.04.6
Bread, prepared with oil123629433.048.73.05.03.68.3
Bread, rustic, with seeds113627137.238.54.18.55.68.6
Bread, white, sandwich-type105725140.143.85.15.53.35.7
Bread, white, sliced111226437.245.44.05.93.96.2
Bread, wholemeal115127437.244.14.65.14.17.8
Bread, with olives110326338.540.64.37.34.27.7
Breadcrumb157837410.071.22.75.55.56.2
Tortilla wrap119128329.547.81.910.33.46.4
PIZZAS
“Calzone”, frozen87120754.127.52.12.66.38.2
“Focaccia”124329630.949.44.95.92.98.3
Pizza dough, cooked132431427.355.11.64.23.08.2
Pizza, tomato and mozzarella94322449.231.22.52.96.88.3
SAVORY SNACKS
“Friselle”15803744.977.710.77.24.03.6
“Taralli”19844743.864.02.13.93.321.9
Breadsticks17614183.877.23.03.23.49.9
Breadsticks, wholemeal18744462.772.73.74.12.715.1
Cheese and cereals snacks16513914.473.42.35.88.35.8
Crackers snacks20234823.371.52.52.82.520.1
Crackers, salted18674442.175.03.13.14.113.5
Crackers, wholemeal17844253.665.71.99.55.713.3
Croutons165139210.269.93.55.02.610.2
Saltines snacks18014282.074.52.73.63.312.1
FLOURS
Flour, for bread and pizza140132910.481.83.73.32.60.6
Flour, for cakes143033610.281.911.43.13.21.1
Flour, for pasta14253359.681.82.83.04.30.5
Flour, rustic134131613.070.53.38.82.61.8
Flour, unspecified140533010.581.83.44.12.40.7
Abbreviations: Av. Carb, available carbohydrates; Sol. Carb, soluble carbohydrates.
Table 4. Energy and macronutrient composition per 100 g of GF pasta and ready-to-eat dishes, as sold.
Energy (kJ)Energy
(kcal)
Water
(g)
Av. Carb. (g)Sol. Carb.
(g)
Fiber
(g)
Protein
(g)
Lipids
(g)
PASTA DISHES
“Ravioli”, filled with meat139733331.238.20.31.812.215.3
“Ravioli”, mixed fillings, fresh69416563.523.61.01.34.46.3
“Ravioli”, spinach and ricotta cheese111626537.740.43.52.98.98.0
“Tortellini”, filled with meat124429531.243.21.03.010.29.6
Cous cous14643459.072.31.05.110.92.2
Egg pasta, dry149835310.574.40.32.18.04.2
Egg pasta, fresh105224936.945.20.15.57.14.4
Gnocchi65815556.836.00.52.03.10.3
Legume pasta138332712.751.32.09.222.42.9
Pasta, buckwheat140233014.267.00.94.511.02.9
Pasta, corn144934010.079.40.62.26.91.2
Pasta, for broth142633511.876.80.62.56.61.8
Pasta, mixed cereals142233412.575.40.72.67.21.9
Pasta, mixed cereals and legumes142733611.970.40.94.39.52.8
Pasta, rice144233911.577.60.71.47.51.7
Pasta, wholemeal143333711.874.40.73.47.32.5
READY-TO-EAT DISHES
“Lasagne” with meat60014370.115.92.30.56.06.5
Breaded cheese, frozen72217159.624.54.82.06.45.6
Chicken breast, breaded, frozen96623154.418.00.50.513.012.2
Fish, breaded, frozen84020160.215.61.11.210.710.8
Pasta with pesto sauce75918057.131.60.62.92.94.9
Pasta with tomato sauce124029222.064.53.34.46.31.8
Soup powder, with cereals, mixed144434110.161.72.88.215.03.7
Abbreviations: Av. Carb, available carbohydrates; Sol. Carb, soluble carbohydrates.
Table 5. Daily energy and nutrient composition of gluten-free and gluten-containing one-week guideline menus for each scenario: refined cereals, mixed cereals, and wholegrain cereals.
Refined Cereals ScenarioMixed Cereals ScenarioWholegrain Cereals Scenario
Mean ± SD/
Median (IQR)
p
Value
Mean ± SD/
Median (IQR)
p ValueMean ± SD/
Median (IQR)
p
Value
GCGF GCGF GCGF
Energy (kJ)9839 ± 3259417 ± 4080.0679602 ± 4429405 ± 2890.3459496 ± 2789431 ± 3420.785
Energy (kcal) 2334 ± 792238 ± 980.0542279 ± 1052237 ± 690.3852255 ± 682243 ± 820.704
Av. Carb. (g)345.0 ± 28.1309.1 ± 26.80.031327.0 ± 38.8299.9 ± 31.00.174314.6 ± 28.2299.7 ± 26.80.329
Sol. Carb. (g)102.6 ± 16.797.7 ± 10.30.522140.7 ± 19.898.6 ± 9.90.482103.7 ± 16.799.5 ± 9.90.577
Starch (g)242.3 (20.7)203.3 (5.6)0.018222.3 ± 41.7201.3 ± 32.70.313211.0 ± 23.4200.2 ± 27.20.443
Fiber (g)37.6 ± 7.139.7 ± 8.50.62543.1 ± 6.041.2 ± 8.90.64848.7 ± 9.039.9 ± 9.00.089
Protein (g)90.2 ± 14.179.1 ± 11.50.13290.2 ± 14.580.8 ± 12.80.21991.2 ± 14.880.1 ± 11.90.148
Lipids (g)67.1 ± 12.375.9 ± 10.20.17067.3 ± 9.678.5 ± 10.60.06168.1 ± 9.579.9 ± 9.40.039
SFAs (g)18.6 ± 5.820.9 ± 5.80.45718.7 ± 5.421.0 ± 5.80.44218.9 ± 5.321.2 ± 5.40.434
MUFAs (g)34.0 ± 5.437.3 ± 4.30.23433.1 ± 4.037.4 ± 3.90.06432.7 ± 3.237.7 ± 3.10.012
PUFAs (g)9.1 ± 2.612.4 ± 2.50.0319.9 ± 3.114.6 ± 4.40.04010.8 ± 2.915.6 ± 3.20.012
Oleic acid (g)32.90 ± 5.1536.09 ± 3.960.21832.02 ± 3.8136.25 ± 3.660.05631.63 ± 3.0036.50 ± 2.820.009
Linoleic acid (g)7.44 ± 2.2310.59 ± 2.190.0208.18 ± 2.7412.44 ± 3.940.0379.09 ± 2.5313.51 ± 2.850.010
Linolenic acid (g)1.34 ± 0.351.50 ± 0.370.4061.37 ± 0.331.81 ± 0.450.0591.41 ± 0.361.80 ± 0.360.062
Fe (mg)15.0 ± 4.014.7 ± 2.80.88217.0 ± 4.115.7 ± 3.10.54319.0 ± 4.815.7 ± 3.00.144
Ca (mg)1311 ± 2091266 ± 1460.6491281 ± 1721282 ± 1420.9851268 ± 1791274 ± 1480.952
Na (mg)3288 ± 8452947 ± 7520.4413235 ± 8742991 ± 7490.5853218 ± 8183079 ± 7750.750
K (mg)4342 ± 5964211 ± 6800.7084476 ± 5804320 ± 7170.6634613 ± 6724289 ± 7220.402
P (mg)1538 ± 2601458 ± 1600.5051685 ± 3451555 ± 2050.4091829 ± 3171634 ± 1990.193
Zn (mg)12.19 ± 1.7910.65 ± 1.580.11413.93 ± 3.5111.49 ± 1.900.13214.55 ± 2.3611.62 ± 1.860.024
Vitamin D (µg)1.01 (0.83)1.02 (0.84)0.7981.01 (0.83)1.03 (0.84)0.7981.01 (0.83)1.03 (0.84)0.798
Vitamin E (mg)14.11 ± 2.1017.18 ± 2.020.01614.67 ± 2.5018.59 ± 2.420.01214.55 ± 2.2919.59 ± 1.820.001
Ret. Eq (µg)1334 (572)1417 (640)0.4061334 (572)1371 (666)0.4061334 (572)1348 (652)0.482
Vitamin B1 (mg)1.63 ± 0.541.56 ± 0.540.8191.93 ± 0.581.70 ± 0.570.4792.28 ± 0.501.86 ± 0.580.176
Vitamin B2 (mg)2.17 ± 0.252.06 ± 0.230.4172.22 ± 0.232.07 ± 0.210.2512.28 ± 0.232.06 ± 0.210.101
Niacin (mg)18.46 (15.21)16.92 (14.91)0.56524.90 (13.53)18.88 (13.99)0.48231.58 ± 13.6727.16 ± 12.890.544
Vitamin B6 (mg)2.50 ± 0.512.61 ± 0.540.7002.62 ± 0.582.74 ± 0.530.6852.75 ± 0.592.85 ± 0.540.732
Folates (µg)561 ± 160532 ± 1650.750569 ± 159551 ± 1420.828582 ± 160550 ± 1590.721
Vitamin C (mg)211 (141)211 (143)0.749211 (141)211 (142)0.749211 (141)211 (143)0.749
Abbreviations: SD, standard deviation; IQR, interquartile range; GC, gluten-containing; GF, gluten-free; Av. Carb, available carbohydrates; Sol. Carb, soluble carbohydrates; SFAs, saturated fatty acids; MUFAs, monounsaturated fatty acids; PUFAs, polyunsaturated fatty acids; Ret. Eq., retinol equivalents. A paired t-test and Wilcox signed-rank test were applied to detect any statistical differences between GC and GF menus for normally and non-normally distributed nutrients, respectively. Non-normally distributed nutrients are reported as median (IQR) and highlighted in italics. Significant differences are highlighted in bold typeface.
Publisher’s Note: MDPI stays neutral with regard to jurisdictional claims in published maps and institutional affiliations.

