
Children’s Community Nutrition Environment, Food and Drink Purchases and Consumption on Journeys between Home and School: A Wearable Camera Study

 , ,
, ,  and
and
Abstract
:1. Introduction
- Measure the various types of food outlets to or from school that children are exposed to, taking into account the mode of transport used;
- Examine differences in exposure to food outlets by key sociodemographic characteristics (ethnicity and school decile);
- Determine food purchasing and food consumption on their journeys.
2. Materials and Methods
Coding and Data Analysis
- BMI healthy: fruit and vegetable grocer; large supermarket; natural food store; fresh-food market; juice bar; salad bar; vending machine (Core); Other (Core);
- BMI intermediate: sushi shop; sandwich shop; medium supermarket;
- BMI unhealthy: fast-food outlet; bakery; sweet shop; service station; ice-cream/gelato/yoghurt shop; convenience store; café, vending machine (non-core); mobile food vendor; and other (non-core).
3. Results
3.1. Demographic Characteristics
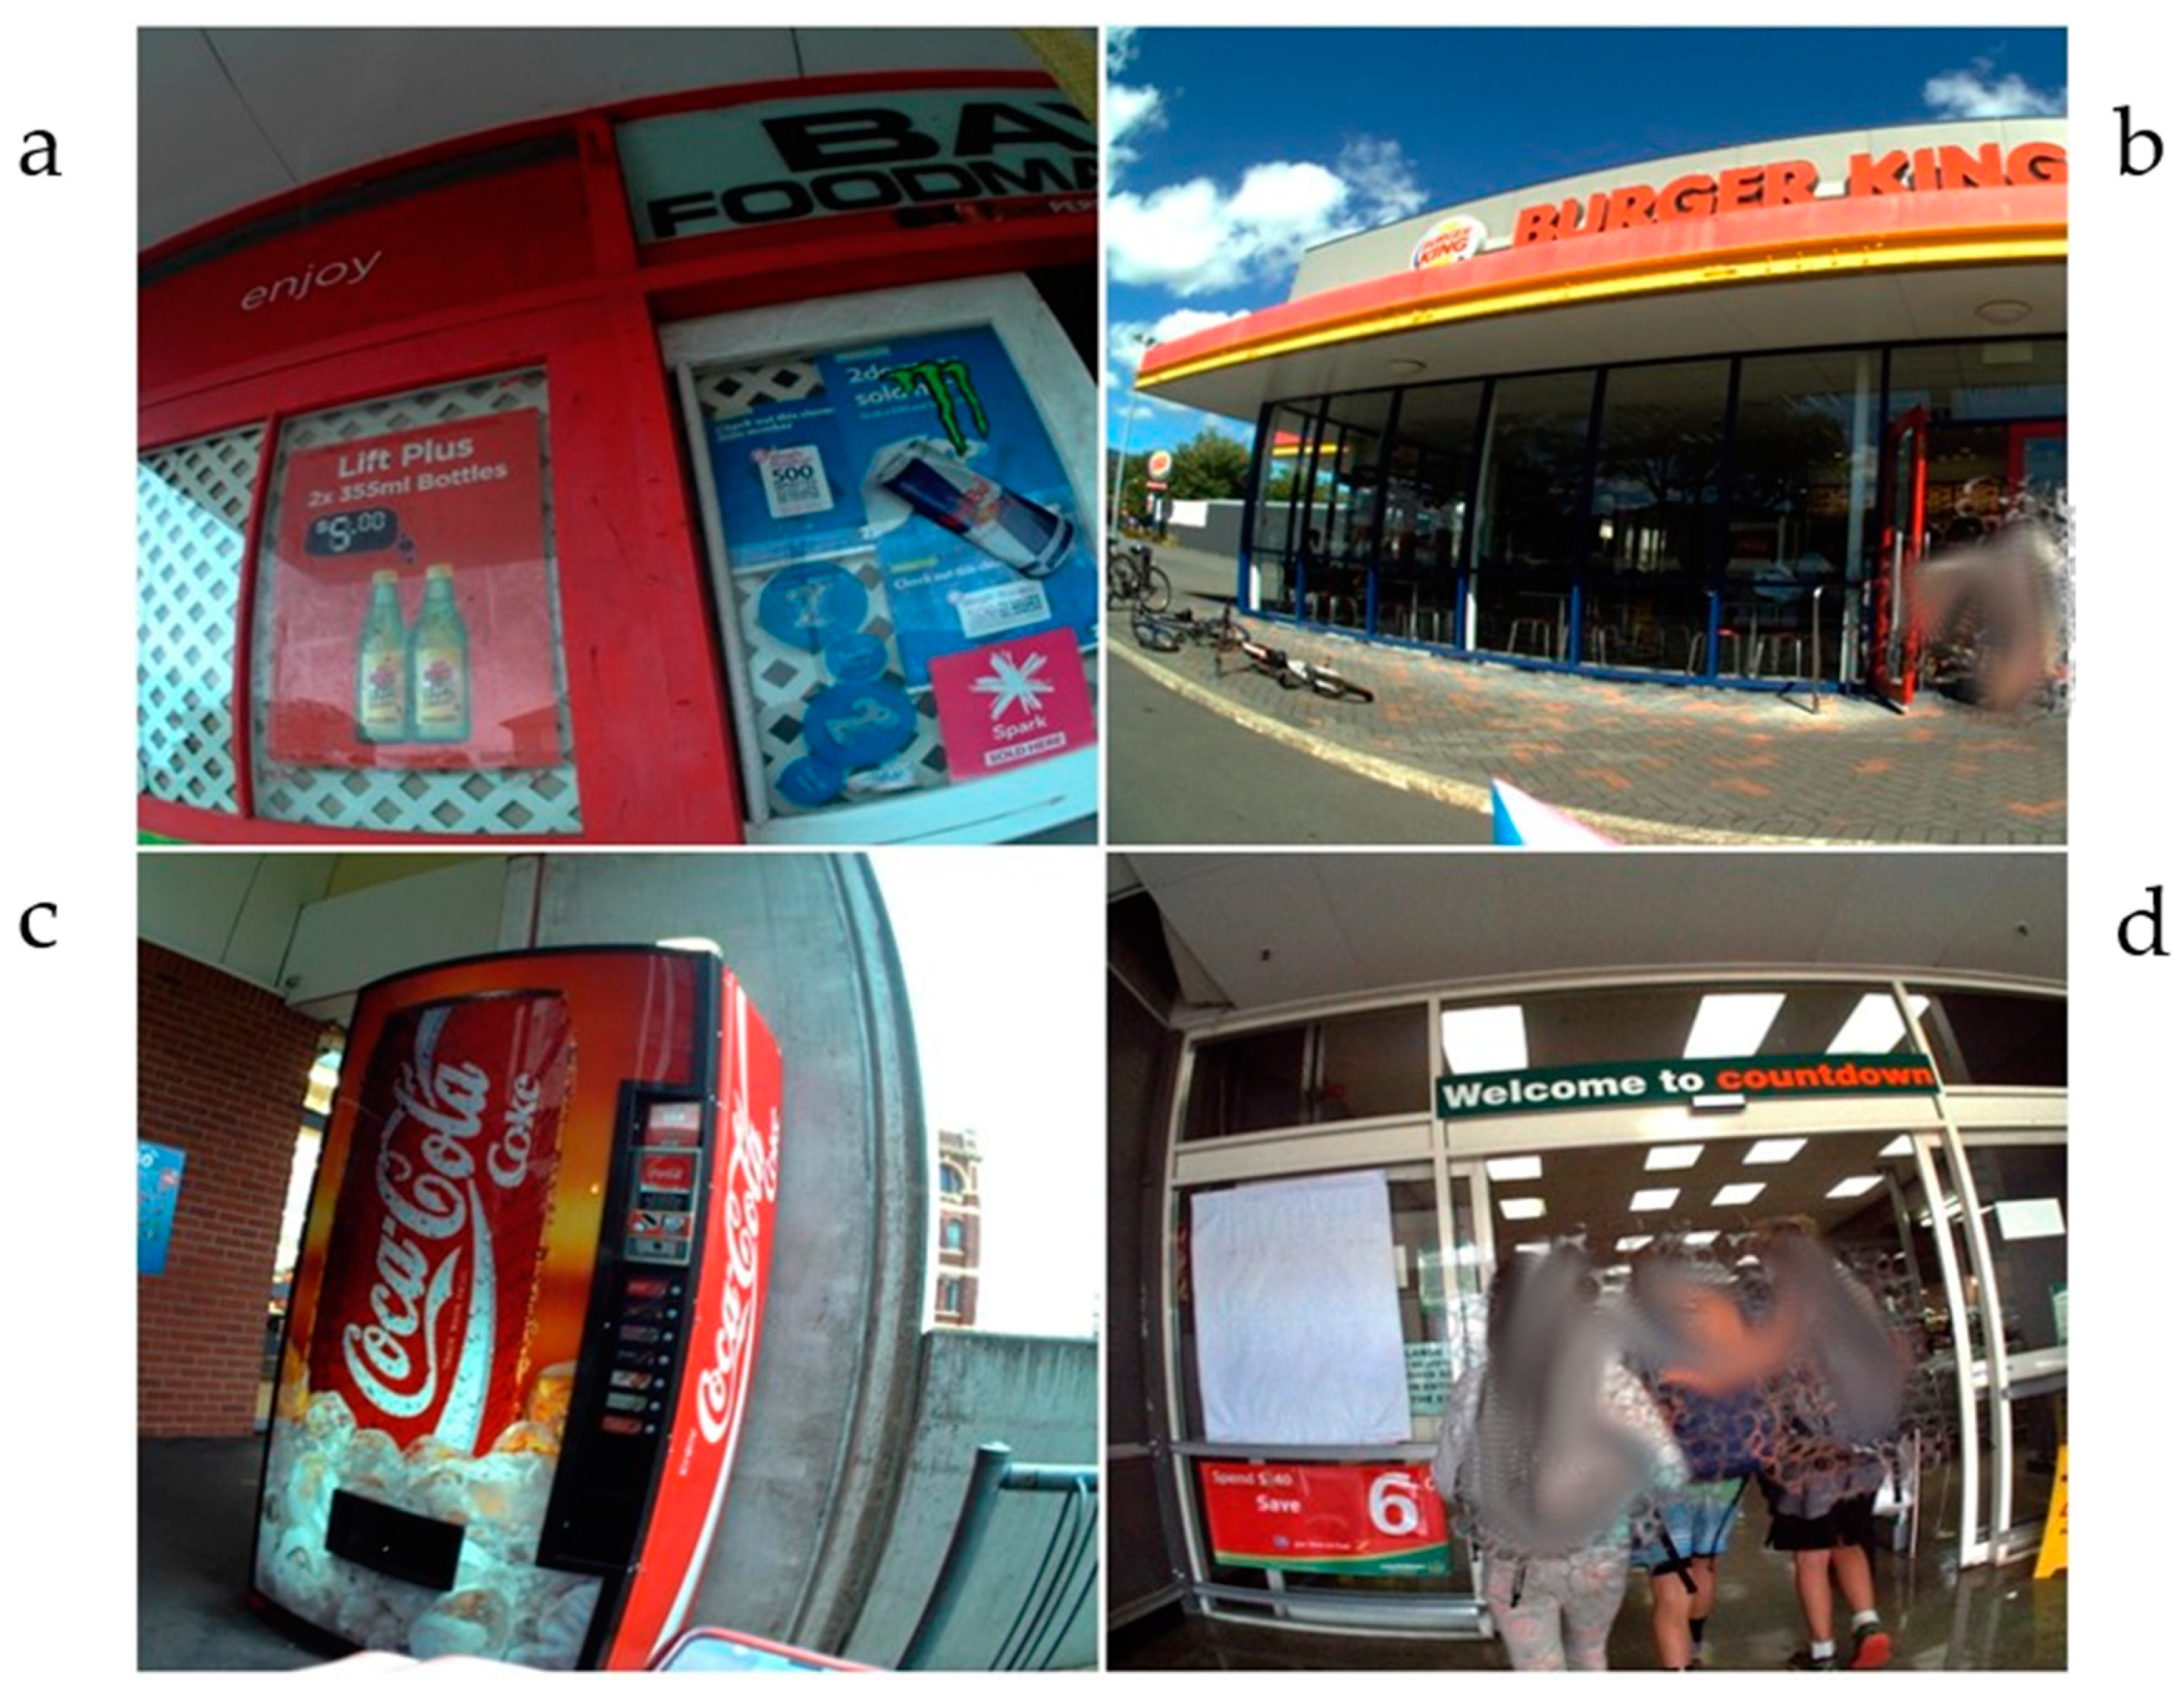
3.2. Food Outlet Category, Travel Mode, and Demographic Characteristics
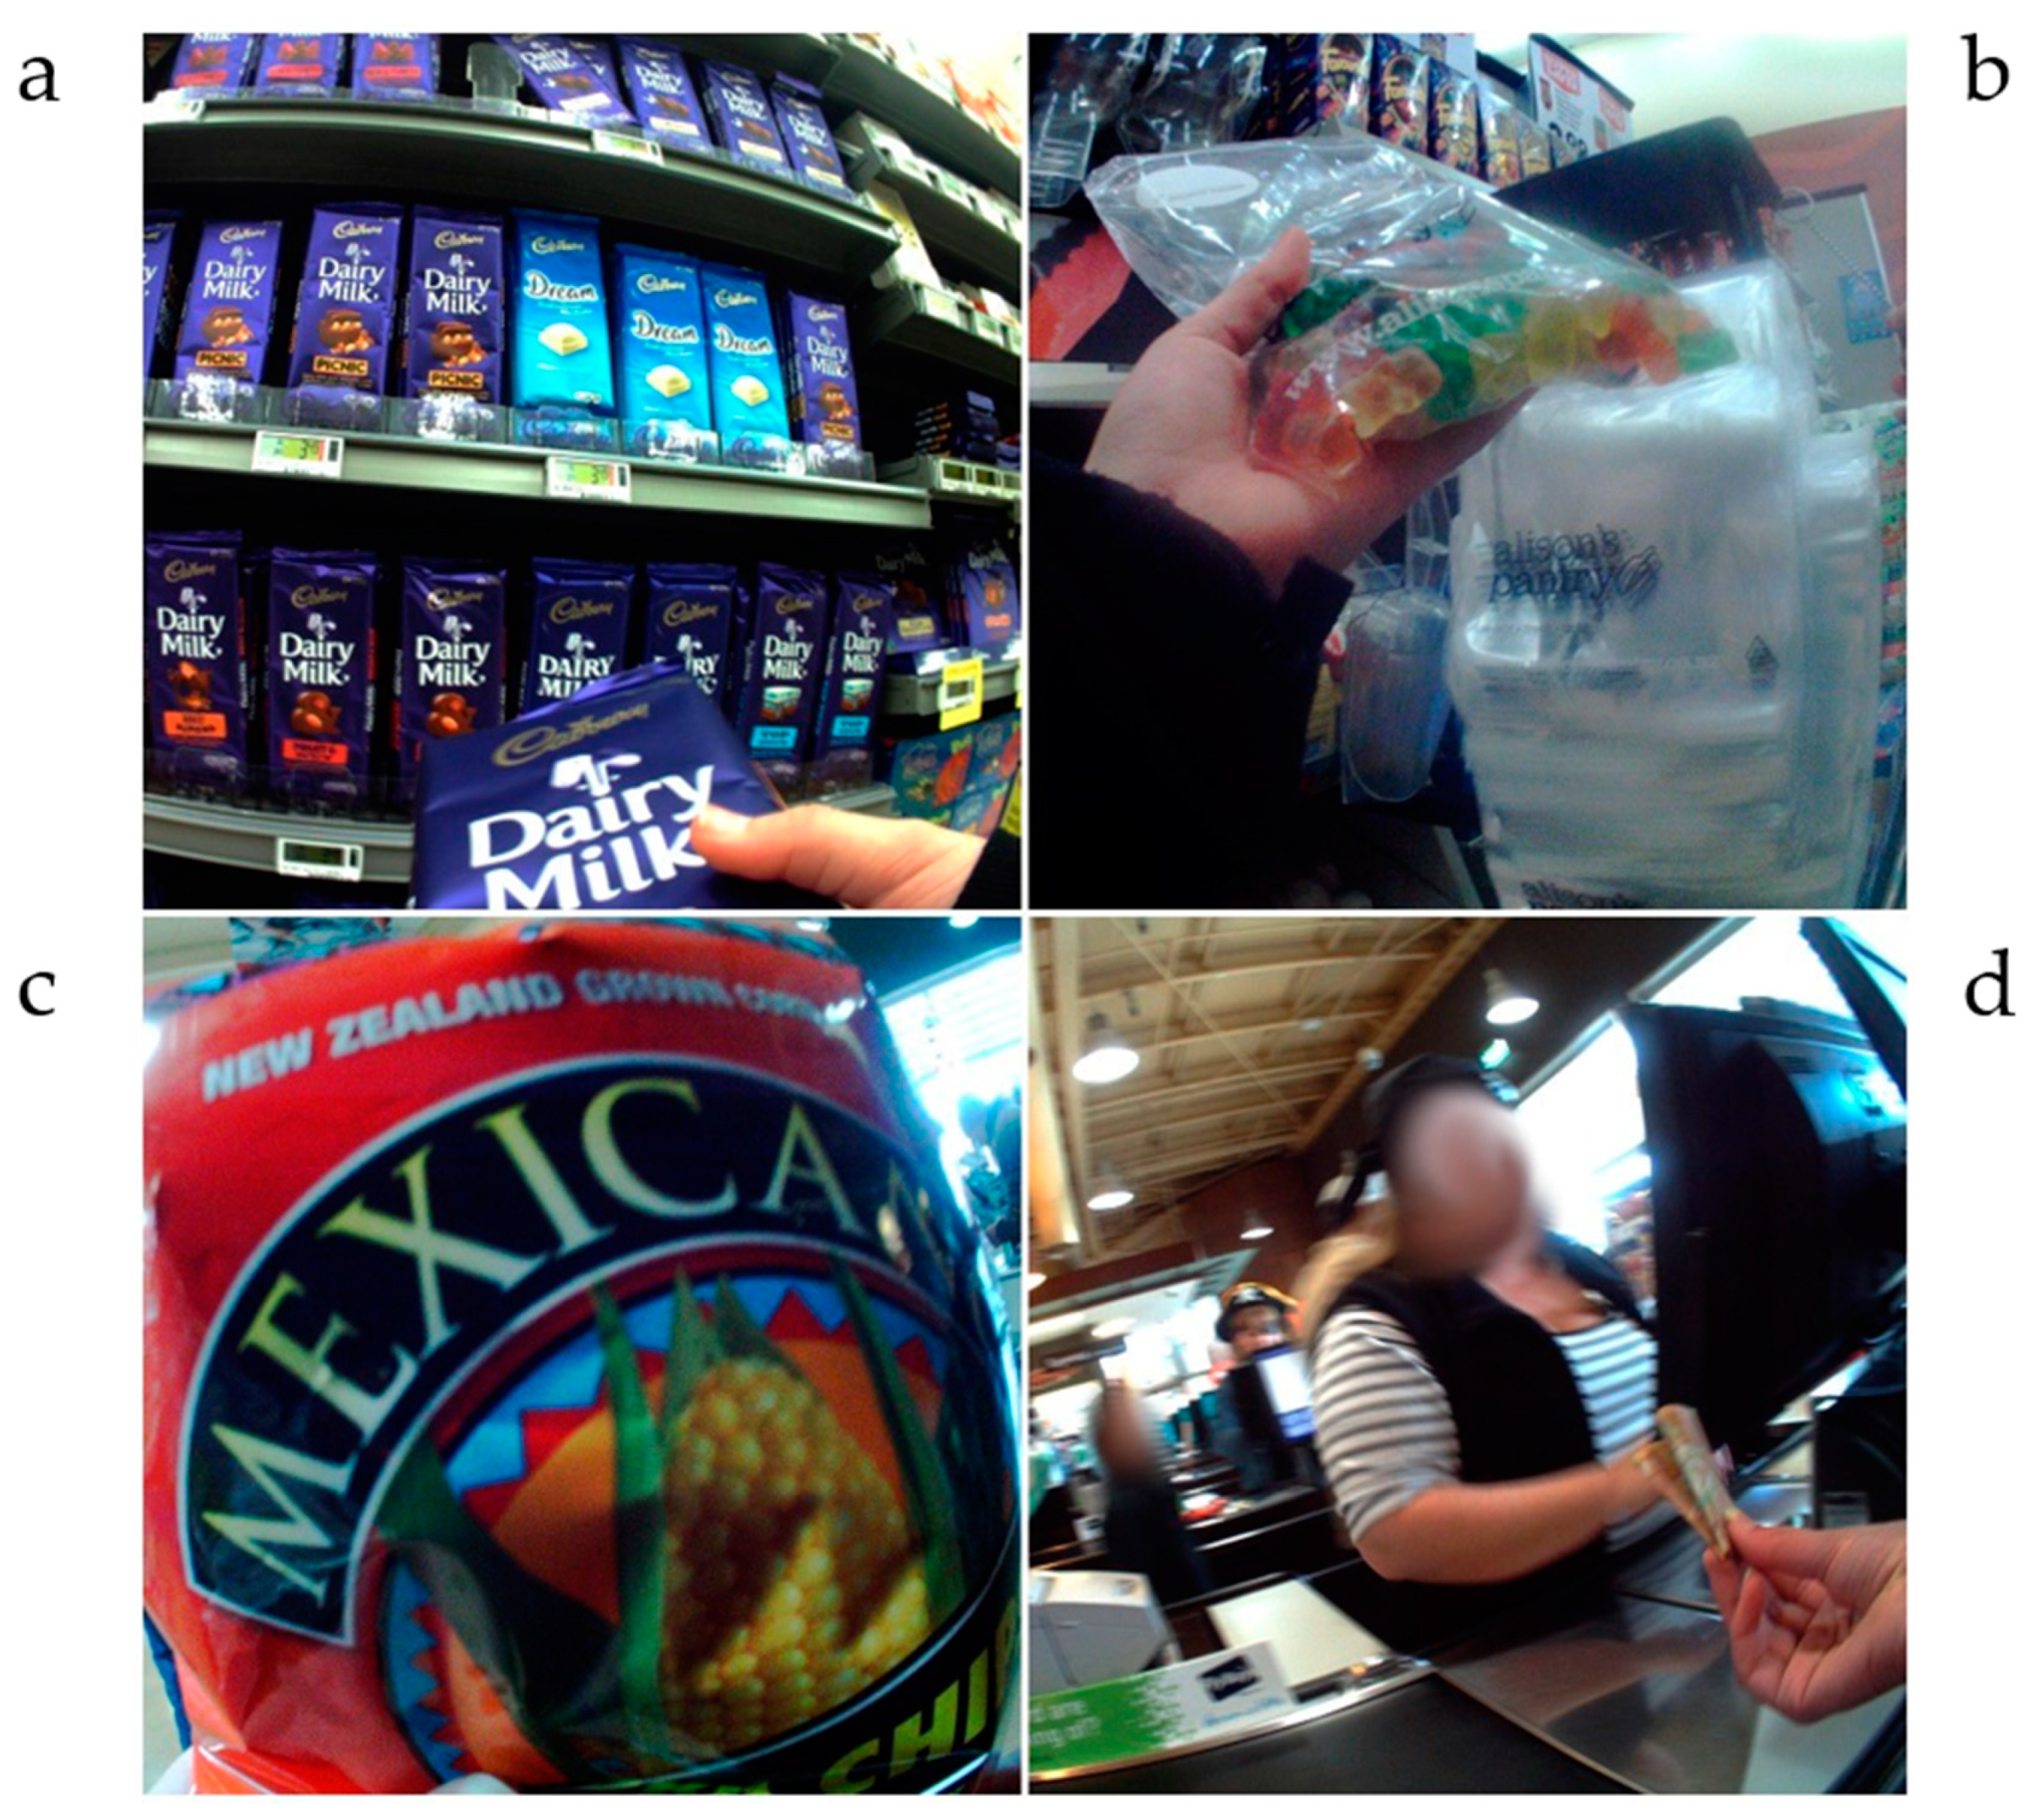
3.3. Food Purchase
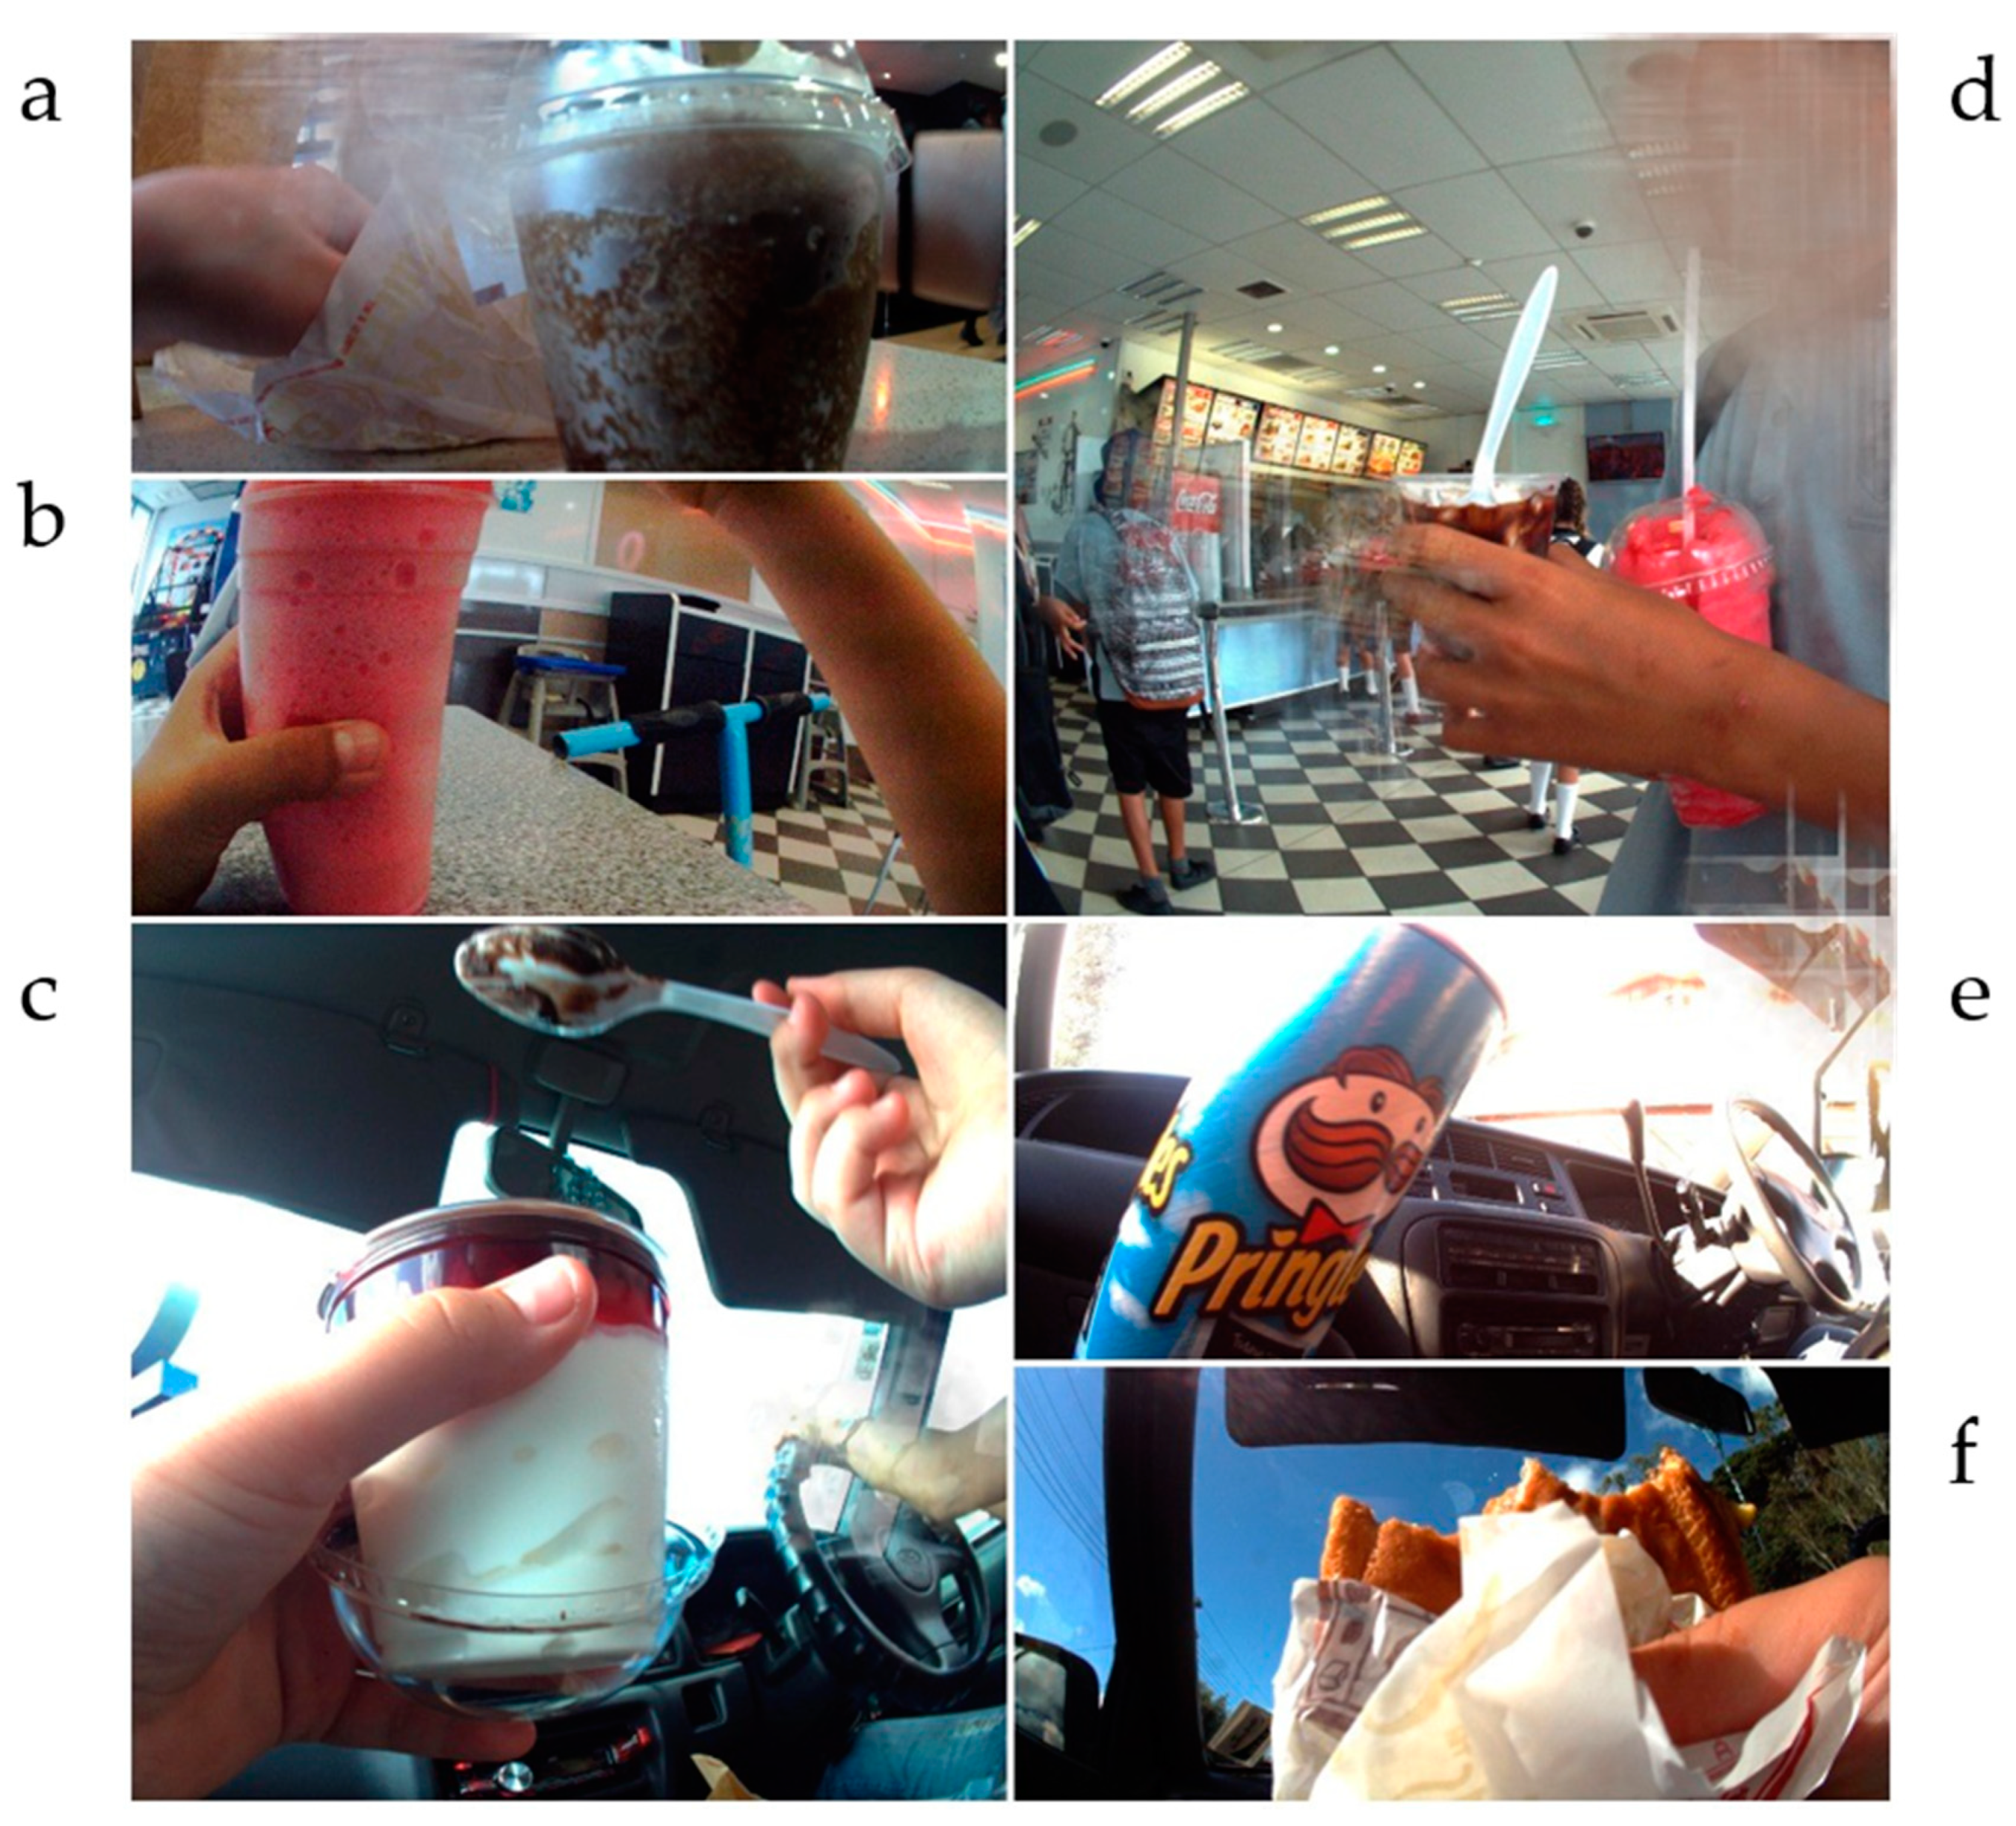
3.4. Consumption
4. Discussion
5. Conclusions
Author Contributions
Funding
Institutional Review Board Statement
Informed Consent Statement
Data Availability Statement
Acknowledgments
Conflicts of Interest
References
- UNICEF. The State of the World’s Children 2019. Children, Food and Nutrition: Growing Well in a Changing World; UNICEF: New York, NY, USA, 2019. [Google Scholar]
- WHO. Report of the Commission on Ending Childhood Obesity; World Health Organization: Geneva, Switzerland, 2016. [Google Scholar]
- Glanz, K.; Sallis, J.F.; Saelens, B.E.; Frank, L.D. Healthy nutrition environments: Concepts and measures. Am. J. Health Promot. 2005, 19, 330–333. [Google Scholar] [CrossRef] [PubMed]
- Cobb, L.K.; Appel, L.J.; Franco, M.; Jones-Smith, J.C.; Nur, A.; Anderson, C.A. The relationship of the local food environment with obesity: A systematic review of methods, study quality, and results. Obesity 2015, 23, 1331–1344. [Google Scholar] [CrossRef] [PubMed] [Green Version]
- Williams, J.; Scarborough, P.; Matthews, A.; Cowburn, G.; Foster, C.; Roberts, N.; Rayner, M. A systematic review of the influence of the retail food environment around schools on obesity-related outcomes. Obes. Rev. 2014, 15, 359–374. [Google Scholar] [CrossRef] [PubMed]
- Engler-Stringer, R.; Le, H.; Gerrard, A.; Muhajarine, N. The community and consumer food environment and children’s diet: A systematic review. BMC Public Health 2014, 14, 522. [Google Scholar] [CrossRef] [Green Version]
- Day, P.L.; Pearce, J. Obesity-Promoting Food Environments and the Spatial Clustering of Food Outlets Around Schools. Am. J. Prev. Med. 2011, 40, 113–121. [Google Scholar] [CrossRef] [PubMed]
- Cutumisu, N.; Traoré, I.; Paquette, M.-C.; Cazale, L.; Camirand, H.; Lalonde, B.; Robitaille, E. Association between junk food consumption and fast-food outlet access near school among Quebec secondary-school children: Findings from the Quebec Health Survey of High School Students (QHSHSS) 2010–2011. Public Health Nutr. 2017, 20, 927–937. [Google Scholar] [CrossRef] [PubMed] [Green Version]
- Kestens, Y.; Daniel, M. Social inequalities in food exposure around schools in an urban area. Am. J. Prev. Med. 2010, 39, 33–40. [Google Scholar] [CrossRef]
- Timmermans, J.; Dijkstra, C.; Kamphuis, C.; Huitink, M.; van der Zee, E.; Poelman, M. ‘Obesogenic’School Food Environments? An Urban Case Study in The Netherlands. Int. J. Environ. Res. Public Health 2018, 15, 619. [Google Scholar] [CrossRef] [Green Version]
- Li, Y.; Du, T.; Huff-Corzine, L.; Johnson, K.; Noyongoyo, B. Where is the fruit? Multidimensional inequalities in food retail environments around public elementary schools. Child Care Health Dev. 2019, 45, 500–508. [Google Scholar]
- Day, P.L.; Pearce, J.R.; Pearson, A.L. A temporal analysis of the spatial clustering of food outlets around schools in Christchurch, New Zealand, 1966 to 2006. Public Health Nutr. 2015, 18, 135–142. [Google Scholar] [CrossRef] [Green Version]
- Vandevijvere, S.; MacKay, S.; O’Souza, E.; Swinburn, B. ‘How Healthy are New Zealand Food Environments?’ A Comprehensive Assessment 2014–2017; The University of Auckland: Auckland, New Zealand, 2018. [Google Scholar]
- Sanchez-Vaznaugh, E.V.; Weverka, A.; Matsuzaki, M.; Sánchez, B.N. Changes in fast food outlet availability near schools: Unequal patterns by income, race/ethnicity, and urbanicity. Am. J. Prev. Med. 2019, 57, 338–345. [Google Scholar] [CrossRef] [PubMed]
- Gilliland, J.A.; Rangel, C.Y.; Healy, M.A.; Tucker, P.; Loebach, J.E.; Hess, P.M.; He, M.; Irwin, J.D.; Wilk, P. Linking childhood obesity to the built environment: A multi-level analysis of home and school neighbourhood factors associated with body mass index. Can. J. Public Health 2012, 103, S15–S21. [Google Scholar] [CrossRef]
- Matsuzaki, M.; Sánchez, B.N.; Acosta, M.E.; Botkin, J.; Sanchez-Vaznaugh, E.V. Food environment near schools and body weight—A systematic review of associations by race/ethnicity, gender, grade, and socio-economic factors. Obes. Rev. 2020, 21, e12997. [Google Scholar] [CrossRef] [PubMed]
- Ministry of Health. Tatau Kahukura: Māori Health Chart Book 2015, 3rd ed.; Ministry of Health: Wellington, New Zealand, 2015.
- Ministry for Pacific Peoples. Contemporary Pacific Status Report A Snapshot of Pacific Peoples in New Zealand; Ministry for Pacific Peoples: Wellington, New Zealand, 2016.
- da Costa Peres, C.M.; Gardone, D.S.; Costa, B.V.L.; Duarte, C.K.; Pessoa, M.C.; Mendes, L.L. Retail food environment around schools and overweight: A systematic review. Nutr. Rev. 2020, 78, 841–856, Erratum in Nutr. Rev. 2020, 78, 611. [Google Scholar] [CrossRef]
- Howard, P.H.; Fitzpatrick, M.; Fulfrost, B. Proximity of food retailers to schools and rates of overweight ninth grade students: An ecological study in California. BMC Public Health 2011, 11, 68. [Google Scholar] [CrossRef] [Green Version]
- Williams, J.; Scarborough, P.; Townsend, N.; Matthews, A.; Burgoine, T.; Mumtaz, L.; Rayner, M. Associations between food outlets around schools and BMI among primary students in England: A cross-classified multi-level analysis. PLoS ONE 2015, 10, e0132930. [Google Scholar] [CrossRef]
- Cetateanu, A.; Jones, A. Understanding the relationship between food environments, deprivation and childhood overweight and obesity: Evidence from a cross sectional England-wide study. Health Place 2014, 27, 68–76. [Google Scholar] [CrossRef]
- Thornton, L.E.; Pearce, J.R.; Kavanagh, A.M. Using Geographic Information Systems (GIS) to assess the role of the built environment in influencing obesity: A glossary. Int. J. Behav. Nutr. Phys. Act. 2011, 8, 71. [Google Scholar] [CrossRef] [Green Version]
- Sacks, G.; Robinson, E.; Cameron, A.J. Issues in measuring the healthiness of food environments and interpreting relationships with diet, obesity and related health outcomes. Curr. Obes. Rep. 2019, 8, 98–111. [Google Scholar] [CrossRef]
- Charreire, H.; Casey, R.; Salze, P.; Simon, C.; Chaix, B.; Banos, A.; Badariotti, D.; Weber, C.; Oppert, J.M. Measuring the food environment using geographical information systems: A methodological review. Public Health Nutr. 2010, 13, 1773–1785. [Google Scholar] [CrossRef]
- Sadler, R.C.; Clark, A.F.; Wilk, P.; O’Connor, C.; Gilliland, J.A. Using GPS and activity tracking to reveal the influence of adolescents’ food environment exposure on junk food purchasing. Can. J. Public Health 2016, 107, eS14–eS20. [Google Scholar] [CrossRef] [PubMed]
- Kelly, P.; Doherty, A.R.; Hamilton, A.; Matthews, A.; Batterham, A.M.; Nelson, M.; Foster, C.; Cowburn, G. Evaluating the feasibility of measuring travel to school using a wearable camera. Am. J. Prev. Med. 2012, 43, 546–550. [Google Scholar] [CrossRef] [PubMed] [Green Version]
- Gemming, L.; Rush, E.; Maddison, R.; Doherty, A.R.; Gant, N.; Utter, J.; Ni Mhurchu, C. Wearable cameras can reduce dietary under-reporting: Doubly labelled water validation of a camera-assisted 24 h recall. Br. J. Nutr. 2015, 113, 284–291. [Google Scholar] [CrossRef] [PubMed] [Green Version]
- Smith, M.; Stanley, J.; Signal, L.; Barr, M.; Chambers, T.; Balina, A.; Ni Mhurchu, C.; Wilson, N. Children’s healthy and unhealthy beverage availability, purchase and consumption: A wearable camera study. Appetite 2019, 133, 240–251. [Google Scholar] [CrossRef]
- McKerchar, C.; Smith, M.; Gage, R.; Williman, J.; Abel, G.; Lacey, C.; Ni Mhurchu, C.; Signal, L. Kids in a Candy Store: An Objective Analysis of Children’s Interactions with Food in Convenience Stores. Nutrients 2020, 12, 2143. [Google Scholar] [CrossRef]
- Veatupu, L.; Puloka, V.; Smith, M.; McKerchar, C.; Signal, L. Me’akai in Tonga: Exploring the Nature and Context of the Food Tongan Children Eat in Ha’apai Using Wearable Cameras. Int. J. Environ. Res. Public Health 2019, 16, 1681. [Google Scholar] [CrossRef] [Green Version]
- Gemming, L.; Doherty, A.; Utter, J.; Shields, E.; Ni Mhurchu, C. The use of a wearable camera to capture and categorise the environmental and social context of self-identified eating episodes. Appetite 2015, 92, 118–125. [Google Scholar] [CrossRef]
- Davies, A.; Chan, V.; Bauman, A.; Signal, L.; Hosking, C.; Gemming, L.; Allman-Farinelli, M. Using wearable cameras to monitor eating and drinking behaviours during transport journeys. Eur. J. Nutr. 2020, 60, 1875–1885. [Google Scholar] [CrossRef] [PubMed]
- Chambers, T.; Pearson, A.L.; Kawachi, I.; Rzotkiewicz, Z.; Stanley, J.; Smith, M.; Barr, M.; Ni Mhurchu, C.; Signal, L. Kids in space: Measuring children’s residential neighborhoods and other destinations using activity space GPS and wearable camera data. Soc. Sci. Med. 2017, 193, 41–50. [Google Scholar] [CrossRef]
- McKerchar, C.; Smith, M.; Stanley, J.; Barr, M.; Chambers, T.; Abel, G.; Lacey, C.; Gage, R.; Ni Mhurchu, C.; Signal, L. Food store environment examination—FoodSee: A new method to study the food store environment using wearable cameras. Glob. Health Promot. 2020, 27, 73–81. [Google Scholar] [CrossRef]
- Cowburn, G.; Matthews, A.; Doherty, A.; Hamilton, A.; Kelly, P.; Williams, J.; Foster, C.; Nelson, M. Exploring the opportunities for food and drink purchasing and consumption by teenagers during their journeys between home and school: A feasibility study using a novel method. Public Health Nutr. 2016, 19, 93–103. [Google Scholar] [CrossRef] [PubMed] [Green Version]
- Signal, L.N.; Smith, M.B.; Barr, M.; Stanley, J.; Chambers, T.J.; Zhou, J.; Duane, A.; Jenkin, G.L.; Pearson, A.L.; Gurrin, C.; et al. Kids’Cam: An objective methodology to study the world in which children live. Am. J. Prev. Med. 2017, 53, e89–e95. [Google Scholar] [CrossRef] [PubMed]
- Signal, L.; Stanley, J.; Smith, M.; Barr, M.; Chambers, T.; Zhou, J.; Duane, A.; Gurrin, C.; Smeaton, A.; McKerchar, C. Children’s everyday exposure to food marketing: An objective analysis using wearable cameras. Int. J. Behav. Nutr. Phys. Act. 2017, 14, 137. [Google Scholar] [CrossRef] [Green Version]
- Robson, B. Mana Whakamarama—Equal Explanatory Power: Māori and Non- Māori Sample Size in National Health Surveys. Wellington: Te Ropu Rangahau Hauora a Eru Pōmare; Department of Public Health, University of Otago Wellington: Wellington, New Zealand, 2002. [Google Scholar]
- Cormack, D.; Harris, R. Issues in Monitoring Māori Health and Ethnic Disparities: An Update. Wellington: Te Rōpū Rangahau Hauora a Eru Pōmare; Department of Public Health, University of Otago Wellington: Wellington, New Zealand, 2009. [Google Scholar]
- Barr, M.; Signal, L.; Jenkin, G.; Smith, M. Capturing exposures: Using automated cameras to document environmental determinants of obesity. Health Promot. Int. 2015, 30, 56–63. [Google Scholar] [CrossRef] [PubMed] [Green Version]
- McKerchar, C. Annotation Manual; Childrens Community Food Environments on Journeys to and from School; Health Promotion and Policy Research Unit, Department of Public Health, University of Otago Wellington: Wellington, New Zealand, 2017. [Google Scholar]
- Thornton, L.; Kavanagh, A. Understanding Local Food Environments and Obesity. In Geographies of Obesity; Pearce, J., Witten, K., Eds.; Routledge Taylor: London, UK, 2010; pp. 79–110. [Google Scholar]
- Rundle, A.G.; Bader, M.D.; Richards, C.A.; Neckerman, K.M.; Teitler, J.O. Using Google Street View to audit neighborhood environments. Am. J. Prev. Med. 2011, 40, 94–100. [Google Scholar] [CrossRef] [Green Version]
- Cohen, N.; Chrobok, M.; Caruso, O. Google-truthing to assess hot spots of food retail change: A repeat cross-sectional Street View of food environments in the Bronx, New York. Health Place 2020, 62, 102291. [Google Scholar] [CrossRef]
- World Health Organization Regional Office for Europe. WHO Regional Office for Europe Nutrient Profile Model; World Health Organization Regional Office for Europe: Copenhagen, Denmark, 2015. [Google Scholar]
- Ferguson, I. The Availability and Accessibility of Convenient Foods in Auckland: A Pilot Study; The University of Auckland: Auckland, New Zealand, 2014. [Google Scholar]
- Ni Mhurchu, C.; Vandevijvere, S.; Waterlander, W.; Thornton, L.E.; Kelly, B.; Cameron, A.J.; Snowdon, W.; Swinburn, B.; INFORMAS. Monitoring the availability of healthy and unhealthy foods and non-alcoholic beverages in community and consumer retail food environments globally. Obes. Rev. 2013, 14 (Suppl. 1), 108–119. [Google Scholar] [CrossRef]
- Salmond, C.; Crampton, P.; King, P.; Waldegrave, C. NZiDep: A New Zealand index of socioeconomic deprivation for individuals. Soc. Sci. Med. 2006, 62, 1474–1485. [Google Scholar] [CrossRef]
- Madsen, K.A.; Gosliner, W.; Woodward-Lopez, G.; Crawford, P.B. Physical Activity Opportunities Associated with Fitness and Weight Status Among Adolescents in Low-Income Communities. Arch. Pediatrics Adolesc. Med. 2009, 163, 1014–1021. [Google Scholar] [CrossRef] [Green Version]
- Larouche, R.; Saunders, T.J.; Faulkner, G.E.J.; Colley, R.; Tremblay, M. Associations Between Active School Transport and Physical Activity, Body Composition, and Cardiovascular Fitness: A Systematic Review of 68 Studies. J. Phys. Act. Health 2014, 11, 206. [Google Scholar] [CrossRef]
- Sanchez-Vaznaugh, E.V.; Bécares, L.; Sallis, J.F.; Sánchez, B.N. Active school transport and fast food intake: Are there racial and ethnic differences? Prev. Med. 2016, 91, 281–286. [Google Scholar] [CrossRef] [PubMed] [Green Version]
- Tyrrell, R.L.; Greenhalgh, F.; Hodgson, S.; Wills, W.J.; Mathers, J.C.; Adamson, A.J.; Lake, A.A. Food environments of young people: Linking individual behaviour to environmental context. J. Public Health 2016, 39, 95–104. [Google Scholar] [CrossRef] [PubMed]
- Lake, A.A.; Burgoine, T.; Greenhalgh, F.; Stamp, E.; Tyrrell, R. The foodscape: Classification and field validation of secondary data sources. Health Place 2010, 16, 37. [Google Scholar] [CrossRef] [PubMed] [Green Version]
- Caspi, C.E.; Lenk, K.; Pelletier, J.E.; Barnes, T.L.; Harnack, L.; Erickson, D.J.; Laska, M.N. Food and beverage purchases in corner stores, gas-marts, pharmacies and dollar stores. Public Health Nutr. 2016, 20, 2587–2597. [Google Scholar] [CrossRef] [Green Version]
- Ziauddeen, N.; Page, P.; Penney, T.L.; Nicholson, S.; Kirk, S.F.; Almiron-Roig, E. Eating at food outlets and leisure places and “on the go” is associated with less-healthy food choices than eating at home and in school in children: Cross-sectional data from the UK National Diet and Nutrition Survey Rolling Program (2008–2014). Am. J. Clin. Nutr. 2018, 107, 992–1003. [Google Scholar] [CrossRef]
- Gage, R.; Girling-Butcher, M.; Joe, E.; Smith, M.; Ni Mhurchu, C.; McKerchar, C.; Puloka, V.; McLean, R.; Signal, L. The Frequency and Context of Snacking among Children: An Objective Analysis Using Wearable Cameras. Nutrients 2021, 13, 103. [Google Scholar] [CrossRef]
- Engler-Stringer, R.; Schaefer, J.; Ridalls, T. An examination of the roles played by early adolescent children in interactions with their local food envionment. Can. J. Public Health 2016, 107, eS48–eS52. [Google Scholar] [CrossRef]
- de Nazelle, A.; Nieuwenhuijsen, M.J.; Antó, J.M.; Brauer, M.; Briggs, D.; Braun-Fahrlander, C.; Cavill, N.; Cooper, A.R.; Desqueyroux, H.; Fruin, S.; et al. Improving health through policies that promote active travel: A review of evidence to support integrated health impact assessment. Environ. Int. 2011, 37, 766–777. [Google Scholar] [CrossRef]
- Willett, W.; Rockström, J.; Loken, B.; Springmann, M.; Lang, T.; Vermeulen, S.; Garnett, T.; Tilman, D.; DeClerck, F.; Wood, A.; et al. Food in the Anthropocene: The EAT Lancet Commission on healthy diets from sustainable food systems. Lancet 2019, 393, 447–492. [Google Scholar] [CrossRef]
- Johnston, N.H.C.; Evans, P.; Ross, C.; Pickering, E. The Lyttelton Edible School Walking Route Enhancing the Space between Home and School; University of Canterbury: Christchurch, New Zealand, 2014. [Google Scholar]
- Paull, J. Incredible Edible Todmorden: Eating the street. Farming Matters 2011, 27, 289. [Google Scholar]
- Swinburn, B.A.; Kraak, V.I.; Allender, S.; Atkins, V.J.; Baker, P.I.; Bogard, J.R.; Brinsden, H.; Calvillo, A.; de Schutter, O.; Devarajan, R.; et al. The Global Syndemic of Obesity, Undernutrition, and Climate Change: The Lancet Commission report. Lancet 2019, 393, 791–846. [Google Scholar] [CrossRef]
- Swinburn, B.; Dominick, C.; Vandevijvere, S. Benchmarking Food Environments: Experts’ Assessments of Policy Gaps and Priorities for the New Zealand Government; University of Auckland: Auckland, New Zealand, 2014. [Google Scholar]
- Hebert, J.R.; Clemow, L.; Pbert, L.; Ockene, I.S.; Ockene, J.K. Social Desirability Bias in Dietary Self-Report May Compromise the Validity of Dietary Intake Measures. Int. J. Epidemiol. 1995, 24, 389–398. [Google Scholar] [CrossRef] [PubMed]
- Gemming, L.; Ni Mhurchu, C. Dietary under-reporting: What foods and which meals are typically under-reported? Eur. J. Clin. Nutr. 2016, 70, 640–641. [Google Scholar] [CrossRef] [PubMed]


| Sample Characteristics | ||
|---|---|---|
| Sociodemographic Variable and Group | n | % |
| Total | 147 | 100 |
| Gender | ||
| Female | 78 | 53.1 |
| Male | 69 | 46.9 |
| Ethnicity | ||
| NZ European | 59 | 40.1 |
| Māori | 52 | 35.4 |
| Pacific | 36 | 24.5 |
| Household socioeconomic deprivation * | ||
| Lower (NZiDep 1–3) | 96 | 65.3 |
| Higher (NZiDep 4–5) | 47 | 32.9 |
| School tertile stratum | ||
| Low (decile 1–3) | 54 | 36.7 |
| Medium (decile 4–7) | 42 | 28.6 |
| High (decile 8–10) | 51 | 34.7 |
| Age (years) ** | ||
| 11 | 12 | 8.3 |
| 12 | 109 | 76.2 |
| 13 | 21 | 14.6 |
| 14 | 1 | 0.6 |
| Mean (SD) | 12.6 (0.5) | |
| BMI *** | ||
| Not overweight (BMI = 16.0–24.9) | 83 | 56.8 |
| Overweight (BMI values ≥ 25.0) | 63 | 43.2 |
| Food Outlet | Active Travel | % | Motorised Modes | % | Mixed | % | All | % |
|---|---|---|---|---|---|---|---|---|
| Bakery | 7 | 3.3% | 2 | 1.1% | 8 | 17.8% | 17 | 3.8% |
| Café | 8 | 3.8% | 2 | 1.1% | 9 | 20.0% | 19 | 4.3% |
| Convenience store | 57 | 25.7% | 8 | 4.3% | 26 | 57.8% | 91 | 20.5% |
| Fast-food outlet | 30 | 14.2% | 5 | 2.7% | 22 | 48.9% | 57 | 12.8% |
| Fresh-food market | 1 | 0.5% | 0 | 0% | 0 | 0% | 1 | 0.2% |
| Fruit and veg grocer | 1 | 0.5% | 0 | 0% | 0 | 0% | 1 | 0.2% |
| Ice-cream/gelato/yoghurt store | 0 | 0% | 0 | 0% | 6 | 13.3% | 6 | 1.4% |
| Juice bar | 0 | 0% | 0 | 0% | 2 | 4.4% | 2 | 0.5% |
| Large supermarket | 19 | 9.0% | 15 | 10.1% | 20 | 44.4% | 54 | 12.2% |
| Medium supermarket | 2 | 0.9% | 0 | 0% | 5 | 11.1% | 7 | 1.6% |
| Natural food store | 0 | 0% | 0 | 0% | 3 | 6.7% | 3 | 0.7% |
| Other miscellaneous | 2 | 0.9% | 0 | 0% | 2 | 4.3% | 4 | 0.9% |
| Sandwich shop | 2 | 0.9% | 1 | 0.5% | 5 | 11.1% | 8 | 1.8% |
| Service station | 12 | 5.7% | 7 | 3.7% | 6 | 13.3% | 25 | 5.6% |
| Sushi shop | 0 | 0% | 0 | 0% | 4 | 8.9% | 4 | 0.9% |
| Sweet shop | 1 | 0.5% | 0 | 0% | 0 | 0% | 1 | 0.2% |
| Vending machine core | 0 | 0% | 1 | 0.5% | 0 | 0% | 1 | 0.2% |
| Vending machine NC | 1 | 0.5% | 2 | 1.1% | 5 | 11.1% | 8 | 1.8% |
| Zero food outlet image | 132 | 62.3% | 149 | 79.7% | 2 | 4.4% | 161 | 36.2% |
| Total journeys | 212 | 47.7% | 187 | 42.1% | 45 | 10.1% | 444 |
| BMI U | % (95 CI) | BMI I | % (95 CI) | BMIH | % (95 CI) | Zero stores | % (95 CI) | Total/444 | ||
|---|---|---|---|---|---|---|---|---|---|---|
| Journeys | Active | 75 | 47.4 (36.0–59.1) | 4 | 2.4 (0.6–8.8) | 20 | 10.2 (4.8–20.2) | 132 | 48.9 (37.3–60.6) | 212 |
| Mixed | 40 | 82.2 (59.5–93.6) | 12 | 29.1 (12.5–54.0) | 20 | 39.5 (22.6–59.4) | 2 | 8.5 (1.3–39.5) | 45 | |
| Motorised | 25 | 13.1 (6.6–24.3) | 1 | 1.3 (0.2–8.9) | 16 | 12.3 (6.6–21.7) | 149 | 75.5 (64.9–83.8) | 187 | |
| Gender | Male | 63 | 26.5 (18.8–35.9) | 7 | 4.2 (1.2–13.3) | 26 | 14.4 (8.1–24.1) | 141 | 65.4 (55.8–74.0) | 214 |
| Female | 77 | 48.2 (35.4–61.2) | 10 | 7.3 (2.5–19.2) | 30 | 16.2 (10.3–24.6) | 142 | 44.1 (33.2–55.7) | 230 | |
| Ethnicity | Māori | 43 | 30.6 (22.4–40.3) | 8 | 6.2 (2.9–12.7) | 28 | 20.0 (12.7–30.1) | 99 | 65.3 (55.5–73.9) | 148 |
| Pacific | 31 | 25.6 (15.9–38.2) | 0 | 0 | 6 | 4.6 (2.1–9.7) | 81 | 72.9 (60.6–82.5) | 114 | |
| NZE | 66 | 41.2 (29.7–53.8) | 9 | 6.8 (2.6–16.7) | 22 | 16.4 (10.4–25.0) | 103 | 48.7 (37.7–59.8) | 182 | |
| School tertile | Low | 33 | 22.1 (14.2–32.6) | 1 | 0.6 (0.07–3.9) | 6 | 4.1 (1.9–8.5) | 122 | 76.6 (66.3–84.5) | 157 |
| Med | 48 | 40.7 (28.4–54.3) | 5 | 4.3 (1.3–13.7) | 11 | 8.5 (3.6–19.0) | 70 | 57.7 (43.9–70.4) | 120 | |
| High | 59 | 40.0 (27.7–53.7) | 11 | 7.6 (2.9–18.4) | 39 | 20.7 (13.8–29.9) | 91 | 48.0 (36.3–59.9) | 167 | |
| Demographic Factor | BMI Unhealthy Foods Outlets | BMI Healthy Food Outlets | |||
|---|---|---|---|---|---|
| Odds Ratio between Groups (95% CI) | p value | Odds Ratio between Groups (95% CI) | p value | ||
| Ethnicity | |||||
| Adjusted for school stratum, gender, journey type | NZ European | 1.0 | 1.0 | ||
| Māori | 0.5 (0.3–1.2) | 0.11 | 2.4(1.1–5.4) | 0.04 | |
| Pacific | 0.4 (0.2–0.9) | 0.03 | 0.5 (0.2–1.7) | 0.28 | |
| School stratum | |||||
| Adjusted for ethnicity, gender, journey type | Low | 0.4 (0.1–0.9) | 0.02 | 0.5 (0.1–1.8) | 0.3 |
| Medium | 1.0 | 1.0 | |||
| High | 0.5 (0.3–1.2) | 0.13 | 2.5 (0.8–7.8) | 0.1 | |
| Gender | |||||
| Adjusted for ethnicity, school stratum journey type | Male | 1.0 | 1.0 | ||
| Female | 2.8 (1.3–5.7) | 0.005 | 0.9 (0.3–2.3) | 0.8 | |
| Journey mode | |||||
| Adjusted for ethnicity, school stratum, gender | Motorised | 0.14 (0.06–0.33) | 0.0001 | 1.2 (0.4–3.4) | 0.7 |
| Mixed | 4.2 (1.2–14.4) | 0.02 | 4.9 (1.5–15.8) | 0.007 | |
| Active | 1.0 | ||||
| Food Outlets | Purchase | Consumption | ||||||
|---|---|---|---|---|---|---|---|---|
| Count | Participant | Peer | Non-Core | Core | Count | Non-Core | Core | |
| Bakery | 4 | 4 | 0 | 4 | 0 | 4 | 4 | 0 |
| Café | 6 | 2 | 4 | 4 | 2 | 6 | 5 | 1 |
| Convenience store | 18 | 16 | 2 | 16 | 2 | 16 | 16 | 0 |
| Fast-food | 17 | 8 | 9 | 17 | 0 | 20 | 20 | 0 |
| Ice-cream/gelato/ Yoghurt store | 3 | 2 | 1 | 3 | 0 | 3 | 3 | 0 |
| Large supermarket | 20 | 9 | 11 | 13 | 7 | 10 | 10 | 0 |
| Medium supermarket | 4 | 3 | 1 | 4 | 0 | 4 | 4 | 0 |
| Other miscellaneous | 1 | 1 | 0 | 1 | 0 | 1 | 1 | 0 |
| Sandwich shop | 3 | 0 | 3 | 1 | 2 | 3 | 1 | 2 |
| Service station | 3 | 3 | 0 | 3 | 0 | 3 | 3 | 0 |
| Vending machine NC | 3 | 2 | 1 | 3 | 0 | 3 | 3 | 0 |
| Grand total | 82 | 50 | 32 | 69 | 13 | 73 | 70 | 3 |
Publisher’s Note: MDPI stays neutral with regard to jurisdictional claims in published maps and institutional affiliations. |
© 2022 by the authors. Licensee MDPI, Basel, Switzerland. This article is an open access article distributed under the terms and conditions of the Creative Commons Attribution (CC BY) license (https://creativecommons.org/licenses/by/4.0/).
Share and Cite
McKerchar, C.; Gage, R.; Smith, M.; Lacey, C.; Abel, G.; Ni Mhurchu, C.; Signal, L. Children’s Community Nutrition Environment, Food and Drink Purchases and Consumption on Journeys between Home and School: A Wearable Camera Study. Nutrients 2022, 14, 1995. https://doi.org/10.3390/nu14101995
McKerchar C, Gage R, Smith M, Lacey C, Abel G, Ni Mhurchu C, Signal L. Children’s Community Nutrition Environment, Food and Drink Purchases and Consumption on Journeys between Home and School: A Wearable Camera Study. Nutrients. 2022; 14(10):1995. https://doi.org/10.3390/nu14101995
Chicago/Turabian StyleMcKerchar, Christina, Ryan Gage, Moira Smith, Cameron Lacey, Gillian Abel, Cliona Ni Mhurchu, and Louise Signal. 2022. "Children’s Community Nutrition Environment, Food and Drink Purchases and Consumption on Journeys between Home and School: A Wearable Camera Study" Nutrients 14, no. 10: 1995. https://doi.org/10.3390/nu14101995