
A College Fast-Food Environment and Student Food and Beverage Choices: Developing an Integrated Database to Examine Food and Beverage Purchasing Choices among College Students

 ,
,
Abstract
:1. Introduction
2. Materials and Methods
2.1. Dataset Development
2.2. Setting/Participants
2.3. Measurement
2.4. Data Analysis
3. Results
4. Discussion
5. Conclusions
Author Contributions
Funding
Institutional Review Board Statement
Informed Consent Statement
Data Availability Statement
Conflicts of Interest
References
- Niemeier, H.M.; Raynor, H.A.; Lloyd-Richardson, E.E.; Rogers, M.L.; Wing, R.R. Fast food consumption and breakfast skipping: Predictors of weight gain from adolescence to adulthood in a nationally representative sample. J. Adolesc. Health 2006, 39, 842–849. [Google Scholar] [CrossRef] [PubMed]
- Llanaj, E.; Hanley-Cook, G.T. Adherence to healthy and sustainable diets is not differentiated by cost, but rather source of foods among young adults in Albania. Br. J. Nutr. 2021, 126, 591–599. [Google Scholar] [CrossRef]
- Lachat, C.K.; Huybregts, L.F.; Roberfroid, D.A.; Van Camp, J.; Remaut-De Winter, A.-M.E. Nutritional profile of foods offered and consumed in a Belgian university canteen. Public Health Nutr. 2009, 12, 122–128. [Google Scholar] [CrossRef] [PubMed] [Green Version]
- Tanton, J.; Dodd, L.J.; Woodfield, L.; Mabhala, M. Eating Behaviours of British University Students: A Cluster Analysis on a Neglected Issue. Adv. Prev. Med. 2015, 2015, 639239. [Google Scholar] [CrossRef] [PubMed] [Green Version]
- El Ansari, W.; Stock, C.; John, J.; Deeny, P.; Phillips, C.; Snelgrove, S.; Adetunji, H.; Hu, X.; Parke, S.; Stoate, M.; et al. Health promoting behaviours and lifestyle characteristics of students at seven universities in the UK. Cent. Eur. J. Public Health 2011, 19, 197–204. [Google Scholar] [CrossRef] [Green Version]
- Deforche, B.; Van Dyck, D.; Deliens, T.; De Bourdeaudhuij, I. Changes in weight, physical Activity, sedentary behaviour and dietary intake during the transition to higher education: A prospective study. Int. J. Behav. Nutr. Phys. Act. 2015, 12, 16. [Google Scholar] [CrossRef] [PubMed] [Green Version]
- Vadeboncoeur, C.; Townsend, N.; Foster, C. A meta-analysis of weight gain in first year university students: Is freshman 15 a myth? BMC Obes. 2015, 2, 22. [Google Scholar] [CrossRef] [Green Version]
- Levitsky, D.A.; Halbmaier, C.A.; Mrdjenovic, G. The freshman weight gain: A model for the study of the epidemic of obesity. Int. J. Obes Relat. Metab. Disord. 2004, 28, 1435–1442. [Google Scholar] [CrossRef] [Green Version]
- Whatnall, M.C.; Patterson, A.J.; Burrows, T.L.; Hutchesson, M.J. Higher diet quality in university students is associated with higher academic achievement: A cross-sectional study. J. Hum. Nutr. Diet. 2019, 32, 321–328. [Google Scholar] [CrossRef] [PubMed]
- Whatnall, M.C.; Patterson, A.J.; Siew, Y.Y.; Kay-Lambkin, F.; Hutchesson, M.J. Are Psychological Distress and Resilience Associated with Dietary Intake Among Australian University Students? Int. J. Environ. Res. Public Health 2019, 16, 4099. [Google Scholar] [CrossRef] [Green Version]
- Whatnall, M.C.; Patterson, A.J.; Hutchesson, M.J. Effectiveness of Nutrition Interventions in Vending Machines to Encourage the Purchase and Consumption of Healthier Food and Drinks in the University Setting: A Systematic Review. Nutrients 2020, 12, 876. [Google Scholar] [CrossRef] [PubMed] [Green Version]
- Whatnall, M.C.; Patterson, A.J.; Chiu, S.; Oldmeadow, C.; Hutchesson, M.J. Determinants of eating behaviours in Australian university students: A cross-sectional analysis. Nutr. Diet. 2020, 77, 331–343. [Google Scholar] [CrossRef] [PubMed]
- Whatnall, M.C.; Hutchesson, M.J.; Sharkey, T.; Haslam, R.L.; Bezzina, A.; Collins, C.E.; Tzelepis, F.; Ashton, L.M. Recruiting and retaining young adults: What can we learn from behavioural interventions targeting nutrition, physical activity and/or obesity? A systematic review of the literature. Public Health Nutr. 2021, 24, 5686–5703. [Google Scholar] [CrossRef]
- Hutchesson, M.J.; Whatnall, M.C.; Patterson, A.J. On-campus food purchasing behaviours and satisfaction of Australian university students. Health Promot. J. Austr. 2021; early view. [Google Scholar] [CrossRef] [PubMed]
- Roy, R.; Soo, D.; Conroy, D.; Wall, C.R.; Swinburn, B. Exploring University Food Environment and On-Campus Food Purchasing Behaviors, Preferences, and Opinions. J. Nutr. Educ. Behav. 2019, 51, 865–875. [Google Scholar] [CrossRef]
- Roy, R.; Rangan, A.; Hebden, L.; Yu Louie, J.C.; Tang, L.M.; Kay, J.; Allman-Farinelli, M. Dietary contribution of foods and beverages sold within a university campus and its effect on diet quality of young adults. Nutrition 2017, 34, 118–123. [Google Scholar] [CrossRef] [PubMed]
- Sprake, E.F.; Russell, J.M.; Cecil, J.E.; Cooper, R.J.; Grabowski, P.; Pourshahidi, L.K.; Barker, M.E. Dietary patterns of university students in the UK: A cross-sectional study. Nutr. J. 2018, 17, 90. [Google Scholar] [CrossRef]
- Llanaj, E.; Ádány, R.; Lachat, C.; D’Haese, M. Examining food intake and eating out of home patterns among university students. PLoS ONE 2018, 13, e0197874. [Google Scholar] [CrossRef] [Green Version]
- Burrows, T.L.; Whatnall, M.C.; Patterson, A.J.; Hutchesson, M.J. Associations between Dietary Intake and Academic Achievement in College Students: A Systematic Review. Healthcare 2017, 5, 60. [Google Scholar] [CrossRef] [PubMed] [Green Version]
- Pelletier, J.E.; Laska, M.N. Campus food and beverage purchases are associated with indicators of diet quality in college students living off campus. Am. J. Health Promot. 2013, 28, 80–87. [Google Scholar] [CrossRef] [Green Version]
- Merhout, F.; Doyle, J. Socioeconomic status and diet quality in college students. J. Nutr. Educ. Behav. 2019, 51, 1107–1112. [Google Scholar] [CrossRef] [PubMed]
- USDA Food and Nutrition Service. School Breakfast. Available online: https://www.fns.usda.gov/nslphttps://www.fns.usda.gov/sbp/school-breakfast-program (accessed on 6 February 2022).
- PHA. Department of Commerce, Census Bureau, Current Population Survey (CPS), October, 1970 through 2019. 2019. Available online: https://www.ahealthieramerica.org/articles/healthier-campus-initiative-146 (accessed on 6 February 2022).
- US Department of Agriculture; US Department of Health and Human Services. Dietary Guidelines for Americans, 2020–2025, 9th ed.; US Department of Agriculture: Washington, DC, USA, 2020. Available online: https://dietaryguidelines.gov (accessed on 5 May 2021).
- Institute of Medicine. Dietary Reference Intakes for Water, Potassium, Sodium, Chloride, and Sulfate; The National Academies Press: Washington, DC, USA, 2005. [Google Scholar] [CrossRef]
- National Center for Education Statistics. 2019. Available online: https://nces.ed.gov/programs/digest/d19/tables/dt19_330.10.asp (accessed on 6 February 2022).
- Inside UNC Charlotte. UNC Charlotte Sets Historic Enrollment Record. Available online: https://inside.charlotte.edu/news-features/2021-09-14/unc-charlotte-sets-historic-enrollment-record.2021 (accessed on 6 February 2022).
- Schmidt, M.; Affenito, S.G.; Striegel-Moore, R.; Khoury, P.R.; Barton, B.; Crawford, P.; Kronsberg, S.; Schreiber, G.; Obarzanek, E.; Daniels, S. Fast-food intake and diet quality in black and white girls: The National Heart, Lung, and Blood Institute Growth and Health Study. Arch. Pediatr. Adolesc. Med. 2005, 159, 626–631. [Google Scholar] [CrossRef] [PubMed] [Green Version]
- Gaines, A.; Robb, C.A.; Knol, L.L.; Sickler, S. Examining the role of financial factors, resources and skills in predicting food security status among college students. Int. J. Consum. Stud. 2014, 38, 374–384. [Google Scholar] [CrossRef]
- Bryant, R.; Dundes, L. Fast food perceptions: A pilot study of college students in Spain and the United States. Appetite 2008, 51, 327–330. [Google Scholar] [CrossRef]
- He, J.; Chen, X.; Fan, X.; Cai, Z.; Huang, F. Is there a relationship between body mass index and academic achievement? A meta-analysis. Public Health 2019, 167, 111–124. [Google Scholar] [CrossRef]
- Kobayashi, F. Academic achievement, BMI, and fast food intake of American and Japanese college students. Nutr. Food Sci. 2009, 39, 555–566. [Google Scholar] [CrossRef]
- Peterson, S.; Duncan, D.P.; Null, D.B.; Roth, S.L.; Gill, L. Positive changes in perceptions and selections of healthful foods by college students after a short-term point-of-selection intervention at a dining hall. J. Am. Coll. Health 2010, 58, 425–431. [Google Scholar] [CrossRef]
- Lowry, R.; Galuska, D.A.; Fulton, J.E.; Wechsler, H.; Kann, L.; Collins, J.L. Physical activity, food choice, and weight management goals and practices among US college students. Am. J. Prev. Med. 2000, 18, 18–27. [Google Scholar] [CrossRef]


| Fast-Food Health Score (FFHS) Components 1 | Health Point | Affected Menu Items |
|---|---|---|
| Total fat is between 20% and 35% of calories | 1 | 17.1% |
| Saturated fat less than 10% of calories | 1 | 52.2% |
| Sodium less than 1.15 mg for every calorie | 1 | 53.8% |
| Total Carbs between 45% and 65% of calories | 1 | 30.4% |
| 1.4 g or more fiber for every 100 calories | 1 | 28.1% |
| Sugars less than 10% of calories | 1 | 36.8% |
| Protein is 10–30% of calories | 1 | 33.8% |
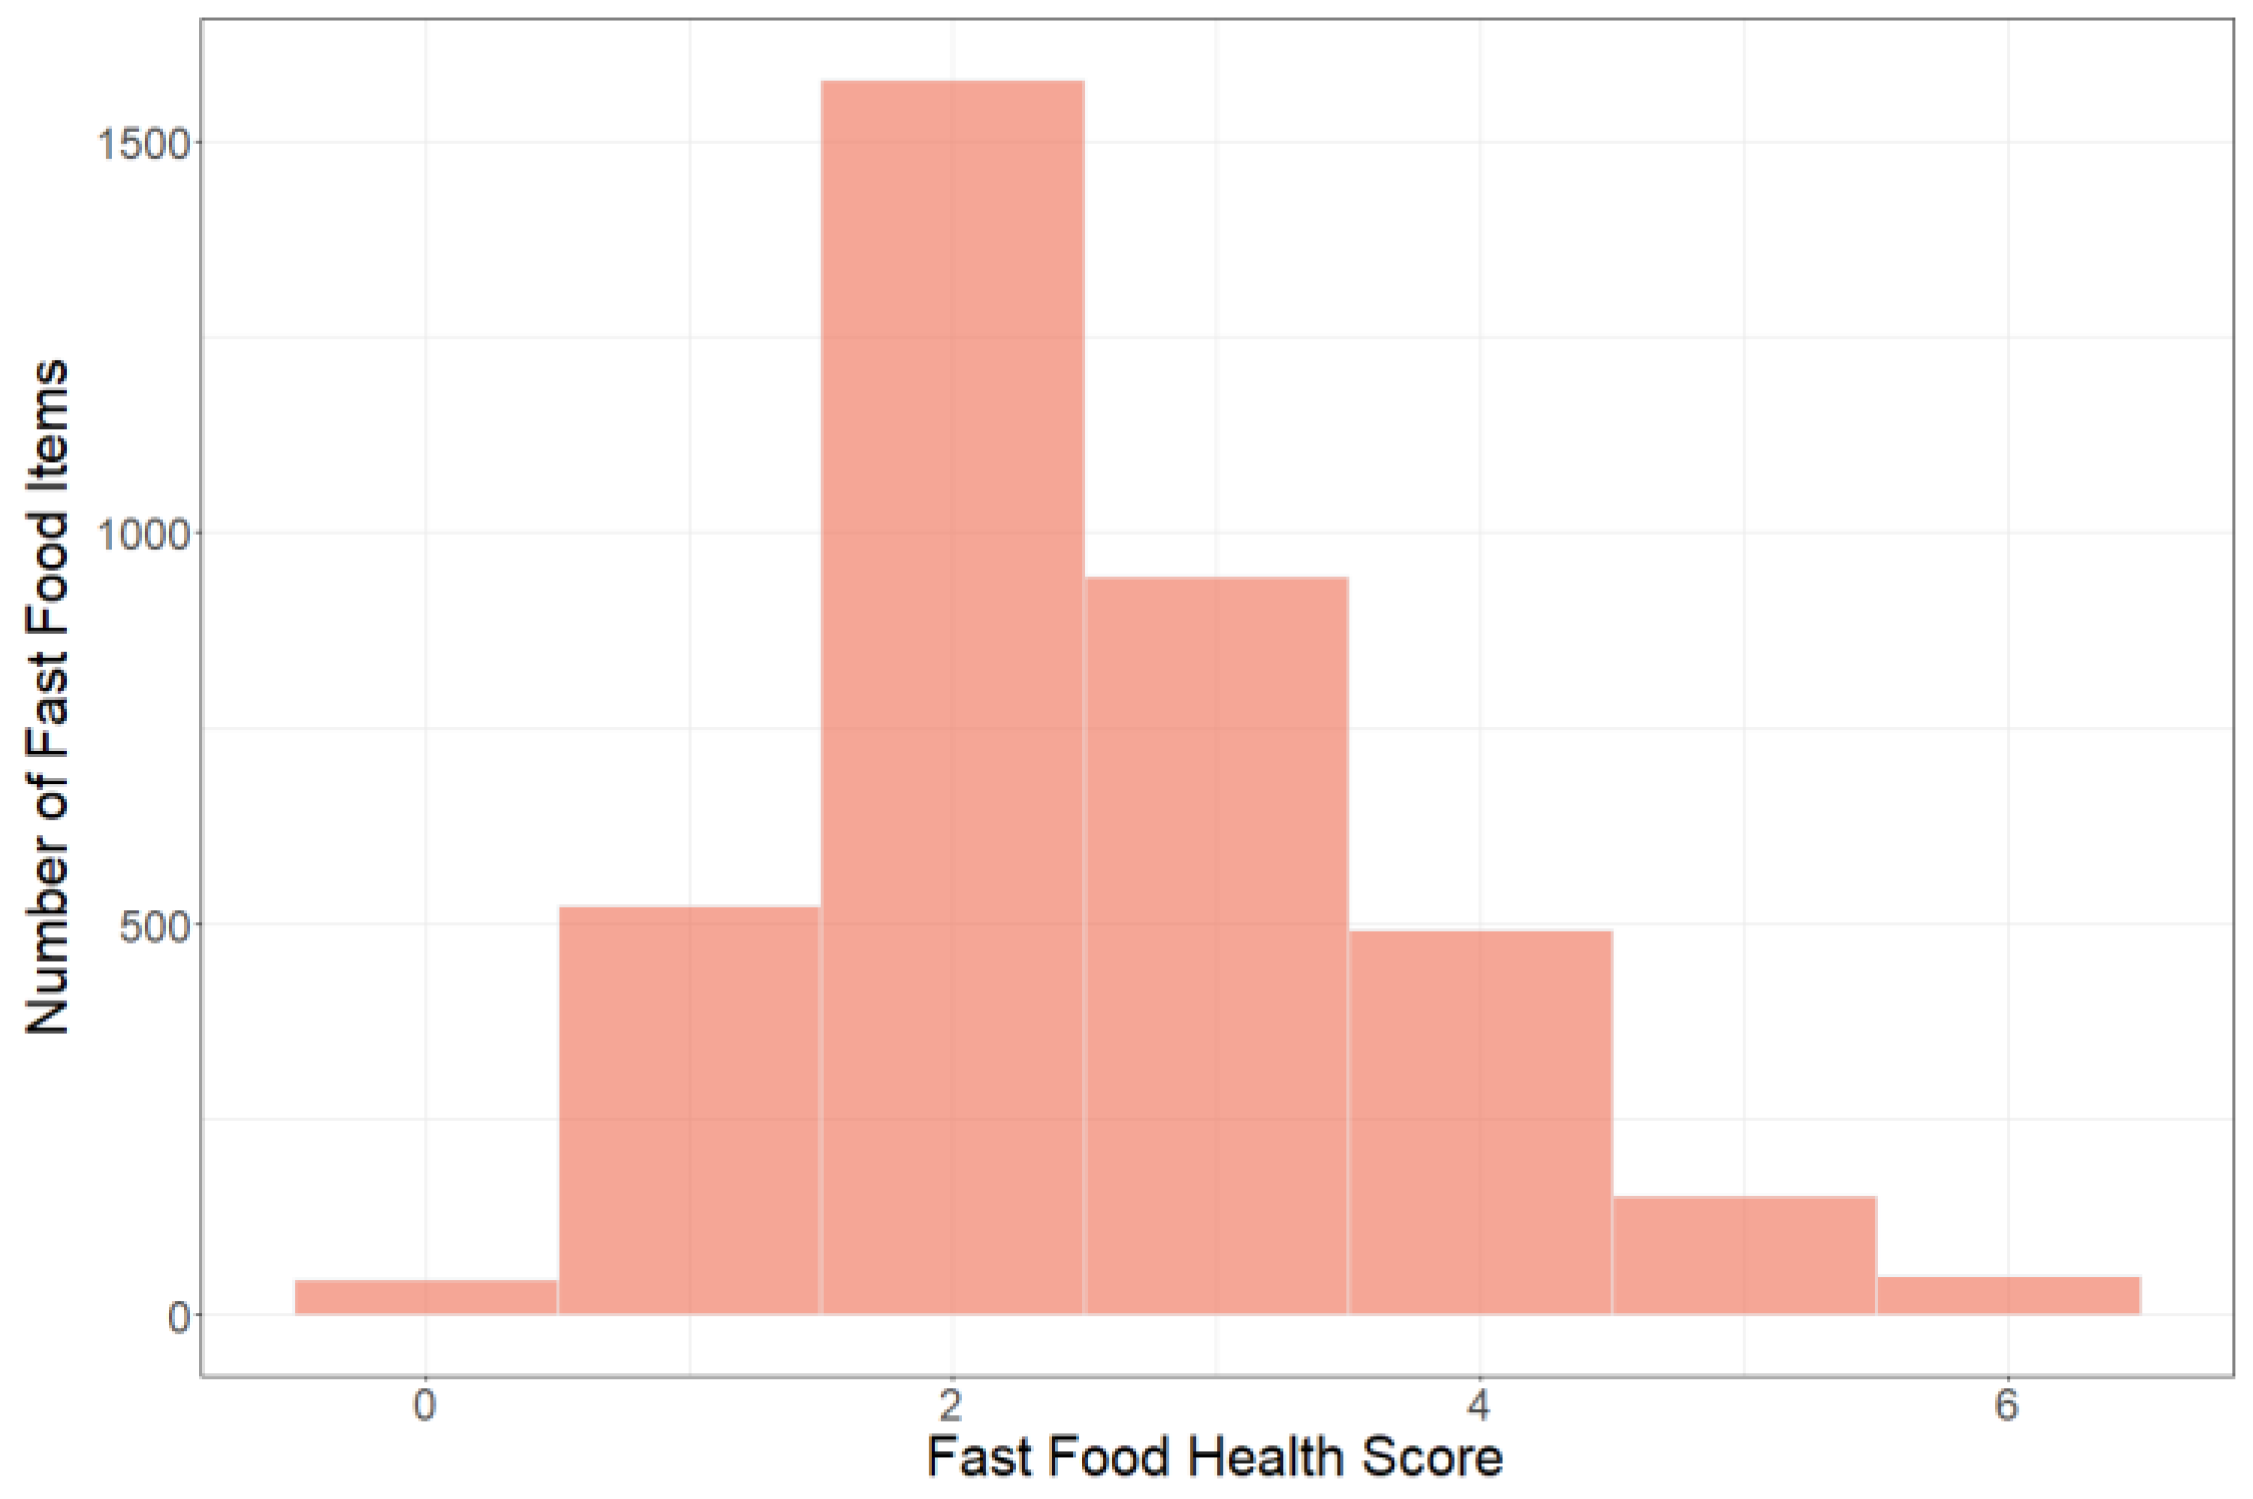
| Total FFHS Range | 0–7 |
| Variable | Total Student Observations N = 35,449 | Female n = 15,730 (44.4%) | Male n = 19,719 (55.6%) |
|---|---|---|---|
| Student Fast-food Healthy Food Score Mean (Standard Deviation) | 2.85 (0.35) | 2.87 (0.31) | 2.82 (0.38) |
| Age Median (Interquartile Range) | 19 (2) | 19 (2) | 19 (2) |
| Race/Ethnicity | |||
| African American Population (Column %) | 7476 (22) | 4130 (27) | 3346 (17) |
| Asian Population (Column %) | 1798 (5) | 719 (5) | 1079 (6) |
| Hispanic Population (Column %) | 2558 (7) | 1266 (8) | 1292 (7) |
| White Population (Column %) | 20,457 (59) | 8052 (52) | 12,405 (64) |
| Other Population (Column %) | 2581 (7) | 1313 (8) | 1268 (6) |
| International | |||
| Yes Count (Column %) | 579 (2) | 250 (2) | 329 (2) |
| No Count (Column %) | 34,870 (98) | 15,480 (98) | 19,390 (98) |
| Low Income Population (Total Population %) | 11,753 (33.1) | 5943 (37.8) | 5810 (29.5) |
| Money Spent on Fast Food (Declining Balance Dollars) per Semester (Hundreds of Dollars) (Column %) | 303.45 (208.28) | 315.73 (206.12) | 293.65 (209.46) |
| Semester GPA | |||
| 0.01–2.0 GPA Population (Column %) | 3535 (13) | 1102 (9) | 2433 (15) |
| 2.01–3.0 GPA Population (Column %) | 9198 (33) | 3421 (29) | 5777 (37) |
| 3.01–4.0 GPA Population (Column %) | 15,082 (54) | 7509 (62) | 7573 (48) |
| Number of Dining Hall Visits per Semester Mean (Standard Deviation) | 44.94 (27.93) | 48.24 (27.69) | 42.3 (27.86) |
| Number of Recreation Center Visits Per Semester Mean (Standard Deviation) | 17.72 (30.7) | 12.21 (22.46) | 22.12 (35.35) |
| Variables | Female | Male |
|---|---|---|
| Age | −0.0104 ** | 0.1297 ** |
| Race/ Ethnicity | ||
| African American | −0.0302 ** | −0.0204 * |
| Asian/Pacific Islander | 0.0123 | 0.0897 ** |
| Hispanic | 0.0149 | 0.0514 ** |
| Other | −0.0204 * | −0.0356 * |
| International | 0.0079 | −0.324 ** |
| Low Income | −0.0097 * | −0.0246 ** |
| Money Spent on Fast Food (Declining Balance Dollars) per Semester (hundreds of dollars) | −0.0106 ** | −0.0114 ** |
| Semester GPA | 0.0253 ** | 0.1098 ** |
| Number of Dining Hall Visits per Semester | 0.0014 ** | 0.0067 ** |
| Number of Recreational Facility Visits per Semester (per 10 visits) | −0.00208 * | 0.0022 * |
Publisher’s Note: MDPI stays neutral with regard to jurisdictional claims in published maps and institutional affiliations. |
© 2022 by the authors. Licensee MDPI, Basel, Switzerland. This article is an open access article distributed under the terms and conditions of the Creative Commons Attribution (CC BY) license (https://creativecommons.org/licenses/by/4.0/).
Share and Cite
Racine, E.F.; Schorno, R.; Gholizadeh, S.; Bably, M.B.; Hatami, F.; Stephens, C.; Zadrozny, W.; Schulkind, L.; Paul, R. A College Fast-Food Environment and Student Food and Beverage Choices: Developing an Integrated Database to Examine Food and Beverage Purchasing Choices among College Students. Nutrients 2022, 14, 900. https://doi.org/10.3390/nu14040900
Racine EF, Schorno R, Gholizadeh S, Bably MB, Hatami F, Stephens C, Zadrozny W, Schulkind L, Paul R. A College Fast-Food Environment and Student Food and Beverage Choices: Developing an Integrated Database to Examine Food and Beverage Purchasing Choices among College Students. Nutrients. 2022; 14(4):900. https://doi.org/10.3390/nu14040900
Chicago/Turabian StyleRacine, Elizabeth F., Rachel Schorno, Shafie Gholizadeh, Morium Barakat Bably, Faizeh Hatami, Casey Stephens, Wlodek Zadrozny, Lisa Schulkind, and Rajib Paul. 2022. "A College Fast-Food Environment and Student Food and Beverage Choices: Developing an Integrated Database to Examine Food and Beverage Purchasing Choices among College Students" Nutrients 14, no. 4: 900. https://doi.org/10.3390/nu14040900