
Effectiveness of “Moro” Blood Orange Citrus sinensis Osbeck (Rutaceae) Standardized Extract on Weight Loss in Overweight but Otherwise Healthy Men and Women—A Randomized Double-Blind Placebo-Controlled Study


Abstract
:1. Introduction
2. Materials and Methods
2.1. Clinical Trial Design, Registration and Ethical Approval
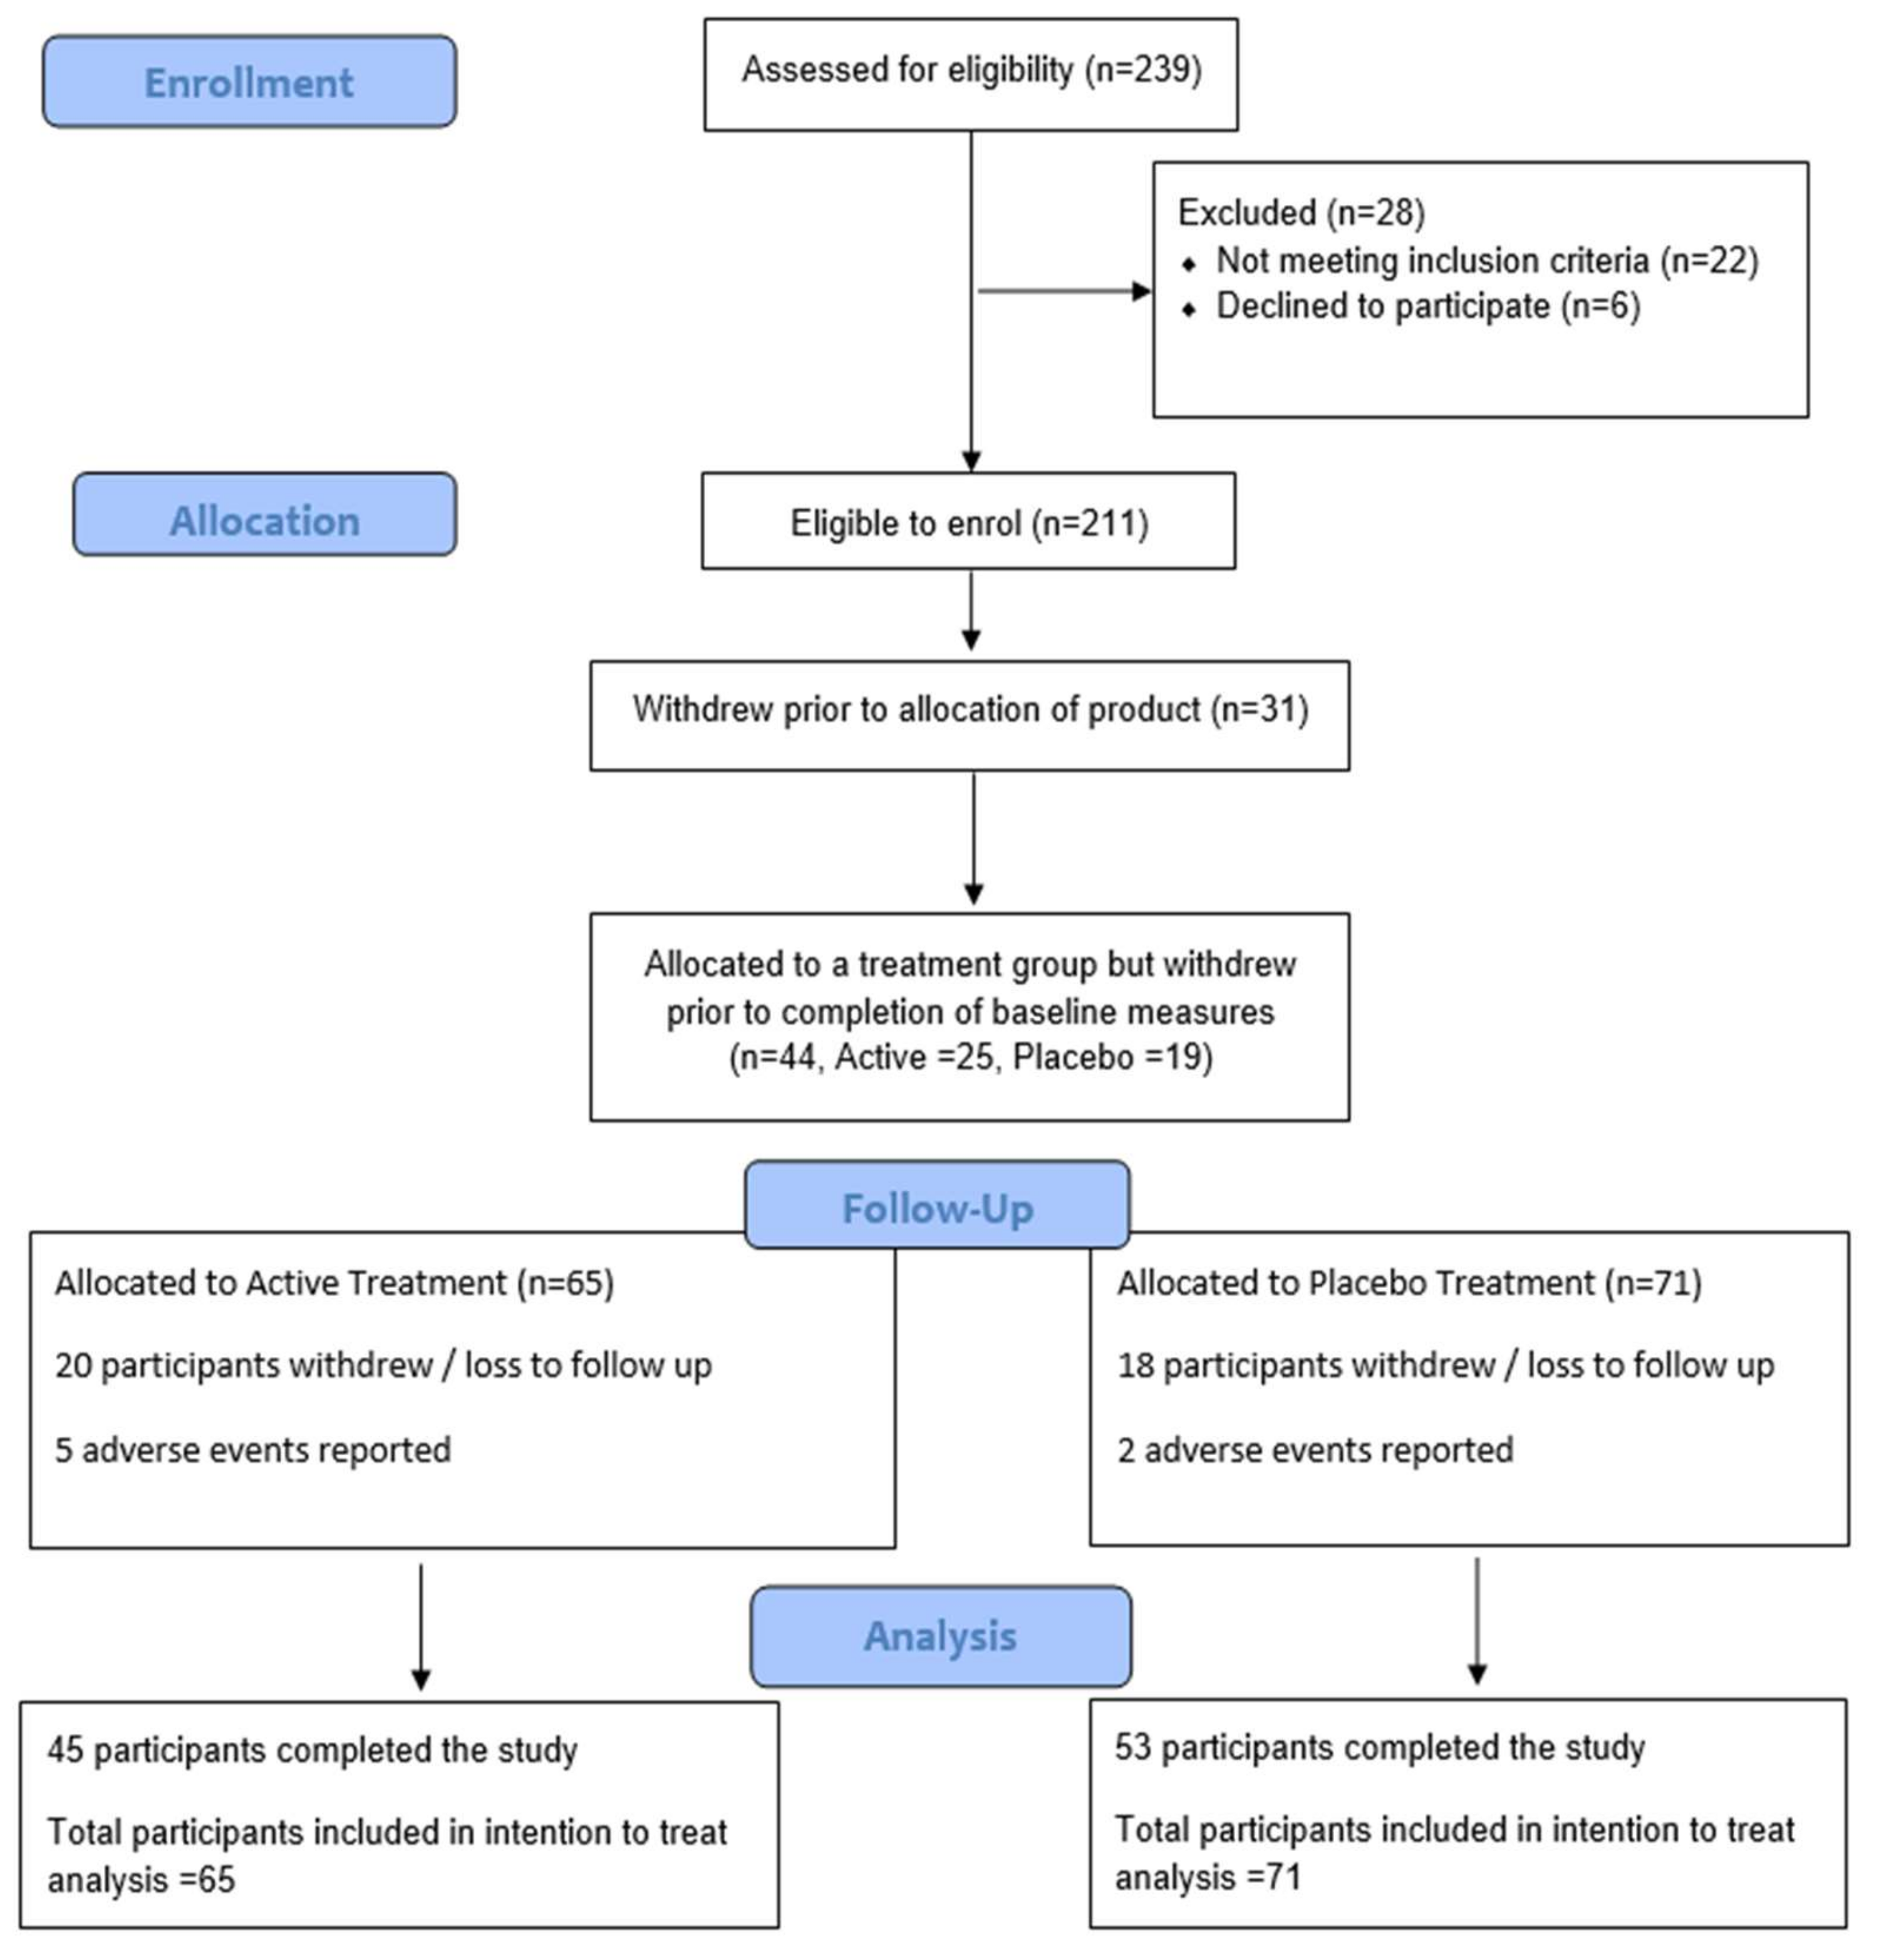
2.2. Trial Participants
2.3. Extract Specification and Trial Product
2.4. Trial Description (Intervention and Study Procedures)
2.5. Randomisation and Blinding
2.6. Outcome Measurements
2.7. Statistical Analysis
3. Results
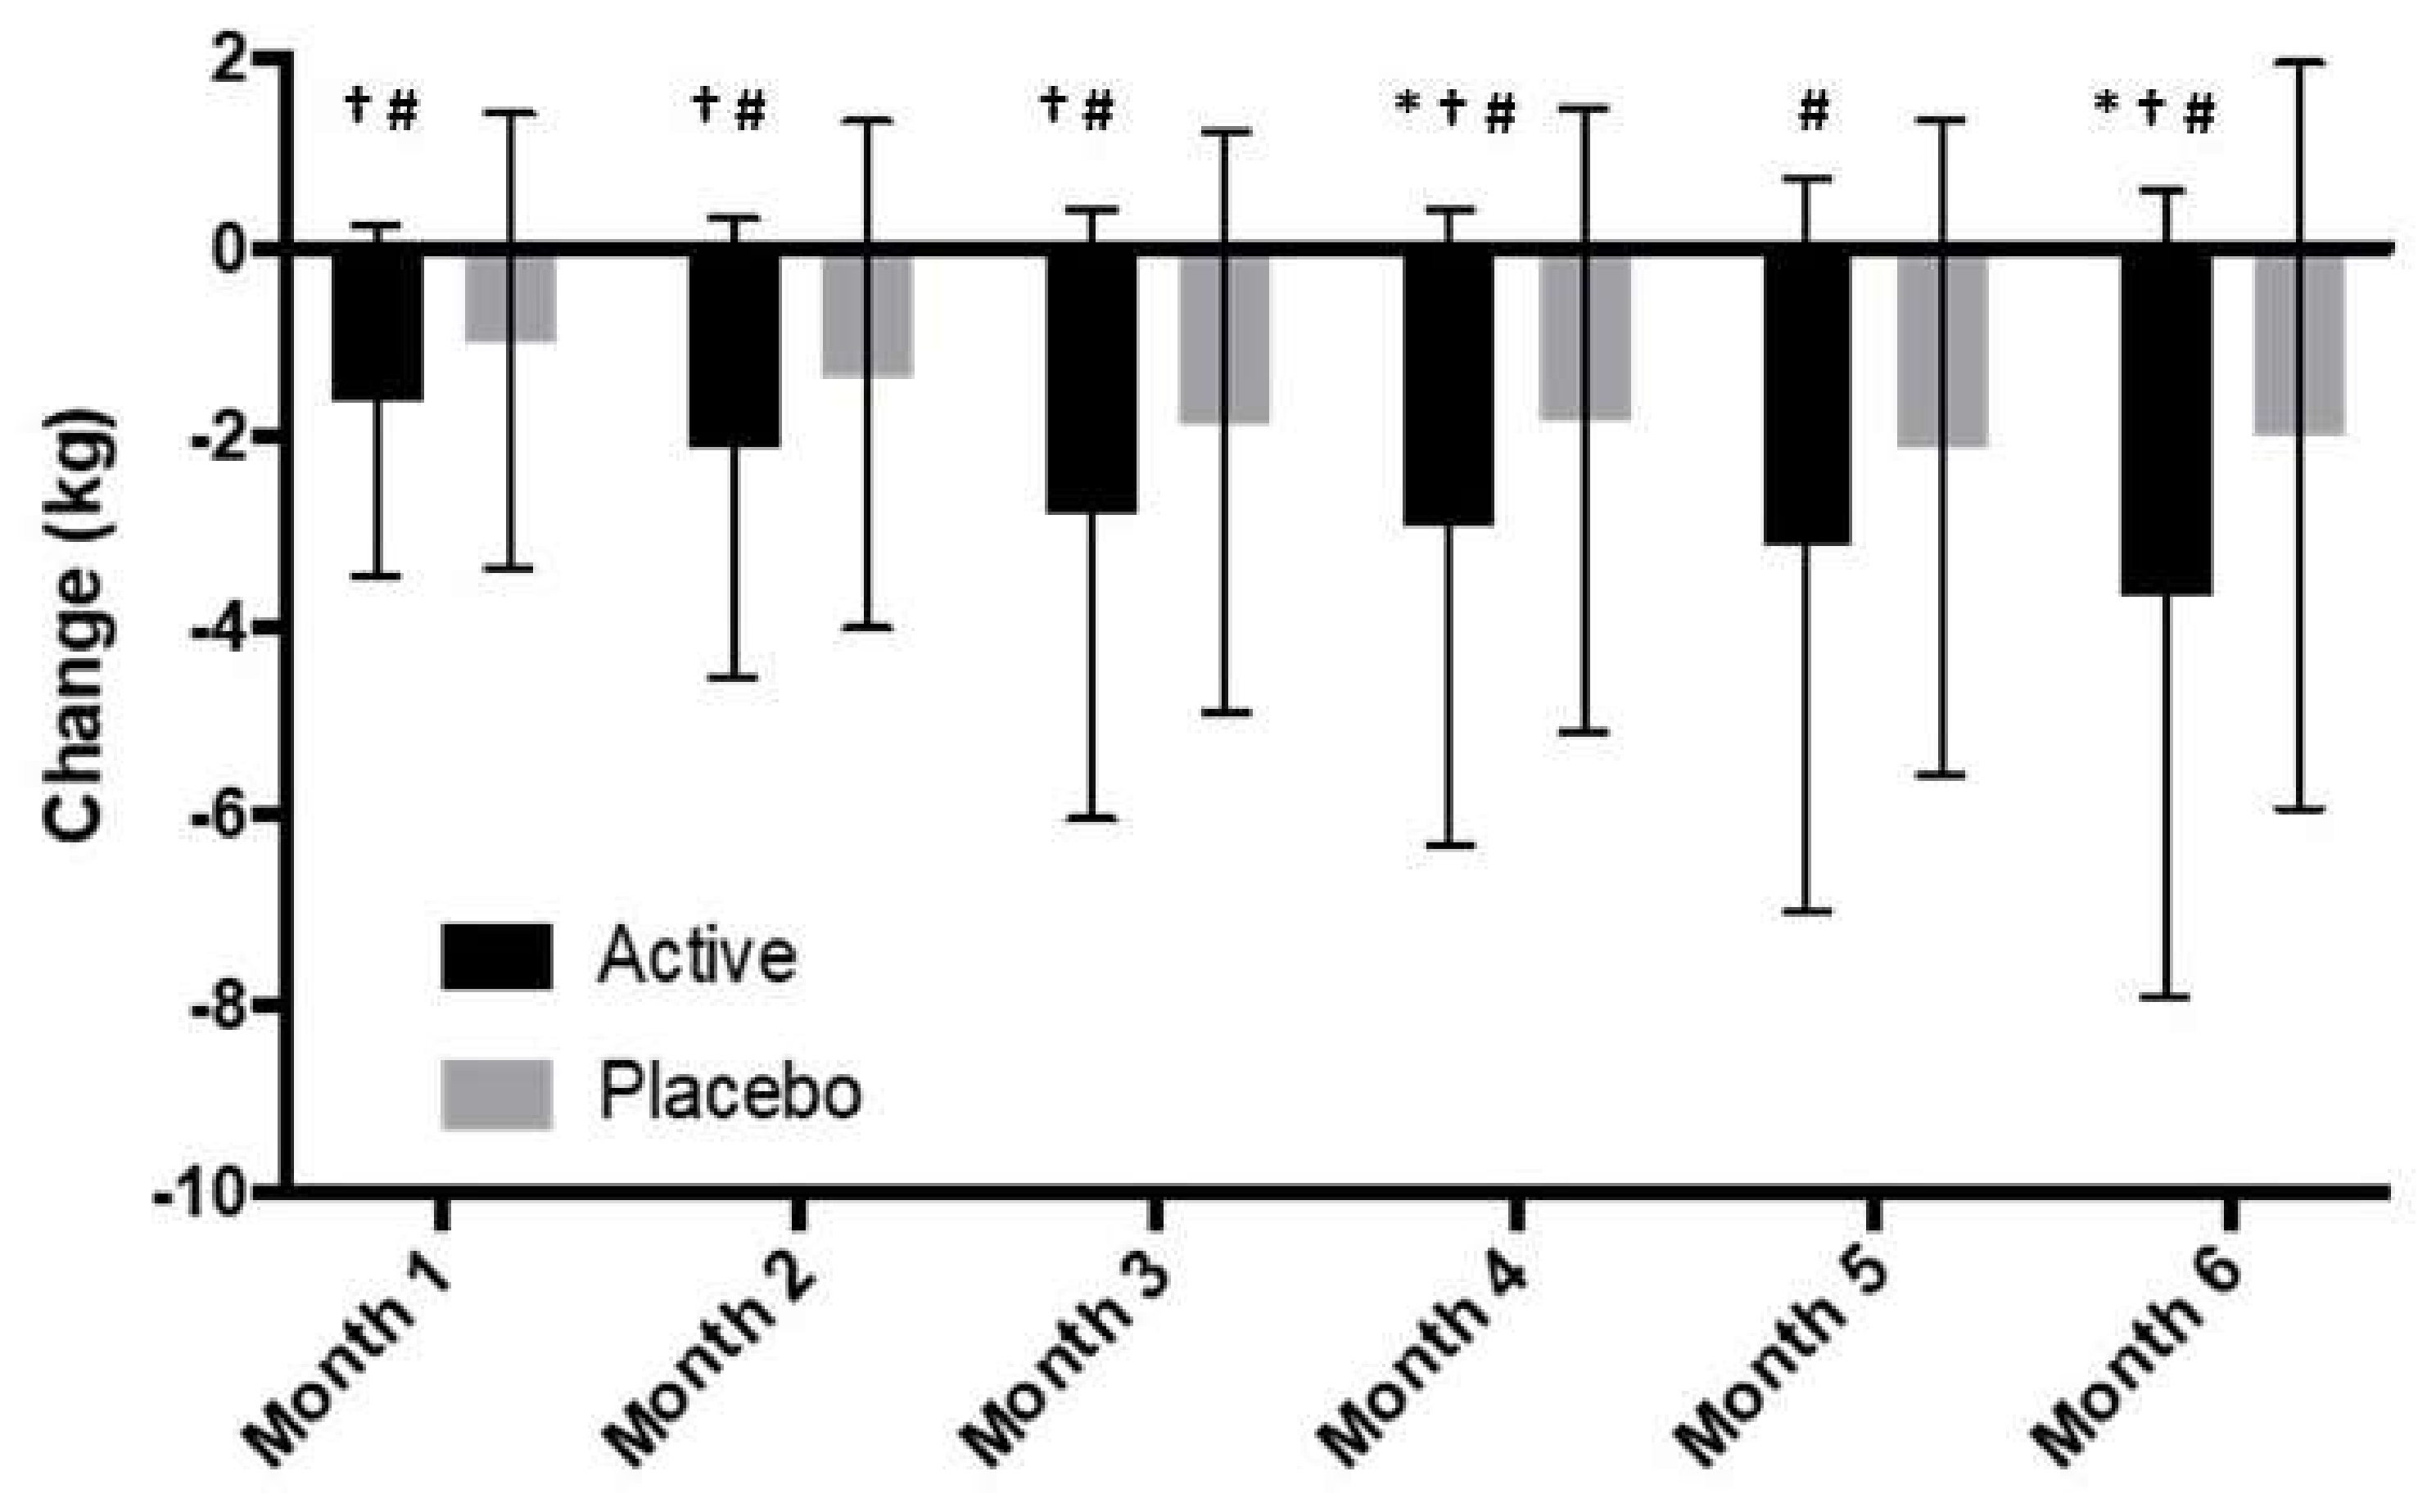
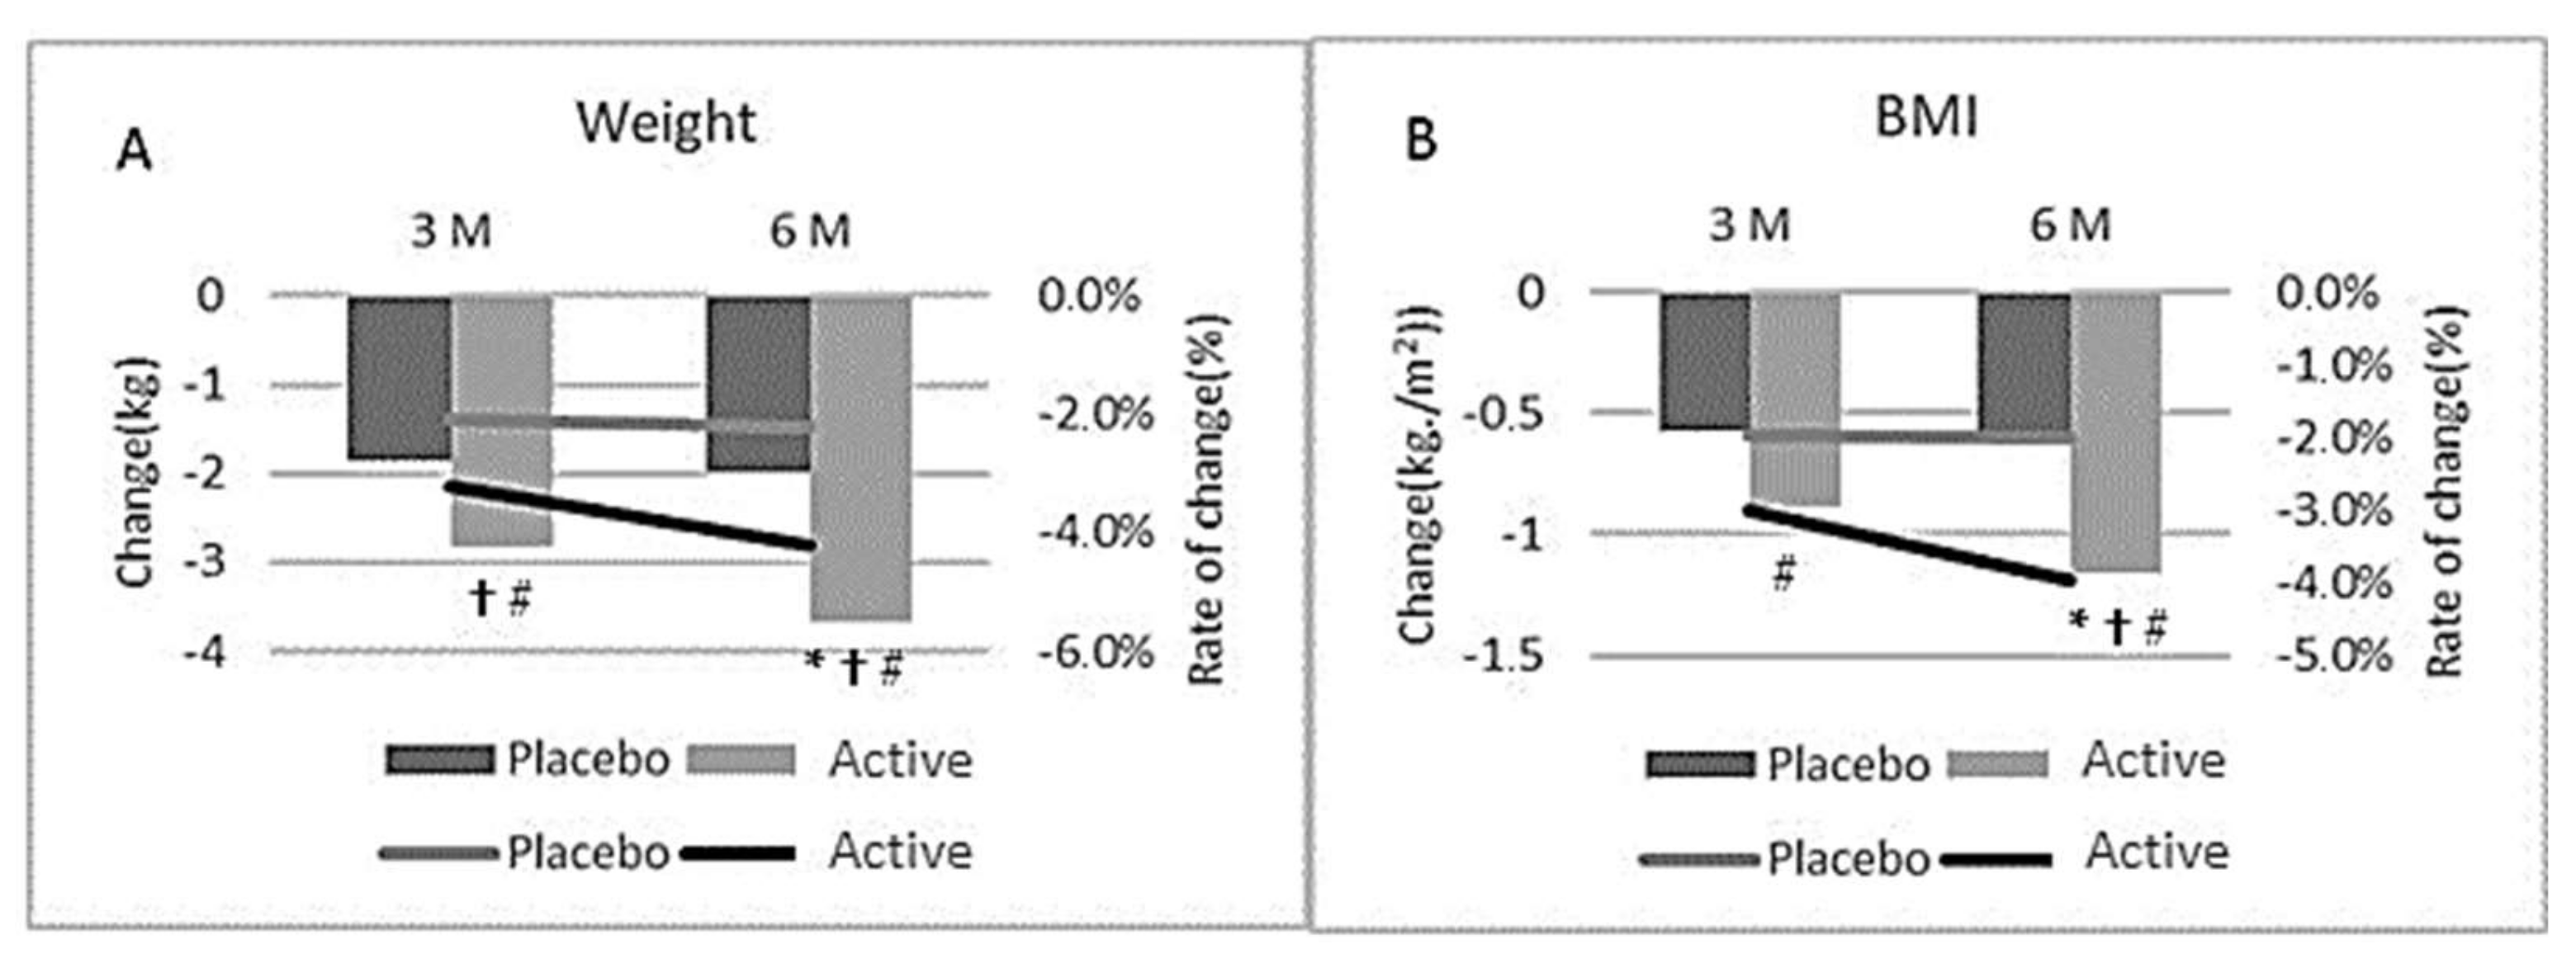
3.1. Body Weight
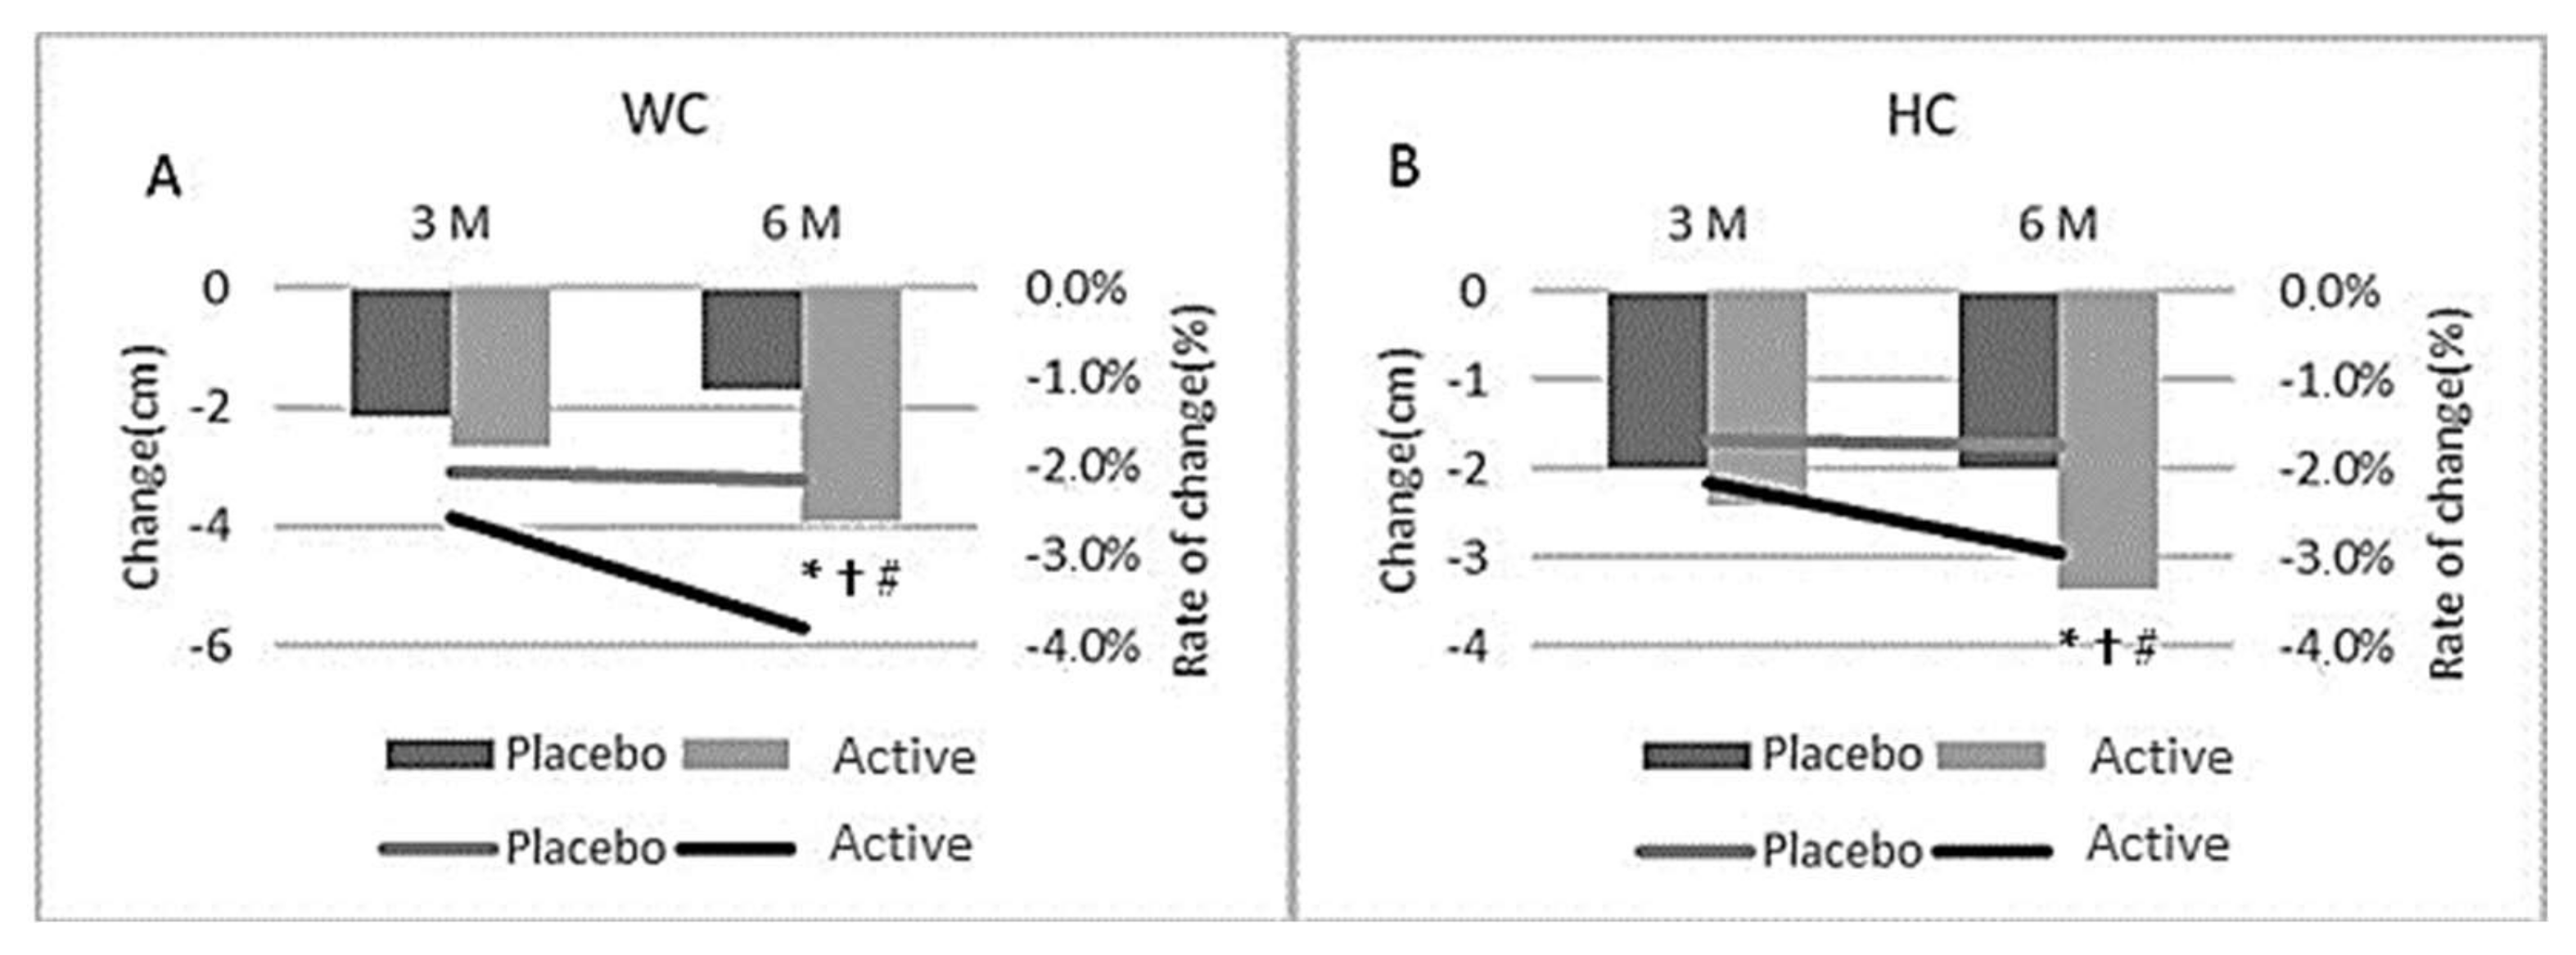
3.2. Hip and Waist Circumference
3.3. BMI
3.4. Pathology Data
3.4.1. Satiety Hormones
3.4.2. Cardiometabolic Parameters
3.4.3. Safety Data
3.4.4. Fatigue
3.5. Dietary Intake and Physical Activity
3.6. Age and Gender Variations
3.7. Adverse Event Reporting
3.8. Sub-Group Analysis
4. Discussion
5. Conclusions
Supplementary Materials
Author Contributions
Funding
Institutional Review Board Statement
Informed Consent Statement
Data Availability Statement
Acknowledgments
Conflicts of Interest
References
- World Health Organisation. Obesity and Overweight. Available online: www.who.int/news-room/fact-sheets/detail/obesity-and-overweight (accessed on 1 April 2020).
- Shang, A.; Gan, R.Y.; Xu, X.Y.; Mao, Q.Q.; Zhang, P.Z.; Li, H.B. Effects and mechanisms of edible and medicinal plants on obesiy: An updated review. Crit. Rev. Food Sci. Nutr. 2021, 61, 2061–2077. [Google Scholar] [CrossRef] [PubMed]
- De Freitas Junior, L.M.; de Almeida, E.B., Jr. Medicinal plants for the treatment of obesity: Ethnopharmacological approach and chemical and biological studies. Am. J. Transl. Res. 2017, 9, 2050–2064. [Google Scholar]
- Mopuri, R.; Islam, M.S. Medicinal plants and phytochemicals with anti-obesogenic potentials: A review. Biomed. Pharmacother. 2017, 89, 1442–1452. [Google Scholar] [CrossRef]
- Luo, S.; Lenon, G.B.; Gill, H.; Yuen, H.; Yang, A.; Hung, A.; Nguyen, L.T. Do the Natural Chemical Compounds Interact with the Same Targets of Current Pharmacotherapy for Weight Management?—A Review. Curr. Drug Targets 2019, 20, 399–411. [Google Scholar] [CrossRef] [PubMed]
- Mondello, L.; Cotroneo, A.; Errante, G.; Dugo, G.; Dugo, P. Determination of anthocyanins in blood orange juices by HPLC analysis. J. Pharm. Biomed. Anal. 2000, 23, 191–195. [Google Scholar] [CrossRef]
- Lee, B.; Lee, M.; Lefevre, M.; Kim, H.R. Anthocyanins inhibit lipogenesis during adipocyte differentiation of 3T3-L1 preadipocytes. Plant Foods Hum. Nutr. 2014, 69, 137–141. [Google Scholar] [CrossRef]
- Tsuda, T.; Ueno, Y.; Yoshikawa, T.; Kojo, H.; Osawa, T. Microarray profiling of gene expression in human adipocytes in response to anthocyanins. Biochem. Pharmacol. 2006, 71, 1184–1197. [Google Scholar] [CrossRef] [PubMed]
- Tsuda, T. Regulation of Adipocyte Function by Anthocyanins; Possibility of Preventing the Metabolic Syndrome. J. Agric. Food Chem. 2008, 56, 642–646. [Google Scholar] [CrossRef]
- Park, J.; Kim, H.L.; Jung, Y.; Ahn, K.S.; Kwak, H.J.; Um, J.Y. Bitter Orange (Citrus aurantium Linné) Improves Obesity by Regulating Adipogenesis and Thermogenesis through AMPK Activation. Nutrients 2019, 11, 1988. [Google Scholar] [CrossRef] [Green Version]
- Ballistreri, G.; Amenta, M.; Fabroni, S.; Consoli, V.; Grosso, S.; Vanella, L.; Sorrenti, V.; Rapisarda, P. Evaluation of lipid and cholesterol-lowering effect of bioflavonoids from bergamot extract. Nat. Prod. Res. advance online publication. 2020. [Google Scholar] [CrossRef]
- Lo Furno, D.; Graziano, A.C.; Avola, R.; Giuffrida, R.; Perciavalle, V.; Bonina, F.; Mannino, G.; Cardile, V. A Citrus bergamia Extract Decreases Adipogenesis and Increases Lipolysis by Modulating PPAR Levels in Mesenchymal Stem Cells from Human Adipose Tissue. PPAR Res. 2016, 2016, 4563815. [Google Scholar] [CrossRef] [PubMed] [Green Version]
- Karn, A.; Zhao, C.; Yang, F.; Cui, J.; Gao, Z.; Wang, M.; Wang, F.; Xiao, H.; Zheng, J. In-vivo biotransformation of citrus functional components and their effects on health. Crit. Rev. Food Sci. Nutr. 2021, 61, 756–776. [Google Scholar] [CrossRef]
- Ahmed, O.M.; AbouZid, S.F.; Ahmed, N.A.; Zaky, M.Y.; Liu, H. An Up-to-Date Review on Citrus Flavonoids: Chemistry and Benefits in Health and Diseases. Curr. Pharm. Des. 2021, 27, 513–530. [Google Scholar] [CrossRef] [PubMed]
- Fallico, B.; Ballistreri, G.; Arena, E.; Brighina, S.; Rapisarda, P. Bioactive compounds in blood oranges (Citrus sinensis (L.) Osbeck): Level and intake. Food Chem. 2017, 215, 67–75. [Google Scholar] [CrossRef]
- Kelebek, H.; Canbas, A.; Selli, S. Determination of phenolic composition and antioxidant capacity of blood orange juices obtained from cvs. Moro and Sanguinello (Citrus sinensis (L.) Osbeck) grown in Turkey. Food Chem. 2008, 107, 1710–1716. [Google Scholar] [CrossRef]
- Fabroni, A.S.; Ballistreri, G.; Amenta, M.; Rapisarda, P. Anthocyanins in different citrus species: An UHPLC-PDA-ESI/MSn-assisted qualitative and quantitative investigation. J. Sci. Food Agric. 2016, 96, 4797–4808. [Google Scholar] [CrossRef]
- Legua, P.; Modica, G.; Porras, I.; Conesa, A.; Continella, A. Bioactive compounds, antioxidant activity and fruit quality evaluation of eleven blood orange cultivars. J. Sci. Food Agric. 2021. [Google Scholar] [CrossRef]
- Giuffrè, A.M.; Zappia, C.; Capocasale, M. Physicochemical stability of blood orange juice during frozen storage. Int. J. Food Prop. 2017, 20, 1930–1943. [Google Scholar]
- Cardile, A.; Graziano, A.C.E.; Venditti, A. Clinical evaluation of Moro (Citrus sinensis (L.) Osbeck) orange juice supplementation for the weight management. Nat. Prod. Res. 2015, 29, 2256–2260. [Google Scholar] [CrossRef] [Green Version]
- Grosso, G.; Galvano, F.; Mistretta, A.; Marventano, S.; Nolfo, F.; Calabrese, G.; Buscemi, S.; Drago, F.; Veronesi, U.; Scuderi, A. Red Orange: Experimental Models and Epidemiological Evidence of Its Benefits on Human Health. Oxidative Med. Cell. Longev. 2013, 2013, 157240. [Google Scholar] [CrossRef]
- Buscemi, S.; Rosafio, G.; Arcoleo, G.; Mattina, A.; Canino, B.; Montana, M.; Verga, S.; Rini, G. Effects of red orange juice intake on endothelial function and inflammatory markers in adult subjects with increased cardiovascular risk. Am. J. Clin. Nutr. 2012, 95, 1089–1095. [Google Scholar] [CrossRef] [PubMed]
- Magalhães, M.; Lima, L.C.; Lunguinho, A.D.; Rezende, D.A.; Ferreira, V.R.; Brandão, R.M.; Souza, J.A.; Souza, É.D.; Almeida, K.J.; Nelson, D.; et al. Influence of Cold Storage on the Bioactivity Properties and the Quality of the Juice of Moro Blood Orange (Citrus sinensis (L.) Osbeck). Am. J. Plant Sci. 2019, 10, 24–37. [Google Scholar] [CrossRef] [Green Version]
- Magalhães, M.L.; de Sousa, R.V.; Miranda, J.R.; Konig, I.; Wouters, F.; Souza, F.R.; Simão, S.D.; da Silva Lunguinho, A.; Nelson, D.L.; das Graças Cardoso, M. Effects of Moro orange juice (Citrus sinensis (L.) Osbeck) on some metabolic and morphological parameters in obese and diabetic rats. J. Sci. Food Agric. 2021, 101, 1053–1064. [Google Scholar] [CrossRef] [PubMed]
- Ribeiro, A.; Pereira, A.G.; Todo, M.C.; Fujimori, A.; Dos Santos, P.P.; Dantas, D.; Fernandes, A.A.; Zanati, S.G.; Hassimotto, N.; Zornoff, L.; et al. Pera orange (Citrus sinensis) and Moro orange (Citrus sinensis (L.) Osbeck) juices attenuate left ventricular dysfunction and oxidative stress and improve myocardial energy metabolism in acute doxorubicin-induced cardiotoxicity in rats. Nutrition 2021, 91–92, 111350. [Google Scholar] [CrossRef]
- Tomasello, B.; Malfa, G.A.; La Mantia, A.; Miceli, N.; Sferrazzo, G.; Taviano, M.F.; Di Giacomo, C.; Renis, M.; Acquaviva, R. Anti-adipogenic and anti-oxidant effects of a standardised extract of Moro blood oranges (Citrus sinensis (L.) Osbeck) during adipocyte differentiation of 3T3-L1 preadipocytes. ), Nat. Prod. Res. 2021, 35, 2660–2667. [Google Scholar]
- Salamone, F.; Li Volti, G.; Titta, L.; Puzzo, L.; Barbagallo, I.; La Delia, F.; Zelber-Sagi, S.; Malaguarnera, M.; Pelicci, P.G.; Giorgio, M.; et al. Moro orange juice prevents fatty liver in mice. World J. Gastroenterol. 2012, 18, 3862–3868. [Google Scholar] [CrossRef] [PubMed]
- Titta, L.; Trinei, M.; Stendardo, M.; Berniakovich, I.; Petroni, K.; Tonelli, C.; Riso, P.; Porrini, M.; Minucci, S.; Pelicci, P.G.; et al. Blood orange juice inhibits fat accumulation in mice. Int. J. Obes. 2010, 34, 578–588. [Google Scholar] [CrossRef] [PubMed] [Green Version]
- Rupasinghe, H.P.V.; Sekhon-Loodu, S.; Mantso, T.; Panayiotidis, M.I. Phytochemicals in regulating fatty acid β-oxidation: Potential underlying mechanisms and their involvement in obesity and weight loss. Pharmacol. Ther. 2016, 165, 153–163. [Google Scholar] [CrossRef] [PubMed]
- De Lima, L.P.; de Paula Barbosa, A. A review of the lipolytic effects and the reduction of abdominal fat from bioactive compounds and moro orange extracts. Heliyon 2021, 7, e07695. [Google Scholar] [CrossRef] [PubMed]
- Zhang, Q.; de Mejia, E.G. Protocatechuic acid attenuates adipogenesis-induced inflammation and mitochondrial dysfunction in 3T3-L1 adipocytes by regulation of AMPK pathway. J. Funct. Foods 2020, 69, 103972. [Google Scholar] [CrossRef]
- Tielemans, M.M.; Jaspers Focks, J.; van Rossum, L.G.; Eikendal, T.; Jansen, J.B.; Laheij, R.J.; van Oijen, M.G. Gastrointestinal symptoms are still prevalent and negatively impact health-related quality of life: A large cross-sectional population based study in The Netherlands. PLoS ONE 2013, 8, e69876. [Google Scholar]


| Active (n = 65) | Placebo (n = 71) | |
|---|---|---|
| Female (n) | 50 | 49 |
| Male (n) | 15 | 22 |
| Age (years) | 52.9 ± 8.4 | 51.9 ± 10.2 |
| Asian Heritage (n) ^ | 8 | 8 |
| Systolic Blood pressure (mmHg) | 126 ± 16.2 | 128 ± 13.8 |
| Diastolic Blood pressure (mmHg) | 84.8 ± 10.3 | 83.8 ± 9.3 |
| Resting heart rate (BPM) | 69.9 ± 9 | 67.6 ± 9 |
| BMI (Range) | 25–32.9 m/h2 | 25–33.1 m/h2 |
| Active | Placebo | |||||
|---|---|---|---|---|---|---|
| Baseline | Month 3 | Month 6 | Baseline | Month 3 | Month 6 | |
| WC (cm) | 101.1 ± 9.9 | 98.5 ± 10.5 # | 97.2 ± 10.7 *# | 103.4 ± 11.0 | 101.3 ± 11.4 # | 101.7 ± 11.7 # |
| HC (cm) | 113.4 ± 6.9 | 111.0 ± 7.5 # | 110.1 ± 7.5 *# | 115.6 ± 7.2 | 113.6 ± 6.7 # | 113.5 ± 7.2 # |
| Weight (kg) | 88.4 ± 11.2 | 85.5 ± 11.5 # | 84.7 ± 11.7 *# | 90.8 ± 13.8 | 89.0 ± 14.1 # | 88.8 ± 14.5 # |
| Weight loss (%) | −3.2 ± 3.7 # | −4.2 ± 5.0 *# | −2.1 ± 3.3 | −2.2 ± 4.2 # | ||
| BMI (kg/m2) | 29.5 ± 1.6 | 28.6 ± 2.0 # | 28.3 ± 2.2 *# | 29.4 ± 1.4 | 28.9 ± 1.7 # | 28.8 ± 1.9 # |
| Lean Mass (kg) | 54.0 ± 11.3 | 52.5 ± 10.1 | 52.4 ± 10.2 # | 56.1 ± 13.0 | 55.4 ± 12.8 | 55.6 ± 13.2 # |
| FM (kg) | 32.1 ± 7.2 | 30.6 ± 6.4 *# | 29.7 ± 6.7 *# | 33.1 ± 7.5 | 31.8 ± 8.0 # | 31.2 ± 8.2 # |
| FM Arm (kg) | 3.9 ± 1.1 | 3.7 ± 0.9 | 3.6 ± 0.9 # | 3.7 ± 1.0 | 3.6 ± 1.0 | 3.5 ± 1.0 # |
| FM Leg (kg) | 11.9 ± 3.3 | 11.4 ± 3.2 | 11.4 ± 3.8 # | 12.2 ± 3.8 | 11.5 ± 4.0 | 11.3 ± 3.6 # |
| FM abdominal (trunk) (kg) | 15.9 ± 3.3 | 14.6 ± 3.5 *# | 14.1 ± 3.5 *# | 16.3 ± 4.1 | 15.6 ± 4.4 # | 15.3 ± 4.4 # |
| Android Fat (kg) | 3.6 ± 1.8 | 2.7 ± 1.0 # | 2.6 ± 1.0 # | 4.0 ± 2.1 | 3.1 ± 1.4 | 3.0 ± 1.4 # |
| Gynoid Fat (kg) | 7.0 ± 3.8 | 5.2 ± 1.5 # | 5.1 ± 1.5 # | 7.7 ± 4.0 | 5.9 ± 2.8 # | 5.9 ± 2.8 # |
| Visceral Fat (g) | 632.9 ± 223.5 | 588.6 ± 245.3 # | 554.2 ± 232.4 *# | 632.8 ± 249.6 | 581.5 ± 256.6 # | 575.8 ± 254.9 # |
| Visceral Fat Area (cm2) | 131.4 ± 46.4 | 122.0 ± 51.0 | 115.6 ± 47.4 # | 131.5 ± 52.0 | 120.1 ± 53.1 | 118.6 ± 52.6 # |
| Subcutaneous Fat (kg) | 15.2 ± 3.1 | 14.0 ± 3.4 # | 13.5 ± 3.4 *# | 15.7 ± 3.9 | 15.0 ± 4.2 # | 14.7 ± 4.3 # |
| Active | Placebo | |||||
|---|---|---|---|---|---|---|
| Baseline | Month 3 | Month 6 | Baseline | Month 3 | Month 6 | |
| ALT (U/L) | 25.9 ± 15.6 | 20.9 ± 7.9 | 23.3 ± 9.1 | 25.9 ± 11.5 | 23.6 ± 10.6 | 24.7 ± 10.0 |
| AST (U/L) | 23.7 ± 7.2 | 23.4 ± 8.2 | 25.8 ± 9.1 | 22.2 ± 9.8 | 22.3 ± 8.9 | 23.1 ± 10.4 |
| GGT (U/L) | 29.7 ± 15.3 | 26.3 ± 14.7 | 24.3 ± 13.9 | 36.4 ± 25.7 | 33.1 ± 28.2 | 32.7 ± 28.3 |
| TBIL (umol/L) | 11.9 ± 4.5 | 11.9 ± 4.7 | 12.3 ± 5.6 | 11.7 ± 5.0 | 11.1 ± 4.8 | 11.0 ± 3.9 |
| Cholesterol (umol/L) | 5.8 ± 1.1 | 5.7 ± 1.1 | 5.7 ± 1.2 | 5.8 ± 1.2 | 5.6 ± 1.1 | 5.7 ± 1.1 |
| HDL (mmol/L) | 1.8 ± 0.4 | 1.8 ± 0.5 | 1.9 ± 0.6 | 1.7 ± 0.5 | 1.6 ± 0.5 | 1.7 ± 0.4 |
| LDL (pg/mL) | 3.6 ± 0.9 | 3.5 ± 0.9 | 3.5 ± 0.9 | 3.7 ± 1.0 | 3.5 ± 1.0 | 3.5 ± 0.8 |
| TRI (mmol/L) | 1.0 ± 0.4 | 1.0 ± 0.5 | 1.1 ± 0.7 | 1.4 ± 0.7 | 1.3 ± 0.7 | 1.3 ± 0.7 |
| Glucose (mmol/L) | 5.6 ± 1.0 | 5.6 ± 0.8 | 5.5 ± 0.9 | 5.6 ± 1.0 | 5.6 ± 0.8 | 5.7 ± 0.8 |
| Insulin (mU/L) | 12.2 ± 8.1 | 13.0 ± 9.9 | 11.4 ± 7.9 | 11.2 ± 6.6 | 12.0 ± 7.8 | 12.7 ± 8.4 |
| Creatine (umol/L) | 92.4 ± 11.8 | 96.4 ± 21.8 | 94.0 ± 13.3 | 90.9 ± 18.1 | 94.2 ± 15.4 | 93.2 ± 14.6 |
| Ghrelin (ng/mL) | 0.41 ± 0.32 | 0.47 ± 0.51 | 0.49 ± 0.47 | 0.40 ± 0.36 | 0.39 ± 0.34 | 0.40 ± 0.38 |
| Leptin (ng/mL) | 5.71 ± 5.13 | 5.10 ± 5.72 | 5.51 ±7.11 | 4.77 ±4.10 | 4.06 ± 3.50 | 3.9 ±3.64 |
| Adiponectin (ug/mL) | 6.26 ± 3.77 | 6.43 ± 4.11 | 6.35 ± 3.62 | 5.22 ± 3.59 | 5.21 ± 3.50 | 5.54 ± 3.83 |
| Active (n = 48) | Placebo (n = 54) | |
|---|---|---|
| Female (n) | 41 | 40 |
| Male (n) | 7 | 14 |
| Age (years) | 53.1 ± 7.5 | 52.0 ± 10.1 |
| Asian Heritage (n) | 7 | 8 |
| Systolic Blood pressure (mmHg) | 126 ± 16.2 | 124.2 ± 16.4 |
| Diastolic Blood pressure (mmHg) | 84.8 ± 10.3 | 83.8 ± 9.8 |
| Resting heart rate (BPM) | 69.9 ± 9 | 69.9 ± 9.3 |
| Active | Placebo | |||||
|---|---|---|---|---|---|---|
| Baseline | Month 3 | Month 6 | Baseline | Month 3 | Month 6 | |
| WC (cm) | 98.6 ± 9.0 | 96.1± 9.7 # | 95.0 ± 10.2 *#† | 101.8 ± 11.1 | 99.4 ± 11.1 # | 99.8 ± 11.2# |
| HC (cm) | 112.8 ± 7.2 | 110.5 ± 8.0 # | 109.7 ± 8.1 *#† | 114.7 ± 7.3 | 112.6 ± 6.8# | 112.5 ± 7.05 # |
| Weight (kg) | 85.5 ± 10.3 | 82.7 ± 10.5 *#† | 81.9 ± 10.9 *#† | 87.8 ± 13.4 | 86.1 ± 14.0 # | 85.83 ± 14.02 # |
| Weight loss (%) | −3.3 ± 3.7 #† | −4.2 ± 5.2 #*† | −2.1 ± 3.4 | −2.3 ± 4.0 # | ||
| BMI (kg/m2) | 28.8 ± 1.4 | 28.0 ± 1.8 #† | 27.7 ± 2.1 *#† | 28.9 ± 1.2 | 28.4 ± 1.6 # | 28.3 ± 1.7 # |
| Lean Mass (kg) | 51.0 ± 9.1 | 50.0 ± 8.0 | 50.1 ± 8.3 | 52.9 ± 11.6 | 52.7 ± 11.6 | 52.8 ± 11.7 |
| FM (kg) | 32.5 ± 6.3 | 30.6 + 6.7 # | 29.9 ± 7.0 # | 33.2 ± 8.0 | 31.5 ± 8.3 # | 31.0 ± 8.5 # |
| FM Arm (kg) | 3.9 ± 1.2 | 3.7 ± 0.9 | 3.7 ± 1.0 | 3.8 ± 1.0 | 3.6 ± 1.0 | 3.6 ± 1.0 |
| FM Leg (kg) | 12.2 ± 3.2 | 11.7 ± 3.1 | 11.8 ± 3.9 # | 12.4 ± 3.9 | 11.4 ± 4.0 | 11.4 ± 3.7 # |
| FM abdominal (trunk) (kg) | 15.6 ± 3.5 | 14.4 ± 3.8 # | 14.0 ± 3.8 *#† | 16.2 ± 4.5 | 15.3 ± 4.6 # | 15.1 ± 4.6 # |
| Android Fat (kg) | 3.6 ± 2.0 | 2.6 ± 1.1 # | 2.5 ± 1.0 # | 3.8 ± 2.0 | 3.1 ± 1.5 | 3.0 ± 1.5 # |
| Gynoid Fat (kg) | 7.3 ± 3.8 | 5.4 ± 1.5 # | 5.3 ± 1.6 # | 7.5 ± 3.7 | 6.1 ± 3.0 # | 6.1 ± 3.0 # |
| Visceral Fat (g) | 662.2 ± 207.6 | 641.6 ± 234.8 # | 596.0 ± 229.8 *#† | 686.3 ± 251.2 | 637.1 ± 261.4 | 628.9 ± 260.1 # |
| Visceral Fat Area (cm2) | 125.1 ± 41.6 | 116.3 ± 49.4 | 107.6 ± 43.6 | 124.7 ± 51.0 | 112.4 ± 47.9 | 111.4 ± 47.1 |
| Subcutaneous Fat (kg) | 14.9 ± 3.4 | 13.8 ± 3.6 #† | 13.5 ± 3.6 *#† | 15.6 ± 4.3 | 14.8 ± 4.5 | 14.6 ± 4.5 # |
Publisher’s Note: MDPI stays neutral with regard to jurisdictional claims in published maps and institutional affiliations. |
© 2022 by the authors. Licensee MDPI, Basel, Switzerland. This article is an open access article distributed under the terms and conditions of the Creative Commons Attribution (CC BY) license (https://creativecommons.org/licenses/by/4.0/).
Share and Cite
Briskey, D.; Malfa, G.A.; Rao, A. Effectiveness of “Moro” Blood Orange Citrus sinensis Osbeck (Rutaceae) Standardized Extract on Weight Loss in Overweight but Otherwise Healthy Men and Women—A Randomized Double-Blind Placebo-Controlled Study. Nutrients 2022, 14, 427. https://doi.org/10.3390/nu14030427
Briskey D, Malfa GA, Rao A. Effectiveness of “Moro” Blood Orange Citrus sinensis Osbeck (Rutaceae) Standardized Extract on Weight Loss in Overweight but Otherwise Healthy Men and Women—A Randomized Double-Blind Placebo-Controlled Study. Nutrients. 2022; 14(3):427. https://doi.org/10.3390/nu14030427
Chicago/Turabian StyleBriskey, David, Giuseppe Antonio Malfa, and Amanda Rao. 2022. "Effectiveness of “Moro” Blood Orange Citrus sinensis Osbeck (Rutaceae) Standardized Extract on Weight Loss in Overweight but Otherwise Healthy Men and Women—A Randomized Double-Blind Placebo-Controlled Study" Nutrients 14, no. 3: 427. https://doi.org/10.3390/nu14030427