
Fortified Fermented Rice-Acid Can Regulate the Gut Microbiota in Mice and Improve the Antioxidant Capacity


1
School of Liquor and Food Engineering, Guizhou University, Guiyang 550025, China
2
Department of Food Chemistry and Technology, Teagasc Food Research Centre, Moorepark, Fermoy, P61 C996 Co. Cork, Ireland
*
Authors to whom correspondence should be addressed.
Nutrients 2021, 13(12), 4219; https://doi.org/10.3390/nu13124219
Submission received: 3 November 2021
/
Revised: 17 November 2021
/
Accepted: 21 November 2021
/
Published: 24 November 2021
(This article belongs to the Topic Probiotics, Prebiotics and Postbiotics in Human Health)
Abstract
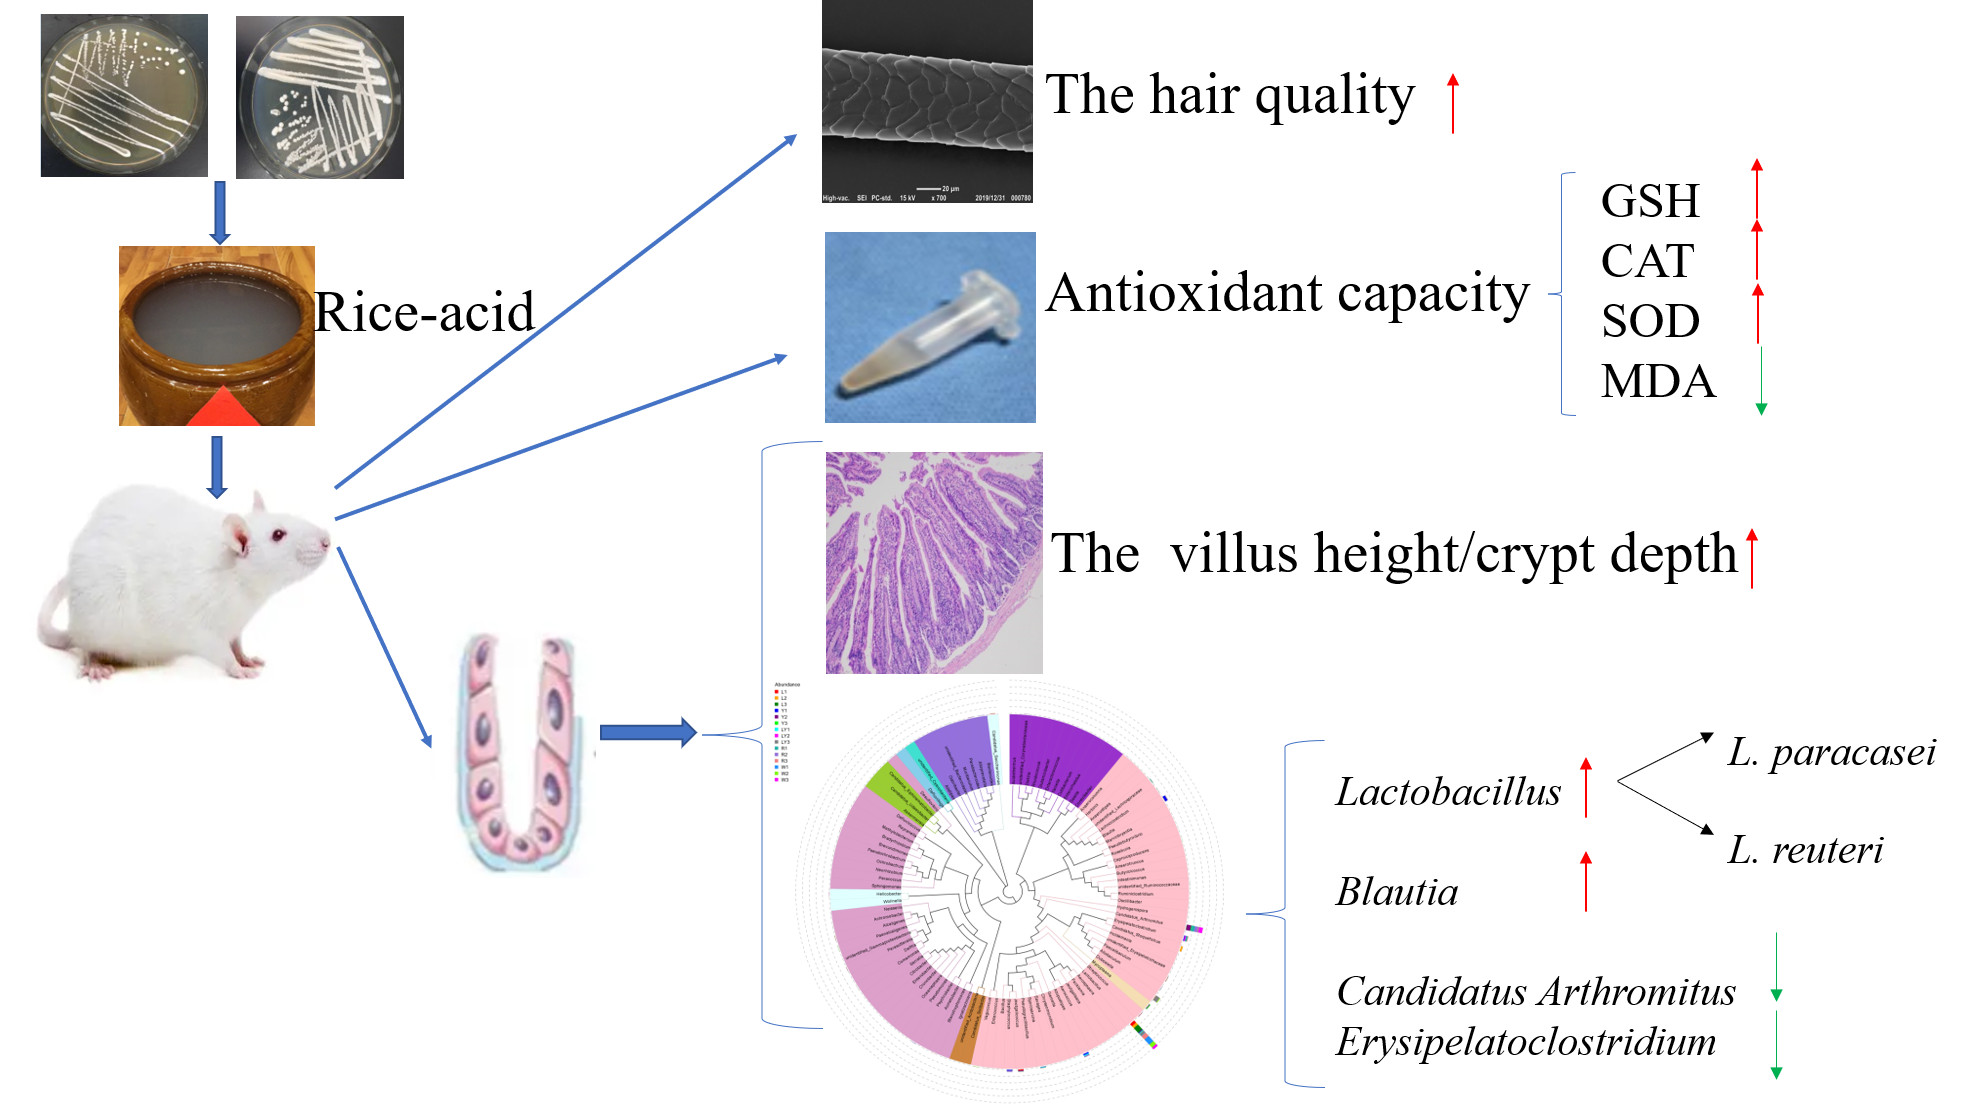
:The study aimed to explore the effects of fortified fermented rice-acid on the antioxidant capacity of mouse serum and the gut microbiota. Hair characteristics, body mass index, intestinal villus height, intestinal crypt depth, serum antioxidant capacity, and gut microbiota of mice were first measured and the correlation between the antioxidant capacity of mouse serum and the gut microbiota was then explored. The mice in the lactic acid bacteria group (L-group), the mixed bacteria group (LY-group), and the rice soup group (R-group) kept their weight well and had better digestion. The mice in the L-group had the better hair quality (dense), but the hair quality in the R-group and the yeast group (Y-group) was relatively poor (sparse). In addition, the inoculation of Lactobacillus paracasei H4-11 (L. paracasei H4-11) and Kluyveromyces marxianus L1-1 (K. marxianus L1-1) increased the villus height/crypt depth of the mice (3.043 ± 0.406) compared to the non-inoculation group (R-group) (2.258 ± 0.248). The inoculation of L. paracasei H4-11 and K. marxianus L1-1 in fermented rice-acid enhanced the blood antioxidant capacity of mouse serum (glutathione 29.503 ± 6.604 umol/L, malonaldehyde 0.687 ± 0.125 mmol/L, catalase 15.644 ± 4.618 U/mL, superoxide dismutase 2.292 ± 0.201 U/mL). In the gut microbiota of L-group and LY-group, beneficial microorganisms (Lactobacillus and Blautia) increased, but harmful microorganisms (Candidatus Arthromitus and Erysipelotrichales) decreased. L. paracasei H4-11 and K. marxianus L1-1 might have a certain synergistic effect on the improvement in antibacterial function since they reduced harmful microorganisms in the gut microbiota of mice. The study provides the basis for the development of fortified fermented rice-acid products for regulating the gut microbiota and improving the antioxidant capacity.

1. Introduction
Probiotics are considered as a potential substitute for antibiotics and a live biotherapeutic agent for improving animal health [1]. The human gut microbiota includes 10 to 100 trillion microorganisms, which are mainly bacteria and vastly outnumber human cells. Among the human gut microbiota, the most common bacteria are Bacteroidetes and Firmicutes [2]. The gut microbiota affects intestinal functions, such as intestinal metabolism and integrity. Different dietary structures can affect the weight difference and metabolism regulation directly and change the gut microbiota [3]. Healthy gut microbiota is characterized by predominant beneficial microbes, whereas dysfunctional gut microbiota is characterized by the predominance of harmful microbes. Interestingly, probiotics in gut microbiota are found in food fermentation processes and also used as over-the-counter supplements because of their proven beneficial effects on the host [4]. Notably, lactic acid bacteria also play a probiotic role in regulating the nutritional status of the body, improving the physiological function of the body, avoiding cell infection, improving the efficacy of drugs, alleviating the effects of toxic substances on the body, promoting immune response, preventing tumorigenesis, and slowing aging [5,6,7,8,9,10]. The role of probiotics in human gut microbiota is widely concerned [2,3,5].
Oxidation processes exist in foods and human metabolism and the antioxidant capacity is a hot topic in the food industry. Antioxidants can inhibit oxidation processes and prevent oxidative stress-related diseases [11] and the physiological effects of antioxidants on human health/organism have been widely explored in recent studies. Some Lactobacilli exhibited excellent antioxidant capacity and probiotic function, including Lactiplantibacillus plantatum [12], Lactobacillus casei [13], Lactobacillus fermentum [14], and Lactobacillus rhamnosus [15]. Notably, the decrease in oxidative products or oxidase activity and the increase in antioxidant enzyme activity are therapeutically beneficial to the recovery of intestinal injury.
Fortified fermentation technology is widely applied in the food industry. Rice-acid is popular among the consumers in Guizhou Province because of its unique flavor. In recent years, the development of fermented rice and its beneficial effects on the prevention of some diseases, such as cardiovascular disease, cancer, and Alzheimer’s disease, have been extensively explored [16,17,18]. Rice-acid is a fermented rice food. In our previous study [19,20], the fortified fermentation technology improved the flavor of rice-acid. However, the probiotic function of rice-acid and its influence on the gut microbiota remain to be studied.
The study aims to explore the effect of fortified fermented rice-acid on the tissue characteristics, antioxidant capacity, and gut microbiota of mice. We first analyzed the weight and relative organ weight of the mice fed with fermented rice-acid in different experimental groups, then measured the hair characteristics, intestinal villus height, intestinal crypt depth, serum antioxidant capacity, and gut microbiota, and finally explored the correlation between antioxidant capacity and gut microbiota.
2. Materials and Methods
2.1. Sample Preparation
Fermented rice-acid, rice soup, and saline were first prepared. In the control group (W-group), the mice were fed with 0.85% sterile saline solution. In the lactic acid bacteria group (L-group), the mice were fed with fermented rice-acid inoculated with Lactobacillus paracasei H4-11 (L. paracasei H4-11) (8.0% selenium rice flour and 7.80 × 10⁷ CFU/mL L. paracasei H4-11 for 96-h fermentation at 30 °C). In the yeast group (Y-group), the mice were fed with fermented rice-acid inoculated with Kluyveromyces marxianus L1-1 (K. marxianus L1-1) (8.0% selenium rice flour and 4.95 × 10⁵ CFU/mL K. marxianus L1-1 for 96-h fermentation at 30 °C). In the mixed fermented rice-acid group (LY-group), the mice were fed with fermented rice-acid inoculated with L. paracasei H4-11 and K. marxianus L1-1 (8.0% selenium rice flour, 7.80 × 10⁷ CFU/mL L. paracasei H4-11 and 4.95 × 10⁵ CFU/mL K. marxianus L1-1 for 96-h fermentation at 30 °C). In the rice soup group (R-group), the mice were fed with rice soup (prepared with 8% selenium rice flour and boiling 92% water). Rice-acid was prepared with the previous method [19]. Briefly, L. paracasei H4–11 (CCTCC 2021074) and K. marxianus L1–1 (CCTCC 2021073) were isolated from fermented rice-acid in our previous study [19]. First, the strains L. paracasei H4–11 and K. marxianus L1–1 were, respectively, activated and cultured in the MRS medium (37 °C for 24 h) and YPD medium (30 °C for 48–72 h) and the cultivation was stopped when the two strains entered the logarithmic phase. Then, the strains were washed with 0.85% sterile saline and the resulting suspensions were used to inoculate fermented rice acid.
2.2. Experimental Animals in Various Groups
Sixty 8-week-old SPF male mice with body weight of 23 ± 2 g were purchased from Chongqing Tengxin Biological Co., Ltd. (Chongqing, China) and the laboratory animal production license number was: SCXK (Jing) 2019-0008. The experimental mice were raised in accordance with Regulations for Protection and Use of Experimental Animals of Guizhou University. All experimental procedures were performed according to the Laboratory Animal Welfare Standards and approved by the Subcommittee of Experimental Animal Ethics, Guizhou University (No. EAE-GZU-2021-P005). The schematic diagram of this study is shown in Figure 1. Six mice per cage were free to eat and drink under the following conditions: room temperature of 23 ± 2 °C, relative humidity of 63% ± 5%, and the light–dark cycle (12 h–12 h). After feeding with a standard rodent diet (SPF maintenance feed, the production license number: Beijing Feed Certificate SCXK (Jing) 2019-0008 and drinking water freely (the weight of mouse was 28.04 ± 1.03 g) for 7 consecutive days, the mice were randomly divided into 5 groups (each group containing 12 mice in two cages (Cage 1 and Cage 2)): W-group, L-group, Y-group, LY-group, and R-group. During the experiment, the mice ate and drank freely and were gavaged with 1 mL of corresponding inoculation suspension according to the grouping results in Section 2.1 at a fixed time (9:00 am) every day. Different indexes of the mice in Cage 1 (n = 6) were measured and the growth state of the mice in Cage 2 was observed.
2.3. Preparation of Serum Samples
After being fed with experimental diets for 10 consecutive days, all the mice fasted and drank freely for 12 h. The mice were sacrificed at 12 h after the last observation. After weighing, blood samples were collected from the orbital sinus by removing the eyeballs under deep anesthesia. Then, collected blood samples were centrifuged at 4 °C and 40,000× g for 10 min to prepare serum samples. Finally, the prepared serum samples were stored in an ultra-low temperature freezer at −78 °C for testing.
2.4. Determination of Body Mass and Relative Organ Weight of Mice
After measuring the body mass of the mice, the mice were quickly dissected on ice. Heart, liver, spleen, kidney, and small intestine of mice were taken out. After absorbing floating blood with a cotton swab, the organs were weighed and washed with ice-cooled normal saline and residual water was adsorbed with dry filter paper. The relative organ weight was calculated as:
where A is the relative organ weight; M1 is the organ mass (mg); M2 is the mouse body mass (g).
𝐴 (mg/g) = 𝑀1/𝑀2,
2.5. Body Hair Characteristics of Mice
After the mice were dissected, the hair samples of the mice in each group were collected. Five hairs from each site of each mouse were examined. The morphological observation was carried out with the aid of a scanning electron microscope (SEM) in order to detect the differences in the morphology and density (the degree of dispersion of hair) of the hair of the mice in each group. Hair stands were withdrawn from mice using scissors, SEM analyses were performed as described previously [21] with JEOL JCM-6000 microscope (Tokyo, Japan) operating at an acceleration voltage of 15 kV. For semi-quantitative assessment of the mouse hair dysmorphology, the previously proposed scale of hair morphological changes was used [21]. In addition, the hair surface microstructure was identified by analyzing the formation of epidermal scales in SEM images [22].
2.6. Intestinal Histology and Morphological Analysis
After the mice were euthanized, the entire small intestine was taken out and measured and ileum of small intestine was taken for histological analysis. The intestines were flushed with precooled phosphate buffer saline to remove intestinal contents, and the ileum tissue samples were placed in 10% formaldehyde buffer for 24 h and then embedded in paraffin. The embedded sample (4 μm) was mounted on a glass slide and used with hematoxylin and eosin (HE). In HE-stained glass slides, the altered structure of the mucosa and polymorphonuclear cell infiltration were analyzed with a histopathological grading system according to the previous method [23]. In Image-pro plus 6.0 (Media Cybernetics, Inc., Rockville, MD, USA), 3 fields of view (100×) were selected for each slice in each group to take photos. When photos were taken, the fields of view full of organs were selected to ensure consistent background light in each photo. With the 100× ruler in Image-Pro Plus 6.0 software as the standard, five complete villi in each slice of each sample were selected to measure the villus height (mm), crypt depth (mm), and villus height/crypt depth and calculate their own average values.
2.7. Determination of Antioxidant Index
To measure antioxidant enzyme activities, the blood samples were then centrifuged at 4000× g and 4 °C for 10 min. The serum supernatant was immediately used to detect enzyme activities. The contents of glutathione (GSH), catalase (CAT), and superoxide dismutase (SOD) in serum were detected according to the instructions of GSH, CAT and T-SOD test kits (Nanjing Jiancheng Bioengineering Institute, Nanjing, China). Briefly, 0.05 mL, 0.1 mL, and 0.05 mL of serum was used in the determination of GSH, CAT, and SOD, respectively. In the reaction between reduced GSH and dithiodinitrobenzoic acid, a yellow compound was formed and the content of reduced GSH could be measured at 405 nm. One unit of CAT was defined as the quantity of enzyme required for decomposing 1 μmol H2O2 monitored at 405 nm. The SOD activity was detected with a Total Superoxide Dismutase (T-SOD) Assay Kit (Hydroxylamine method). One unit of SOD activity was defined as the quantity of SOD when the inhibition rate of SOD reached 50% per gram tissue in 1 mL of reacted solution and the SOD activity was monitored at 550 nm. The content of malonaldehyde (MDA) in serum was detected according to the instructions of an MDA test kit (Solarbio Life Sciences, Beijing, China). Briefly, serum (0.1 mL) was used for the determination of MDA. Under acidic and high-temperature conditions, MDA was condensed with thiobarbituric acid to produce brown–red 3,5,5-trimethyloxazole-2,4-dione, whose maximum absorption wavelength is at 532 nm. Soluble sugars interfered with the absorption of MDA at 450 nm and 600 nm. Therefore, the difference in absorbance at 532 nm, 450 nm and 600 nm could be used to calculate the content of MDA.
2.8. Determination of the Gut Microbiota
After the mice were dissected, the cecal contents were aseptically removed and the collected products were transferred into a 2 mL cryotube, which was quickly placed in a liquid nitrogen tank and then stored at −80 °C for later use. Three replicates were arranged randomly for each group in the same cage and a total of 15 samples were transported to Beijing Nuohe Zhiyuan Technology Co., Ltd. (Beijing, China). Through the amplification of the full length of 16S, the construction of an SMRT Bell library, and sequencing with the PacBio platform (Pacific Biosciences, Menlo Park, CA, USA), based on bioinformatics, the microbial diversity and community composition differences in the small intestine of mice were analyzed [24].
2.8.1. Genomic DNA Extraction and Amplicon Generation
Total genome DNA was extracted from samples with the Cetyltrimethylammonium Bromide and sodium dodecyl sulfate (CTAB/SDS) method. DNA concentration and purity were monitored on 1% agarose gels. According to the monitored concentration, DNA was diluted to 1 ng/μL with sterile water. The 16S rRNA genes of distinct regions were amplified by using specific primer with the barcode. All PCR reactions were carried out with Phusion® High-Fidelity PCR Master Mix with GC Buffer (New England Biolabs, Beverly, MA, USA).
2.8.2. Mixing and Purification of PCR Products
The same volume of 1X loading buffer (contained SYB green) was mixed with PCR products to carry out electrophoresis on 2% agarose gel for detection. PCR products were mixed in equidensity ratios. Then, mixed PCR products were purified with a QIAquick@ Gel Extraction Kit (QIAGEN, Hilden, Germany).
2.8.3. Library Construction and Sequencing
With DNA binding enzyme, sequencing adapters were connected to both ends of the amplified DNA fragments, which were purified with AMpure PB magnetic beads to construct a SMRT Bell library. After the purified fragments were re-dissolved in the buffer, the BluePipin fragments were used to screen the fragments of a specific size and the DNA fragments were purified by AMpure PB magnetic beads (Pacific Biosciences, Menlo Park, CA, USA). The constructed library was quantified based on Qubit concentration and the insert fragments were detected by Agilent 2100 and then sequenced on the PacBio platform (Pacific Biosciences, Menlo Park, CA, USA).
OTUs with 97% similarity were used for alpha diversity estimations, including observed species, community diversity (Shannon, Simpson), community richness (Chao, Abundance-based Coverage Estimator (ACE)), and sequencing depth (the Good’s coverage) and PD_whole_tree. All these indices in our samples were calculated with Quantitative Insights Into Microbial Ecology (QIIME) software (v1.9.1) (Rob Knight team, University of California, San Diego, USA) and displayed with R software (v2.15.3) (MathSoft, Cambridge, MA, USA). To display the differences among samples, Beta diversity was calculated with the Unweighted Pair-group Method with Arithmetic Means (UPGMA) Clustering to interpret the distance matrix in QIIME software (v1.9.1) (Rob Knight team, University of California, San Diego, USA). Non-Metric Multi-Dimensional Scaling (NMDS), the distance between points, can reflect the differences between groups and within groups of samples. Linear discriminant analysis (LDA) Effect Size (LEfSe) analysis can search for biomarkers with statistical differences among groups. The LDA value distribution histogram shows the species with LDA Score greater than the set value, 4.
2.9. Statistical Analysis
Data were reported as the mean ± standard deviation (SD). The statistical significance between groups was evaluated by one-way ANOVA, followed by Waller–Duncan multiple range test in SPSS Statistics 20.0 (IBM, New York, USA). p < 0.05 was considered to be statistically significant. The indices in gut microbiota were calculated with QIIME software (v1.9.1) and displayed with R software (v2.15.3). In order to minimize the influence of individual differences of mice on the overall evaluation results, we used Spearman’s correlation coefficient [25,26,27] to analyze the correlations between the key microbial genera and other parameters, and the heatmaps were made using ORIGIN PRO 2018 (OriginLab Corporation, Northampton, MA, USA).
3. Results and Discussion
3.1. Analysis of Mouse Body Weight and Relative Organ Weight
After the treatment, the weight of mice was heavier (35.10~38.81 g) than that of the mice adapted to the environment for 7 days (28.04 ± 1.03 g). Compared with the weight of control group (38.63 ± 2.07 g), the mice in the other four groups of experiments were lighter, but the difference between Y-group and W-group was not significant (Table 1). The relative heart weight of L-group was larger than that of W-group, but the relative heart weights of the other three groups were smaller than that of W-group (p < 0.05). The relative liver weight of Y-group was smaller than that of W-group and the relative liver weights of other three groups were all greater than that of W-group (p < 0.05). The relative kidney weights of mice in the other four groups of experiments were lower than that of W-group. The relative small intestine weights of the four experimental groups were greater than that of W-group.
Except for Y-group, the other experimental groups showed no significant difference in the relative spleen weight compared to W-group because a spleen is an essential organ related to anti-inflammatory reflex and immune function [28]. The result indicated that the mice in L-group and LY-group had the similar immune functions with W-group. Relative liver weight refers to the ratio of liver wet weight to body weight. It indicates the health status of the liver and is related to obesity [29]. The relative liver weight of the mice in Y-group was close to that of W-group, indicating that the mice in the Y-group might have the similar absorption capacity with W-group. The mice in L-group, LY-group, and R-group could keep their weight well, indicating that the mice in the three groups had the higher digestion capacity than others. The body weight gain of the mice is dependent on the caloric density of food, total energy intake, and activities, so the weight loss effect observed in these groups will be further explored. The function related to the relative organ weight in Section 3.1 needs to be further studied in subsequent experiments.
3.2. Analysis of Mouse Hair Characteristics
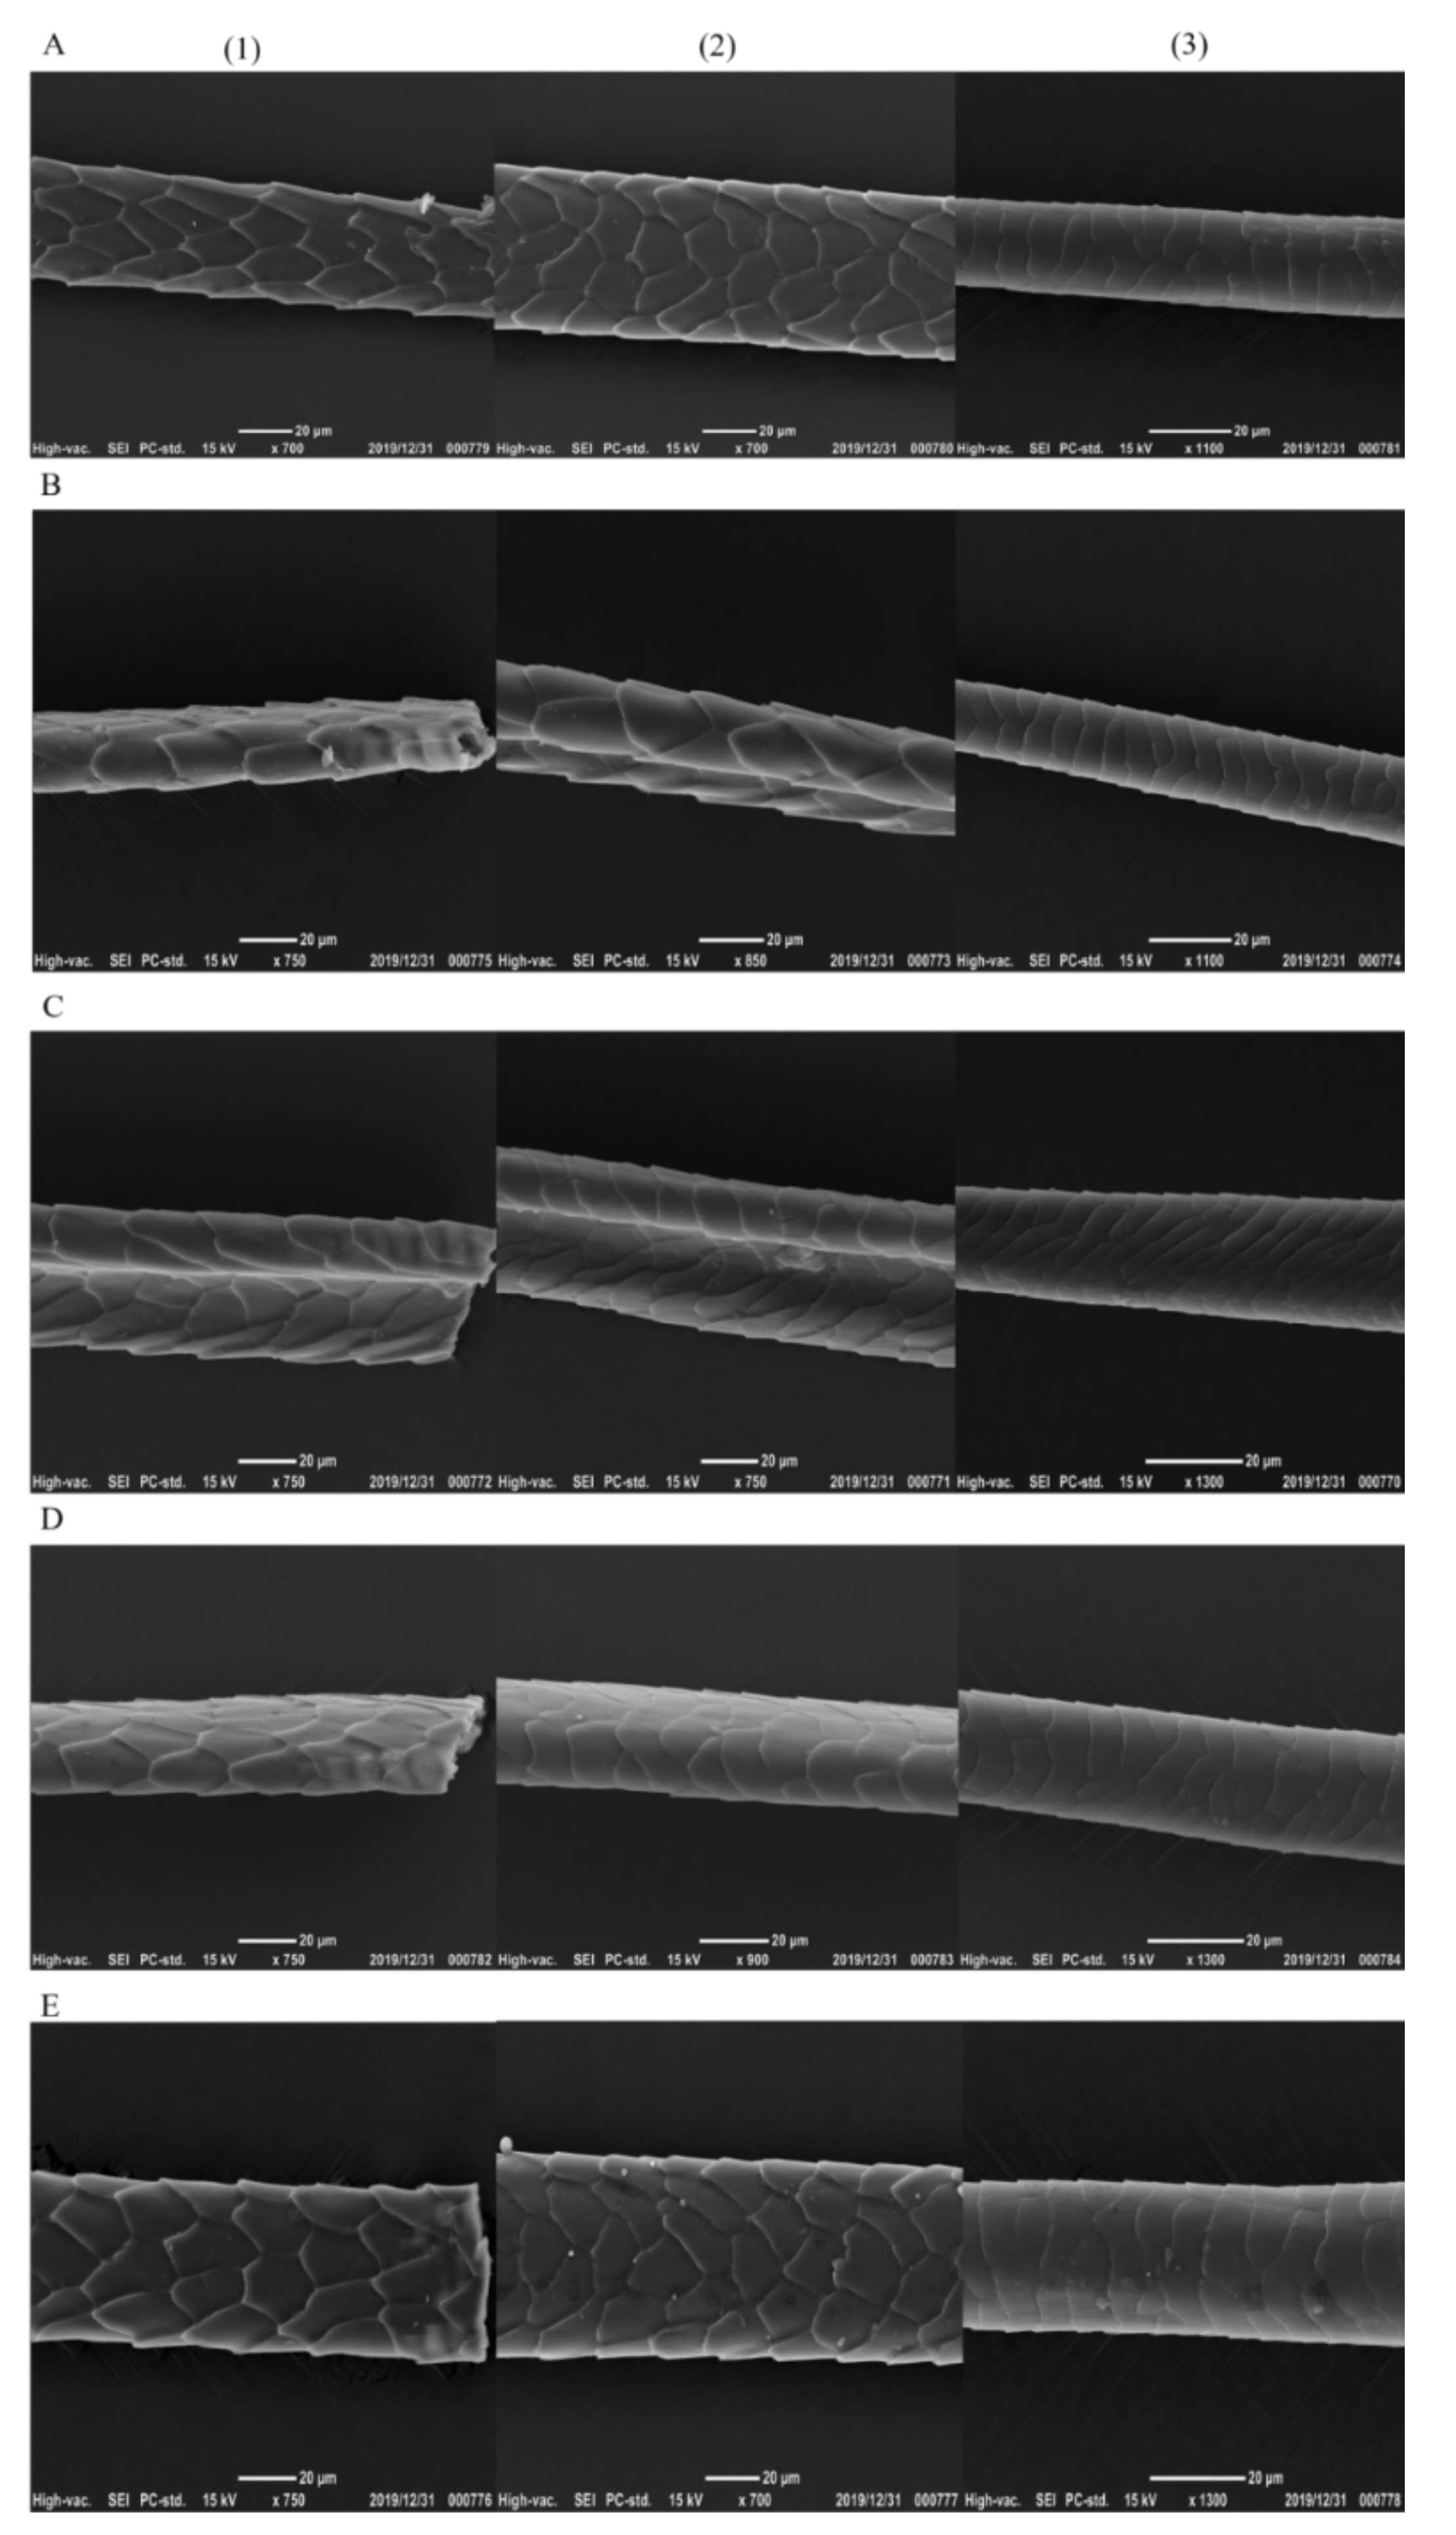
The hair quality is correlated with physical health or diseases [30]. Compared with the hair of the mice in the control group, the hair in the other four groups did not show dysmorphology, and the mice in the other four groups had the regular, contact, and staggered hair scales with shiny surfaces (Figure 2). The scales on the head, middle, and tail of mouse hair of each group were staggered. The head part of mouse hair in L-group and W-group was denser than that in LY-group, R-group and Y-group, and the head part of mouse hair in L-group had sharp ends or bifurcations. The hair density in the middle part of mice was higher than that in the head part. The hair density in the middle part of mice in L-group and W-group was still higher, followed by LY-group, and R-group and Y-group. The hair density in the tail part of mice showed no significant difference among various groups and the hair density in the tail part of mice was lower than that in the middle part. The result suggested that the mice in L-group might have the high-quality hair characteristics (dense), whereas those in R-group and Y-group had the poor hair quality (sparse). The difference will be further explored in the future.
3.3. Analysis of Histomorphology and the Villus Height and Crypt Depth of the Ileum in Mice
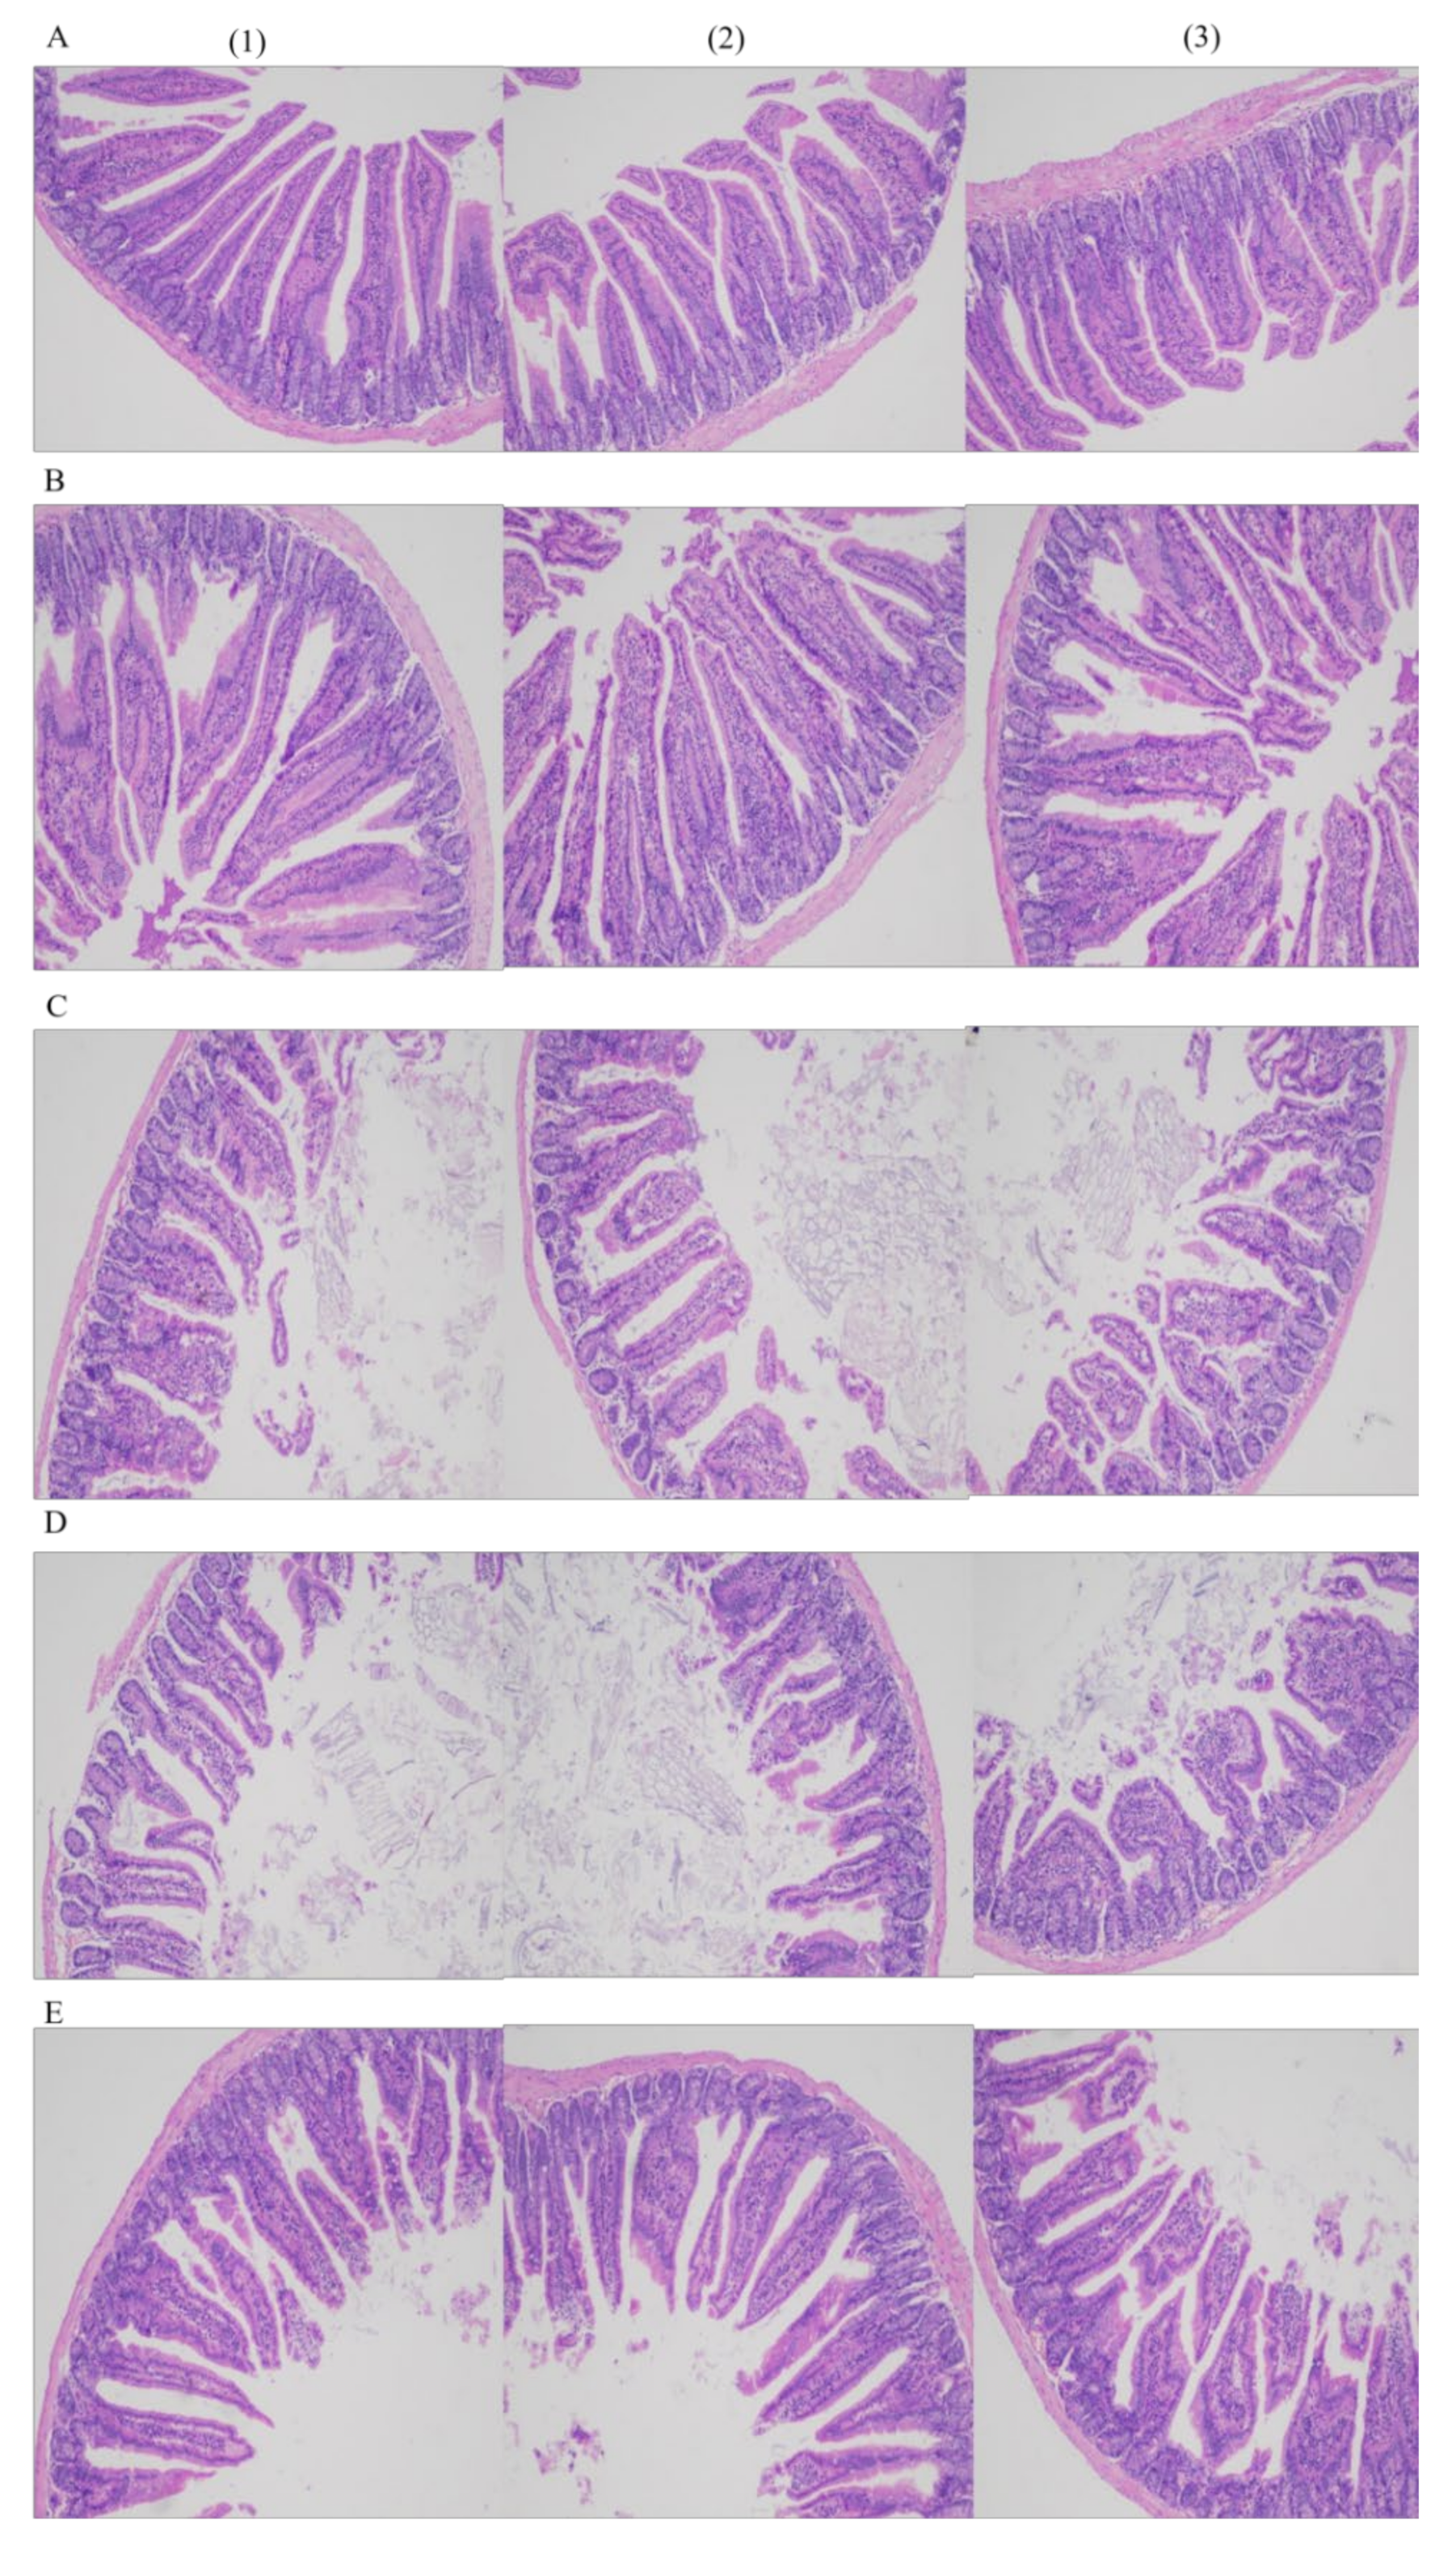
A crypt is considered as the villus factory. Deeper crypts indicate fast tissue turnover to permit the renewal of villi in response to normal sloughing or inflammation caused by pathogens or their toxins [31]. The morphology of the mouse ileum is shown in Figure 3. The mice in all the groups showed normal histological morphology of the ileum without edema, inflammatory cell infiltration, and other pathological changes.
Villus height and crypt depth in the five groups were measured (Table 2). Villus heights in various groups decreased according to the following order: Y-group > L-group > W-group > LY-group > R-group. Crypt depths in various groups increased according to the following order: LY-group < W-group < R-group < Y-group < L-group. Higher villus height and shallower crypt depth indicate the higher nutrient absorption capacity of mice. Importantly, the ratio of villus height to crypt depth (villus height/crypt depth, V/C) is positively correlated with the growth rate of mice and crypt depth indicates the activity and function of intestinal stem cells [32]. Villus height and crypt depth of intestine are important indicators to measure the digestion and absorption capacity of intestine. The villus height/crypt depth reflects the functional status of the mice [32]. The decrease in the V/C indicates the damaged mucosa and the decreased digestion and absorption capacity. The V/C in W-group (3.270 ± 0.591) was significantly lower than that in Y-group (3.934 ± 0.681), indicating that the digestion capacity and absorption capacity were higher in the mice in Y-group. However, the V/C of R-group (2.258 ± 0.248) was significantly reduced, indicating that the digestion and absorption capacity was weak in the mice in R-group. The V/C in L-group (3.165 ± 0.405) was not significantly different from that in LY-group (3.043 ± 0.406) and the data of the two groups were different from that in W-group. This indicator showed that lactic acid bacteria-enhanced fermentation of rice-acid had a small effect on the digestion and absorption capacity of mice. Cucick et al. [33] also found that the ratio of villus height to crypt depth in the mice fed with milk fortified by lactic acid bacteria was similar to that of mice fed with milk containing commercial folic acid. In addition, Carrizo et al. confirmed that Quinoa pasta fermented with lactic acid bacteria could increase villus height of mice, but it had little effect on crypt depth [34]. The above results showed that rice-acid fermented with lactic acid bacteria could increase the V/C of mice.
3.4. Analysis of the Antioxidant Ability of Mouse Serum
The analysis results of antioxidant capacity of mouse serum are shown in Table 3. GSH is a low-molecular-weight antioxidant and acts as an important antioxidant enzyme that catalyzes the reduction of peroxide. It can maintain cell redox balance, prevent oxidative damage, and remove O2⋅−, ⋅OH, and H2O2. GSH content is an important factor to indicate the body’s antioxidant capacity [35]. The GSH content in W-group was lower than that in the other groups. The GSH content in Y-group was the highest (36.735 ± 4.515 μmol/L), followed by LY-group. GSH content showed no significant difference between L-group and R-group (p > 0.05).
MDA is a product of lipid peroxidation caused by free radicals in the body and often used as an indicator to evaluate the oxidation level [36]. MDA contents in various groups decreased according to the following order: R-group > W-group > Y-group > L-group > LY-group. The MDA contents in R-group and W-group were higher than that in L-group and LY-group (p < 0.05) and the MDA content in LY-group was the lowest (0.687 ± 0.125 mmol/L). The MDA content showed no significant difference between LY-group and L-group (p > 0.05). The difference in MDA content between R-group and W-group was not significant (p > 0.05).
CAT is an enzyme that catalyzes the decomposition of H2O2 into oxygen and water and exists in all tissues of all known animals [36]. CAT content in LY-group (15.644 ± 4.618 U/mL) was significantly higher than that in W-group (p < 0.05) and CAT content in L-group (11.624 ± 3.111 U/mL) was higher than that in W-group. CAT contents in Y-group and R-group were lower than that in W-group. The difference in CAT content between Y-group and R-group was not significant (p > 0.05).
SOD can catalyze the dismutation of superoxide and act as a superoxide radical scavenger in an organism. It can convert harmful superoxide free radicals into H2O2 and CAT and peroxidase oxidase in the body decompose the generated H2O2 into water. As an antioxidant enzyme, SOD can effectively remove superoxide anion radicals in the body and reduce the production of MDA and metabolites of free radicals [37], thus protecting the body from cytotoxic damage. SOD contents in various groups decreased in the following order: LY-group > L-group > R-group > Y-group > W-group. The differences in SOD content between the two groups (LY-group and L-group) and other groups (Y-group, R-group and W-group) were significant (p < 0.05). LY-group had the highest SOD content (2.292 ± 0.201 U/mL).
The above data indicated that fermented rice-acid could enhance the antioxidant capacity of the body. Especially, LY-group performed best, followed by L-group. The difference in antioxidant capacity between LY-group and L-group was not significant, indicating that rice-acid fermented with L. paracasei H4-11 could reduce the content of free radicals in the body and effectively protect important tissues from damage. In summary, fortified fermented rice-acid had the good antioxidant capacity and its mechanism might be related to the composition of gut microbiota. Lun et al. found that the improvement in the gut microbiota of mice treated with tea polyphenols was closely related to the enhancement of antioxidant ability [38]. Antioxidants contribute to human health through preventing aging, inflammation, infection, and many diseases (including cancers, cataracts, diabetes, and neurodegenerative diseases) [11,39,40]. The results provide the basis for the further development and utilization of probiotic properties of rice-acid. In this study, we analyzed the serum content of antioxidants. Some researchers analyzed the antioxidants of serum with SOD, CAT, GSH and other parameters [41,42,43]. In our future study, we will focus on the antioxidants of erythrocyte and intestinal tissue.
3.5. Analysis of the Gut Microbiota in Mice
3.5.1. Analysis of the Microbial Diversity in Small Intestine of Mice
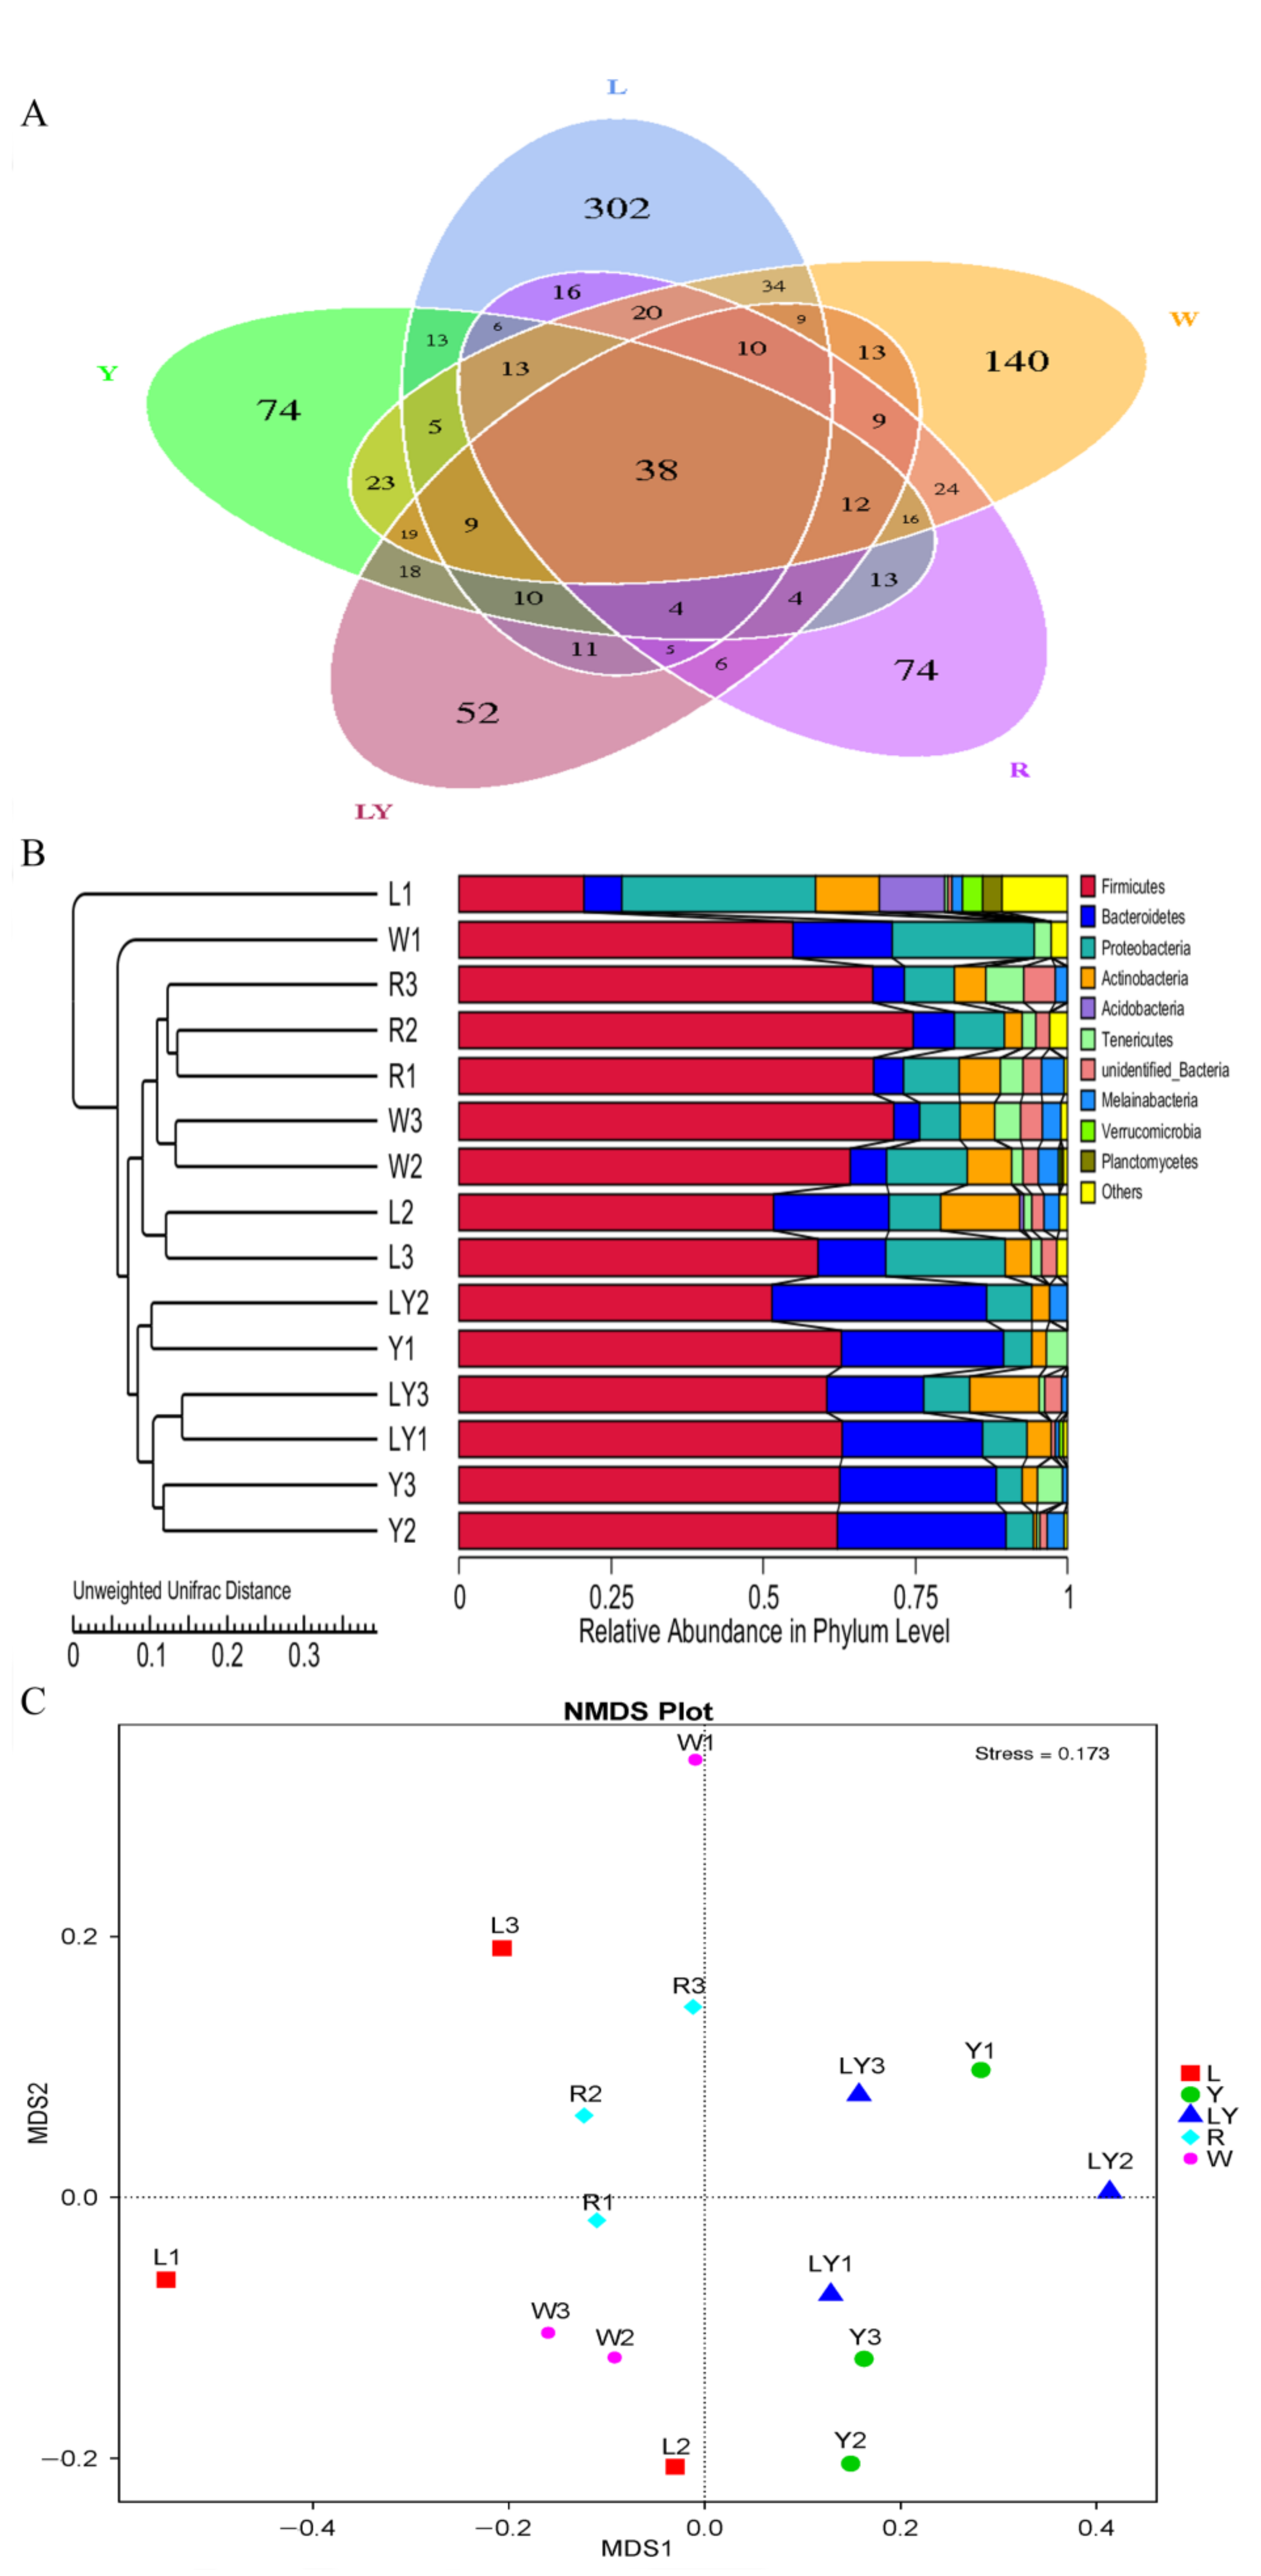
The alpha diversity was selected to evaluate different types of gut bacteria in five groups [44]. Table 4 shows sequencing analysis results of gut microbiota of the mice in five groups. The number of observed species ranged from 108 in LY-group to 202 in L-group and the different sequencing data were related to the different experimental designs in five groups. Chao index ranged from 148.113 (LY-group) to 287.020 (W-group) and Ace index ranged from 159.118 (LY-group) to 321.170 (W-group). Two indexes indicated that the intestinal floral abundances in five groups were different. The Shannon index ranged from 2.674 (LY-group) to 3.582 (L-group) and the Simpson index ranged from 0.566 (W-group) to 0.781 (Y-group). Two indexes indicated that L-group and Y-group had the richer diversity of gut microbiota. The good’s coverage ranged from 0.977 to 0.990, indicating that sequencing depth met experimental requirements. PD_whole_tree ranged from 13.465 (LY-group) to 24.576 (L-group), indicating that the phylogenetic diversity of L-group was the most abundant, whereas the phylogenetic diversity of LY-group was low. A Venn diagram (Figure 4A) shows that the total number of common OTUs in five groups was 38. The number of common OTUs indicated that microbial species in the gut of mice in different groups were partially the same. The numbers of unique OTUs in L-group, Y-group, LY-group, R-group, and W-group were, respectively, 302, 74, 52, 74, and 140. The differences in intestinal microbial species of the mice under different treatments further interpreted the diversity of gut microbiota.
The β-diversity analysis was performed in order to evaluate the difference in the diversity of gut flora [44]. UniFrac distance and NMDS (Figure 4B,C) indicated a complete separation of the microbial community composition between W-group and L-group/LY-group. In addition, the microbial community composition of LY-group was relatively close to that of L-group and Y-group. The results indicated that both rice-acid fermented with L. paracasei H4-11 and K. marxianus L1-1 and rice-acid fermented with single starter could change the composition of gut microbiota of mice.
3.5.2. Distribution of Dominant Microbial Species in the Small Intestine of Mice
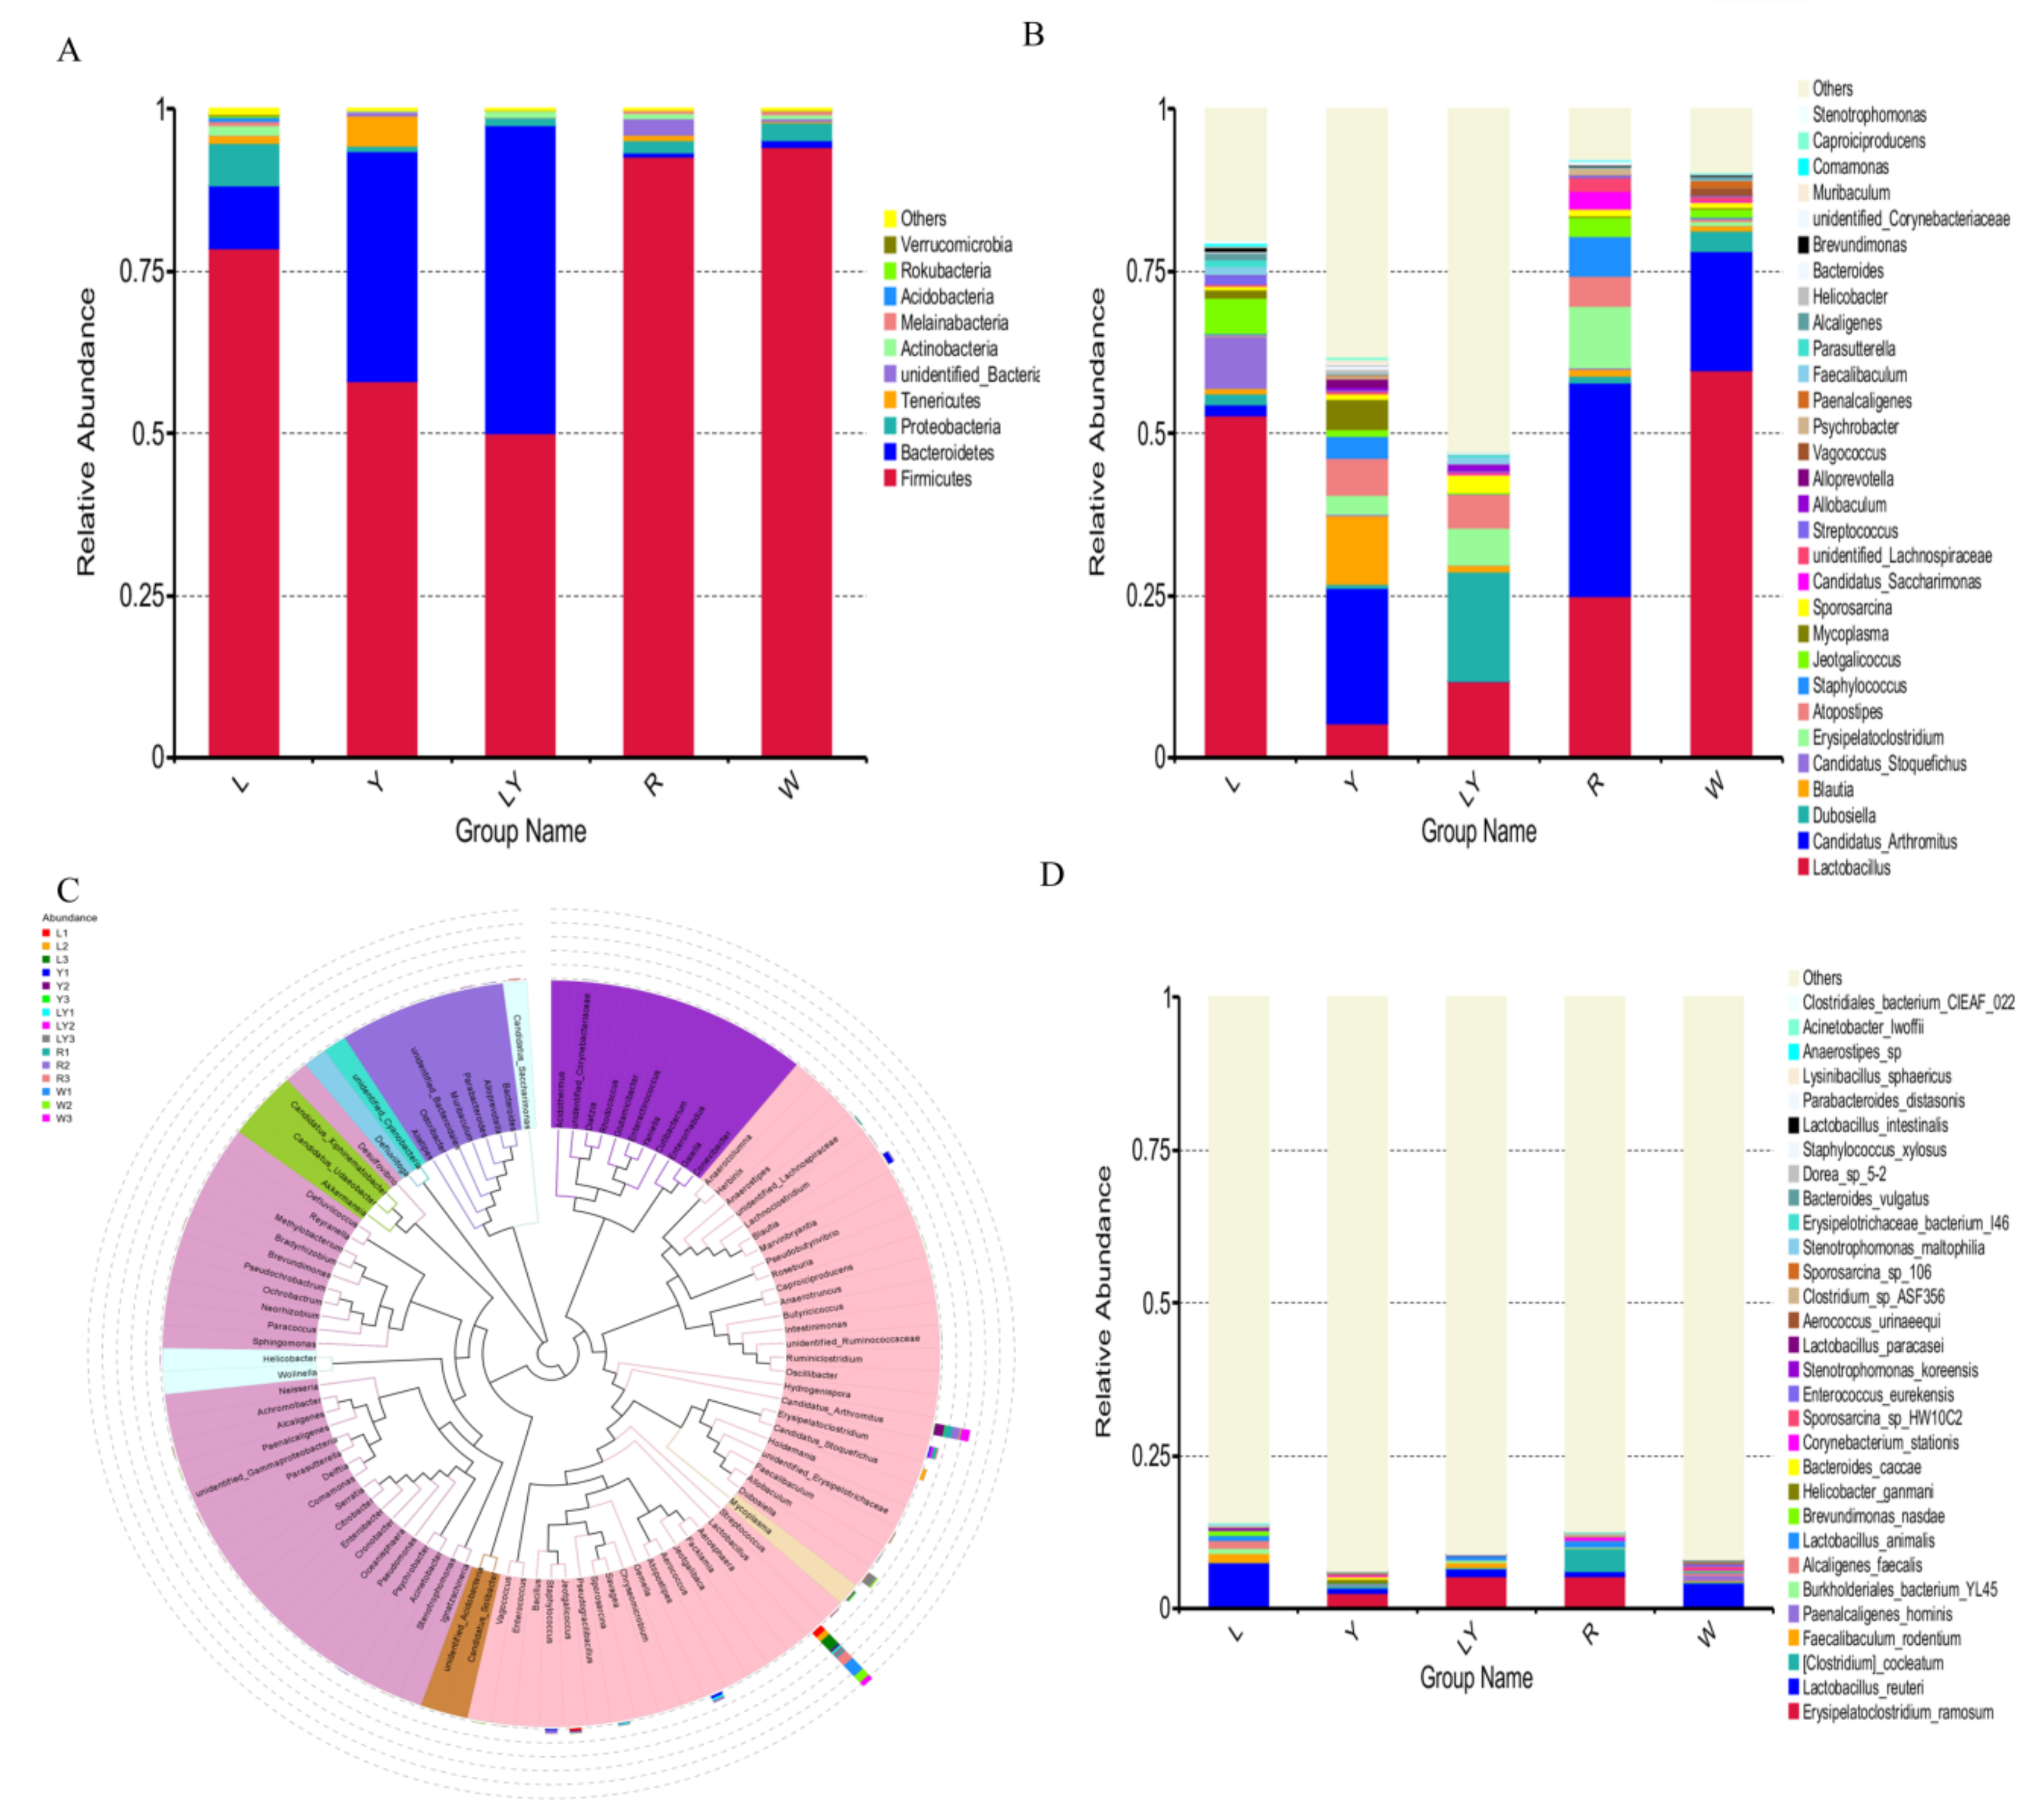
Intestinal microorganisms have a crucial influence on the intestinal microenvironment. Among the top 10 phyla in five groups, the dominant phyla were Firmicutes and Bacteroidetes (Figure 5A). In particular, the relative abundances of Firmicutes in R-group and W-group were larger and, respectively, reached 92.78% and 94.20%. The relative abundances of Bacteroidetes in LY-group, Y-group and L-group were, respectively, 47.66%, 35.37%, and 9.65%. The phyla of Firmicutes (Gram-positive low G + C mol% branch) and Bacteroidetes (Gram-negative bacteria) as probiotics were the dominant phyla in the gut microbiota [45]. In addition, the increase in the abundance ratio of Firmicutes to Bacteroidetes in the intestine could make the mice absorb energy more efficiently and lead to obesity [46,47]. In this study, the abundance ratios of Firmicutes to Bacteroidetes in various groups decreased in the following order: R-group > W-group > L-group > Y-group > LY-group, indicating that rice-acid fermented with the two strains (L. paracasei H4-11 and K. marxianus L1-1) as the feed of mice might effectively reduce the weight of mice. The result needs to be further explored in subsequent experiments.
Figure 5B shows the top 30 genera with a high relative abundance. The microbial genera in various groups were significantly different. Top 10 genera included Lactobacillus, Candidatus Arthromitus, Dubosiella, Blautia, Candidatus Stoquefichus, Erysipelatoclostridium, Atopostipes, Staphylococcus, Jeotgalicoccus, and Mycoplasma. Among them, Lactobacillus and Candidatus Arthromitus were the most abundant genera among five groups. The relative abundances of Lactobacillus in various groups decreased in the following order: W-group (59.80%) > L-group (52.86%) > R-group (24.97%) > LY-group (11.80%) > Y-group (5.38%). The difference in the abundance of Lactobacillus between L-group and W-group was not significant, but the abundance of Lactobacillus in L-group and W-group was significantly higher than that in R-group (p < 0.05). Some strains of Lactobacillus survive in the gut of human and animals and reach gastrointestinal tracts [48]. Lactobacillus has a certain antibacterial effect and can control the shelf life of foods and shorten the fermentation period [48]. Lactobacillus induces the expression of anti-inflammatory genes, improves gut function and motility, and modulates immune response [49]. The relative abundances of Blautia in Y-group, LY-group, and Y-group were higher than that in W-group. Blautia was significantly reduced in patients with colorectal cancer and could prevent inflammation, promote the production of short chain fatty acids, and maintain intestinal homeostasis activity, displaying probiotic properties [50]. The relative abundances of Candidatus Arthromitus in various groups decreased in the following order: R-group (32.95%) > Y-group (20.91%) > W-group (18.28%) > L-group (1.60%) > LY-group (<0.01%). The relative abundances of Candidatus Arthromitus in LY-group and L-group were significantly lower than that in W-group. Candidatus Arthromitus may be a kind of microorganism indicating the state between health and disease and many functions of Candidatus Arthromitus have not been studied [50]. The result indicated that L. paracasei H4-11 could inhibit the growth of Candidatus Arthromitus. It was further speculated that the compositions of gut microbiota in the mice in LY-group and L-group were healthier. The phylogenetic relationships of the representative sequences of the top 100 genera were obtained through multiple sequence alignments (Figure 5C). The 100 genera belonged to 10 different phyla. Lactobacillus was detected in all 15 samples in the five experimental groups and had the largest relative abundance. Candidatus Arthromitus was detected in 14 samples (except LY2). Dubosiella, which belongs to the family Erysipelotrichaceae and is related to Allobaculum stercoricanis [51], was detected in 15 samples, and the relative abundances of Dubosiella in L-group and Y-group were lower than that in W-group. The relative abundance of Allobaculum spp. was increased in the animal study on the diet of glycated or advanced glycation end products [52]. Erysipelatoclostridium was detected in all the groups except L-group. An increase in Erysipelatoclostridium led to an increase in pathogenic bacteria in patients with gout [53]. This result suggested that L-group might prevent the production of pathogenic bacteria to a certain degree. Similarly, previous findings demonstrated that Erysipelotrichales was enriched in the control diet group other than the advanced glycation end product diet group [54,55]. The phylogenetic relationships among these genera further confirmed the diversity and distribution of gut microbiota in mice of different groups.
Figure 5D shows the top 30 species with a high relative abundance. The microbial species showed significant differences among five experimental groups. The top 10 species with a high abundance were Erysipelatoclostridium, Lactobacillus reuteri, (Clostridium) cocleatum, Faecalibaculum rodentium, Paenalcaligenes hominis, Burkholderiales bacterium, Alcaligenes faecalis, Lactobacillus animalis, Brevundimonas nasdae, and Helicobacter ganmani. Erysipelatoclostridium and Lactobacillus reuteri were the two dominant species. L. paracasei H4-11 was detected in L-group, Y-group, and LY-group, but L. paracasei H4-11 was not detected in R-group or W-group, indicating that L. paracasei H4-11 in rice-acid could be well absorbed and utilized by mice. In the mice in Y-group fed with rice-acid fermented without L. paracasei H4-11, L. paracasei H4-11 was detected in small intestine of mice, indicating that K. marxianus L1-1 in Y-group contributed to the growth of L. paracasei. It was preliminarily speculated that the two strains (L. paracasei H4-11 and K. marxianus L1-1) might be related to antioxidant capacity. According to previous reports [38,56], antioxidant capacity was related to the change in gut microbiota.
3.5.3. Microbial Species with Significant Abundance Difference in Small Intestine of Mice
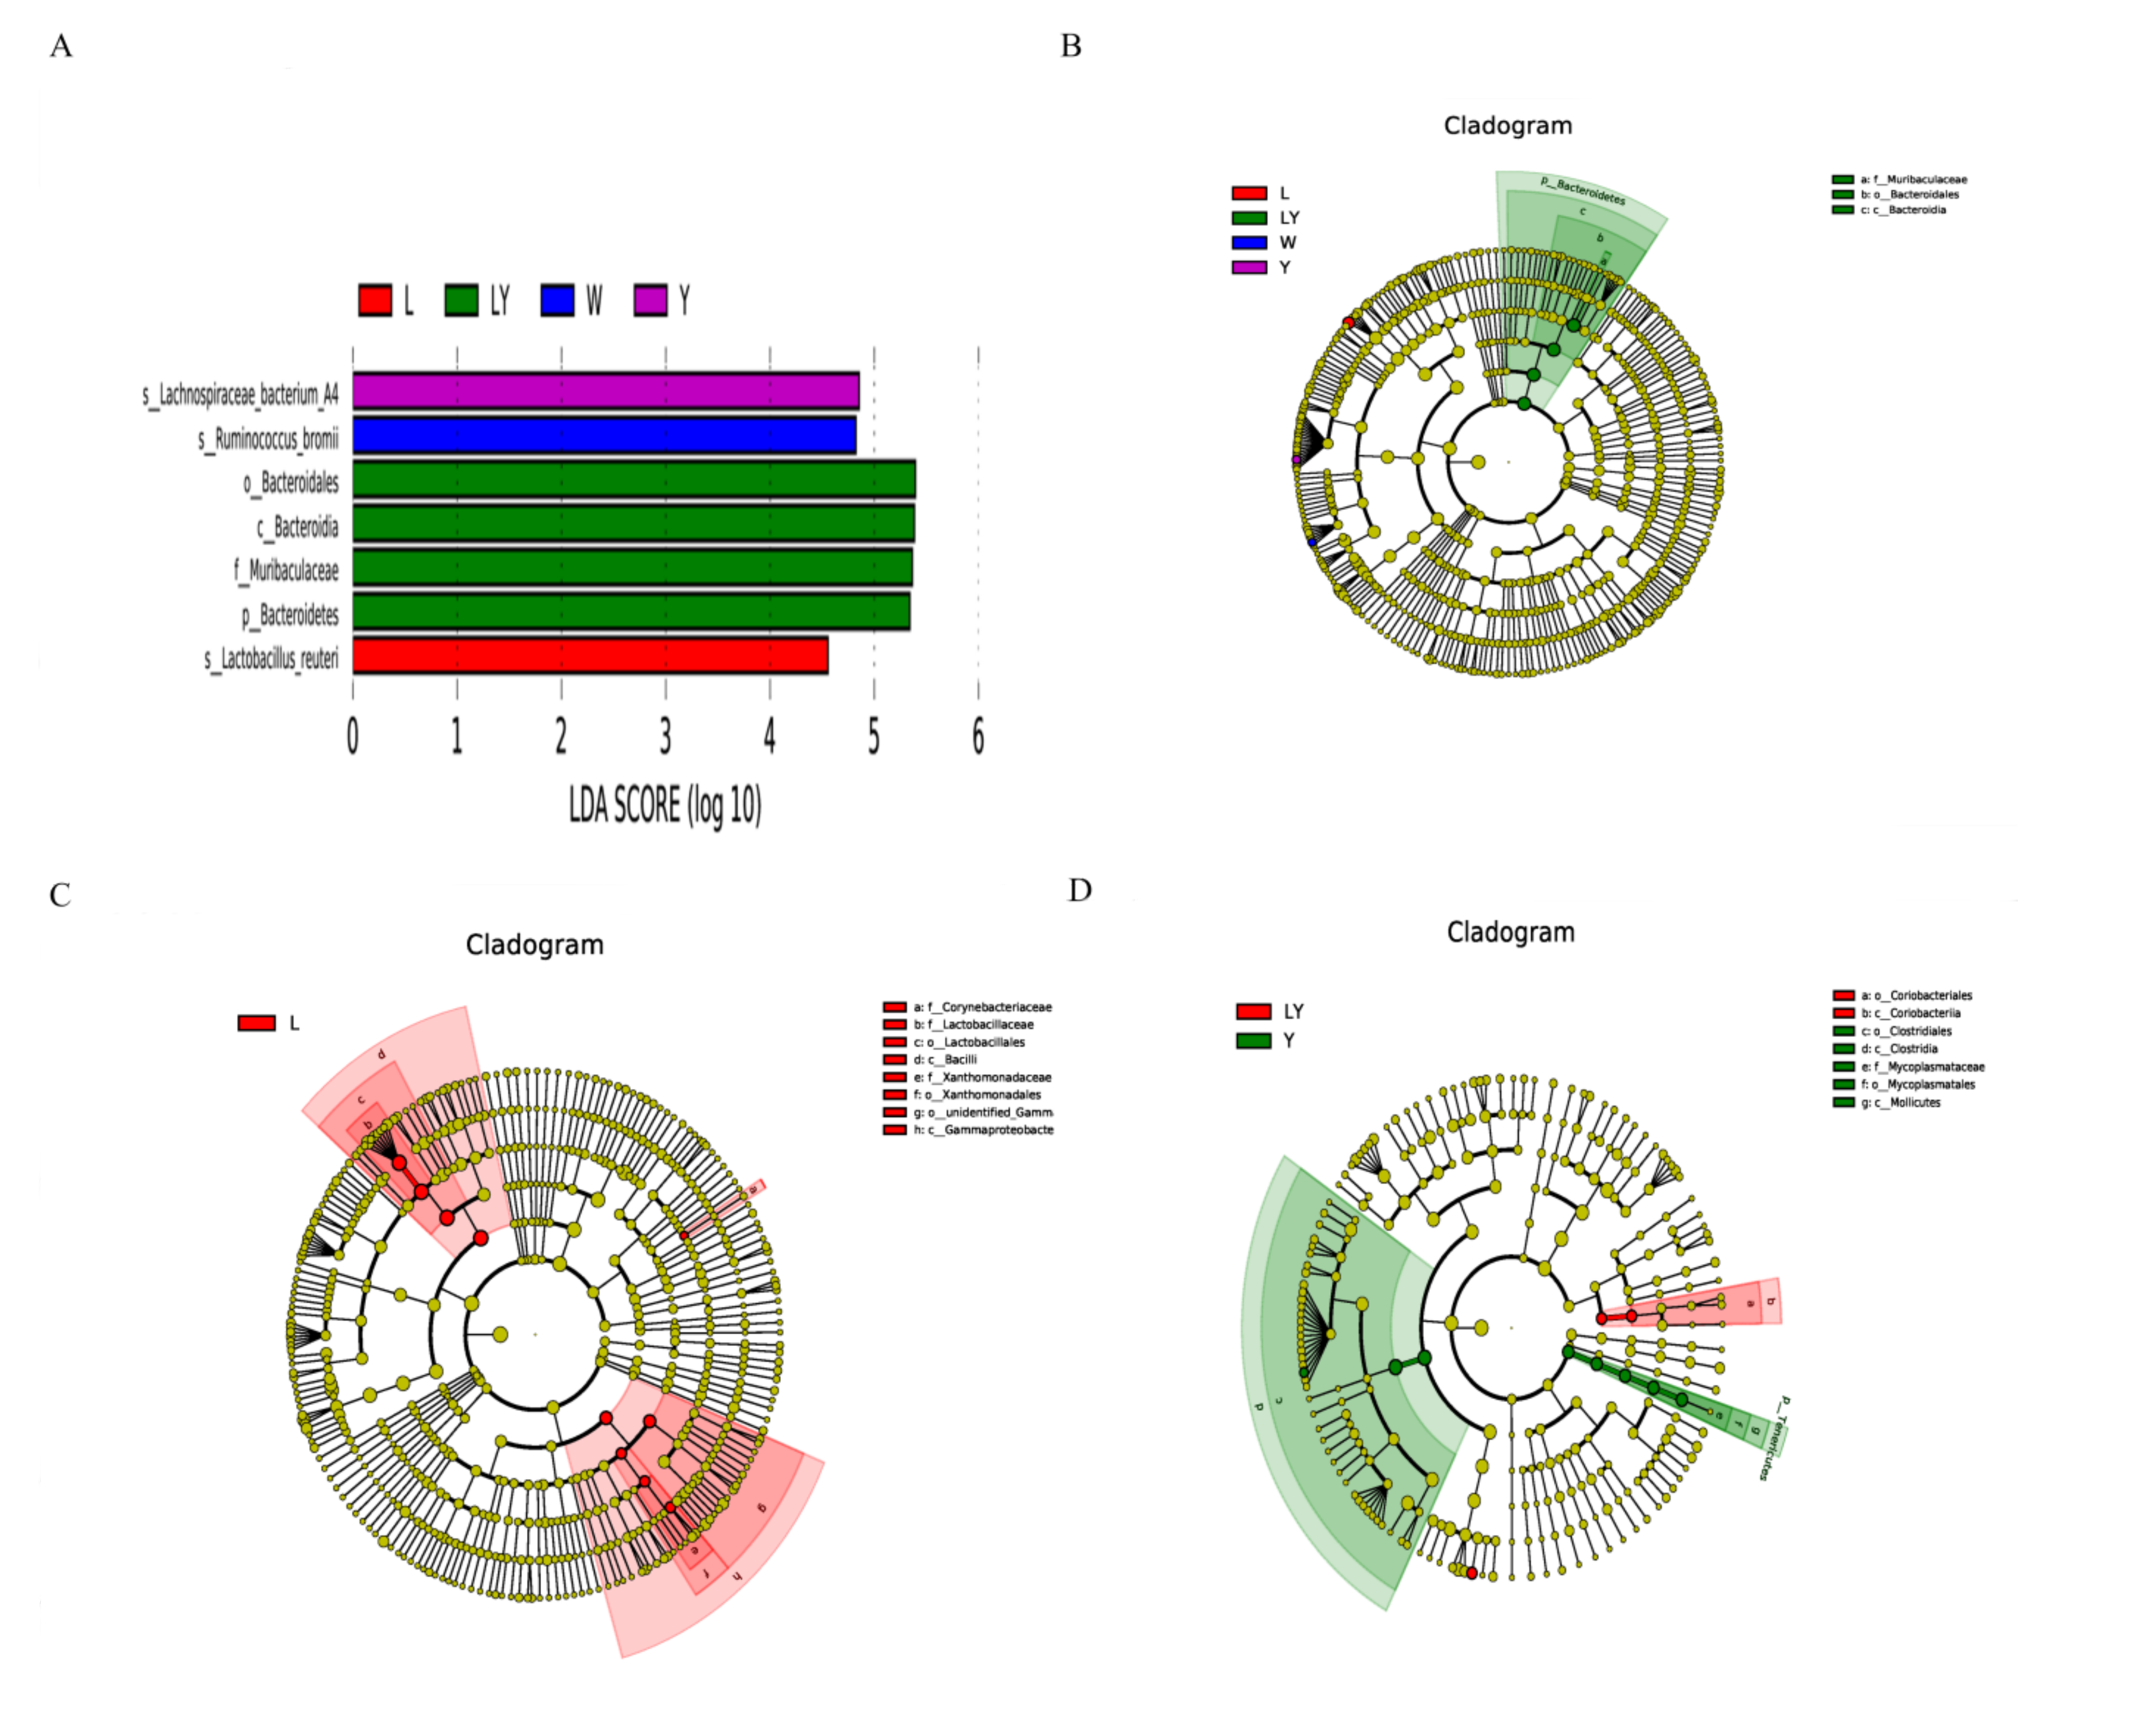
Figure 6A clearly shows the microbial species with significant differences among L-group, LY-group, Y-group, and W-group. The dominant species in Y-group, W-group, and L-group were, respectively, Lachnospiraceae bacterium, Ruminococcus bromii, and Lactobacillus reuteri. The dominant species in LY-group included Bacteroidales, Bacteroidia, Muribaculaceae, and Bacteroidetes. The microbial species with the significant abundance difference between LY-group and the other four groups were Bacteroidales, Bacteroidia, and Muribaculaceae (Figure 6B). The three dominant genera in gut Bacteroidales included Bacteroides, Parabacteroides, and Prevotella. Some species of Bacteroidales were highly abundant in the human gut and stable both over the lifetime and even across generations of human due to their ability to utilize polysaccharides [57]. Another study implied that intestinal Bacteroidales played important roles in the bioactivities of sulfated polysaccharides [58]. It was worth mentioning that the abundance of Lactobacillus reuteri (L. reuteri), which is a kind of microorganisms beneficial to the intestinal microecology, in L-group was significantly different from that in the other four groups. L. reuteri is one of the widely used probiotics in mammals [59]. L. reuteri, as a native resident in gastrointestinal tracts of human and animals, had been verified in animal experiments to be able to reduce insulin resistance, hepatic steatosis, and hyperlipidemia and prevent elevated blood sugar and related metabolic syndrome [60].
Figure 6C shows the comparison results between L-group and LY-group. The dominant microorganisms in L-group included Corynebacteriaceae, Lactobacillaceae, Lactobacillales, Bacilli, Xanthomonadaceae, Xanthomonadales, unidentified_Gammaproteobacteria, and Gammaproteobacteria. The abundances of these microorganisms in LY-group were not relatively low. Figure 6D shows the comparison results between Y-group and LY-group. The dominant microorganisms in LY-group were Coriobacteriales and Coriobacteriia, whereas the dominant microorganisms in Y-group were Clostridiales, Clostridia, Mycoplasmataceae, Mycoplasmatales, and Mollicutes. The results indicated that L. paracasei H4-11 and K. marxianus L1-1 had different effects on the gut microbiota of mice. These differences also suggested that L. paracasei H4-11 and K. marxianus L1- 1 might have an interaction mechanism, as confirmed in our previous study [20]. The interaction between the two strains affected the intestinal microecology of the mice. Similarly, Wasilewska et al. also reported that lactic acid bacteria and yeasts had a symbiotic relationship, jointly changed the composition of the gut microbiota of mice, and played an anti-inflammatory and immune role [61].
3.6. Correlation between Antioxidant Capacity, Other Parameters, and Gut Microbiota in Mice
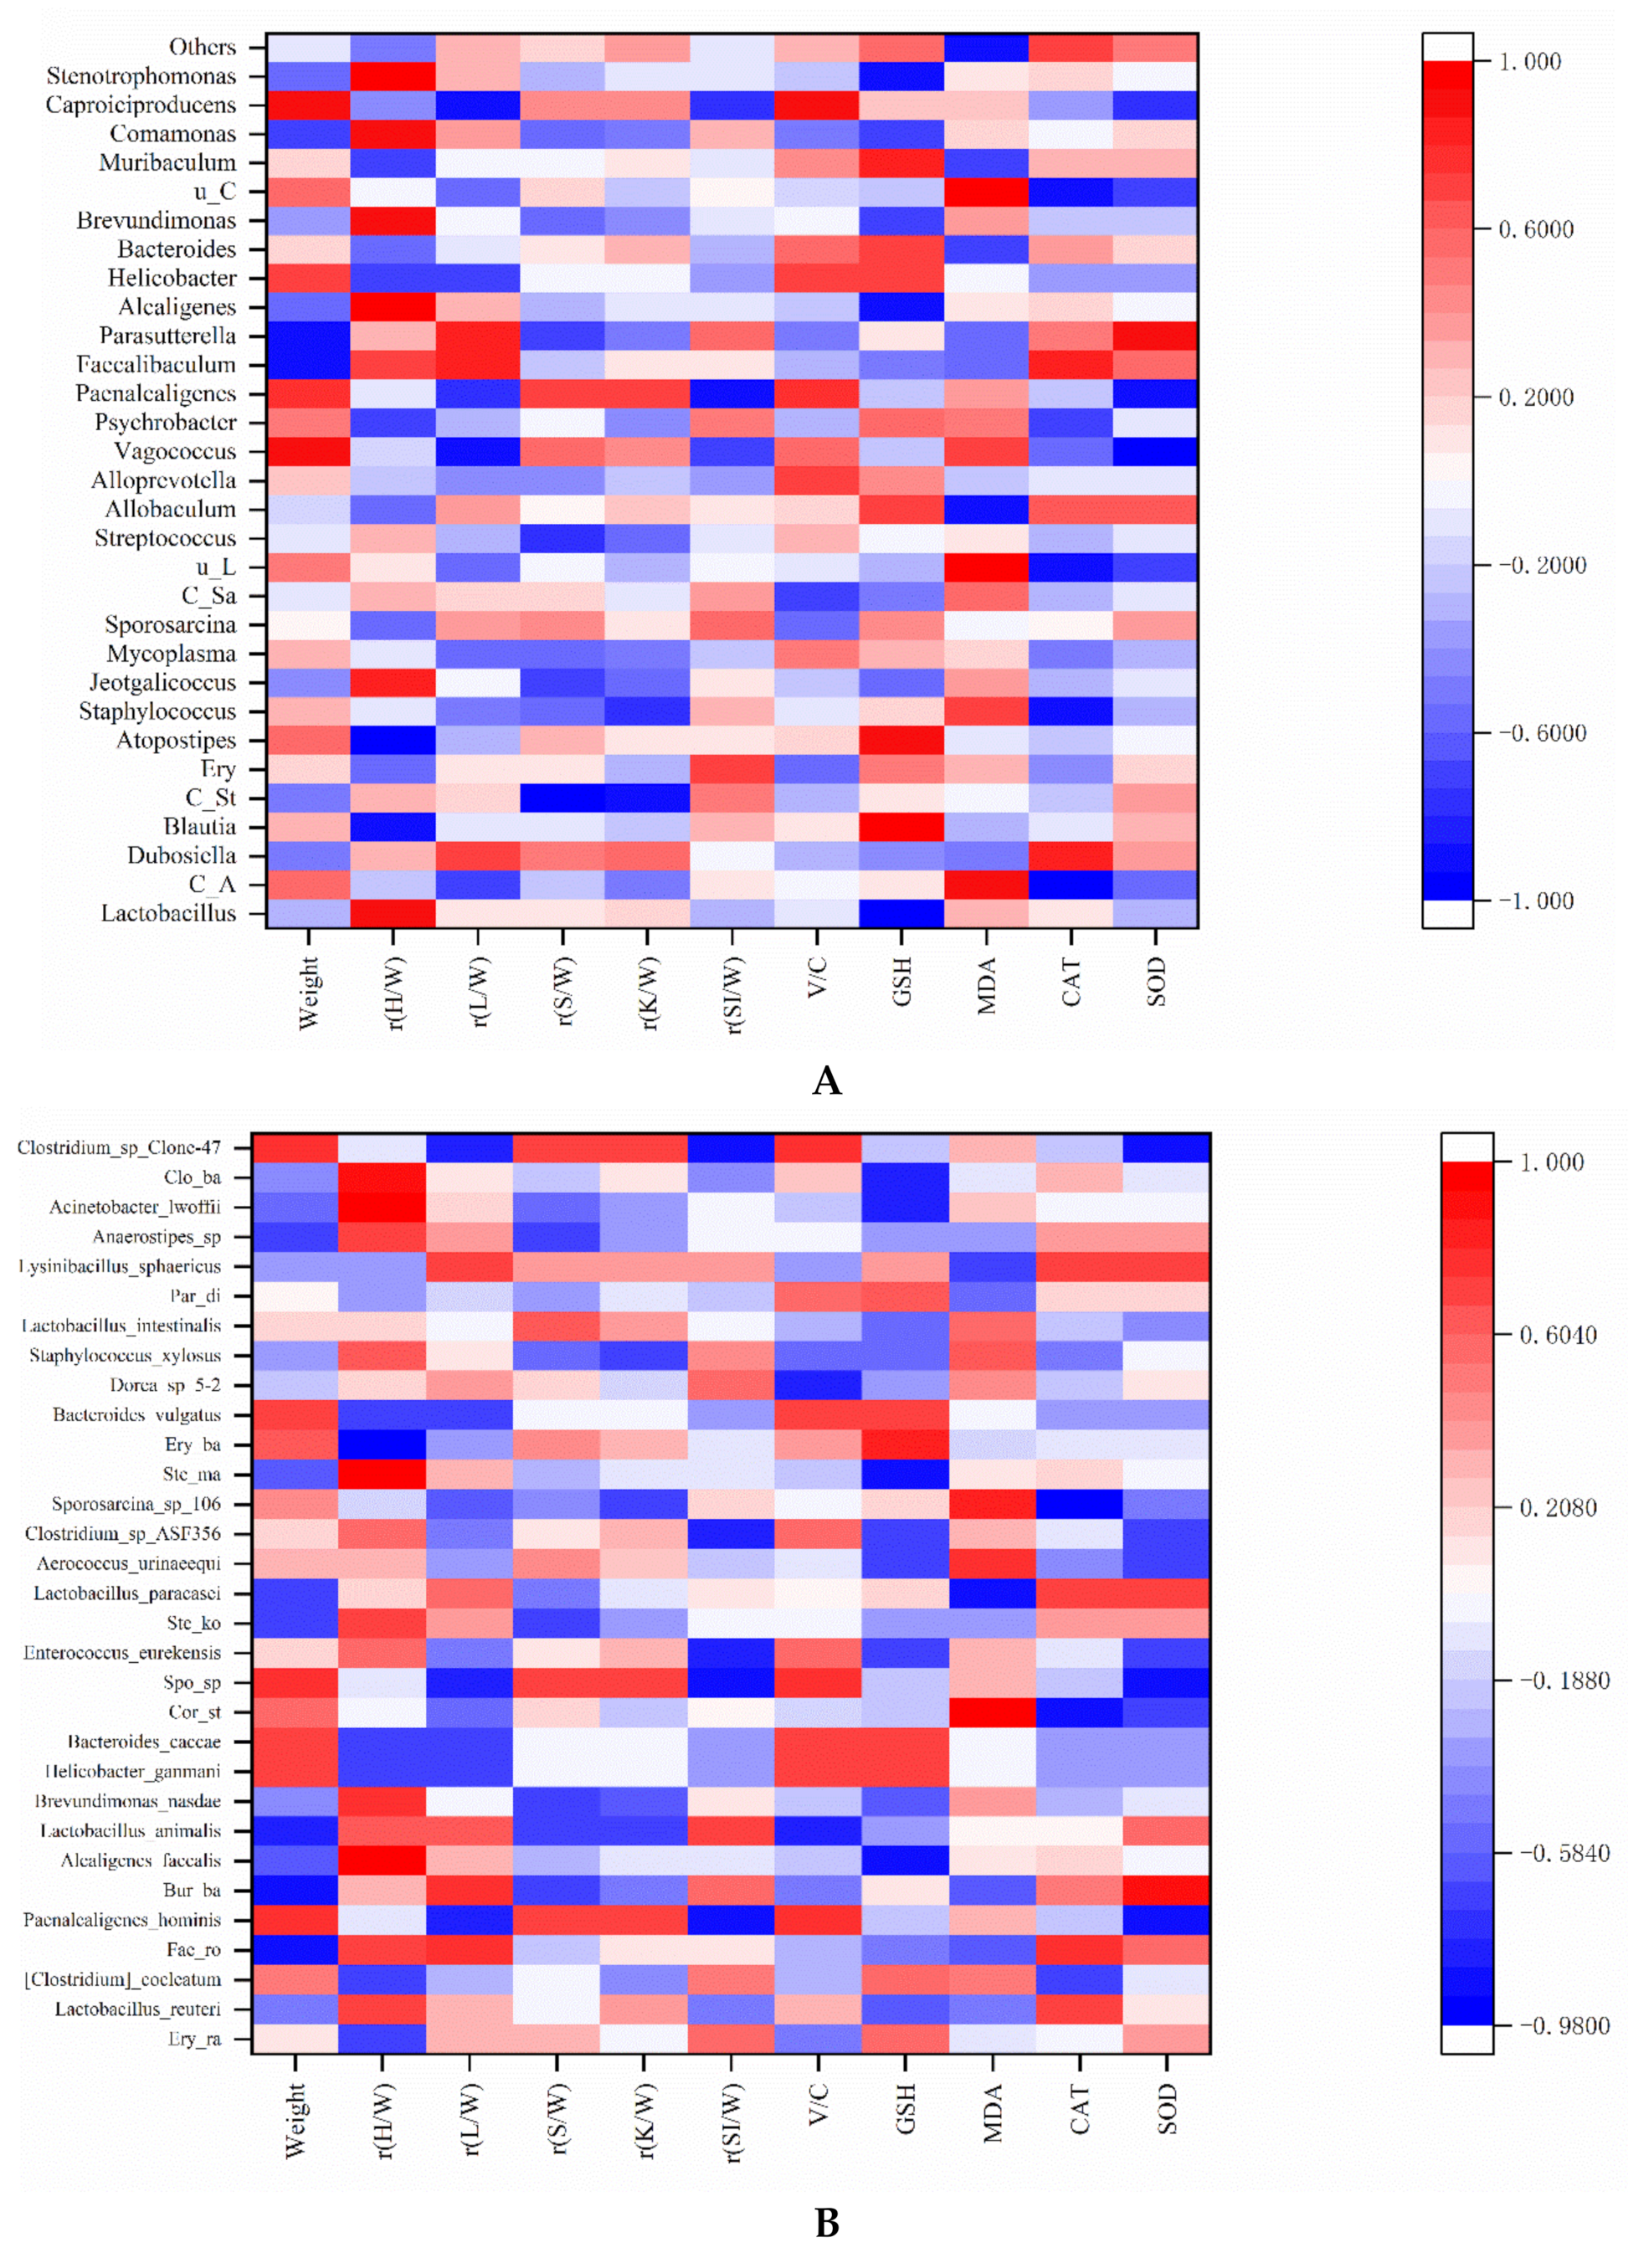
In this study, we focused the correlation between antioxidant capacity and gut microbiota. Similarly, Lee et al. used the Spearman’s rank order correlations to examine the correlation between another index (vitamin B-12 status) and the levels of antioxidant enzyme activity (SOD, CAT and GPx) and oxidative stress (MDA and Ox-LDL-C) in serum [62]. The correlations between the antioxidant capacity, other parameters (weight, relative organ weight, and villus height/crypt depth) and gut microbiota in the mice of five groups are shown in Figure 7A. At the genus level, Lactobacillus and Blautia had a significant positive correlation with relative heart weight and Candidatus_Stoquefichus had a significant positive correlation with relative kidney weight. There was a significant positive correlation between Caproiciproducens and the V/C. It was inferred that Caproiciproducens might have a positive effect on the digestion and absorption capacity of mice. Liu et al. demonstrated that the dominant genus of Caproiciproducens was a caproic acid-producing bacterium in fermented foods [63]. It was speculated that the production of caproic acid promoted the digestion and absorption capacity of mice. Atopostipes was significantly positively correlated with GSH (r = 0.9) and Parasutterella was significantly positively correlated with SOD (r = 0.9). It was inferred that these bacteria might have a certain positive effect on the improvement in antioxidant capacity. Similarity, Li et al. confirmed that Atopostipes was involved in the regulation of lipid metabolism and glucose metabolism in serum and liver of mice [64]. Therefore, the antioxidant capacity could be adjusted indirectly by Atopostipes. Another study showed that Parasutterella could improve GSH and SOD levels by regulating the distribution of gut microbiota of mice [65]. Lactobacillus did not show a significant correlation with antioxidant indicators because Lactobacillus contains different species. The correlation between Lactobacillus and antioxidant indicators required further species analysis.
In addition, Staphylococcus and unidentified_Lachnospiraceae showed a significant negative correlation with CAT (r = −0.9). Vagococcus and Paenalcaligenes showed a significant negative correlation with SOD (r = −0.9). Similarly, Alcaligenes and Stenotrophomonas were significantly negatively correlated GSH (r = −0.9). Candidatus_Arthromitus and unidentified_Corynebacteriaceae were positively correlated with MDA. At the species level (Figure 7B), Alcaligenes_faecalis was significantly negatively correlated with GSH, Erysipelotrichaceae bacterium I46 was significantly negatively correlated with GSH. Corynebacterium_stationis was positively correlated with MDA and Stenotrophomonas_maltophilia was significantly negatively correlated with CAT. The inactivation of the SmeYZ pump of Stenotrophomonas maltophilia compromised the virulence-related physiological functions of swimming, flagella formation, oxidative stress susceptibility, biofilm formation, and protease secretion and thus decreased in vivo virulence [66]. This result was consistent with the genus level of the above analysis. It was inferred that these bacteria might have a certain negative effect on the improvement in antioxidant capacity. The effect will be further explored in the future.
In this study, at the species level (Figure 7B), we found that some beneficial gut microbiota had a positive effect on the antioxidant capacity and other parameters. Faecalibaculum_rodentium and Burkholderiales_bacterium_YL45 were negatively correlated with body weight and rysipelotrichaceae_bacterium_I46 was negatively correlated with the relative heart weight. Paenalcaligenes_hominis and Sporosarcina_sp_HW10C2 were significantly negatively correlated with relative small intestine weight and SOD, respectively. Burkholderia was significantly positively correlated with SOD. Similarly, Burkholderia cenocepacia biofilms production had a significant positive correlation with antioxidant capacity (CAT value) [67]. Interestingly, it could be clearly seen that Lactobacillus paracasei was positively correlated with GSH (r = 0.2052), CAT (r = 0.71818), and SOD (r = 0.71818), and negatively correlated with MDA (r = −0.87208). The results further confirmed that rice-acid fermented with L. paracasei H4-11/(L. paracasei H4-11 and K. marxianus L1-1) might contribute to the enhancement of the antioxidant capacity of mouse serum. Notably, Lactobacillus exists in many foods and shows probiotic functions [5,6,7,8,9,10]. Gut microbiota or their metabolites (e.g., lipopolysaccharide) can be used as antigen substances to stimulate intestinal epithelial cells or immune cells and improve host immune function [68]. A recent study discovered that oral probiotics played a role in the intestinal and systemic effects of COVID-19 [69]. Therefore, probiotics may be used as a potential therapy for regulating gut microbiota and improving health. Notably, acidifiers instead of antibacterial drugs are a hot topic in the study on animal diets. The acidifiers in animal diets are well proven to reduce the incidence of diseases in animal intestinal tract, thereby improving the productive performance. Acidifiers in feed help to maintain the optimal intestinal pH for an efficient proteolytic digestive enzyme activity and antimicrobial activity against intestinal pathogens so as to reduce subclinical infection [70]. Fortified fermented rice-acid also belongs to the acidifier group. In this study, the antioxidation status, histological changes and the enhanced gut microbiota provided a new insight into the potential application of rice-acid fermented with L. paracasei H4-11/(L. paracasei H4-11 and K. marxianus L1-1) in animal diets.
4. Conclusions
In summary, we explored the positive effects of fortified fermented rice-acid on the antioxidant capacity of mouse serum and gut microbiota. The mice in L-group, LY-group, and R-group kept their weight well and had the better digestion capacity and the mice in the L-group had the better hair quality. Moreover, the inoculation of L. paracasei H4-11 and K. marxianus L1-1 increased the villus height/crypt depth of mice compared to non-inoculation group (R-group). Notably, the inoculation of L. paracasei H4-11 (L. paracasei H4-11 and K. marxianus L1-1) in fermented rice-acid enhanced the antioxidant capacity of mouse serum. Importantly, L. paracasei H4-11 and K. marxianus L1-1 might have a synergistic effect on the improvement in the antibacterial function, reduce harmful microorganisms, and increase the beneficial microorganisms in the gut microbiota of the mice. In the future, the hair characteristics of mice and the antibacterial and oxidation mechanisms of the two strains will be further explored. The study gains an insight into the development of fortified fermented rice-acid for regulating the gut microbiota and improving the antioxidant capacity.
Author Contributions
Conceptualization: N.L., L.Q. and S.M.; methodology, N.L.; formal analysis, N.L.; investigation, N.L., X.L. and Y.Z.; supervision: L.Q. and S.M.; funding acquisition: N.L. and L.Q.; writing—original draft preparation, N.L.; writing—review and editing, L.Q. and S.M. All authors have read and agreed to the published version of the manuscript.
Funding
This research was funded by National Natural Science Foundation of China (32060530), Technology platform and talent team plan of Guizhou. China ((2018)5251), Graduate Research Fund Project of Guizhou (YJSCXJH(2019)028). Industry-University-Research Cooperation Project of Guizhou University (701/700465172217) and China Scholarship Council (201906670006).
Institutional Review Board Statement
All experimental procedures were performed according to the Laboratory Animal Welfare Standards and approved by the Subcommittee of Experimental Animal Ethics, Guizhou University (NO.EAE-GZU-2021-P005).
Informed Consent Statement
Not applicable.
Data Availability Statement
The data in this study are available on request from the author.
Conflicts of Interest
The authors declare no conflict of interest.
References
- De Almada, C.N.; Almada, C.N.; Martinez, R.C.; Sant’Ana, A.S. Paraprobiotics: Evidences on their ability to modify biological responses, inactivation methods and perspectives on their application in foods. Trends Food Sci. Technol. 2016, 58, 96–114. [Google Scholar] [CrossRef]
- Tremaroli, V.; Bäckhed, F. Functional interactions between the gut microbiota and host metabolism. Nature 2012, 489, 242–249. [Google Scholar] [CrossRef]
- Turnbaugh, P.J.; Ley, R.E.; Mahowald, M.A.; Magrini, V.; Mardis, E.R.; Gordon, J.I. An obesity-associated gut microbiome with increased capacity for energy harvest. Nature 2006, 444, 1027–1031. [Google Scholar] [CrossRef] [PubMed]
- Ilango, S.; Antony, U. Probiotic microorganisms from non-dairy traditional fermented foods. Trends Food Sci. Technol. 2021, 118, 617–638. [Google Scholar] [CrossRef]
- Liu, B.; Zhang, J.; Yi, R.; Zhou, X.; Long, X.; Pan, Y.; Zhao, X. Preventive effect of Lactobacillus fermentum CQPC08 on 4-nitroquineline-1-oxide induced tongue cancer in C57BL/6 mice. Foods 2019, 8, 93. [Google Scholar] [CrossRef] [PubMed] [Green Version]
- Qian, Y.; Song, J.-L.; Yi, R.; Li, G.; Sun, P.; Zhao, X.; Huo, G. Preventive effects of Lactobacillus plantarum YS4 on constipation induced by activated carbon in mice. Appl. Sci. 2018, 8, 363. [Google Scholar] [CrossRef] [Green Version]
- Chen, X.; Zhao, X.; Wang, H.; Yang, Z.; Li, J.; Suo, H. Prevent effects of Lactobacillus fermentum HY01 on dextran sulfate sodium-induced colitis in mice. Nutrients 2017, 9, 545. [Google Scholar] [CrossRef]
- Chen, X.; Zhang, J.; Yi, R.; Mu, J.; Zhao, X.; Yang, Z. Hepatoprotective effects of Lactobacillus on carbon tetrachloride-induced acute liver injury in mice. Int. J. Mol. Sci. 2018, 19, 2212. [Google Scholar] [CrossRef] [Green Version]
- Chen, X.; Tan, F.; Yi, R.; Mu, J.; Zhao, X.; Yang, Z. Effects of Lactobacillus on mice with diabetes induced by high-fat diet with streptozotocin (STZ). Appl. Sci. 2018, 8, 1249. [Google Scholar] [CrossRef] [Green Version]
- Canaviri-Paz, P.; Oscarsson, E.; Kjellström, A.; Olsson, H.; Jois, C.; Håkansson, Å. Effects on microbiota composition after consumption of quinoa beverage fermented by a novel xylose-metabolizing L. plantarum strain. Nutrients 2021, 13, 3318. [Google Scholar] [CrossRef]
- Cömert, E.D.; Gökmen, V. Evolution of food antioxidants as a core topic of food science for a century. Food Res. Int. 2018, 105, 76–93. [Google Scholar] [CrossRef]
- Neta, M.C.A.; de Queiroga, A.P.R.; Almeida, R.L.J.; Soares, A.C.; Gonçalves, J.M.; Fernandes, S.S.; de Sousa, M.C.; dos Santos, K.M.O.; Buriti, F.C.A.; Florentino, E.R. Fermented dessert with whey, ingredients from the peel of jabuticaba (Myrciaria cauliflora) and an indigenous culture of Lactobacillus plantarum: Composition, microbial viability, antioxidant capacity and sensory features. Nutrients 2018, 10, 1214. [Google Scholar] [CrossRef] [Green Version]
- Ishikawa, H.; Mutoh, M.; Yoshimura, K.; Fujii, G.; Nakamura, T.; Takeshita, T.; Wakabayashi, K.; Sakai, T. Very long-term treatment with a Lactobacillus probiotic preparation, Lactobacillus Casei strain shirota, suppresses weight loss in the elderly. Nutrients 2020, 12, 1599. [Google Scholar] [CrossRef]
- Zhang, H.; Xu, J.; Chen, Q.; Wang, H.; Kong, B. Physiological, morphological and antioxidant responses of Pediococcus pentosaceus R1 and Lactobacillus fermentum R6 isolated from Harbin dry sausages to oxidative stress. Foods 2021, 10, 1203. [Google Scholar] [CrossRef] [PubMed]
- Liu, L.; Zhang, C.; Zhang, H.; Qu, G.; Li, C.; Liu, L. Biotransformation of polyphenols in apple pomace fermented by-glucosidase-producing Lactobacillus rhamnosus L08. Foods 2021, 10, 1343. [Google Scholar] [CrossRef]
- Li, K.J.; Borresen, E.C.; Jenkins-Puccetti, N.; Luckasen, G.; Ryan, E.P. Navy bean and rice bran intake alters the plasma metabolome of children at risk for cardiovascular disease. Front. Nutr. 2018, 4, 71. [Google Scholar] [CrossRef] [PubMed]
- Sen, S.; Chakraborty, R.; Kalita, P. Rice-not just a staple food: A comprehensive review on its phytochemicals and therapeutic potential. Trends. Food Sci. Technol. 2020, 97, 265–285. [Google Scholar] [CrossRef]
- Simonson, W. Slow progress towards prevention and treatment of Alzheimer’s disease. Geriatr. Nurs. 2018, 39, 597–598. [Google Scholar] [CrossRef]
- Liu, N.; Qin, L.; Lu, X.; Zhao, Y.; Miao, S. Physicochemical components and flavor properties of acid rice soup (rice-acid) fermented with Lactobacillus paracasei and/or Kluyveromyces marxianus. Food Biosci. 2021, 43, 101278. [Google Scholar] [CrossRef]
- Liu, N.; Qin, L.; Mazhar, M.; Miao, S. Integrative transcriptomic-proteomic analysis revealed the flavor formation mechanism and antioxidant activity in rice-acid inoculated with Lactobacillus paracasei and Kluyveromyces marxianus. J. Proteomics 2021, 238, 104158. [Google Scholar] [CrossRef]
- Pierzynowska, K.; Podlacha, M.; Uszczek, D.; Rintz, E.; Wgrzyn, G. Hair dysmorphology in the r6/1 and r6/2 mouse models of huntington’s disease. Gene 2020, 765, 145133. [Google Scholar] [CrossRef]
- Þórhallsdóttir, R.; Walser, J.W., III; Kristjánsdóttir, S.; Anamthawat-Jónsson, K. SEM analysis of an archaeological hair sample from East-Iceland and comparative samples from nine modern-day species of mammals from the region. J. Archaeol. Sci. Rep. 2019, 24, 24–29. [Google Scholar] [CrossRef]
- Hu, M.; Wu, X.; Luo, M.; Wei, H.; Xu, D.; Xu, F. Lactobacillus rhamnosus FLRH93 protects against intestinal damage in mice induced by 5-fluorouracil. J. Dairy Sci. 2020, 103, 5003–5018. [Google Scholar] [CrossRef] [PubMed]
- Guo, C.E.; Cui, Q.; Cheng, J.; Chen, J.; Zhao, Z.; Guo, R.; Dai, X.; Wei, Z.J.; Li, W. Probiotic-fermented Chinese dwarf cherry [Cerasus humilis (Bge.) Sok.] juice modulates the intestinal mucosal barrier and increases the abundance of Akkermansia in the gut in association with polyphenols. J. Funct. Foods 2021, 80, 104424. [Google Scholar] [CrossRef]
- de Winter, J.C.F.; Gosling, S.D.; Potter, J. Comparing the Pearson and Spearman correlation coefficients across distributions and sample sizes: A tutorial using simulations and empirical data. Psychol. Methods 2016, 21, 273–290. [Google Scholar] [CrossRef]
- Han, D.M.; Chun, B.H.; Kim, H.M.; Jeon, C.O. Characterization and correlation of microbial communities and metabolite and volatile compounds in doenjang fermentation. Food Res. Int. 2021, 148, 110645. [Google Scholar] [CrossRef]
- Zhang, Q.; Chen, X.; Ding, Y.; Ke, Z.; Zhou, X.; Zhang, J. Diversity and succession of the microbial community and its correlation with lipid oxidation in dry-cured black carp (Mylopharyngodon piceus) during storage. Food Microbiol. 2021, 98, 103686. [Google Scholar] [CrossRef] [PubMed]
- Fujii, T.; Mashimo, M.; Moriwaki, Y.; Misawa, H.; Ono, S.; Horiguchi, K.; Kawashima, K. Expression and function of the cholinergic system in immune cells. Front. Immunol. 2017, 8, 1085. [Google Scholar] [CrossRef] [Green Version]
- Guglielmi, V.; D’Adamo, M.; Bellia, A.; Ciotto, R.T.; Federici, M.; Lauro, D.; Sbraccia, P. Iron status in obesity: An independent association with metabolic parameters and effect of weight loss. Nutr. Metab. Cardiovasc. Dis. 2015, 25, 541–547. [Google Scholar] [CrossRef]
- O’Connor, K.; Goldberg, L.J. Nutrition and Hair. Clin. Dermatol. 2021, 10, 48. [Google Scholar] [CrossRef] [PubMed]
- Yang, J.J.; Kun, Q.I.A.N.; Dong, W.U.; Zhang, W.; Wu, Y.J.; Xu, Y.Y. Effects of different proportions of two Bacillus sp. on the growth performance, small intestinal morphology, caecal microbiota and plasma biochemical profile of Chinese Huainan Partridge Shank chickens. J. Integr. Agric. 2017, 16, 1383–1392. [Google Scholar] [CrossRef]
- Van Keulen, P.; Khan, M.A.; Dijkstra, J.; Knol, F.; McCoard, S.A. Effect of arginine or glutamine supplementation and milk feeding allowance on small intestine development in calves. J. Dairy Sci. 2020, 103, 4754–4764. [Google Scholar] [CrossRef] [PubMed]
- Cucick, A.C.C.; Gianni, K.; Todorov, S.D.; de LeBlanc, A.D.M.; LeBlanc, J.; Franco, B.D. Evaluation of the bioavailability and intestinal effects of milk fermented by folate producing lactic acid bacteria in a depletion/repletion mice model. J. Funct. Foods 2020, 66, 103785. [Google Scholar] [CrossRef]
- Carrizo, S.L.; de LeBlanc, A.D.M.; LeBlanc, J.G.; Rollán, G.C. Quinoa pasta fermented with lactic acid bacteria prevents nutritional deficiencies in mice. Food Res. Int. 2020, 127, 108735. [Google Scholar] [CrossRef] [PubMed]
- Liu, K.; Du, R.; Chen, F. Stability of the antioxidant peptide SeMet-Pro-Ser identified from selenized brown rice protein hydrolysates. Food Chem. 2020, 319, 126540. [Google Scholar] [CrossRef] [PubMed]
- Yi, Y.; Xu, W.; Fan, Y.; Wang, H.X. Drosophila as an emerging model organism for studies of food-derived antioxidants. Food Res. Int. 2021, 143, 110307. [Google Scholar] [CrossRef] [PubMed]
- Ulgen, C.; Yildirim, A.B.; Sahin, G.; Turker, A.U. Do magnetic field applications affect in vitro regeneration, growth, phenolic profiles, antioxidant potential and defense enzyme activities (SOD, CAT and PAL) in lemon balm (Melissa officinalis L.)? Ind. Crop. Prod. 2021, 169, 113624. [Google Scholar] [CrossRef]
- Zhang, L.; Gui, S.; Wang, J.; Chen, Q.; Zeng, J.; Liu, A.; Chen, Z.; Lu, X. Oral administration of green tea polyphenols (tp) improves ileal injury and intestinal flora disorder in mice with salmonella typhimurium infection via resisting inflammation, enhancing antioxidant action and preserving tight junction. J. Funct. Foods 2020, 64, 103654. [Google Scholar] [CrossRef]
- Tan, B.L.; Norhaizan, M.E.; Liew, W.P.P.; Sulaiman Rahman, H. Antioxidant and oxidative stress: A mutual interplay in age-related diseases. Front. Pharmacol. 2018, 9, 1162. [Google Scholar] [CrossRef] [Green Version]
- Neha, K.; Haider, M.R.; Pathak, A.; Yar, M.S. Medicinal prospects of antioxidants: A review. Eur. J. Med. Chem. 2019, 178, 687–704. [Google Scholar] [CrossRef]
- Govindan, S.; Jayabal, A.; Shanmugam, J.; Ramani, P. Antioxidant and hepatoprotective effects of Hypsizygus ulmarius polysaccharide on alcoholic liver injury in rats. Food Sci. Hum. Wellness 2021, 10, 523–535. [Google Scholar] [CrossRef]
- Malyar, R.M.; Li, H.; Liu, D.; Abdulrahim, Y.; Farid, R.A.; Gan, F.; Ali, W.; Enayatullah, H.; Banuree, S.A.H.; Huang, K.; et al. Selenium/Zinc-Enriched probiotics improve serum enzyme activity, antioxidant ability, inflammatory factors and related gene expression of Wistar rats inflated under heat stress. Life Sci. 2020, 248, 117464. [Google Scholar] [CrossRef]
- Wang, A.; Xiao, C.; Zheng, J.; Ye, C.; Dai, Z.; Wu, Q.; Liu, J.; Strappe, P.; Zhou, Z. Terpenoids of Ganoderma lucidum reverse cognitive impairment through attenuating neurodegeneration via suppression of PI3K/AKT/mTOR expression in vivo model. J. Funct. Foods 2020, 73, 104142. [Google Scholar] [CrossRef]
- Khurelchuluun, A.; Uehara, O.; Paudel, D.; Morikawa, T.; Kawano, Y.; Sakata, M.; Shibata, H.; Yoshida, K.; Sato, J.; Miura, H.; et al. Bee pollen diet alters the bacterial flora and antimicrobial peptides in the oral cavities of mice. Foods 2021, 10, 1282. [Google Scholar] [CrossRef]
- Demirci, M.; Tokman, H.B.; Taner, Z.; Keskin, F.E.; Çağatay, P.; Bakar, Y.O.; Özyazare, M.; Kirazf, N.; Kocazeybek, B.S. Bacteroidetes and Firmicutes levels in gut microbiota and effects of hosts TLR2/TLR4 gene expression levels in adult type 1 diabetes patients in Istanbul, Turkey. J. Diabetes Complicat. 2020, 34, 107449. [Google Scholar] [CrossRef]
- Bäckhed, F.; Ding, H.; Wang, T.; Hooper, L.V.; Koh, G.Y.; Nagy, A.; Semenkovich, C.F.; Gordon, J.I. The gut microbiota as an environmental factor that regulates fat storage. Proc. Natl. Acad. Sci. USA 2004, 101, 15718–15723. [Google Scholar] [CrossRef] [Green Version]
- Ley, R.E.; Turnbaugh, P.J.; Klein, S.; Gordon, J.I. Human gut microbes associated with obesity. Nature 2006, 444, 1022–1023. [Google Scholar] [CrossRef] [PubMed]
- Soares, M.B.; Martinez, R.C.; Pereira, E.P.; Balthazar, C.F.; Cruz, A.G.; Ranadheera, C.S.; Sant’Ana, A.S. The resistance of Bacillus, Bifidobacterium, and Lactobacillus strains with claimed probiotic properties in different food matrices exposed to simulated gastrointestinal tract conditions. Food Res. Int. 2019, 125, 108542. [Google Scholar] [CrossRef] [PubMed]
- Tintore, M.; Colome, G.; Santas, J.; Espadaler, J. Gut microbiota dysbiosis and role of probiotics in infant colic. Arch. Clin. Microbiol. 2017, 8, 56. [Google Scholar]
- Liu, X.; Mao, B.; Gu, J.; Wu, J.; Cui, S.; Wang, G.; Zhao, J.; Zhang, H.; Chen, W. Blautia—A new functional genus with potential probiotic properties? Gut Microbes 2021, 13, 1875796. [Google Scholar] [CrossRef] [PubMed]
- Wang, M.; Chen, Y.; Wang, Y.; Li, Y.; Zhang, X.; Zheng, H.; Ma, F.; Ma, C.; Lu, B.; Xie, Z.; et al. Beneficial changes of gut microbiota and metabolism in weaned rats with Lactobacillus acidophilus NCFM and Bifidobacterium lactis Bi-07 supplementation. J. Funct. Foods 2018, 48, 252–265. [Google Scholar] [CrossRef]
- Cox, L.M.; Sohn, J.; Tyrrell, K.L.; Citron, D.M.; Lawson, P.A.; Pate, N.B.; Iizumi, T.; Perez-Perez, G.I.; Goldstein, E.J.C.; Blaser, M.J. Description of two novel members of the family Erysipelotrichaceae: Ileibacterium valens gen. nov., sp. nov. and Dubosiella newyorkensis, gen. nov., sp. nov., from the murine intestine, and emendation to the description of Faecalibacterium rodentium. Int. J. Syst. Evol. Microbiol. 2017, 67, 1247–1254. [Google Scholar] [CrossRef] [PubMed]
- Chu, Y.; Sun, S.; Huang, Y.; Gao, Q.; Xie, X.; Wang, P.; Li, J.; Liang, L.; He, X.; Jiang, Y.; et al. Metagenomic analysis revealed the potential role of gut microbiome in gout. NPJ Biofilms Microbi 2021, 7, 66. [Google Scholar] [CrossRef]
- Yang, S.; Wang, G.; Ma, Z.F.; Qin, L.; Zhai, Y.; Yu, Z.; Xue, M.; Zhang, Y.; Wan, Z. Dietary advanced glycation end products–induced cognitive impairment in aged ICR mice: Protective pole of quercetin. Mol. Nutr. Food Res. 2020, 64, 1901019. [Google Scholar] [CrossRef] [PubMed]
- van Dongen, K.C.; Linkens, A.M.; Wetzels, S.M.; Wouters, K.; Vanmierlo, T.; van de Waarenburg, M.P.; Scheijen, L.J.M.J.; de Vos, W.M.; Belzer, C.; Schalkwijk, C.G. Dietary advanced glycation endproducts (AGEs) increase their concentration in plasma and tissues, result in inflammation and modulate gut microbial composition in mice; evidence for reversibility. Food Res. Int. 2021, 147, 110547. [Google Scholar] [CrossRef]
- Tian, X.; Ding, Y.; Kong, Y.; Wang, G.; Wang, S.; Cheng, D. Purslane (Portulacae oleracea L.) attenuates cadmium-induced hepatorenal and colonic damage in mice: Role of chelation, antioxidant and intestinal microecological regulation. Phytomedicine 2021, 92, 153716. [Google Scholar] [CrossRef] [PubMed]
- El Kaoutari, A.; Armougom, F.; Gordon, J.I.; Raoult, D.; Henrissat, B. The abundance and variety of carbohydrate-active enzymes in the human gut microbiota. Nat. Rev. Microbiol. 2013, 11, 497–504. [Google Scholar] [CrossRef]
- Sun, X.; Liu, Y.; Jiang, P.; Song, S.; Ai, C. Interaction of sulfated polysaccharides with intestinal Bacteroidales plays an important role in its biological activities. Int. J. Biol. Macromol. 2021, 168, 496–506. [Google Scholar] [CrossRef] [PubMed]
- Yang, B.; Zheng, F.; Stanton, C.; Ross, R.P.; Zhao, J.; Zhang, H.; Chen, W. Lactobacillus reuteri FYNLJ109L1 attenuating metabolic syndrome in mice via gut microbiota modulation and alleviating inflammation. Foods 2021, 10, 2081. [Google Scholar] [CrossRef] [PubMed]
- Hsieh, F.C.; Lee, C.L.; Chai, C.Y.; Chen, W.T.; Lu, Y.C.; Wu, C.S. Oral administration of Lactobacillus reuteri GMNL-263 improves insulin resistance and ameliorates hepatic steatosis in high fructose-fed rats. Nutr. Metab. 2013, 10, 35. [Google Scholar] [CrossRef] [Green Version]
- Wasilewska, E.; Zlotkowska, D.; Wroblewska, B. Yogurt starter cultures of streptococcus thermophilus and lactobacillus bulgaricus ameliorate symptoms and modulate the immune response in a mouse model of dextran sulfate sodium-induced colitis. J. Dairy Sci. 2019, 102, 37–53. [Google Scholar] [CrossRef] [Green Version]
- Lee, Y.J.; Wang, M.Y.; Lin, M.C.; Lin, P.T. Associations between vitamin B-12 status and oxidative stress and inflammation in diabetic vegetarians and omnivores. Nutrients 2016, 8, 118. [Google Scholar] [CrossRef] [Green Version]
- Liu, M.K.; Tang, Y.M.; Guo, X.J.; Zhao, K.; Tian, X.H.; Liu, Y.; Yao, W.C.; Deng, B.; Ren, D.Q.; Zhang, X.P. Deep sequencing reveals high bacterial diversity and phylogenetic novelty in pit mud from Luzhou Laojiao cellars for Chinese strong-flavor Baijiu. Food Res. Int. 2017, 102, 68–76. [Google Scholar] [CrossRef]
- Li, T.T.; Huang, Z.R.; Jia, R.B.; Lv, X.C.; Zhao, C.; Liu, B. Spirulina platensis polysaccharides attenuate lipid and carbohydrate metabolism disorder in high-sucrose and high-fat diet-fed rats in association with intestinal microbiota. Food Res. Int. 2021, 147, 110530. [Google Scholar] [CrossRef] [PubMed]
- Sang, L.; Kang, K.; Sun, Y.; Li, Y.; Chang, B. Foxo4 ameliorates alcohol-induced chronic liver injury via inhibiting nf-κb and modulating gut microbiota in c57bl/6j mice. Int. Immunopharmacol. 2021, 96, 107572. [Google Scholar] [CrossRef] [PubMed]
- Lin, Y.T.; Huang, Y.W.; Chen, S.J.; Chang, C.W.; Yang, T.C. The SmeYZ efflux pump of Stenotrophomonas maltophilia contributes to drug resistance, virulence-related characteristics, and virulence in mice. Antimicrob. Agents Chemother. 2015, 59, 4067–4073. [Google Scholar] [CrossRef] [PubMed] [Green Version]
- Alshraiedeh, N.H.; Higginbotham, S.; Flynn, P.B.; Alkawareek, M.Y.; Tunney, M.M.; Gorman, S.P.; Graham, W.G.; Gilmore, B.F. Eradication and phenotypic tolerance of Burkholderia cenocepacia biofilms exposed to atmospheric pressure non-thermal plasma. Int. J. Antimicrob. Agents 2016, 47, 446–450. [Google Scholar] [CrossRef]
- Feng, W.; Ao, H.; Peng, C.; Yan, D. Gut microbiota, a new frontier to understand traditional Chinese medicines. Pharmacol. Res. 2019, 142, 176–191. [Google Scholar] [CrossRef]
- Infusino, F.; Marazzato, M.; Mancone, M.; Fedele, F.; Mastroianni, C.M.; Severino, P.; Ceccarelli, G.; Santinelli, L.; Cavarretta, E.; Marullo, A.G.M.; et al. Diet supplementation, probiotics, and nutraceuticals in SARS-CoV-2 infection: A scoping review. Nutrients 2020, 12, 1718. [Google Scholar] [CrossRef]
- Dittoe, D.K.; Ricke, S.C.; Kiess, A.S. Organic acids and potential for modifying the avian gastrointestinal tract and reducing pathogens and disease. Front. Vet. Sci. 2018, 5, 216. [Google Scholar] [CrossRef]
Figure 1.
Schematic diagram indicating fortified fermented rice-acid, 0.85% sterile saline solution and rice soup intervention of the mice. Each group took the fortified fermented rice-acid, 0.85% sterile saline solution or rice soup for ten days, respectively.
Figure 1.
Schematic diagram indicating fortified fermented rice-acid, 0.85% sterile saline solution and rice soup intervention of the mice. Each group took the fortified fermented rice-acid, 0.85% sterile saline solution or rice soup for ten days, respectively.

Figure 2.
The hair characteristics of mice (A–E refer to L-group, Y-group, LY-group, R-group and W-group, respectively, (1)–(3) refer to the head, middle and tail of the mice tail, respectively).
Figure 2.
The hair characteristics of mice (A–E refer to L-group, Y-group, LY-group, R-group and W-group, respectively, (1)–(3) refer to the head, middle and tail of the mice tail, respectively).

Figure 3.
The morphology of terminal ileum (100×) in each group (A–E refer to L-group, Y-group, LY-group, R-group and W-group, respectively, (1)–(3) refer to three 100× field of view).
Figure 3.
The morphology of terminal ileum (100×) in each group (A–E refer to L-group, Y-group, LY-group, R-group and W-group, respectively, (1)–(3) refer to three 100× field of view).

Figure 4.
Species distribution of intestinal flora of mice in different experimental groups (L-group, Y-group, LY-group, R-group and W-group) (A) Venn diagram, (B) Unweighted Pair-group Method with Arithmetic Means (UPGMA) clustering tree based on Unweighted Unifrac distance, (C) Non-Metric Multi-Dimensional Scaling (NMDS) analysis (MDS1 is the abbreviation of Multi-Dimensional Scaling 1 and MDS2 is the abbreviation of Multi-Dimensional Scaling 2).

Figure 5.
Microbial distribution of mice’s intestinal flora in different experimental groups (L-group, Y-group, LY-group, R-group and W-group): (A) phylum level, (B) genus level, (C) genus level evolutionary tree, (D) species level.
Figure 5.
Microbial distribution of mice’s intestinal flora in different experimental groups (L-group, Y-group, LY-group, R-group and W-group): (A) phylum level, (B) genus level, (C) genus level evolutionary tree, (D) species level.

Figure 6.
(A) Linear discriminant analysis (LDA) discriminant histogram of different experimental groups (L-group, Y-group, LY-group, R-group and W-group), (B) LDA Effect Size (LEfSe) multi-level classification tree diagram of different experimental groups (L-group, Y-group, LY-group, R-group and W-group), (C) LEfSe multi-level classification tree diagram of L-group and LY-group, (D) LEfSe multi-level classification tree diagram of Y-group and LY-group.

Figure 7.
Heatmaps of Spearman’s correlation coefficient of relative abundance microbial composition data (A) genus level, (B) species level with parameters related to the characteristics of mice’s body characteristics and antioxidant ability of mice’s serum. The full names and abbreviations are as follows, and the abbreviations of the previous nouns are in parentheses. Relative heart weight (r(H/W)), Relative liver weight (r(L/W)), Relative spleen weight (r(S/W)), Relative kidney weight (r(K/W)), Relative small intestine weight (r(SI/W)), Villus height/crypt depth (V/C), Candidatus_Arthromitus (C_A), Candidatus_Stoquefichus (C_St), Erysipelatoclostridium (Ery), Candidatus_Saccharimonas (C_Sa), unidentified_Lachnospiraceae (u_L), unidentified_Corynebacteriaceae (u_C), Erysipelatoclostridium_ramosum (Ery_ra), Faecalibaculum_rodentium (Fae_ro), Burkholderiales_bacterium_YL45 (Bur_ba), Corynebacterium_stationis (Cor_st), Sporosarcina_sp_HW10C2 (Spo_sp), Stenotrophomonas_koreensis (Ste_ko), Stenotrophomonas_maltophilia (Ste_ma), Erysipelotrichaceae_bacterium_I46 (Ery_ba), Parabacteroides_distasonis (Par_di), and Clostridiales_bacterium_CIEAF_022 (Clo_ba).


Table 1.
The body weight and the organ coefficient of mice in different experimental groups (L-group, Y-group, LY-group, R-group and W-group).
Table 1.
The body weight and the organ coefficient of mice in different experimental groups (L-group, Y-group, LY-group, R-group and W-group).
| Group | Weight (g) | Relative Heart Weight (mg/g) | Relative Liver Weight (mg/g) | Relative Spleen Weight (mg/g) | Relative Kidney Weight (mg/g) | Relative Small Intestine Weight (mg/g) |
|---|---|---|---|---|---|---|
| L-group | 35.10 ± 0.90 b | 5.41 ± 0.56 a | 40.53 ± 3.79 b | 3.38 ± 0.49 a | 16.57 ± 1.67 b | 39.05 ± 2.40 b |
| Y-group | 38.81 ± 3.48 a | 5.02 ± 0.43 b | 38.80 ± 3.25 c | 3.10 ± 1.12 ab | 16.70 ± 7.05 b | 36.61 ± 8.29 c |
| LY-group | 35.11 ± 1.21 b | 5.03 ± 0.63 b | 41.63 ± 2.97 a | 3.19 ± 0.97 ab | 16.75 ± 1.43 b | 39.96 ± 5.40 b |
| R-group | 35.93 ± 1.74 b | 5.08 ± 0.78 b | 40.20 ± 3.32 b | 3.18 ± 0.49 ab | 16.42 ± 1.27 b | 41.95 ± 7.06 a |
| W-group | 38.63 ± 2.07 a | 5.35 ± 0.61 a | 39.21 ± 6.91 c | 3.46 ± 0.96 a | 18.08 ± 1.78 a | 34.03 ± 3.64 d |
Results are expressed as the mean ± standard deviation, n = 6. Values with different superscripts in a column indicate significant differences between groups as determined one-way ANOVA followed by the Waller–Duncan multiple range test at p < 0.05. a, b Mean values of Weight, Relative heart weight, and Relative kidney weight within columns with unequal superscript letters were significantly different (p < 0.05). a–c Mean values of Relative liver weight within columns with unequal superscript letters were significantly different (p < 0.05). a, ab Mean values of Relative spleen weight within columns with unequal superscript letters were significantly different (p < 0.05). a–d Mean values of Relative small intestine weight within columns with unequal superscript letters were significantly different (p < 0.05).
Table 2.
The villus height (mm), crypt depth (mm) and the ratio of villus height to crypt depth (V/C) of mice’s intestinal histology in different experimental groups (L-group, Y-group, LY-group, R-group and W-group).
Table 2.
The villus height (mm), crypt depth (mm) and the ratio of villus height to crypt depth (V/C) of mice’s intestinal histology in different experimental groups (L-group, Y-group, LY-group, R-group and W-group).
| Group | Villus Height (mm) | Crypt Depth (mm) | V/C |
|---|---|---|---|
| L-group | 0.483 ± 0.060 a | 0.153 ± 0.012 a | 3.165 ± 0.405 b |
| Y-group | 0.577 ± 0.039 a | 0.150 ± 0.022 a | 3.934 ± 0.681 a |
| LY-group | 0.362 ± 0.026 bc | 0.120 ± 0.010 ab | 3.043 ± 0.406 b |
| R-group | 0.298 ± 0.018 c | 0.133 ± 0.014 ab | 2.258 ± 0.248 c |
| W-group | 0.422 ± 0.028 b | 0.132 ± 0.016 ab | 3.270 ± 0.591 b |
Results are expressed as the mean ± standard deviation, n = 6. Values with different superscripts in a column indicate significant differences between groups as determined by one-way ANOVA followed by a Waller–Duncan multiple range test at p < 0.05. a–c Mean values of Villus height and V/C within columns with unequal superscript letters were significantly different (p < 0.05). a, ab Mean values of Crypt depth within columns with unequal superscript letters were significantly different (p < 0.05).
Table 3.
Analysis of antioxidant ability (glutathione (GSH), malonaldehyde (MDA), catalase (CAT), and superoxide dismutase (SOD)) of mice’s serum in different experimental groups (L-group, Y-group, LY-group, R-group and W-group).
Table 3.
Analysis of antioxidant ability (glutathione (GSH), malonaldehyde (MDA), catalase (CAT), and superoxide dismutase (SOD)) of mice’s serum in different experimental groups (L-group, Y-group, LY-group, R-group and W-group).
| Group | GSH (umol/L) | MDA (mmol/L) | CAT (U/mL) | SOD (U/mL) |
|---|---|---|---|---|
| L-group | 27.132 ± 6.203 b | 0.776 ± 0.175 b | 11.624 ± 3.111 b | 2.138 ± 0.325 a |
| Y-group | 36.735 ± 4.515 a | 1.020 ± 0.218 ab | 9.743 ± 0.964 c | 1.569 ± 0.138 b |
| LY-group | 29.503 ± 6.604 b | 0.687 ± 0.125 b | 15.644 ± 4.618 a | 2.292 ± 0.201 a |
| R-group | 28.135 ± 3.872 b | 1.200 ± 0.367 a | 9.607 ± 2.323 c | 1.591 ± 0.089 b |
| W-group | 13.315 ± 4.829 c | 1.127 ± 0.257 a | 10.781 ± 3.088 b | 1.322 ± 0.152 b |
Results are expressed as the mean ± standard deviation, n = 6. Values with different superscripts in a column indicate significant differences between groups as determined by one-way ANOVA followed by a Waller–Duncan multiple range test at p < 0.05. a–c Mean values of GSH and CAT within columns with unequal superscript letters were significantly different (p < 0.05). a, b Mean values of MDA and SOD within columns with unequal superscript letters were significantly different (p < 0.05).
Table 4.
Alpha indices statistics of intestinal microbial diversity in different experimental groups (L-group, Y-group, LY-group, R-group and W-group).
Table 4.
Alpha indices statistics of intestinal microbial diversity in different experimental groups (L-group, Y-group, LY-group, R-group and W-group).
| Group | Observed Species | Shannon | Simpson | Chao1 | ACE | Goods Coverage | PD_Whole_ Tree |
|---|---|---|---|---|---|---|---|
| L-group | 202 | 3.582 | 0.723 | 262.286 | 288.101 | 0.980 | 24.576 |
| Y-group | 127 | 3.510 | 0.781 | 197.685 | 205.261 | 0.987 | 15.055 |
| LY-group | 108 | 2.674 | 0.632 | 148.113 | 159.118 | 0.990 | 13.465 |
| R-group | 131 | 3.128 | 0.724 | 194.636 | 221.177 | 0.985 | 16.435 |
| W-group | 179 | 2.679 | 0.566 | 287.020 | 321.170 | 0.977 | 19.783 |
Results are expressed the as mean.
Publisher’s Note: MDPI stays neutral with regard to jurisdictional claims in published maps and institutional affiliations. |
© 2021 by the authors. Licensee MDPI, Basel, Switzerland. This article is an open access article distributed under the terms and conditions of the Creative Commons Attribution (CC BY) license (https://creativecommons.org/licenses/by/4.0/).
Share and Cite
MDPI and ACS Style
Liu, N.; Qin, L.; Lu, X.; Zhao, Y.; Miao, S. Fortified Fermented Rice-Acid Can Regulate the Gut Microbiota in Mice and Improve the Antioxidant Capacity. Nutrients 2021, 13, 4219. https://doi.org/10.3390/nu13124219
AMA Style
Liu N, Qin L, Lu X, Zhao Y, Miao S. Fortified Fermented Rice-Acid Can Regulate the Gut Microbiota in Mice and Improve the Antioxidant Capacity. Nutrients. 2021; 13(12):4219. https://doi.org/10.3390/nu13124219
Chicago/Turabian StyleLiu, Na, Likang Qin, Xiafen Lu, Yuxuan Zhao, and Song Miao. 2021. "Fortified Fermented Rice-Acid Can Regulate the Gut Microbiota in Mice and Improve the Antioxidant Capacity" Nutrients 13, no. 12: 4219. https://doi.org/10.3390/nu13124219
Note that from the first issue of 2016, this journal uses article numbers instead of page numbers. See further details here.