
The Mean of Milk: A Review of Human Milk Oligosaccharide Concentrations throughout Lactation

Abstract
:1. Introduction
1.1. Structures and Abbreviations of HMOs
1.2. Factors Influencing HMO Variability
2. Materials and Methods
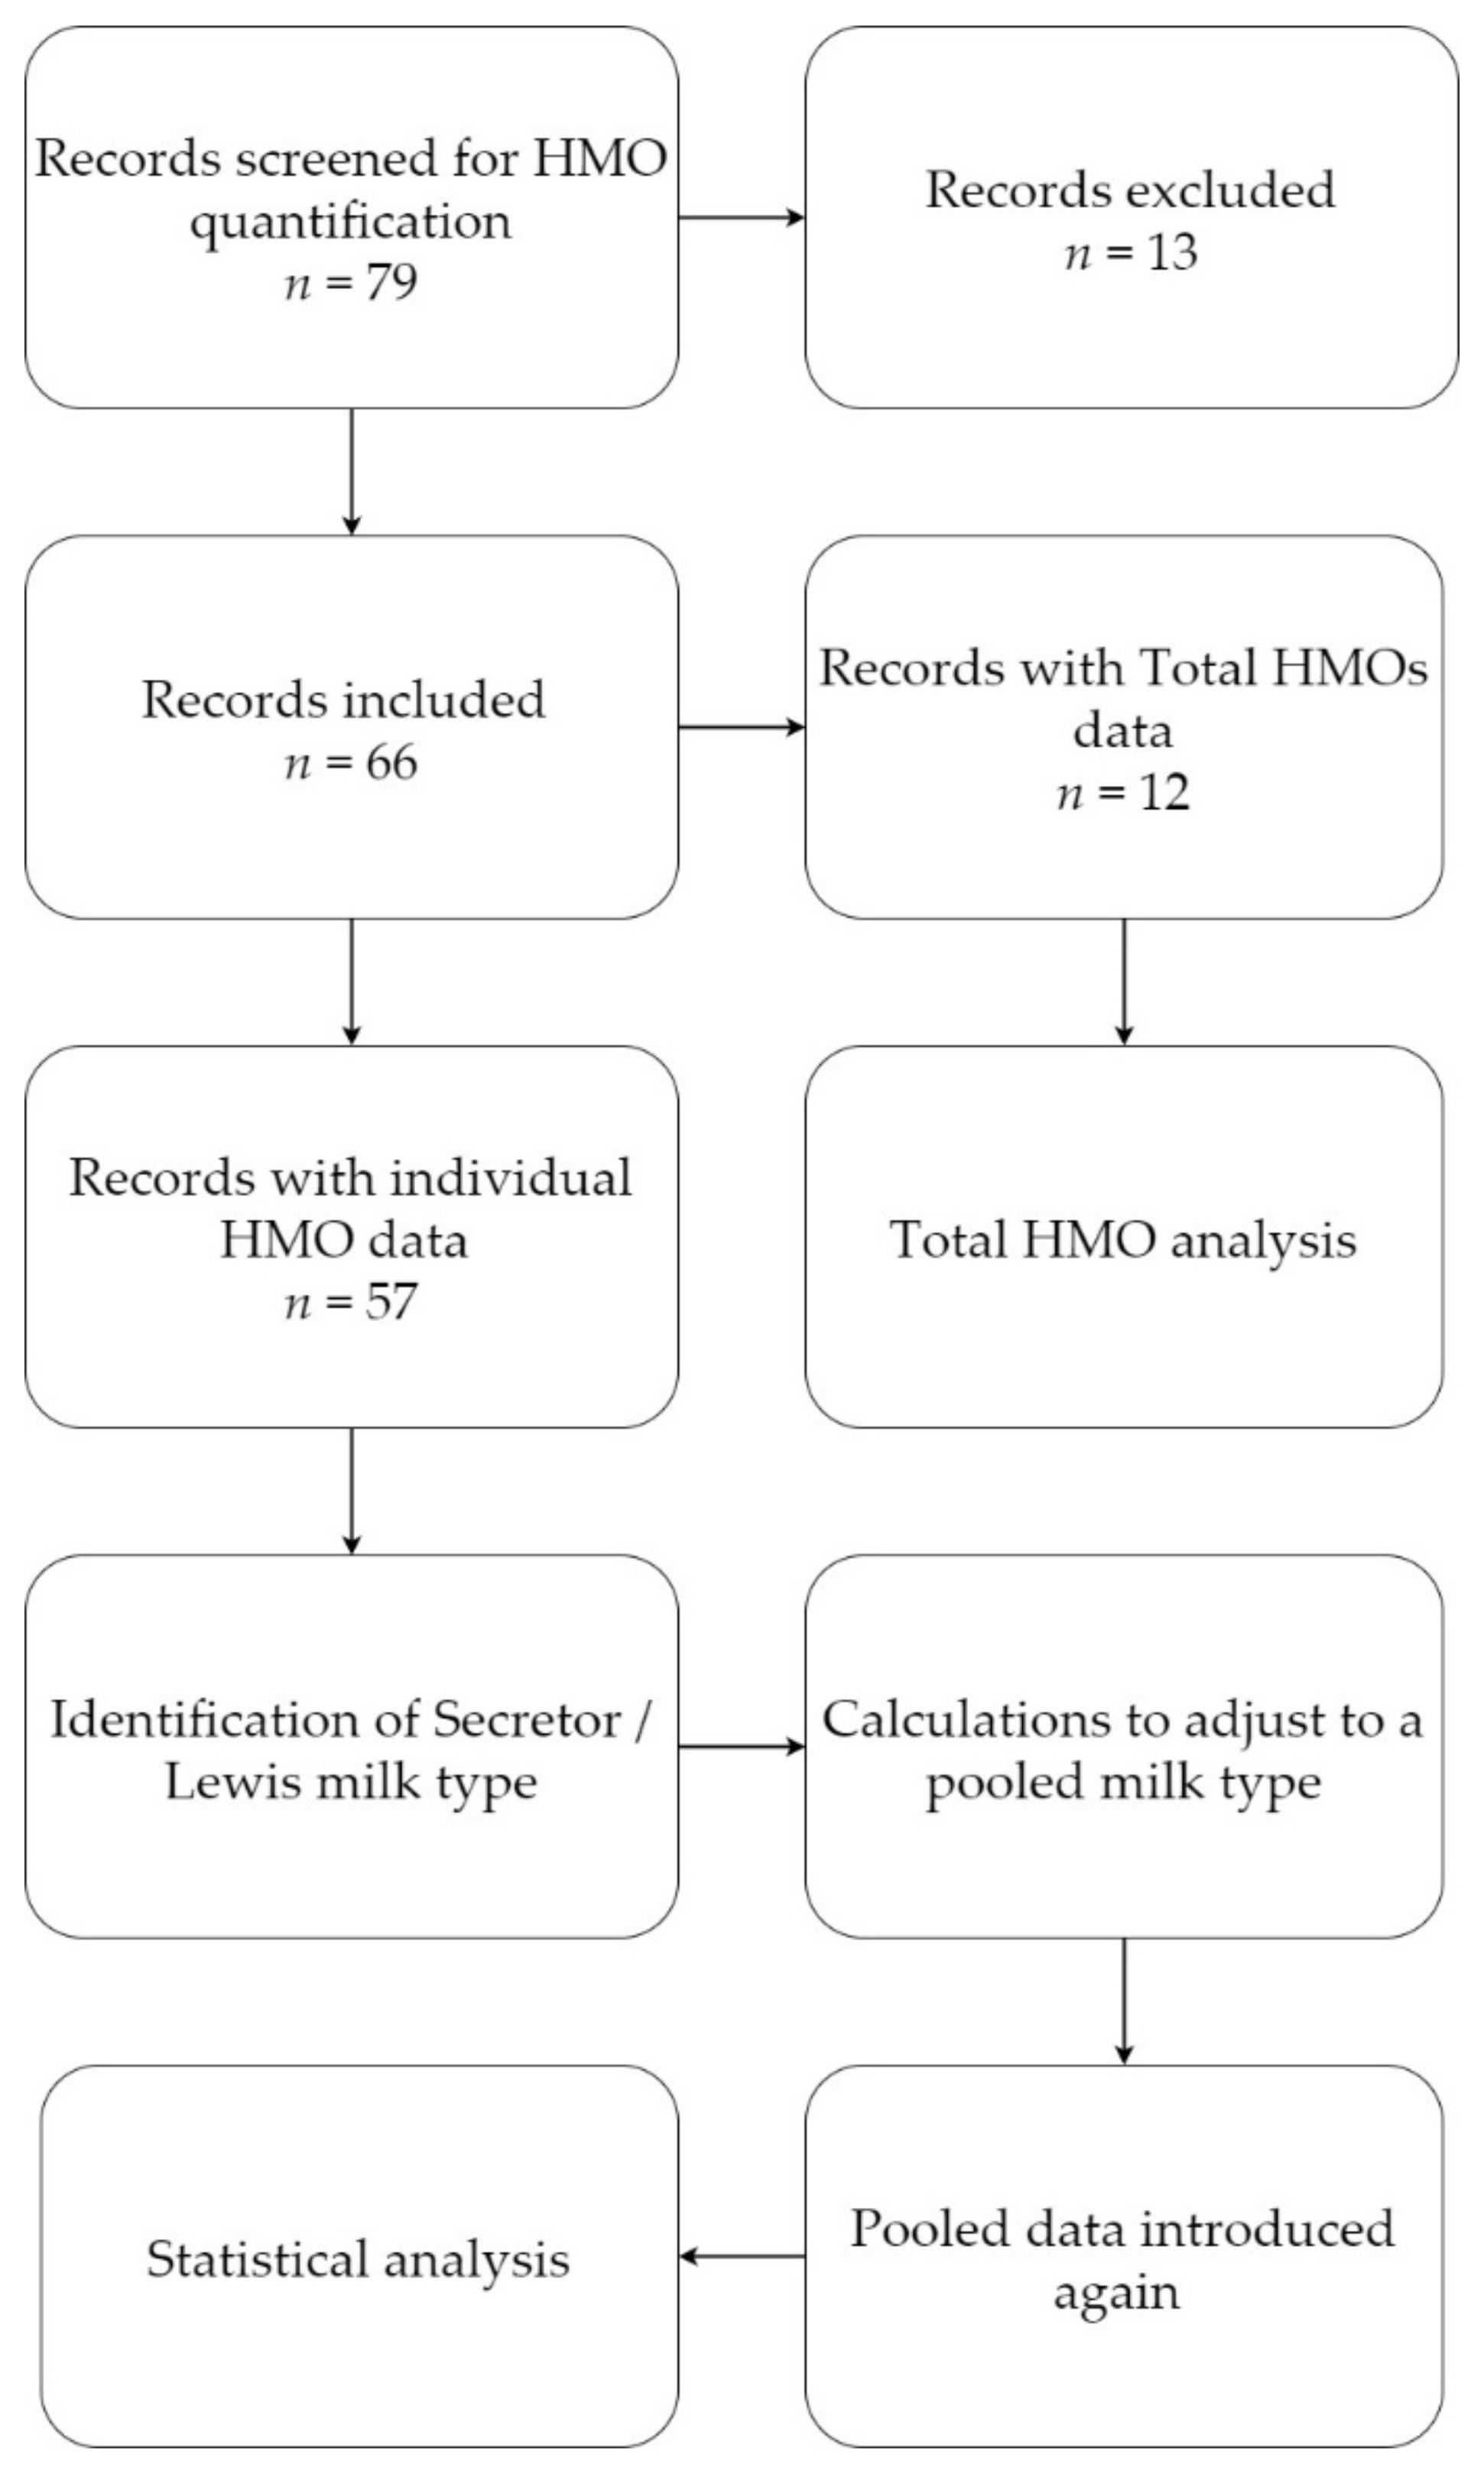
2.1. Literature Search and Selection
- Milk group: When no information on milk group or milk type were provided (as was the case for four publications), the samples were assumed to be pooled.
- Secretor/non-secretor data: Milk group-specific means were recalculated according to the typically observed distribution of secretor/non-secretor phenotypes in the population (approx. 80/20%)
- When HMO amounts were reported with the four specified milk group status, calculations on assumption of a 70:20:9:1 ratio between the four milk groups (see also Table 2 [33]) were applied to mimic a pooled milk sample (calculations explained in Supplementary Materials Table S1). If the FUT2 dependent 2′-fucosyllactose (2′-FL), difucosyllactose (DFL), and lacto-N-fucopentaose I (LNFP-I) means were collectively <0.5 g/L then the assumption of natural phenotype distribution is almost certainly wrong, and an excess of non-secretors was present in the pool. If such levels were identified, they were excluded.
- Birth type: When information on mode or type of delivery was not available, it was assumed that birth was term.
- Lactation period: Since each publication reports differing lactation periods, registered quantification data were assigned to one of the pre-defined lactation periods: 0–5 days (colostrum); 6–14 days (transitional milk); 15–90 days (mature milk); >90 days (late milk). If information on lactation period was not available, data were excluded. In certain cases, data could fit to more than one of the pre-defined lactation periods. For instance, a concentration data for ‘3–90 days’ could fit to several of the above-mentioned lactation periods. In these cases, data were assigned to the lactation period with most days fitting the pre-defined period; in this case 3–90 days was assigned to the 15–90 days period.
- Other discriminator: Data from mothers with any specified disease conditions were excluded.
- Data units: HMO means reported in literature were transferred as mean concentration in g/L and sample size. When sample size information was not available, the articles were excluded. If other units than g/L were reported, such as mmol/L the mean concentrations were converted to g/L for consistency. Studies reporting median levels were estimated to mean with standard deviation using a mean variance estimation model [42]. Multiple statistical models are publicly available and in the present review, the model proposed by Wan et al. (2014) was applied.
- Combined concentrations: Some studies reported combined means of HMOs such as LSTa/b, LNT/LNnT, 2′-FL/3-FL, LNFP-I/II/III, etc. Combined concentrations were transferred to a separate sheet and excluded in the final analysis.
- Pooled samples
- Term milk
- All nationalities
- Mother without reported disease status.
2.2. Statistical Analysis
3. Results
3.1. Overview of the Review
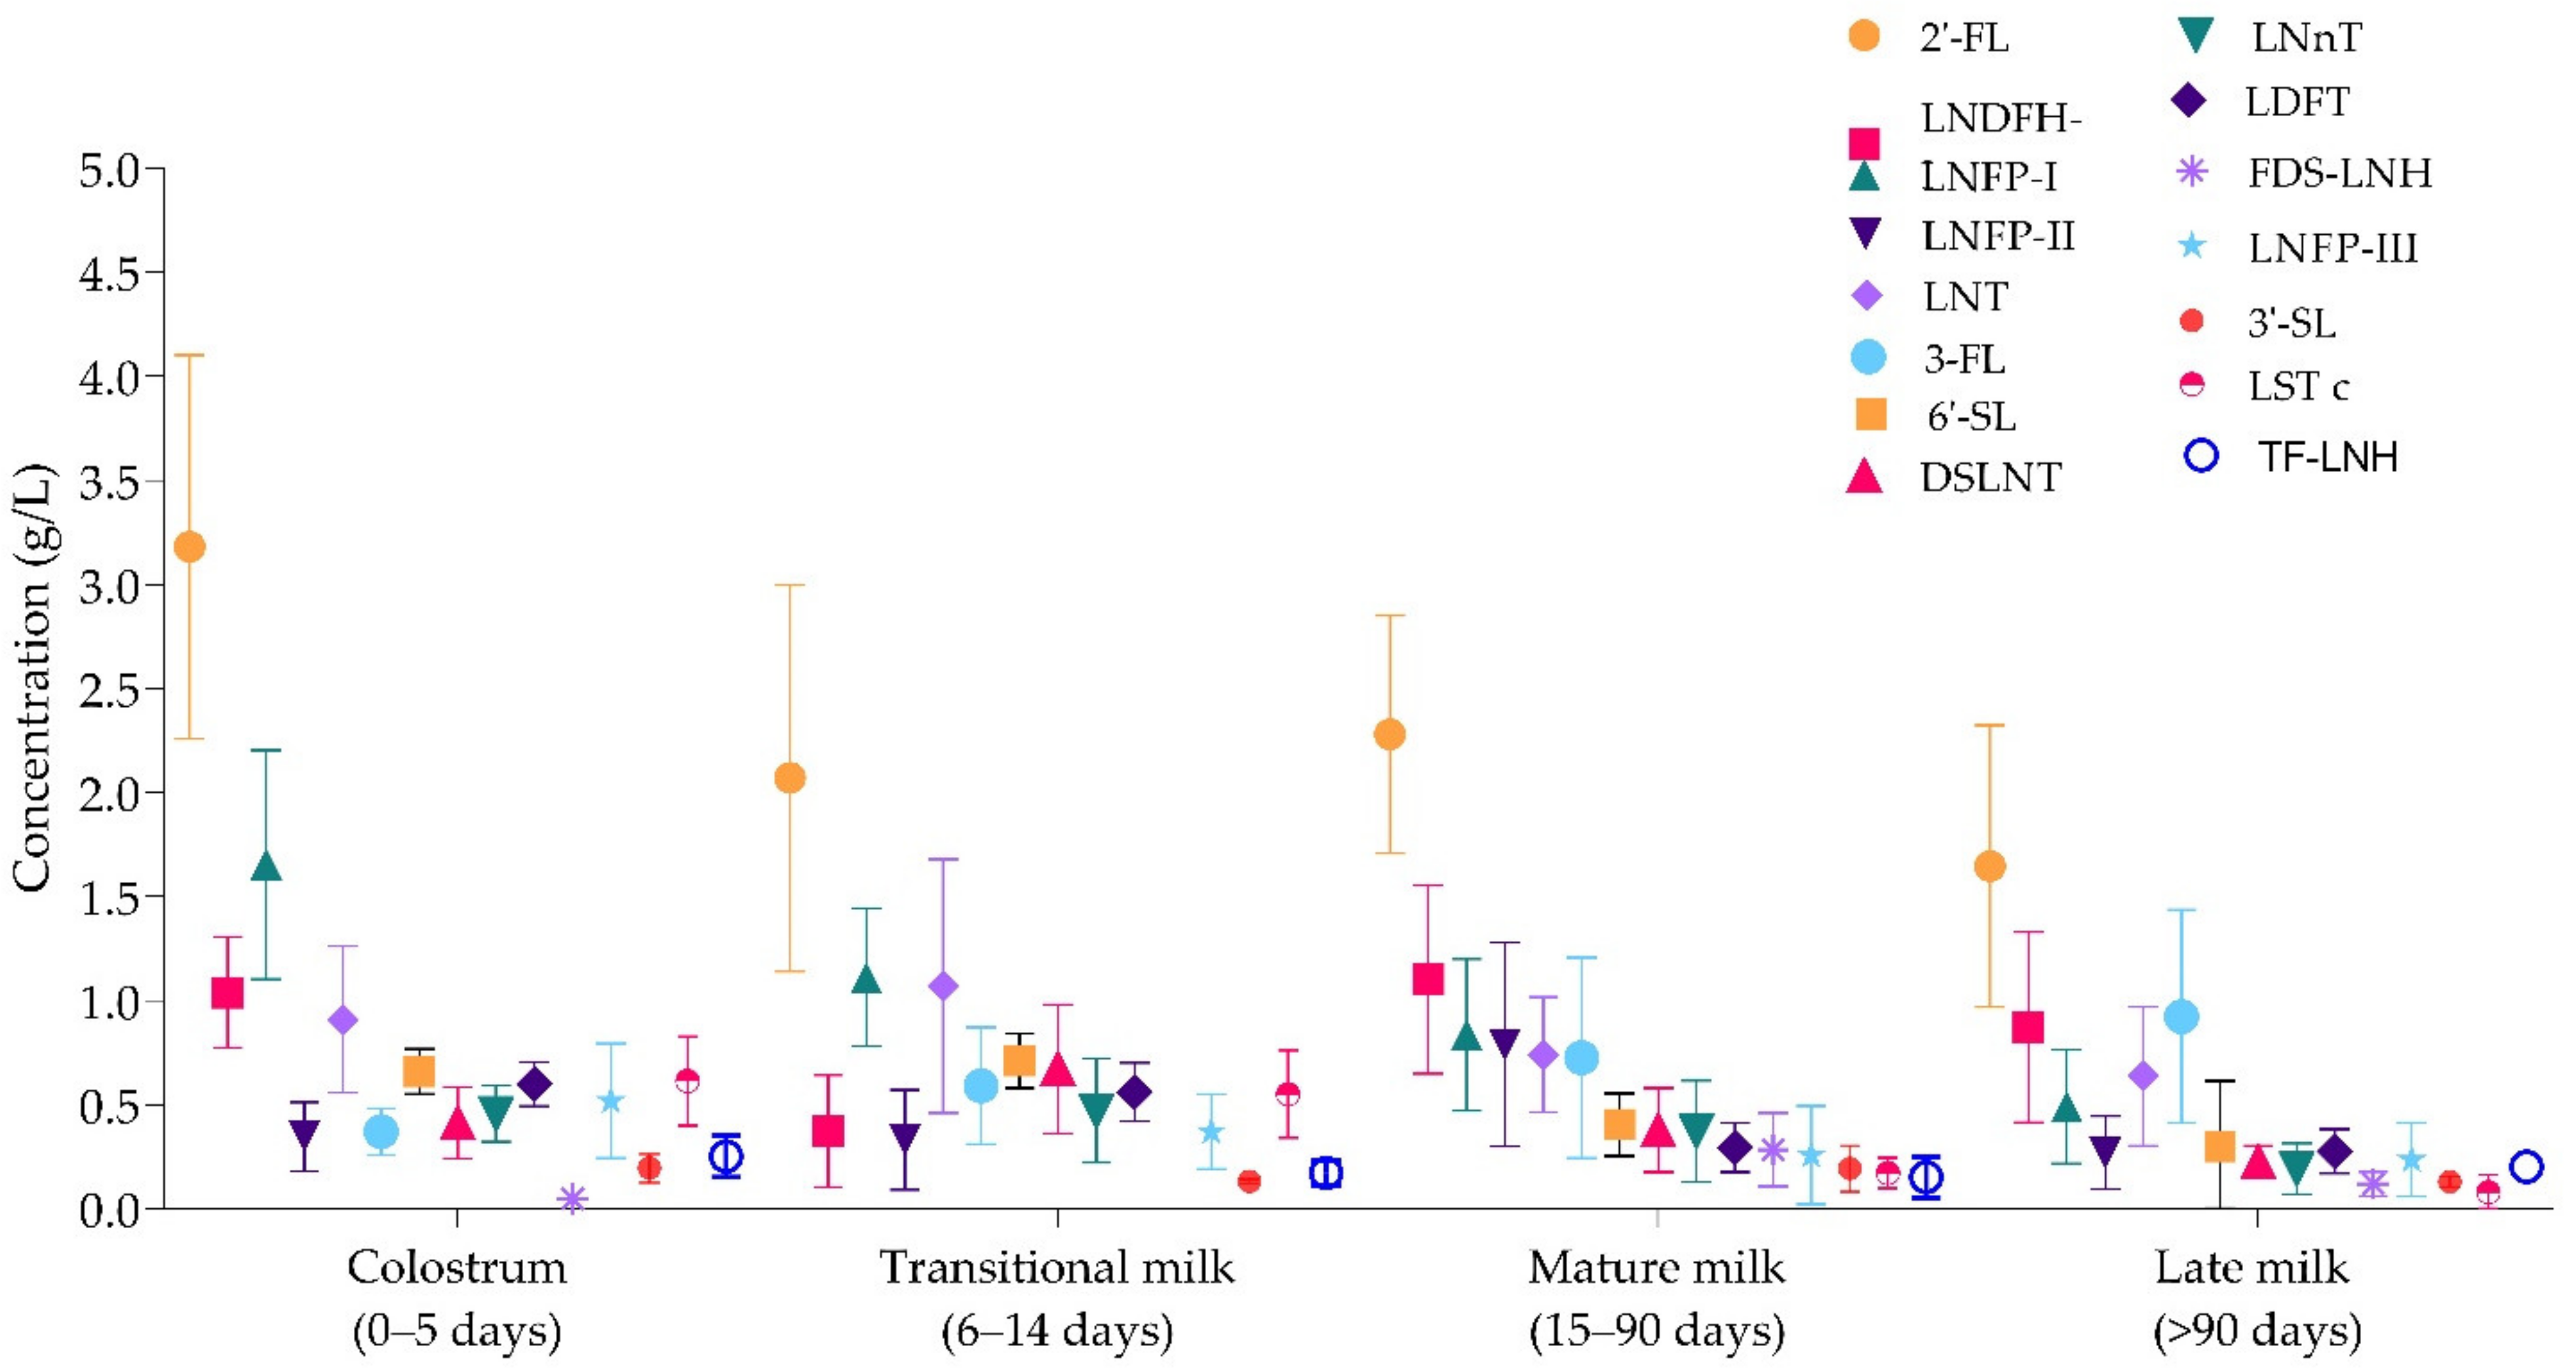
3.2. Concentrations of Individual HMOs in Colostrum (0–5 Days), Transitional (6–14 Days), Mature (15–90 Days), and Late (>90 Days) Milk
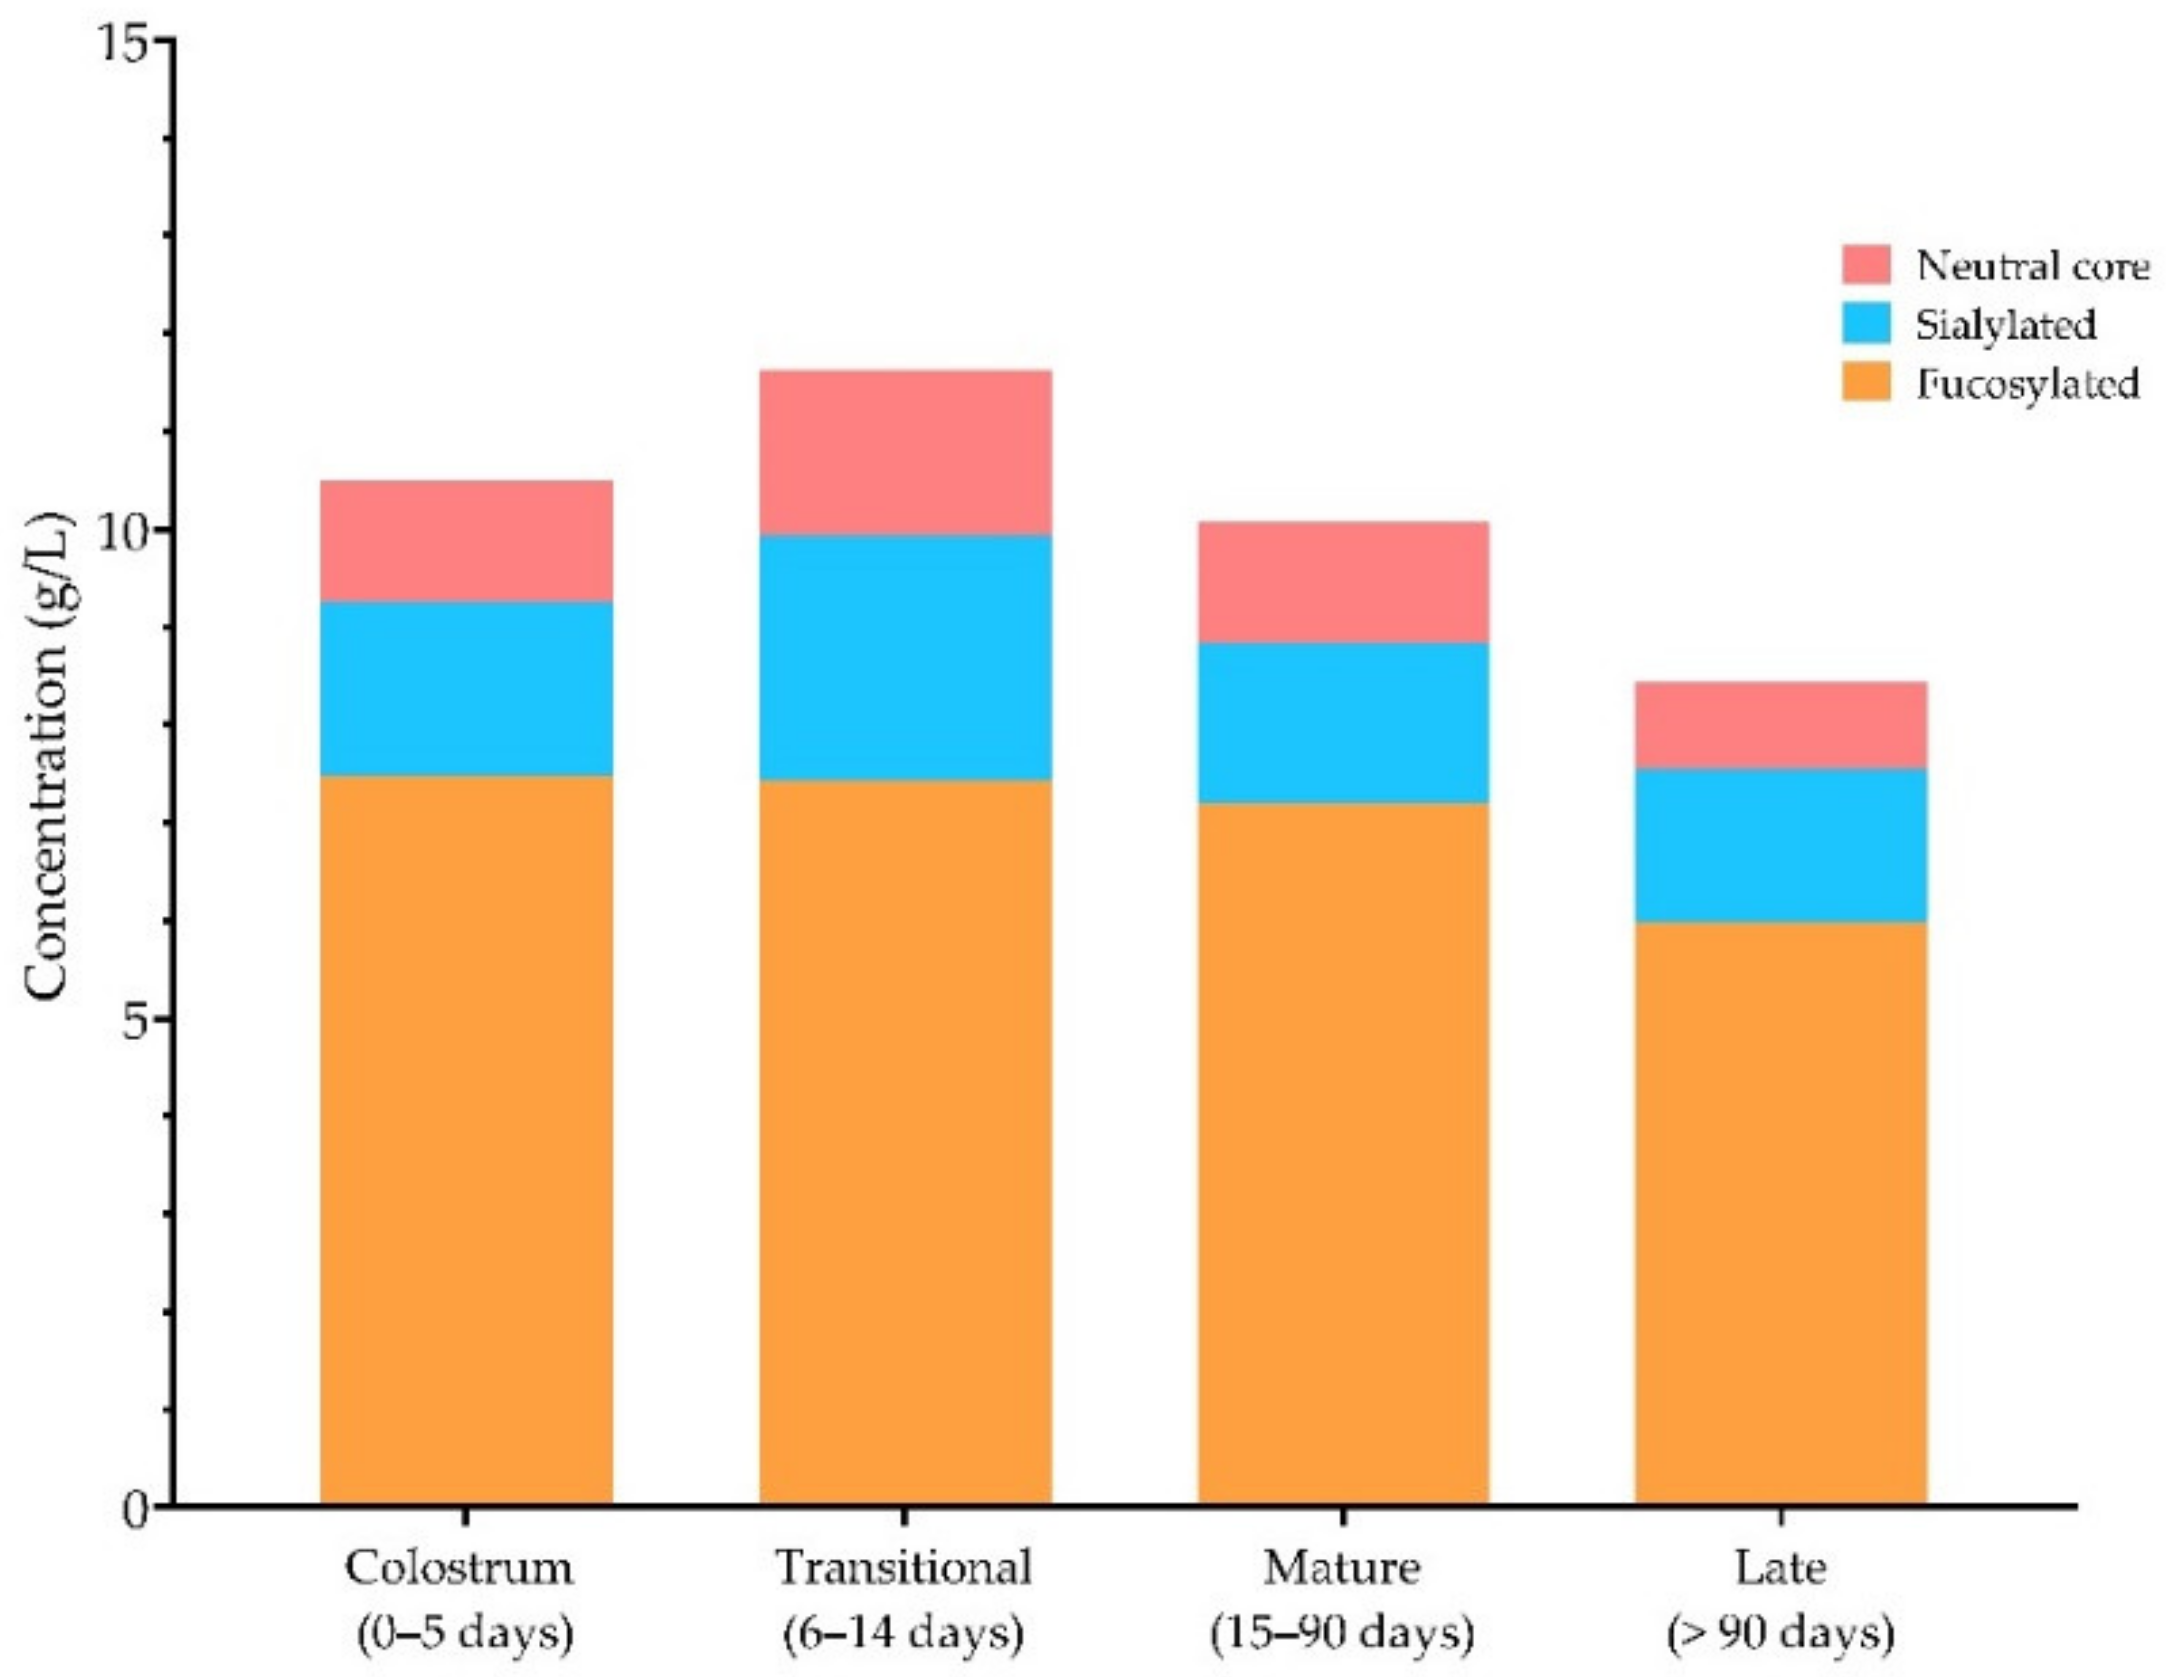
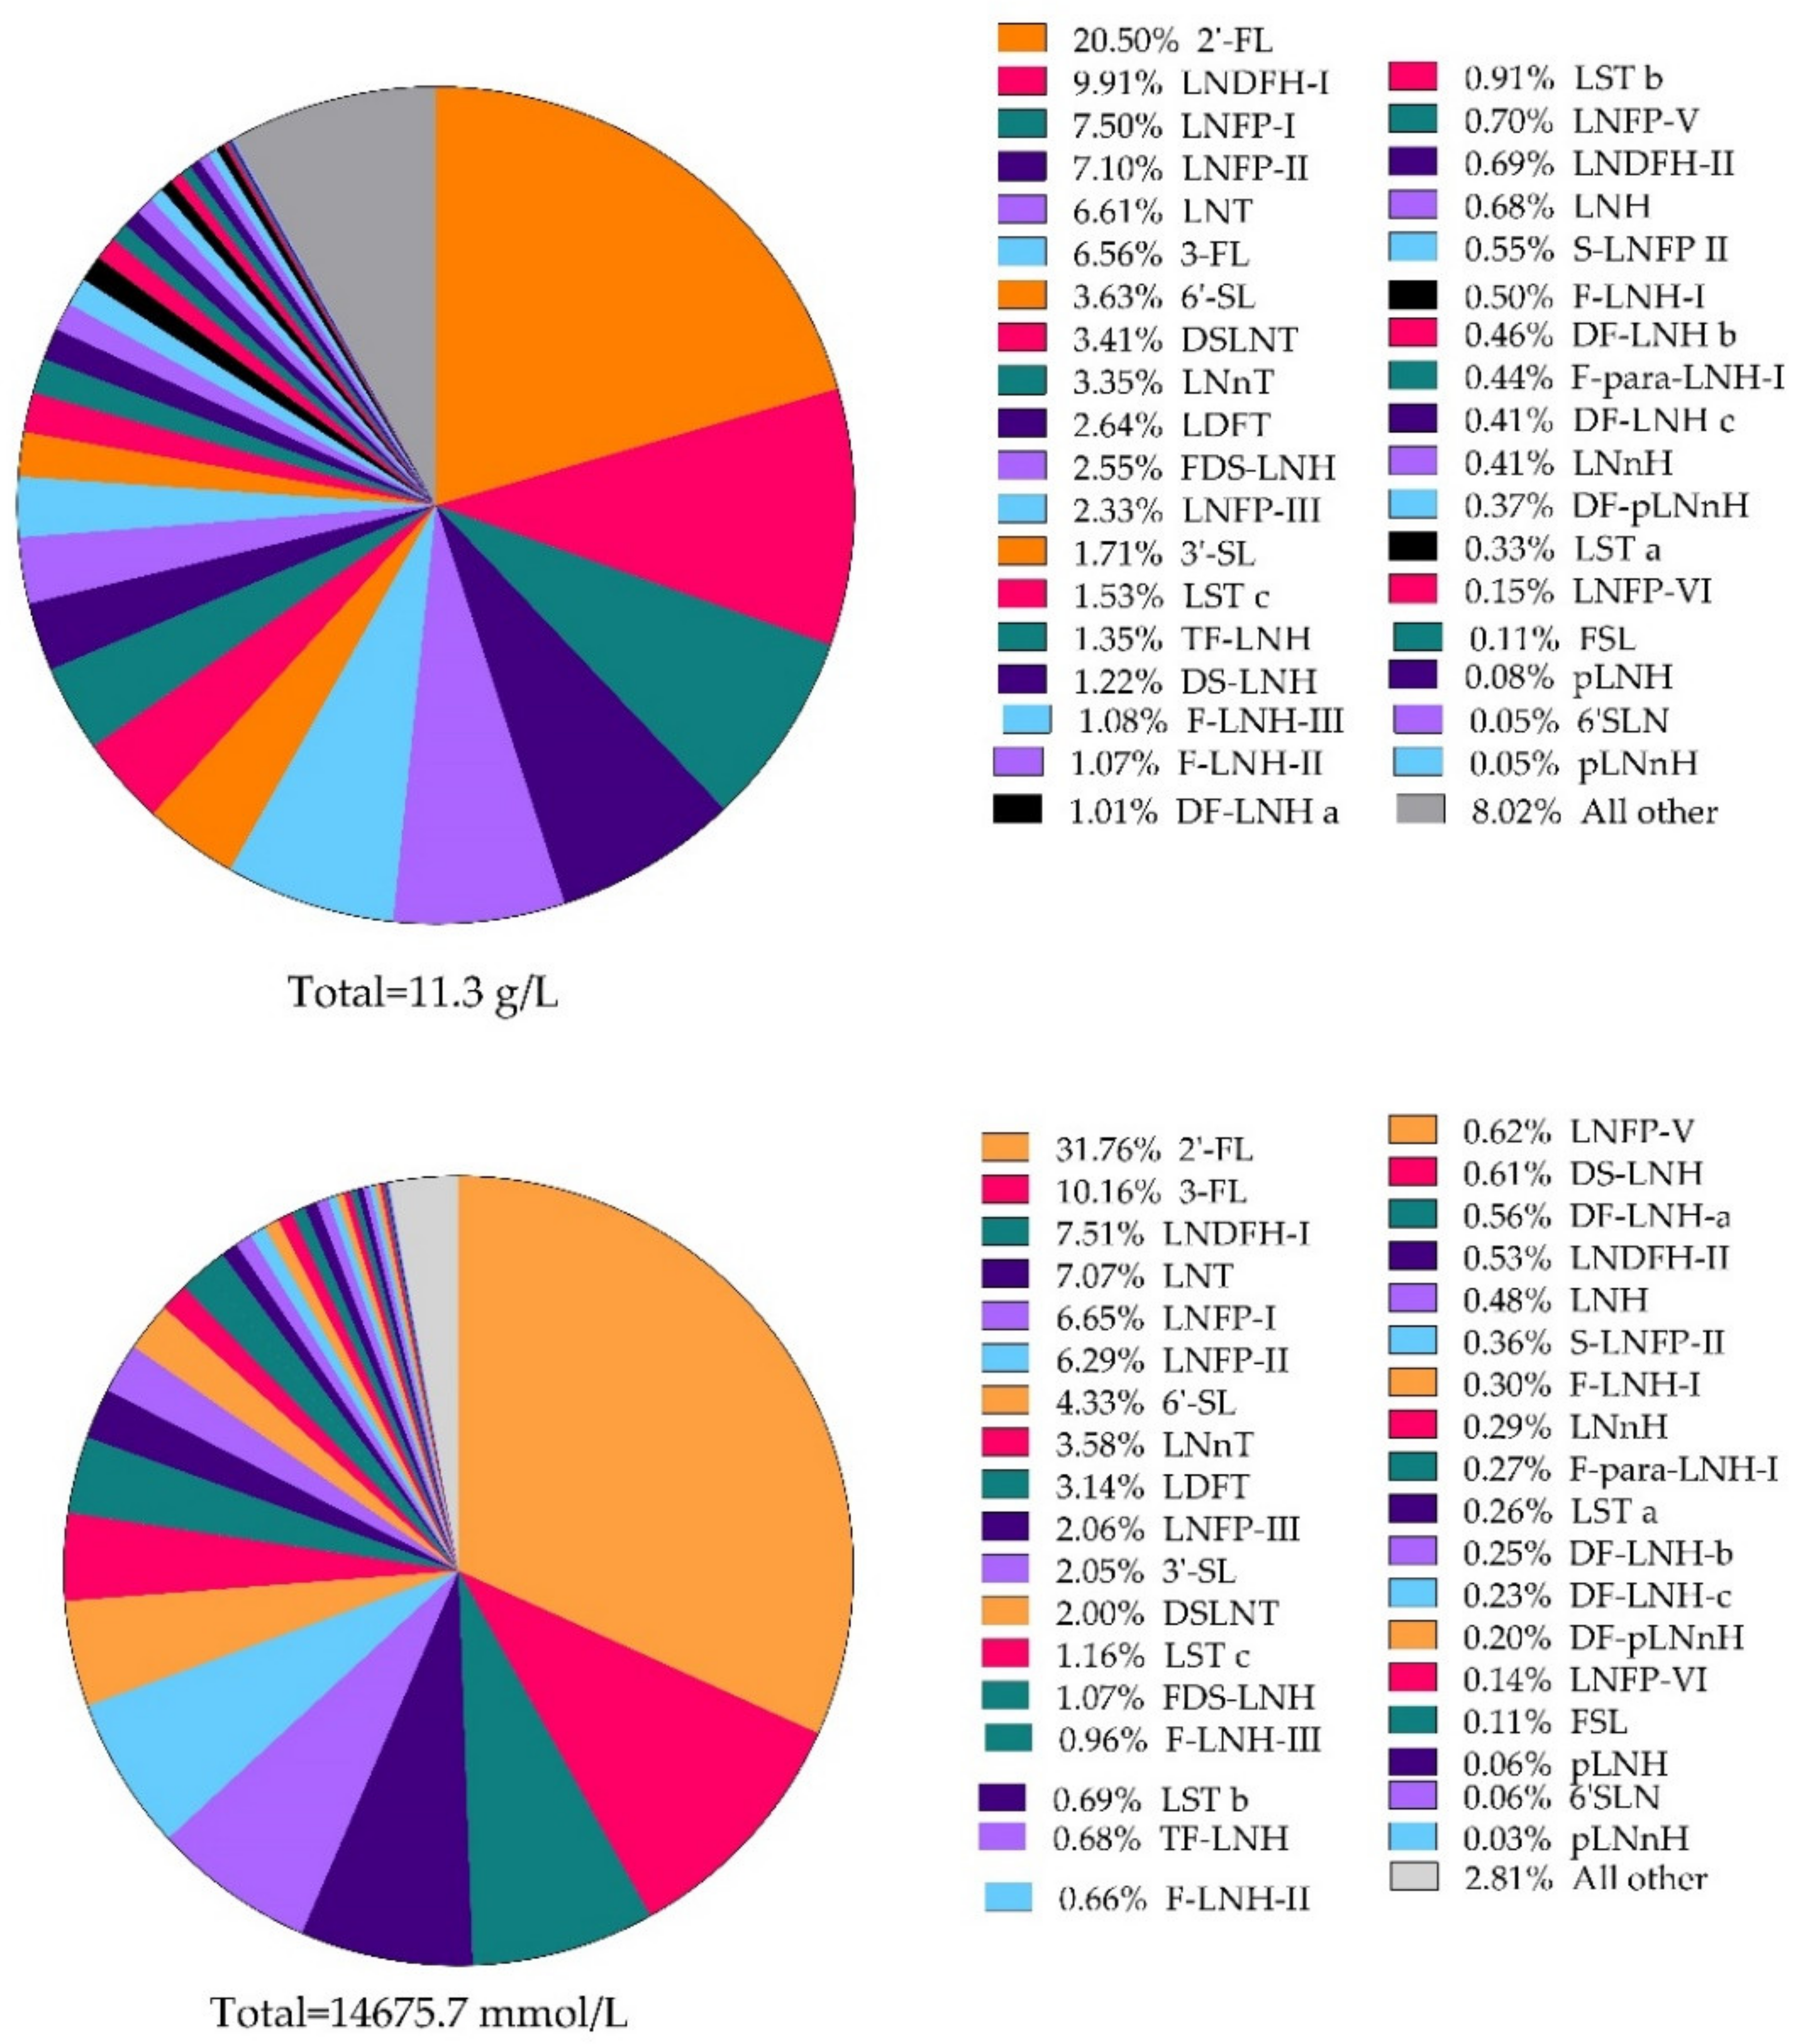
3.3. Total HMOs throughout Lactation and Relative Abundance of Individual HMOs
4. Discussion
5. Conclusions
Supplementary Materials
Author Contributions
Funding
Institutional Review Board Statement
Informed Consent Statement
Data Availability Statement
Conflicts of Interest
References
- Hennet, T.; Borsig, L. Breastfed at Tiffany’s. Trends Biochem. Sci. 2016, 41, 508–518. [Google Scholar] [CrossRef] [Green Version]
- Victora, C.G.; Bahl, R.; Barros, A.J.D.; França, G.V.A.; Horton, S.; Krasevec, J.; Murch, S.; Sankar, M.J.; Walker, N.; Rollins, N.C.; et al. Breastfeeding in the 21st century: Epidemiology, mechanisms, and lifelong effect. Lancet 2016, 387, 475–490. [Google Scholar] [CrossRef] [Green Version]
- Le Huërou-Luron, I.; Blat, S.; Boudry, G. Breast- v. formula-feeding: Impacts on the digestive tract and immediate and long-term health effects. Nutr. Res. Rev. 2010, 23, 23–36. [Google Scholar] [CrossRef] [PubMed] [Green Version]
- Hester, S.N.; Hustead, D.S.; Mackey, A.D.; Singhal, A.; Marriage, B.J. Is the macronutrient intake of formula-fed infants greater than breast-fed infants in early infancy? J. Nutr. Metab. 2012, 2012, 891201. [Google Scholar] [CrossRef] [Green Version]
- Urashima, T.; Saito, T.; Nakamura, T.; Messer, M. Oligosaccharides of milk and colostrum in non-human mammals. Glycoconj. J. 2001, 18, 357–371. [Google Scholar] [CrossRef]
- Newburg, D.S.; Warren, C.D.; Chaturvedi, P.; Newburg, A.; Oftedal, O.T.; Ye, S.; Tilden, C.D. Milk oligosaccharides across species. Pediatr. Res. 1999, 45, 745. [Google Scholar] [CrossRef] [Green Version]
- Albrecht, S.; Lane, J.A.; Mariño, K.V.; Al Busadah, K.A.; Carrington, S.D.; Hickey, R.M.; Rudd, P.M. A comparative study of free oligosaccharides in the milk of domestic animals. Br. J. Nutr. 2014, 111, 1313–1328. [Google Scholar] [CrossRef]
- Tao, N.; Wu, S.; Kim, J.; An, H.J.; Hinde, K.; Power, M.; Gagneux, P.; German, J.B.; Lebrilla, C.B. Evolutionary glycomics: Characterization of milk oligosaccharides in primates. J. Proteome Res. 2011, 10, 1548–1557. [Google Scholar] [CrossRef] [PubMed] [Green Version]
- Urashima, T.; Asakuma, S.; Leo, F.; Fukuda, K.; Messer, M.; Oftedal, O.T. The predominance of type I oligosaccharides is a feature specific to human breast milk. Adv. Nutr. 2012, 3, 473S–482S. [Google Scholar] [CrossRef] [Green Version]
- Gagneux, P.; Cheriyan, M.; Hurtado-Ziola, N.; van der Linden, E.C.M.B.; Anderson, D.; McClure, H.; Varki, A.; Varki, N.M. Human-specific regulation of α2–6-linked sialic acids. J. Biol. Chem. 2003, 278, 48245–48250. [Google Scholar] [CrossRef] [PubMed] [Green Version]
- Varki, A. Uniquely human evolution of sialic acid genetics and biology. Proc. Natl. Acad. Sci. USA 2010, 107, 8939–8946. [Google Scholar] [CrossRef] [Green Version]
- Bishop, J.R.; Gagneux, P. Evolution of carbohydrate antigens—Microbial forces shaping host glycomes? Glycobiology 2007, 17, 23R–34R. [Google Scholar] [CrossRef] [PubMed]
- Jantscher-Krenn, E.; Aigner, J.; Reiter, B.; Köfeler, H.; Csapo, B.; Desoye, G.; Bode, L.; Van Poppel, M.N.M. Evidence of human milk oligosaccharides in maternal circulation already during pregnancy: A pilot study. Am. J. Physiol. Metab. 2018. [Google Scholar] [CrossRef] [PubMed]
- Hirschmugl, B.; Brandl, W.; Csapo, B.; Van Poppel, M.; Köfeler, H.; Desoye, G.; Wadsack, C.; Jantscher-Krenn, E. Evidence of Human Milk Oligosaccharides in Cord Blood and Maternal-to-Fetal Transport across the Placenta. Nutrients 2019, 11, 2640. [Google Scholar] [CrossRef] [PubMed] [Green Version]
- Jochum, M.; Seferovic, M.; Bode, L.; Vidaeff, A.; Aagaard, K.M. 91: Human milk oligosaccharides are present in midgestation amniotic fluid & associated with a sparse microbiome. Am. J. Obstet. Gynecol. 2020, 222, S74–S75. [Google Scholar] [CrossRef]
- Brand-Miller, J.C.; McVeagh, P.; McNeil, Y.; Messer, M. Digestion of human milk oligosaccharides by healthy infants evaluated by the lactulose hydrogen breath test. J. Pediatr. 1998, 133, 95–98. [Google Scholar] [CrossRef]
- Sakanaka, M.; Hansen, M.E.; Gotoh, A.; Katoh, T.; Yoshida, K.; Odamaki, T.; Yachi, H.; Sugiyama, Y.; Kurihara, S.; Hirose, J.; et al. Evolutionary adaptation in fucosyllactose uptake systems supports bifidobacteria-infant symbiosis. Sci. Adv. 2019, 5, eaaw7696. [Google Scholar] [CrossRef] [Green Version]
- Bezirtzoglou, E.; Tsiotsias, A.; Welling, G.W. Microbiota profile in feces of breast- and formula-fed newborns by using fluorescence in situ hybridization (FISH). Anaerobe 2011, 17, 478–482. [Google Scholar] [CrossRef]
- Garrido, D.; Ruiz-Moyano, S.; Kirmiz, N.; Davis, J.C.; Totten, S.M.; Lemay, D.; Ugalde, J.A.; German, J.B.; Lebrilla, C.B.; Mills, D.A. A novel gene cluster allows preferential utilization of fucosylated milk oligosaccharides in Bifidobacterium longum subsp. longum SC596. Sci.Rep. 2016, 6, 1–18. [Google Scholar] [CrossRef] [Green Version]
- De Leoz, M.L.; Kalanetra, K.M.; Bokulich, N.A.; Strum, J.S.; Underwood, M.A.; German, J.B.; Mills, D.A.; Lebrilla, C.B. Human milk glycomics and gut microbial genomics in infant feces show a correlation between human milk oligosaccharides and gut microbiota: A proof-of-concept study. J. Proteome Res. 2015, 14, 491–502. [Google Scholar] [CrossRef] [Green Version]
- Pacheco, A.R.; Sperandio, V. Enteric pathogens exploit the microbiota-generated nutritional environment of the gut. Microbiol. Spectr. 2015, 3, 1–13. [Google Scholar] [CrossRef] [PubMed] [Green Version]
- Sela, D.A.; Mills, D.A. The marriage of nutrigenomics with the microbiome: The case of infant-associated bifidobacteria and milk. Am. J. Clin. Nutr. 2014, 99, 697S–703S. [Google Scholar] [CrossRef] [Green Version]
- Turroni, F.; Milani, C.; Duranti, S.; Ferrario, C.; Lugli, G.A.; Mancabelli, L.; Van Sinderen, D.; Ventura, M. Bifidobacteria and the infant gut: An example of co-evolution and natural selection. Cell. Mol. Life Sci. 2018, 75, 103–118. [Google Scholar] [CrossRef] [PubMed]
- Turroni, F.; Ribbera, A.; Foroni, E.; Van Sinderen, D.; Ventura, M. Human gut microbiota and bifidobacteria: From composition to functionality. Antonie Van Leeuwenhoek 2008, 94, 35–50. [Google Scholar] [CrossRef] [PubMed]
- Chichlowski, M.; De Lartigue, G.; German, J.B.; Raybould, H.E.; Mills, D.A. Bifidobacteria isolated from infants and cultured on human milk oligosaccharides affect intestinal epithelial function. J. Pediatr. Gastroenterol. Nutr. 2012, 55, 321–327. [Google Scholar] [CrossRef] [PubMed] [Green Version]
- Mezoff, E.A.; Hawkins, J.A.; Ollberding, N.J.; Karns, R.; Morrow, A.L.; Helmrath, M.A. The human milk oligosaccharide 2′-fucosyllactose augments the adaptive response to extensive intestinal. Am. J. Physiol. Liver Physiol. 2016, 310, G427–G438. [Google Scholar] [CrossRef] [PubMed] [Green Version]
- Tonon, K.M.; De Morais, M.B.; Abrão, A.C.F.V.; Miranda, A.; Morais, T.B. Maternal and infant factors associated with human milk oligosaccharides concentrations according to secretor and lewis phenotypes. Nutrients 2019, 11, 1358. [Google Scholar] [CrossRef] [PubMed] [Green Version]
- Wickramasinghe, S.; Pacheco, A.R.; Lemay, D.; Mills, D.A. Bifidobacteria grown on human milk oligosaccharides downregulate the expression of inflammation-related genes in Caco-2 cells. BMC Microbiol. 2015, 15, 1–12. [Google Scholar] [CrossRef] [Green Version]
- Craft, K.M.; Townsend, S.D. Mother knows best: Deciphering the antibacterial properties of human milk oligosaccharides. Acc. Chem. Res. 2019, 52, 760–768. [Google Scholar] [CrossRef] [PubMed] [Green Version]
- Urashima, T. Indigenous oligosaccharides in bovine milk. Agriculture 2011, 3, 241–273. [Google Scholar] [CrossRef]
- Totten, S.M.; Wu, L.D.; Parker, E.A.; Davis, J.C.C.; Hua, S.; Stroble, C.; Ruhaak, L.R.; Smilowitz, J.T.; German, J.B.; Lebrilla, C.B. Rapid-throughput glycomics applied to human milk oligosaccharide profiling for large human studies. Anal. Bioanal. Chem. 2014, 406, 7925–7935. [Google Scholar] [CrossRef] [PubMed]
- Chen, X. Human Milk Oligosaccharides (HMOS): Structure, Function, and Enzyme-Catalyzed Synthesis, 1st ed.; Elsevier Inc.: Amsterdam, The Netherlands, 2015; Volume 72. [Google Scholar]
- Thurl, S.; Henker, J.; Siegel, M.; Tovar, K.; Sawatzki, G. Detection of four human milk groups with respect to Lewis blood group dependent oligosaccharides. Glycoconj. J. 1997, 14, 795–799. [Google Scholar] [CrossRef] [PubMed]
- Oriol, R.; Le Pendu, J.; Mollicone, R. Genetics of ABO, H, Lewis, X and related antigens. Vox Sang. 1986, 51, 161–171. [Google Scholar] [CrossRef] [PubMed]
- Morrow, A.L.; Ruiz-Palacios, G.M.; Altaye, M.; Jiang, X.; Guerrero, M.L.; Meinzen-Derr, J.K.; Farkas, T.; Chaturvedi, P.; Pickering, L.K.; Newburg, D.S. Human milk oligosaccharides are associated with protection against diarrhea in breast-fed infants. J. Pediatr. 2004, 145, 297–303. [Google Scholar] [CrossRef]
- Erney, R.M.; Malone, W.T.; Skelding, M.B.; Marcon, A.A.; Kleman–Leyer, K.M.; O’Ryan, M.L.; Ruiz–Palacios, G.; Hilty, M.D.; Pickering, L.K.; Prieto, P. Variability of human milk neutral oligosaccharides in a diverse population. J. Pediatr. Gastroenterol. Nutr. 2000, 30, 181–192. [Google Scholar] [CrossRef]
- McGuire, M.K.; Meehan, C.L.; McGuire, M.A.; Williams, J.E.; Foster, J.; Sellen, D.W.; Kamau-Mbuthia, E.W.; Kamundia, E.W.; Mbugua, S.; Moore, S.E.; et al. What’s normal? Oligosaccharide concentrations and profiles in milk produced by healthy women vary geographically. Am. J. Clin. Nutr. 2017, 105, 1086–1100. [Google Scholar] [CrossRef]
- Castanys-Muñoz, E.; Martin, M.J.; Prieto, P.A. 2′-fucosyllactose: An abundant, genetically determined soluble glycan present in human milk. Nutr. Rev. 2013, 71, 773–789. [Google Scholar] [CrossRef]
- Seferovic, M.D.; Mohammad, M.; Pace, R.M.; Engevik, M.; Versalovic, J.; Bode, L.; Haymond, M.; Aagaard, K.M. Maternal diet alters human milk oligosaccharide composition with implications for the milk metagenome. Sci. Rep. 2020, 10, 1–18. [Google Scholar] [CrossRef]
- Van Leeuwen, S.S. Challenges and pitfalls in human milk oligosaccharide analysis. Nutrients 2019, 11, 2684. [Google Scholar] [CrossRef] [Green Version]
- Thurl, S.; Munzert, M.; Boehm, G.; Matthews, C.; Stahl, B. Systematic review of the concentrations of oligosaccharides in human milk. Nutr. Rev. 2017, 75, 920–933. [Google Scholar] [CrossRef] [Green Version]
- Wan, X.; Wang, W.; Liu, J.; Tong, T. Estimating the sample mean and standard deviation from the sample size, median, range and/or interquartile range. BMC Med. Res. Methodol. 2014, 14, 1–13. [Google Scholar] [CrossRef] [PubMed] [Green Version]
- Nakhla, T.; Fu, D.; Zopf, D.; Brodsky, N.L.; Hurt, H. Neutral oligosaccharide content of preterm human milk. Br. J. Nutr. 1999, 82, 361–367. [Google Scholar] [CrossRef] [Green Version]
- De Leoz, M.L.A.; Gaerlan, S.C.; Strum, J.S.; Dimapasoc, L.M.; Mirmiran, M.; Tancredi, D.J.; Smilowitz, J.T.; Kalanetra, K.M.; Mills, D.A.; German, J.B.; et al. Lacto-N-tetraose, fucosylation, and secretor status are highly variable in human milk oligosaccharides from women delivering preterm. J. Proteome Res. 2012, 11, 4662–4672. [Google Scholar] [CrossRef] [PubMed] [Green Version]
- Gabrielli, O.; Zampini, L.; Galeazzi, T.; Padella, L.; Santoro, L.; Peila, C.; Giuliani, F.; Bertino, E.; Fabris, C.; Coppa, G.V. Preterm milk oligosaccharides during the first month of lactation. Pediatrics 2011, 128, e1520–e1531. [Google Scholar] [CrossRef]
- Van Niekerk, E.; Autran, C.A.; Nel, D.G.; Kirsten, G.F.; Blaauw, R.; Bode, L. Human milk oligosaccharides differ between HIV-infected and HIV-uninfected mothers and are related to necrotizing enterocolitis incidence in their preterm very-low-birth-weight infants. J. Nutr. 2014, 144, 1227–1233. [Google Scholar] [CrossRef] [PubMed] [Green Version]
- Spevacek, A.R.; Smilowitz, J.T.; Chin, E.L.; Underwood, A.M.; German, J.B.; Slupsky, C.M. Infant maturity at birth reveals minor differences in the maternal milk metabolome in the first month of lactation. J. Nutr. 2015, 145, 1698–1708. [Google Scholar] [CrossRef] [Green Version]
- Austin, S.; De Castro, C.A.; Sprenger, N.; Binia, A.; Affolter, M.; Garcia-Rodenas, C.L.; Beauport, L.; Tolsa, J.-F.; Fumeaux, C.J.F. Human milk oligosaccharides in the milk of mothers delivering term versus preterm infants. Nutrients 2019, 11, 1282. [Google Scholar] [CrossRef] [PubMed] [Green Version]
- Moubareck, C.A.; Lootah, M.; Tahlak, M.; Venema, K. Profiles of human milk oligosaccharides and their relations to the milk microbiota of breastfeeding mothers in Dubai. Nutrients 2020, 12, 1727. [Google Scholar] [CrossRef]
- Hassinger, D.; Clausen, D.M.; Nitka, S.; Herdt, A.; Griffin, I. Analysis of Disialyllacto-N-Tetraose (DSLNT) content in milk from mothers of preterm infants. J. Hum. Lact. 2020, 36, 291–298. [Google Scholar] [CrossRef]
- Olivares, M.; Albrecht, S.; De Palma, G.; Ferrer, M.D.; Castillejo, G.; Schols, H.A.; Sanz, Y. Human milk composition differs in healthy mothers and mothers with celiac disease. Eur. J. Nutr. 2014, 54, 119–128. [Google Scholar] [CrossRef]
- Coppa, G.V.; Pierani, P.; Zampini, L.; Carloni, I.; Carlucci, A.; Gabrielli, O. Oligosaccharides in human milk during different phases of lactation. Acta Paediatr. Suppl. 1999, 88, 89–94. [Google Scholar] [CrossRef] [PubMed]
- Coppa, G.V.; Gabrielli, O.; Zampini, L.; Galeazzi, T.; Ficcadenti, A.; Padella, L.; Santoro, L.; Soldi, S.; Carlucci, A.; Bertino, E.; et al. Oligosaccharides in 4 different milk groups, bifidobacteria, and Ruminococcus obeum. J. Pediatr. Gastroenterol. Nutr. 2011, 53, 80–87. [Google Scholar] [CrossRef]
- Galeotti, F.; Coppa, G.V.; Zampini, L.; Maccari, F.; Galeazzi, T.; Padella, L.; Santoro, L.; Gabrielli, O.; Volpi, N. On-line high-performance liquid chromatography–fluorescence detection–electrospray ionization–mass spectrometry profiling of human milk oligosaccharides derivatized with 2-aminoacridone. Anal. Biochem. 2012, 430, 97–104. [Google Scholar] [CrossRef]
- Galeotti, F.; Coppa, G.V.; Zampini, L.; Maccari, F.; Galeazzi, T.; Padella, L.; Santoro, L.; Gabrielli, O.; Volpi, N. Capillary electrophoresis separation of human milk neutral and acidic oligosaccharides derivatized with 2-aminoacridone. Electrophoresis 2014, 35, 811–818. [Google Scholar] [CrossRef]
- Kunz, C.; Rudloff, S. Biological functions of oligosaccharides in human milk. Acta Paediatr. 1993, 82, 903–912. [Google Scholar] [CrossRef] [PubMed]
- Wang, Y.; Zhou, X.; Gong, P.; Chen, Y.; Feng, Z.; Liu, P.; Zhang, P.; Wang, X.; Zhang, L.; Song, L. Comparative major oligosaccharides and lactose between Chinese human and animal milk. Int. Dairy J. 2020, 108, 104727. [Google Scholar] [CrossRef]
- Monti, L.; Cattaneo, T.; Orlandi, M.; Curadi, M.C. Capillary electrophoresis of sialylated oligosaccharides in milk from different species. J. Chromatogr. A 2015, 1409, 288–291. [Google Scholar] [CrossRef]
- Aakko, J.; Kumar, H.; Rautava, S.; Wise, A.; Autran, C.; Bode, L.; Isolauri, E.; Salminen, S. Human milk oligosaccharide categories define the microbiota composition in human colostrum. Benef. Microbes 2017, 8, 563–567. [Google Scholar] [CrossRef]
- Alderete, T.L.; Autran, C.; Brekke, B.E.; Knight, R.; Bode, L.; Goran, M.I.; Fields, D.A. Associations between human milk oligosaccharides and infant body composition in the first 6 months of life. Am. J. Clin. Nutr. 2015, 102, 1381–1388. [Google Scholar] [CrossRef]
- Asakuma, S.; Akahori, M.; Kimura, K.; Watanabe, Y.; Nakamura, T.; Tsunemi, M.; Arai, I.; Sanai, Y.; Urashima, T. Sialyl oligosaccharides of human colostrum: Changes in concentration during the first three days of lactation. Biosci. Biotechnol. Biochem. 2007, 71, 1447–1451. [Google Scholar] [CrossRef] [PubMed] [Green Version]
- Asakuma, S.; Urashima, T.; Akahori, M.; Obayashi, H.; Nakamura, T.; Kimura, K.; Watanabe, Y.; Arai, I.; Sanai, Y. Variation of major neutral oligosaccharides levels in human colostrum. Eur. J. Clin. Nutr. 2008, 62, 488–494. [Google Scholar] [CrossRef] [Green Version]
- Asakuma, S.; Hatakeyama, E.; Urashima, T.; Yoshida, E.; Katayama, T.; Yamamoto, K.; Kumagai, H.; Ashida, H.; Hirose, J.; Kitaoka, M. Physiology of consumption of human milk oligosaccharides by infant gut-associated bifidobacteria. J. Biol. Chem. 2011, 286, 34583–34592. [Google Scholar] [CrossRef] [Green Version]
- Austin, S.; De Castro, C.A.; Bénet, T.; Hou, Y.; Sun, H.; Thakkar, S.K.; Vinyes-Pares, G.; Zhang, Y.; Wang, P. Temporal change of the content of 10 oligosaccharides in the milk of Chinese urban mothers. Nutrients 2016, 8, 346. [Google Scholar] [CrossRef] [PubMed] [Green Version]
- Azad, M.B.; Robertson, B.; Atakora, F.; Becker, A.B.; Subbarao, P.; Moraes, T.J.; Mandhane, P.J.; Turvey, S.; Lefebvre, D.L.; Sears, M.R.; et al. Human milk oligosaccharide concentrations are associated with multiple fixed and modifiable maternal characteristics, environmental factors, and feeding practices. J. Nutr. 2018, 148, 1733–1742. [Google Scholar] [CrossRef]
- Bao, Y.; Zhu, L.; Newburg, D.S. Simultaneous quantification of sialyloligosaccharides from human milk by capillary electrophoresis. Anal. Biochem. 2007, 370, 206–214. [Google Scholar] [CrossRef] [PubMed] [Green Version]
- Bao, Y.; Chen, C.; Newburg, D.S. Quantification of neutral human milk oligosaccharides by graphitic carbon high-performance liquid chromatography with tandem mass spectrometry. Anal. Biochem. 2013, 433, 28–35. [Google Scholar] [CrossRef] [PubMed] [Green Version]
- Borewicz, K.; Gu, F.; Saccenti, E.; Arts, I.C.; Penders, J.; Thijs, C.; van Leeuwen, S.; Lindner, C.; Nauta, A.; Van Leusen, E.; et al. Correlating infant fecal microbiota composition and human milk oligosaccharide consumption by microbiota of 1-month-old breastfed infants. Mol. Nutr. Food Res. 2019, 63, 1–13. [Google Scholar] [CrossRef] [PubMed]
- Borewicz, K.; Gu, F.; Saccenti, E.; Hechler, C.; Beijers, R.; De Weerth, C.; van Leeuwen, S.; Schols, H.A.; Smidt, H. The association between breastmilk oligosaccharides and faecal microbiota in healthy breastfed infants at two, six, and twelve weeks of age. Sci. Rep. 2020, 10, 1–12. [Google Scholar] [CrossRef]
- Csernák, O.; Rácz, B.; Alberti, Á.; Béni, S. Quantitative analysis of 3′- and 6′-sialyllactose in human milk samples by HPLC-MS/MS: A validated method for the comparison of two consecutive lactation periods in the same woman. J. Pharm. Biomed. Anal. 2020, 184, 113184. [Google Scholar] [CrossRef] [PubMed]
- Chaturvedi, P.; Warren, C.D.; Ruiz-Palacios, G.M.; Pickering, L.K.; Newburg, D.S. Milk oligosaccharide profiles by reversed-phase HPLC of their perbenzoylated derivatives. Anal. Biochem. 1997, 251, 89–97. [Google Scholar] [CrossRef] [PubMed]
- Chaturvedi, P.; Warren, C.D.; Altaye, M.; Morrow, A.L.; Ruiz-Palacios, G.; Pickering, L.K.; Newburg, D.S. Fucosylated human milk oligosaccharides vary between individuals and over the course of lactation. Glycobiology 2001, 11, 365–372. [Google Scholar] [CrossRef] [PubMed]
- Prieto, E. Milk types HMO and human genetics. In Bioactive Components of Human Milk; Springer: New York, NY, USA, 2001; pp. 285–297. [Google Scholar]
- Ferreira, A.L.; Alves, R.; Figueiredo, A.; Alves-Santos, N.; Freitas-Costa, N.; Batalha, M.; Yonemitsu, C.; Manivong, N.; Furst, A.; Bode, L.; et al. Human milk oligosaccharide profile variation Brazilian cohort. Nutrients 2020, 12, 790. [Google Scholar] [CrossRef] [PubMed] [Green Version]
- Hong, Q.; Ruhaak, L.R.; Totten, S.M.; Smilowitz, J.T.; German, J.B.; Lebrilla, C.B. Label-free absolute quantitation of oligosaccharides using multiple reaction monitoring. Anal. Chem. 2014, 86, 2640–2647. [Google Scholar] [CrossRef]
- Huang, G. Statistical analysis. Sch. Biomed. Eng. 2019, 335–375. [Google Scholar] [CrossRef]
- Kunz, C.; Rudloff, S.; Baie, W.; Klein, N.; St, S. Oligosaccharides in milk: Structural, functional, and metabolic aspects. Annu. Rev. Nutr. 2000, 20, 699–722. [Google Scholar] [CrossRef]
- Kunz, C.; Meyer, C.; Collado, M.C.; Geiger, L.; García-Mantrana, I.; Bertua-Ríos, B.; Martinez-Costa, C.; Borsch, C.; Rudloff, S. Influence of gestational age, secretor, and Lewis blood group status on the oligosaccharide content of human milk. J. Pediatr. Gastroenterol. Nutr. 2017, 64, 789–798. [Google Scholar] [CrossRef] [PubMed]
- Lagström, H.; Rautava, S.; Ollila, H.; Kaljonen, A.; Turta, O.; Mäkelä, J.; Yonemitsu, C.; Gupta, J.; Bode, L. Associations between human milk oligosaccharides and growth in infancy and early childhood. Am. J. Clin. Nutr. 2020, 111, 769–778. [Google Scholar] [CrossRef]
- Lefebvre, G.; Shevlyakova, M.; Charpagne, A.; Marquis, J.; Vogel, M.; Kirsten, T.; Kiess, W.; Austin, S.; Sprenger, N.; Binia, A. Time of lactation and maternal fucosyltransferase genetic polymorphisms determine the variability in human milk oligosaccharides. Front. Nutr. 2020, 7. [Google Scholar] [CrossRef] [PubMed]
- Leo, F.; Asakuma, S.; Nakamura, T.; Fukuda, K.; Senda, A.; Urashima, T. Improved determination of milk oligosaccharides using a single derivatization with anthranilic acid and separation by reversed-phase high-performance liquid chromatography. J. Chromatogr. A 2009, 1216, 1520–1523. [Google Scholar] [CrossRef] [PubMed]
- Leo, F.; Asakuma, S.; Fukuda, K.; Senda, A.; Urashima, T. Determination of sialyl and neutral oligosaccharide levels in transition and mature milks of samoan women, using anthranilic derivatization followed by reverse phase high performance liquid chromatography. Biosci. Biotechnol. Biochem. 2010, 74, 298–303. [Google Scholar] [CrossRef]
- Ma, L.; McJarrow, P.; Mohamed, H.J.B.J.; Liu, X.; Welman, A.; Fong, B.Y. Lactational changes in the human milk oligosaccharide concentration in Chinese and Malaysian mothers’ milk. Int. Dairy J. 2018, 87, 1–10. [Google Scholar] [CrossRef]
- Martín-Sosa, S.; Martín, M.-J.; García-Pardo, L.-A.; Hueso, P. Sialyloligosaccharides in human and bovine milk and in infant formulas: Variations with the progression of lactation. J. Dairy Sci. 2003, 86, 52–59. [Google Scholar] [CrossRef]
- McJarrow, P.; Radwan, H.; Ma, L.; MacGibbon, A.K.; Hashim, M.; Hasan, H.; Obaid, R.S.; Naja, F.; Mohamed, H.J.J.; Al Ghazal, H.; et al. Human milk oligosaccharide, phospholipid, and ganglioside concentrations in breast milk from United Arab Emirates mothers: Results from the MISC cohort. Nutrients 2019, 11, 2400. [Google Scholar] [CrossRef] [PubMed] [Green Version]
- Musumeci, M.; Simpore, J.; D’Agata, A.; Sotgiu, S.; Musumeci, S. Oligosaccharides in colostrum of Italian and Burkinabe women. JPGN 2006, 1, 1–15. [Google Scholar] [CrossRef] [PubMed] [Green Version]
- Nakano, T.; Sugawara, M.; Kawakami, H. Sialic acid in human milk: Composition and functions. Acta Paediatr. 2001, 42, 11–17. [Google Scholar]
- Nijman, R.M.; Liu, Y.; Bunyatratchata, A.; Smilowitz, J.T.; Stahl, B.; Barile, D. Characterization and quantification of oligosaccharides in human milk and infant formula. J. Agric. Food Chem. 2018, 66, 6851–6859. [Google Scholar] [CrossRef]
- Paganini, D.; Uyoga, M.A.; Kortman, G.A.M.; Boekhorst, J. Maternal human milk oligosaccharide profile and galacto-oligosaccharides in Kenyan infants. Nutrients 2019, 11, 2596. [Google Scholar] [CrossRef] [Green Version]
- Saben, J.L.; Abraham, A.; Bode, L.; Sims, C.R.; Andres, A. Third-Trimester glucose homeostasis in healthy women is differentially associated with human milk oligosaccharide composition at 2 months postpartum by secretor phenotype. Nutrients 2020, 12, 2209. [Google Scholar] [CrossRef]
- Sakaguchi, Y.; Hayama, T.; Yoshida, H.; Itoyama, M.; Todoroki, K.; Yamaguchi, M.; Nohta, H. Liquid chromatography/tandem mass spectrometry with fluorous derivatization method for selective analysis of sialyl oligosaccharides. Rapid Commun. Mass Spectrom. 2014, 28, 2481–2489. [Google Scholar] [CrossRef]
- Samuel, T.M.; Binia, A.; De Castro, C.A.; Thakkar, S.K.; Billeaud, C.; Agosti, M.; Al-Jashi, I.; Costeira, M.J.; Marchini, G.; Martínez-Costa, C.; et al. Impact of maternal characteristics on human milk oligosaccharide composition over the first 4 months of lactation in a cohort of healthy European mothers. Sci. Rep. 2019, 9, 1–10. [Google Scholar] [CrossRef]
- Sjögren, Y.M.; Duchén, K.; Lindh, F.; Bjorksten, B.; Sverremark-Ekström, E. Neutral oligosaccharides in colostrum in relation to maternal allergy and allergy development in children up to 18 months of age. Pediatr. Allergy Immunol. 2007, 18, 20–26. [Google Scholar] [CrossRef]
- Smilowitz, J.T.; O’Sullivan, A.; Barile, D.; German, J.B.; Lönnerdal, B.; Slupsky, C.M. The human milk metabolome reveals diverse oligosaccharide profiles. J. Nutr. 2013, 143, 1709–1718. [Google Scholar] [CrossRef] [Green Version]
- Sprenger, N.; Lee, L.Y.; De Castro, C.A.; Steenhout, P.; Thakkar, S.K. Longitudinal change of selected human milk oligosaccharides and association to infants’ growth, an observatory, single center, longitudinal cohort study. PLoS ONE 2017, 12, 1–15. [Google Scholar] [CrossRef] [Green Version]
- Sumiyoshi, W.; Urashima, T.; Nakamura, T.; Arai, I.; Saito, T.; Tsumura, N.; Wang, B.; Brand-Miller, J.; Watanabe, Y.; Kimura, K. Determination of each neutral oligosaccharide in the milk of Japanese women during the course of lactation. Br. J. Nutr. 2003, 89, 61. [Google Scholar] [CrossRef] [PubMed]
- Thurl, S.; Müller-Werner, B.; Sawatzki, G. Quantification of individual oligosaccharide compounds from human milk using high-pH anion-exchange chromatography. Anal. Biochem. 1996, 235, 202–206. [Google Scholar] [CrossRef]
- Thurl, S.; Munzert, M.; Henker, J.; Boehm, G.; Müller-Werner, B.; Jelinek, J.; Stahl, B. Variation of human milk oligosaccharides in relation to milk groups and lactational periods. Br. J. Nutr. 2010, 104, 1261–1271. [Google Scholar] [CrossRef] [Green Version]
- Tonon, K.; Miranda, A.; Abrão, A.C.; de Morais, M.B.; Morais, T.B. Validation and application of a method for the simultaneous absolute quantification of 16 neutral and acidic human milk oligosaccharides by graphitized carbon liquid chromatography-electrospray ionization-mass spectrometry. Food Chem. 2019, 274, 691–697. [Google Scholar] [CrossRef]
- Roldan, V.D.T.; S, M.U.; Gupta, J.; Yonemitsu, C.; Cárcamo, C.P.; Bode, L.; Ochoa, T.J. Human milk oligosaccharides and their association with late-onset neonatal sepsis in Peruvian very-low-birth-weight infants. Am. J. Clin. Nutr. 2020, 112, 106–112. [Google Scholar] [CrossRef]
- Williams, J.E.; Price, W.J.; Shafii, B.; Yahvah, K.M.; Bode, L.; McGuire, M.A.; McGuire, M.K. Relationships among microbial communities, maternal cells, oligosaccharides, and macronutrients in human milk. J. Hum. Lact. 2017, 33, 540–551. [Google Scholar] [CrossRef]
- Wu, K.-J.; Chen, Y.-H.; Bae, E.-K.; Song, Y.; Min, W.; Yu, S.-J. Human milk oligosaccharide 2′-fucosyllactose reduces neurodegeneration in stroke brain. Transl. Stroke Res. 2020, 11, 10–15. [Google Scholar] [CrossRef]
- Zhang, W.; Wang, T.; Chen, X.; Pang, X.; Zhang, S.; Obaroakpo, J.U.; Shilong, J.; Lu, J.; Lv, J. Absolute quantification of twelve oligosaccharides in human milk using a targeted mass spectrometry-based approach. Carbohydr. Polym. 2019, 219, 328–333. [Google Scholar] [CrossRef]
- Albrecht, S.A.; van den Heuvel, E.G.H.M.; Gruppen, H.; Schols, H.A. Gastrointestinal metabolization of human milk oligosaccharides. In Handbook of Dietary Nutritional Aspects of Human Breast Milk; Wageningen Academic Publishers: Wageningen, The Netherlands, 2013; pp. 293–314. [Google Scholar]
- Bode, L.; Zibadi, S.; Watson, R.R.; Preedy, V.R. Human milk oligosaccharides and their beneficial effects. Hum. Health Handb. 2013, 515–532. [Google Scholar] [CrossRef]
- Coppa, G. Total HMO and free Glc, Gal, Fuc in human milk. Pediatrics 1993, 91, 637–641. [Google Scholar]
- Montreuil, J.; Mullet, S. Etude des variations des constituents glucidiques du lait de femme au cours de la lactation. Bull. Soc. Chim. Biol. 1960, 42, 365–377. [Google Scholar]
- Newburg, D.S. Carbohydrates in Milks: Analysis, Quantities, and Significance; Academic Press: Cambridge, MA, USA, 1995. [Google Scholar]
- Viverge, D.; Grimmonprez, L.; Cassanas, G.; Bardet, L.; Bonnet, H.; Solère, M. Variations of lactose and oligosaccharides in milk from women of blood types secretor A or H, secretor Lewis, and secretor H/nonsecretor Lewis during the course of lactation. Ann. Nutr. Metab. 1985. [Google Scholar] [CrossRef] [PubMed]
- Viverge, D.; Grimmonprez, L.; Cassanas, G.; Bardet, L.; Solere, M. Variations in oligosaccharides and lactose in human milk during the first week of lactation. JPGN 1990, 11, 361–364. [Google Scholar] [CrossRef] [PubMed]
- Xu, G.; Davis, J.C.; Goonatilleke, E.; Smilowitz, J.T.; German, J.B.; Lebrilla, C.B. Absolute quantitation of human milk oligosaccharides reveals phenotypic variations during lactation. J. Nutr. 2017, 147, 117–124. [Google Scholar] [CrossRef] [PubMed] [Green Version]
- Ballard, O.; Morrow, A.L. Human milk composition. Pediatr. Clin. N. Am. 2013, 60, 49–74. [Google Scholar] [CrossRef] [PubMed] [Green Version]
- Guo, M. Human milk and infant formula. Funct. Foods 2009, 299–337. [Google Scholar] [CrossRef]
- EFSA. Scientific Opinion on the essential composition of infant and follow-on formulae. EFSA J. 2014, 12, 3760. [Google Scholar] [CrossRef] [Green Version]
- Wang, M.; Zhao, Z.; Zhao, A.; Zhang, J.; Wu, W.; Ren, Z.; Wang, P.; Zhang, Y. Neutral human milk oligosaccharides are associated with multiple fixed and modifiable maternal and infant characteristics. Nutrients 2020, 12, 826. [Google Scholar] [CrossRef] [Green Version]
- Plows, J.F.; Berger, P.K.; Jones, R.B.; Alderete, T.L.; Yonemitsu, C.; A Najera, J.; Khwajazada, S.; Bode, L.; Goran, M.I. Longitudinal changes in human milk oligosaccharides (HMOs) over the course of 24 months of lactation. J. Nutr. 2021, 151, 876–882. [Google Scholar] [CrossRef]
- Gu, F.; Wang, S.; Beijers, R.; de Weerth, C.; Schols, H.A. Structure-specific and individual-dependent metabolization of human milk oligosaccharides in infants: A longitudinal birth cohort study. J. Agric. Food Chem. 2021, 69, 6186–6199. [Google Scholar] [CrossRef] [PubMed]
- Charbonneau, M.R.; O’Donnell, D.; Blanton, L.V.; Totten, S.M.; Davis, J.C.; Barratt, M.J.; Cheng, J.; Guruge, J.; Talcott, M.; Bain, J.R.; et al. Sialylated milk oligosaccharides promote microbiota-dependent growth in models of infant undernutrition. Cell 2016, 164, 859–871. [Google Scholar] [CrossRef] [PubMed] [Green Version]
- Alliet, P.; Puccio, G.; Janssens, E.; Cajozzo, C.; Corsello, G.; Berger, B.; Sperisen, P.; Martin, F.-P.; Sprenger, N.; Steenhout, P. Term infant formula supplemented with human milk oligosaccharides (2′fucosyllactose and lacto-neotetraose) shifts stool microbiota closer to that of breastfed infants. JPGN 2016, 63, 52–53. [Google Scholar]


| Abbreviation | Name | Structure | Abbreviation | Name | Structure |
|---|---|---|---|---|---|
| Neutral HMOs (neutral core and neutral fucosylated) | Acidic non-fucosylated HMOs | ||||
| LNT | Lacto-N-tetraose |  | 3′-SL | 3′-Sialyllactose |  |
| LNnT | Lacto-N-neotetraose |  | 6′-SL | 6′-Sialyllactose |  |
| 2′-FL | 2′-Fucosyllactose |  | DSLNT | Disialyllacto-N-tetraose |  |
| 3-FL | 3-Fucosyllactose |  | LST c | Sialyllacto-N-neotetraose c |  |
| DFL (LDFT) | Difucosyllactose |  | Acidic fucosylated HMOs | ||
| LNDFH-I (DFLNT) | Lacto-N-difucohexaose I |  | FDS-LNH-I | Fucosyldisialyllacto-N-hexaose I |  |
| LNFP-I | Lacto-N-fucopentaose I |  |  | ||
| LNFP-II | Lacto-N-fucopentaose II |  | |||
| LNFP-III | Lacto-N-fucopentaose III |  | |||
| TF-LNH | Trifucosyllacto-N-hexaose |  | |||
| Secretor Status | Secretor | Non-Secretor | Secretor | Non-Secretor |
|---|---|---|---|---|
| Milk group | 1 | 2 | 3 | 4 |
| Milk Phenotype | Se+/Le(a−b+) | Se−/Le(a+b−) | Se+/Le(a−b−) | Se−/Le(a−b−) |
| α1,2-fucosylated HMOs (FUT2 enzyme 1) | + | − | + | − |
| α1,3-fucosylated HMOs (FUT3, FUT5, FUT6 enzymes) | + | + | + | + |
| α1,4-fucosylated HMOs (FUT3 enzyme) | + | + | − | − |
| Typical frequency in global population | 70% | 20% | 9% | 1% |
| Reference | Sample (Number of Donors) | Region | Population | Milk Type | Analytic Method |
|---|---|---|---|---|---|
| Aakko et al., 2017 [59] | 11 | Europe | Finland | Secretor | HPLC |
| Alderete et al., 2015 [60] | 25 | North America | USA | Pool | HPLC |
| Asakuma et al., 2007 [61] | 20 | Asia | Japan | Pool | HPLC |
| Asakuma et al., 2008 [62] | 12 | Europe | Italy | Pool | HPAEC |
| Asakuma et al., 2011 [63] | 57 | Asia | Japan | Pool | HPLC |
| Austin et al., 2016 [64] | 446 | Asia | China | Pool | HPLC |
| Austin et al., 2019 [48] | 25 | Europe | Switzerland | Secretor/Non-secretor | HPLC |
| Azad et al., 2018 [65] | 427 | North America | Canada | Secretor/Non-secretor | HPLC |
| Bao et al., 2007 [66] | 10 | North America | USA | Pool | CE |
| Bao et al., 2013 [67] | 1 | North America | USA | Secretor | HPLC-MS |
| Borewicz et al., 2019 [68] | 121 | Europe | Netherlands | Pool | LC-MS |
| Borewicz et al., 2020 [69] | 24 | Europe | Netherlands | Pool | UHPLC-MS/HPAEC-PAD |
| Csernak et al., 2020 [70] | 1 | Europe | Hungary | Pool | LC-MS |
| Chaturvedi et al., 1997 [71] | 50 | Latin America | Mexico | Pool | HPAEC-PAD |
| Chaturvedi et al., 2001 [72] | 12 | North America | USA | Secretor/Non-secretor | HPLC |
| Coppa et al., 1999 [52] | 18 | Europe | Italy | Secretor | HPAEC-PAD |
| Coppa et al., 2011 [53] | 39 | Europe | Italy | Secretor/Non-secretor | HPAEC |
| Erney et al., 2000 [36] | 4–129 | Asia, Europe, Latin America, North America | n.a. | Pool | HPAEC |
| Erney et al., 2001 [73] | 368 | North America, Europe | n.a. | Pool | HPAEC |
| Ferreira et al., 2020 [74] | 75 | Latin America | Brazil | Pool | HPLC |
| Galeotti et al., 2014 [55] | 3 | Europe | n.a. | Secretor/Non-secretor | CE-UV |
| Hong et al., 2014 [75] | 20 | North America | USA | Secretor/Non-secretor | LC-MS/MS-MRM |
| Huang et al., 2019 [76] | 33 | Asia | China | Pool | UHPLC |
| Kunz et al., 2000 [77] | 4 | Europe | n.a. | Pool | HPAEC-PAD |
| Kunz et al., 2017 [78] | 21 | Europe | Spain | Secretor/Non-secretor | HPAEC-PAD |
| Lagström et al., 2020 [79] | 802 | Europe | Finland | Pool | HPLC |
| Lefebvre et al., 2020 [80] | 28-156 | Europe | Germany | Pool | LC |
| Leo et al., 2009 [81] | 8 | Asia Pacific | Samoa | Pool | HPLC |
| Leo et al., 2010 [82] | 16 | Asia Pacific | Samoa | Pool | HPLC |
| Ma et al., 2018 [83] | 20 | Asia | China, Malaysia | Pool | HPLC-MS |
| Martin-Sosa et al., 2003 [84] | 12 | Europe | Spain | Pool | HPLC |
| McGuire et al., 2017 [37] | 40 | North America, Africa, Europe, Latin America | Ethiopia, Africa, Ghana, Kenya, Peru, Spain, Sweden, USA | Secretor/Non-secretor | HPLC |
| McJarrow et al., 2019 [85] | 9 | Middle East | UAE | Pool | HPLC-MS |
| Morrow et al., 2004 [35] | 93 | Latin America | n.a. | Pool | HPLC |
| Moubareck et al., 2020 [49] | 18 | Asia, Middle East | UAE, Iran, Oman, Yemen, Syria, India, Switzerland, UK | Pool | HPAEC |
| Musumeci et al., 2006 [86] | 53 | Africa | Burkina Faso | Pool | HPAEC |
| Nakhla et al., 1999 [43] | 2 | North America | USA | Pool, Secretor/Non-secretor | HPAEC |
| Nakano et al., 2001 [87] | 2434 | Asia | Japan | Pool | n.a. |
| Nijman et al., 2018 [88] | 10 | North America | USA | Pool | Nano-HPLC TOF |
| Olivares et al., 2014 [51] | 24 | Europe | n.a. | Secretor/Non-secretor | CE-LIF |
| Paganini et al., 2019 [89] | 75 | Africa | Kenya | Secretor/Non-secretor | HPAEC |
| Saben et al., 2020 [90] | 136 | North America | USA | Pool | HPLC |
| Sakaguchi et al., 2014 [91] | 1 | Asia | Japan | n.a. | LC-MS |
| Samuel et al., 2019 [92] | 290 | Europe | n.a. | Pool | HPLC |
| Sjogren et al., 2007 [93] | 11 | Europe | Sweden | Pool | HPLC |
| Smilowitz et al., 2013 [94] | 52 | North America | USA | Pool | NMR |
| Spevacek at al., 2015 [47] | 15 | North America | USA | Pool | NMR |
| Sprenger et al., 2017 [95] | 34 | Asia | Singapore | Secretor/Non-secretor | HPAEC-PAD |
| Sumiyoshi et al., 2003 [96] | 16 | Asia | Japan | Pool | HPLC |
| Thurl et al., 1996 [97] | 1 | Europe | n.a. | Secretor | HPAEC |
| Thurl et al., 2010 [98] | 109 | Europe | Germany | Secretor/Non-secretor | HPAEC |
| Tonon et al., 2019 [27] | 78 | Latin America | Brazil | Secretor/Non-secretor | LC-MS |
| Tonon et al., 2019 [99] | 10 | Latin America | Brazil | Pool | HPLC |
| Torres Roldan et al. 2020 [100] | 153 | Latin America | Peru | Pool | HPLC |
| Williams et al., 2017 [101] | 16 | North America | USA | Pool | HPLC-FL |
| Wu Wei et al., 2020 [102] | 222 | Asia | China | Secretor/Non-secretor | HPAEC |
| Zhang et al., 2019 [103] | 61 | Asia | China | Pool | LC-MS/MS-MRM |
| Lactation Period | Number of Articles | Number of HMOs Quantified | Total Sample Size |
|---|---|---|---|
| Colostrum (0–5 days) | 27 | 34 | 3785 |
| Transitional (6–14 days) | 20 | 28 | 3356 |
| Mature (15–90 days) | 48 | 36 | 6094 |
| Late (>90 days) | 15 | 28 | 4406 |
| Lactation Period | Number of Articles | Total Sample Size |
|---|---|---|
| Colostrum (0–5 days) | 8 | 123 |
| Transitional (6–14 days) | 5 | 106 |
| Mature (15–90 days) | 10 | 216 |
| Colostrum (0–5 Days) | 2’-FL | LNDFH-I (DF-LNT) | LNFP-I | LNFP-II | LNT | 3-FL | 6’-SL | DSLNT | LNnT | DFL (LDFT) | FDS-LNH | LNFP-III | 3’-SL | LST c | TF-LNH |
|---|---|---|---|---|---|---|---|---|---|---|---|---|---|---|---|
| Total sample size | 1101 | 885 | 1165 | 1027 | 916 | 833 | 3319 | 796 | 877 | 320 | 205 | 622 | 3391 | 962 | 96 |
| Minimum mean | 0.69 | 0.53 | 0.16 | 0.02 | 0.20 | 0.19 | 0.00 | 0.00 | 0.07 | 0.04 | 0.08 | 0.02 | 0.00 | 0.00 | 0.09 |
| Median | 2.30 | 0.82 | 0.93 | 0.53 | 0.62 | 0.73 | 0.45 | 0.30 | 0.31 | 0.32 | 0.29 | 0.20 | 0.14 | 0.16 | 0.27 |
| Maximum mean | 4.28 | 2.1 | 2.14 | 1.18 | 1.60 | 1.90 | 0.74 | 1.12 | 1.24 | 0.54 | 0.67 | 0.89 | 0.67 | 0.30 | 0.41 |
| Mean of means | 3.18 | 1.03 | 0.83 | 0.78 | 0.73 | 0.72 | 0.40 | 0.38 | 0.37 | 0.29 | 0.28 | 0.26 | 0.19 | 0.17 | 0.25 |
| Transitional (6–14 days) | |||||||||||||||
| Total sample size | 789 | 209 | 798 | 297 | 645 | 693 | 5488 | 75 | 230 | 62 | - | 113 | 5488 | 194 | 39 |
| Minimum mean | 0.10 | 0.37 | 0.37 | 0.00 | 0.36 | 0.10 | 0.00 | 0.00 | 0.15 | 0.40 | - | 0.07 | 0.00 | 0.00 | 0.11 |
| Median | 2.60 | 1.10 | 1.1 | 0.29 | 0.88 | 0.51 | 0.73 | 0.644 | 0.41 | 0.68 | - | 0.4 | 0.13 | 0.488 | 0.23 |
| Maximum mean | 2.88 | 1.81 | 1.932 | 1.452 | 3.9 | 1.67 | 1.297 | 1.3 | 1.033 | 0.7 | - | 0.74 | 0.25 | 0.941 | 0.23 |
| Mean of means | 2.07 | 1.06 | 1.11 | 0.33 | 1.07 | 0.59 | 0.71 | 0.67 | 0.47 | 0.56 | - | 0.37 | 0.13 | 0.55 | 0.17 |
| Mature (15–90 days) | |||||||||||||||
| Total sample size | 4048 | 2766 | 4156 | 3220 | 3841 | 3747 | 5691 | 1261 | 4048 | 3035 | 668 | 2650 | 6014 | 1549 | 345 |
| Minimum mean | 0.69 | 0.005 | 0.16 | 0.02 | 0.2 | 0.16 | 0.00 | 0.00 | 0.06 | 0.04 | 0.08 | 0.02 | 0.00 | 0.00 | 0.04 |
| Median | 2.3 | 1.074 | 0.93 | 0.539 | 0.62 | 0.73 | 0.45 | 0.3 | 0.31 | 0.32 | 0.29 | 0.2 | 0.14 | 0.159 | 0.18 |
| Maximum mean | 4.28 | 2.53 | 2.14 | 1.814 | 1.60 | 1.9 | 0.74 | 1.122 | 1.24 | 0.54 | 0.67 | 0.89 | 0.7 | 0.3 | 0.39 |
| Mean of means | 2.28 | 1.10 | 0.83 | 0.78 | 0.74 | 0.72 | 0.403 | 0.38 | 0.372 | 0.293 | 0.29 | 0.26 | 0.19 | 0.17 | 0.15 |
| Late (>90 days) | |||||||||||||||
| Total sample size | 1951 | 1170 | 1885 | 990 | 1616 | 1885 | 4913 | 1014 | 1738 | 1276 | 71 | 990 | 3751 | 1227 | 33 |
| Minimum mean | 0.00 | 0.00 | 0.00 | 0.00 | 0.10 | 0.26 | 0.01 | 0.13 | 0.04 | 0.00 | 0.04 | 0.05 | 0.08 | 0.00 | 0.20 |
| Median | 1.72 | 0.67 | 0.43 | 0.35 | 0.56 | 1.18 | 0.19 | 0.20 | 0.19 | 0.27 | 0.16 | 0.22 | 0.13 | 0.04 | 0.20 |
| Maximum mean | 4.27 | 1.39 | 0.97 | 0.61 | 1.37 | 2.57 | 1.00 | 0.31 | 0.61 | 0.58 | 0.16 | 0.77 | 0.30 | 0.25 | 0.20 |
| Mean of means | 1.65 | 0.87 | 0.41 | 0.27 | 0.64 | 0.92 | 0.30 | 0.22 | 0.19 | 0.27 | 0.12 | 0.23 | 0.13 | 0.08 | 0.20 |
| Reference | Sample Size | Region | Population | Analytical Method |
|---|---|---|---|---|
| Albrecht et al., 2013 [104] | n.a. | Europe | Netherlands | CE-LIF-MS |
| Bode, 2013 [105] | n.a. | n.a. | n.a. | n.a. |
| Coppa et al., 1993 [106] | 46 | Europe | Italy | HPLC |
| Coppa et al., 2011 [53] | 39 | Europe | Italy | HPAEC |
| Ferreira et al., 2020 [74] | 52 | Latin America | Brazil | HPLC-FL |
| McGuire et al., 2017 [37] | 40 | International cohort | - | HPLC |
| Montreuil et al., 1960 [107] | n.a. | Europe | France | Chromatography |
| Newburg et al., 1995 [108] | n.a. | n.a. | n.a. | n.a. |
| Nijman et a., 2018 [88] | 10 | North America | USA | HPAEC-PAD |
| Viverge et al., 1985 [109] | n.a. | Europe | France | Chromatography |
| Viverge et al., 1990 [110] | 15 | Europe | France | Chromatography |
| Xu et al., 2017 [111] | 45 | Africa, North America | Malawi, USA | UPLC |
| Colostrum (0–5 Days) | Transitional (6–14 Days) | Mature (14–90 Days) | |
|---|---|---|---|
| Minimum | 9.1 | 6.2 | 8.6 |
| Median | 16.7 | 16 | 10.3 |
| Maximum | 25 | 20 | 16.8 |
| Mean | 17.7 | 13.3 | 11.3 |
| Std. Deviation | 3.3 | 6.5 | 2.2 |
Publisher’s Note: MDPI stays neutral with regard to jurisdictional claims in published maps and institutional affiliations. |
© 2021 by the authors. Licensee MDPI, Basel, Switzerland. This article is an open access article distributed under the terms and conditions of the Creative Commons Attribution (CC BY) license (https://creativecommons.org/licenses/by/4.0/).
Share and Cite
Soyyılmaz, B.; Mikš, M.H.; Röhrig, C.H.; Matwiejuk, M.; Meszaros-Matwiejuk, A.; Vigsnæs, L.K. The Mean of Milk: A Review of Human Milk Oligosaccharide Concentrations throughout Lactation. Nutrients 2021, 13, 2737. https://doi.org/10.3390/nu13082737
Soyyılmaz B, Mikš MH, Röhrig CH, Matwiejuk M, Meszaros-Matwiejuk A, Vigsnæs LK. The Mean of Milk: A Review of Human Milk Oligosaccharide Concentrations throughout Lactation. Nutrients. 2021; 13(8):2737. https://doi.org/10.3390/nu13082737
Chicago/Turabian StyleSoyyılmaz, Buket, Marta Hanna Mikš, Christoph Hermann Röhrig, Martin Matwiejuk, Agnes Meszaros-Matwiejuk, and Louise Kristine Vigsnæs. 2021. "The Mean of Milk: A Review of Human Milk Oligosaccharide Concentrations throughout Lactation" Nutrients 13, no. 8: 2737. https://doi.org/10.3390/nu13082737