Article

Placental Antioxidant Defenses and Autophagy-Related Genes in Maternal Obesity and Gestational Diabetes Mellitus

1
Department of Pathophysiology and Transplantation, Università degli Studi di Milano, 20054 Segrate, Italy
2
Department of Biomedical and Clinical Sciences “Luigi Sacco”, Università degli Studi di Milano, 20157 Milano, Italy
3
Department of Woman, Mother and Child, Luigi Sacco and Vittore Buzzi Children Hospital, ASST Fatebenefratelli-Sacco, Università degli Studi di Milano, 20154 Milano, Italy
4
Institute of Molecular Bioimaging and Physiology, National Research Council (IBFM-CNR), 20054 Segrate, Italy
*
Authors to whom correspondence should be addressed.
These authors contributed equally to this work.
Nutrients 2021, 13(4), 1303; https://doi.org/10.3390/nu13041303
Submission received: 8 February 2021 / Revised: 9 April 2021 / Accepted: 12 April 2021 / Published: 15 April 2021
(This article belongs to the Section Nutrition and Public Health)

Abstract

:
Maternal obesity and gestational diabetes mellitus (GDM) are increasing worldwide, representing risk factors for both mother and child short/long-term outcomes. Oxidative stress, lipotoxicity and altered autophagy have already been reported in obesity, but few studies have focused on obese pregnant women with GDM. Antioxidant and macro/chaperone-mediated autophagy (CMA)-related gene expressions were evaluated herein in obese and GDM placentas. A total of 47 women with singleton pregnancies delivered by elective cesarean section were enrolled: 16 normal weight (NW), 18 obese with no comorbidities (OB GDM(–)), 13 obese with GDM (OB GDM(+)). Placental gene expression was assessed by real-time PCR. Antioxidant gene expression (CAT, GPX1, GSS) decreased, the pro-autophagic ULK1 gene increased and the chaperone-mediated autophagy regulator PHLPP1 decreased in OB GDM(–) vs. NW. On the other hand, PHLPP1 expression increased in OB GDM(+) vs. OB GDM(–). When analyzing results in relation to fetal sex, we found sexual dimorphism for both antioxidant and CMA-related gene expressions. These preliminary results can pave the way for further analyses aimed at elucidating the placental autophagy role in metabolic pregnancy disorders and its potential targetability for the treatment of diabetes outcomes.

Graphical Abstract

1. Introduction

Maternal obesity (MO) is expanding exponentially worldwide to almost epidemic proportions, representing a significant risk factor for negative pregnancy outcomes, with short- and long-term consequences for both the child and the mother [1,2]. Gestational diabetes mellitus (GDM) is the most frequent complication of pregnancy, presenting in 2–14% of cases [3]. Up to 50% of obese women (OB) develop GDM during pregnancy, with an increased risk for the mother to later develop type 2 diabetes. Moreover, the adverse intrauterine environment of MO and GDM alters the programming of fetal metabolic functions [4], yielding possible intergenerational effects [5], thus perpetuating a vicious cycle that has become a major public health concern [1].
MO and GDM have been associated with a specific placental phenotype characterized by low-grade inflammation, increased oxidative stress (OxS) and release of reactive oxygen species (ROS) from placental mitochondria (mt) [6]. We recently reported increased mt DNA levels in placentas of OB, further characterized by marked dysfunctional morphology in GDM [7].
Autophagy is a dynamic mechanism employed by cells to get rid of altered proteins or macromolecules and defective organelles. It allows the maintenance of cell homeostasis under environmental stress, cooperating with the main enzymes of the antioxidant system, physiologically reducing cellular ROS levels [8].
Autophagic mechanisms are known to be induced in response to nutrient limitation or to OxS and inhibited by an excess of amino acids and growth factors or insulin altering the intracellular milieu [9]. These cytotoxic insults interfere with the autophagic regulation depending on the tissue type [10].
Autophagy includes different aspecific and specific processes. Macroautophagy is involved in the non-specific degradation of different cellular components. On the other hand, chaperone-mediated autophagy (CMA) is responsible for the degradation of specific cytosolic proteins inside lysosomes, and it has been reported to be necessary for cell homeostasis [11,12]. Autophagic processes can be triggered by OxS [13], also in its genotoxic form [14], as well as metabolic stress [15], intracellular glucose excess [16] and hypoxia [17,18].
Autophagy in pregnancy is becoming a new challenge of research [17,18,19]. Inadequate regulation of the ROS–autophagy axis in early pregnancy leads to impaired autophagy activity and contributes to the development of preeclampsia and intrauterine growth restriction, two pregnancy pathologies characterized by placental insufficiency [9]. However, very few studies have focused on placental autophagy in relation to obesity with or without GDM [19,20,21]. Moreover, as far as we know, no evidence of chaperone-mediated autophagy is described for human placentas.
In this paper, we aim to analyze placental molecular events related to autophagy in the context of metabolic disorders of pregnancy, to elucidate any possible relation between clinical features and this complex pathway, with the purpose of understanding new pathogenic deregulations and identifying new potential therapeutic targets.

2. Materials and Methods

2.1. Population

Pregnant women were enrolled in the Obstetric Units of the L. Sacco Hospital and the V. Buzzi Children Hospital (ASST Fatebenefratelli-Sacco) in Milan.
The study was conducted in accordance with the Declaration of Helsinki and in compliance with all current Good Clinical Practice guidelines, local laws, regulations and organizations. The protocol was approved by the hospital ethical committee (Prot. N. 17739/2018). All participants gave their informed consent to collect personal data and biological samples.
Forty-seven Caucasian pregnant women with single-term pregnancies were prospectively recruited at elective cesarean section. The study population was divided according to pre-pregnancy body mass index (BMI, kg/m2), following the 2009 Institute of Medicine (IOM) guidelines [22]:
  • Normal Weight (NW) women: 18 ≤ BMI < 25, n = 16;
  • Obese (OB) women: BMI ≥ 30, n = 31.
According to the protocols in use, counselling was provided for dietary and lifestyle intervention to reach the appropriate gestational weight gain (GWG, kg) according to pregestational BMI and as recommended by the IOM [22]:
  • NW women: 11.5 ≤ GWG ≤ 16;
  • OB women: 5 ≤ GWG ≤ 9.
Gestational diabetes mellitus (GDM) was diagnosed in a subgroup of OB women (OB GDM(+), n = 13) according to the International Federation of Gynecology and Obstetrics (FIGO) guidelines, by the Oral Glucose Tolerance Test (OGTT-75 g) performed at 24–28 weeks of gestation [23,24]. The OGTT procedure requires a fasting blood glucose test (OGTT I) and then glycemia checks after 60 min (OGTT II) and after 120 min (OGTT III) from the administration of 75 g of anhydrous glucose dissolved in 300 mL of water. Blood glucose quantification at each time point was performed after venous blood withdrawal and standardized clinical biochemistry laboratory dosage by enzymatic spectrophotometric analysis (the hexokinase/glucose-6-phosphate dehydrogenase (g6pd) method). GDM was diagnosed for one or more glycemic curve values higher than 92,180,153 mg/dL [23].
Mothers presenting comorbidities different from GDM (i.e., hypertension, autoimmune diseases) or other pregnancy complications (e.g., preeclampsia, infections, congenital/genetic abnormalities) were excluded.

2.2. Placental Tissue Sample Collection

Human placentas were collected immediately after elective cesarean section, cleaned of excess blood and then weighed after discarding the membranes and cord from the disc. Biometric measurements were performed as previously described [25,26]. Briefly, placental area was estimated by calculating the area of an ellipse from the diameters (D × d × π/4). Assuming constant density, placental thickness was obtained as weight divided by area. Placental efficiency was calculated as the ratio between fetal weight and placental weight.
Chorionic villi biopsies of 1 cm3 were collected in different sites of the placental disc (central, median and peripheral) from the maternal side, after discarding the maternal decidua. Placental tissue samples were carefully washed in phosphate-buffered saline to eliminate excessive blood and conserved in RNAlater at −80 °C.

2.3. Gene Expression Analysis

Placental tissue samples were mechanically shredded in a Potter homogenizer with TRI Reagent and total RNA was extracted from the tissue homogenate using the column-based RiboPure Kit (ThermoFisher Scientific Baltics UAB, Vilnius, Lituania) following the manufacturer’s instructions. RNA concentration was determined spectrophotometrically by NanoDrop ND-1000 (NanoDrop Technologies, Wilmington, DE, USA), and then 2 μg of RNA were retrotranscribed using the GoScript Reverse Transcription Mix, Random Primers (Promega, Madison, WI, USA), following the manufacturer’s instructions. For the real-time assay, 4 ng of cDNA were used for each sample amplification.
The expression of antioxidant defenses (CATalase-CAT), Glutathione SynthetaSe-GSS, Glutathione ReductaSe-GSR, Glutathione PeroXidase 1-GPX1), macroautophagy (Unc-51-Like Kinase 1-ULK1, BECliN-BECN1), chaperone-mediated autophagy (Heat Shock Cognate 70 protein-HSC70), Lysosomal Associated Membrane Protein 2A (LAMP-2A) and Pleckstrin Homology domain and Leucine-rich repeat Protein Phosphatase 1 (PHLPP1) and autophagy-related (Nuclear factor erythroid 2-Related Factor 2-NRF2), Hypoxia-Inducible Factor 1 (HIF-1α), Vascular Endothelial Growth Factor (VEGF) genes was quantified by real-time PCR (7500 Fast Real-Time PCR System, Applied Biosystem) with SYBR Green chemistry (Promega, Madison, WI, USA), in triplicate. Primers and amplicon details are shown in Table 1.
Gene expressions were obtained by a normalization strategy that allows using two different housekeeping genes simultaneously and takes into account the amplification efficiency of each assay in the specific investigated tissue. Specifically, E−ΔCq/NF was determined, where E is the amplification efficiency of each assay (calculated by a calibration curve) and NF is the normalization factor. This normalization factor was calculated from the geometric mean of two selected housekeeping genes [27], β-actin (Beta-actin) and YWHAZ (Tyrosine 3-Monooxygenase/Tryptophan 5-Monooxygenase Activation Protein Zeta).
In more detail, for each sample and assay, the relative quantity Q was calculated:
Q = E−ΔCq, where E is the amplification efficiency of each assay and
ΔCq = sample Cq—reference Cq (the reference is a chosen subject, i.e., the one showing the lowest Cq value).
The normalization factor (NF) was then calculated from the geometric mean (GM) of the relative quantities (Q) of the two endogenous control genes:
NF = GM   of   b a c t i n   and   Y W H A Z   relative   quantities   ( Q )   for   each   sample GM   of   all   the   geometric   means
Lastly, for each sample, the expression of target genes was calculated by Q NF .
Only Cq values with standard deviation ≤0.25 across triplicates were included in the statistical analysis.

2.4. Statistical Analysis
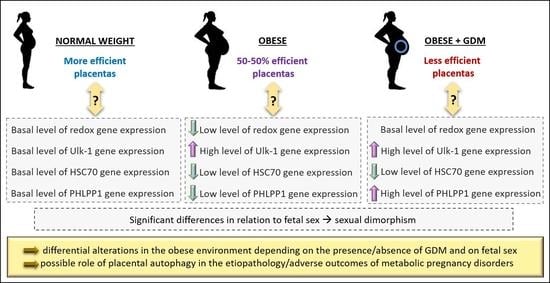
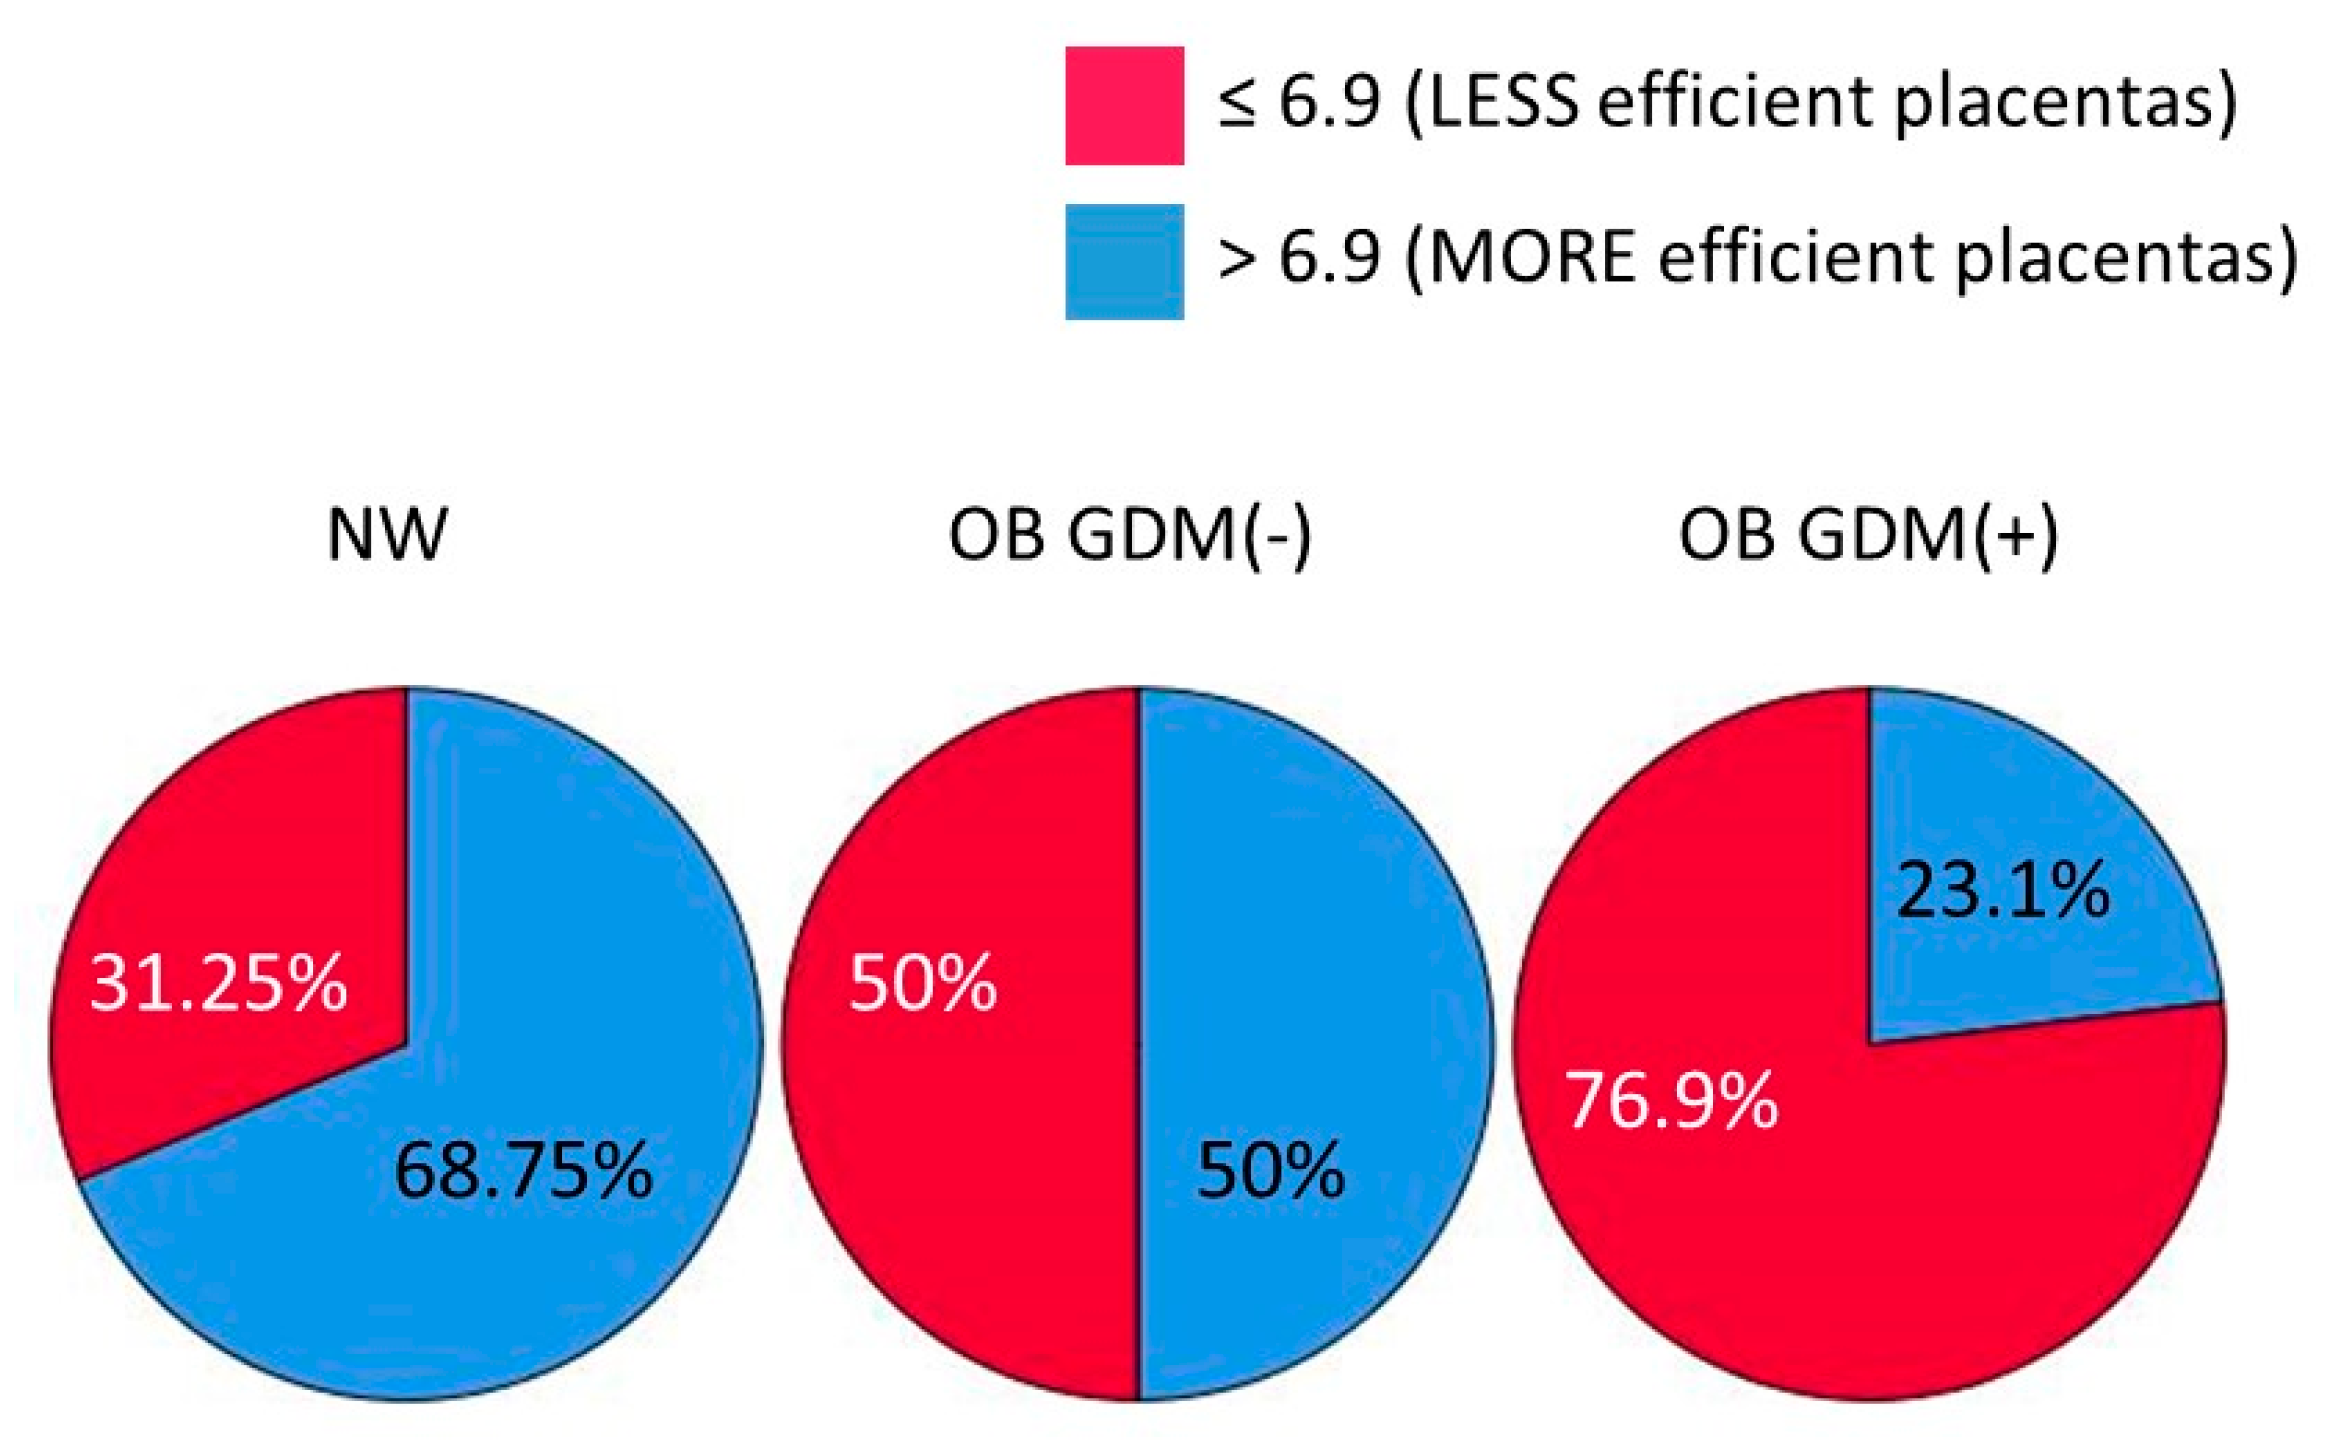
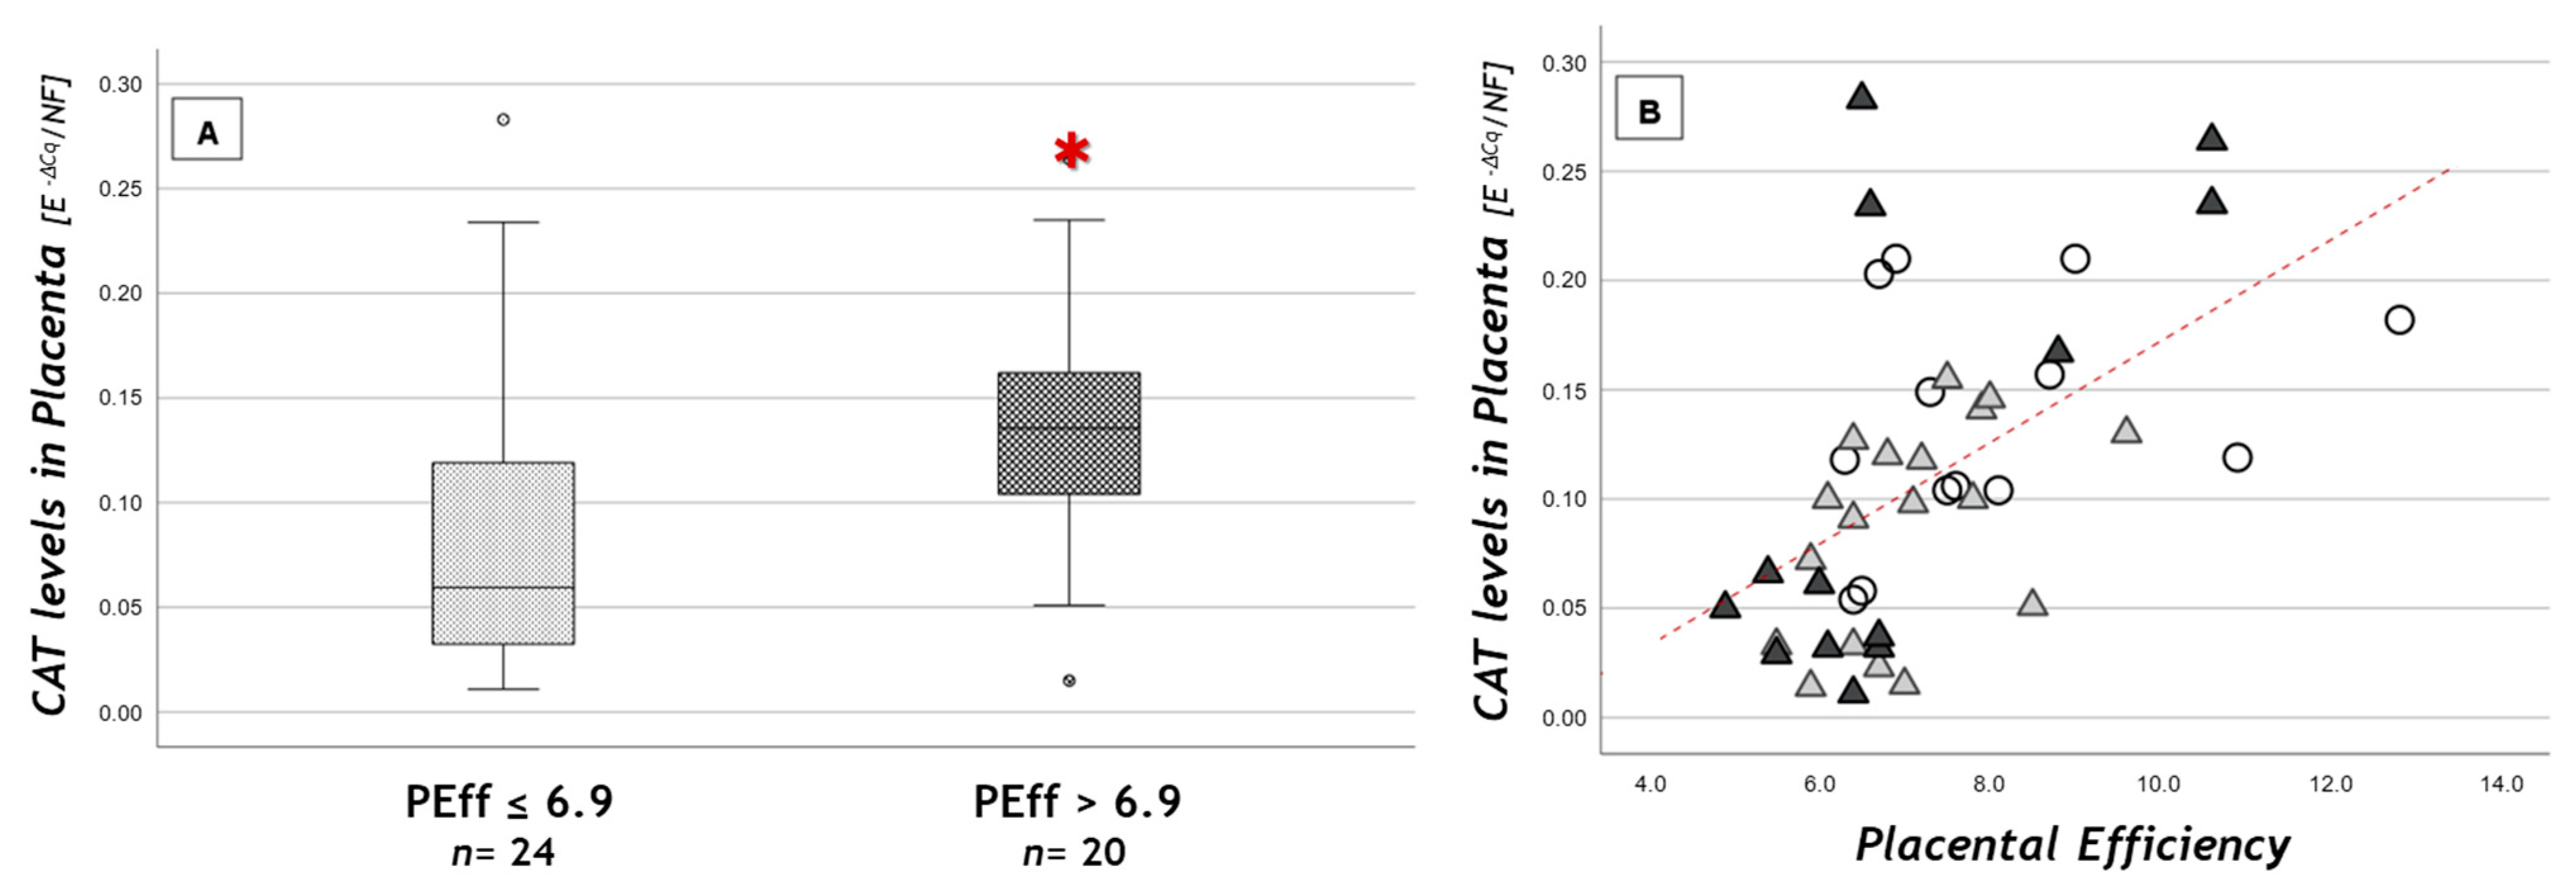
Maternal characteristics, placental and fetal data and gene expression values were compared among groups by One-way ANOVA or the Kruskal–Wallis test according to data distribution (assessed by the Kolmogorov–Smirnov test). In post hoc analyses, Tukey’s HSD test and the Mann–Whitney U test with Bonferroni correction (thus considering statistical significance when p ≤ 0.017, as three groups were analyzed) were used.
Frequencies of placental efficiency, using its median value (6.9) as cut-off, and of fetal sex were evaluated among population groups by performing the chi-square test.
A Two-way ANOVA was conducted to explore the impact of maternal characteristics (pregestational BMI and hyperglycemia) and fetal sex on fetal and placental parameters and gene expression.
Comparisons between the two subgroups of placentas with different efficiency were performed using the independent sample t-test or the Mann–Whitney U test according to data distribution.
Correlations between variables were assessed using the Spearman rank order correlation.
Differences and correlations were considered significant when p < 0.05.
Analyses were performed using the statistical package SPSS, v.26 (IBM; Armonk, NY, USA).

3. Results

3.1. Clinical Data

Table 2 summarizes maternal, fetal and placental data of the three study groups.
OB GDM(−) women were significantly younger than the other mothers.
Following defined inclusion criteria, both obese groups had significantly higher pregestational BMI than NW, and OB GDM(+) showed significantly higher OGTT values than normoglycemic groups.
Gestational weight gain was lower in OB women, as suggested by the IOM (11.5–16 kg for NW; 5–9 kg for OB).
No significant differences were observed among groups for gestational age and fetal weight.
Placental efficiency (fetal weight/placental weight) was lower in the OB groups vs. NW, and OB women placentas were heavier and thicker compared to NW, though not significantly.
Interestingly, when using the median value of placental efficiency (6.9) as a cut-off to split placentas into subgroups of different efficiency, we found a significant difference in their distribution among the three study groups (chi-square test: χ2 (1, n = 47) = 6.001, p = 0.049, Φ = 0.36). Indeed, most of the placentas from NW women (68.75%), but only 23.1% of those from OB GDM(+) women, were in the “more efficient” subgroup. Differently, OB GDM(−) placentas were equally distributed in the two subgroups of efficiency (50%) (Figure 1).
A Two-way ANOVA was conducted to explore the impact of maternal characteristics (pregestational BMI and GDM) and fetal sex on these (i.e., fetal weight, placental weight and efficiency) parameters. The interaction effect between maternal BMI/GDM and fetal sex was not statistically significant. In the whole population and within each BMI group, no significant differences were found between male and female fetuses for these parameters.
Interestingly, when comparing the three BMI groups separately in female fetuses and male fetuses, placentas of OB GDM(+) women resulted in being significantly heavier and less efficient than NW in the female fetuses subgroup (Table 3).

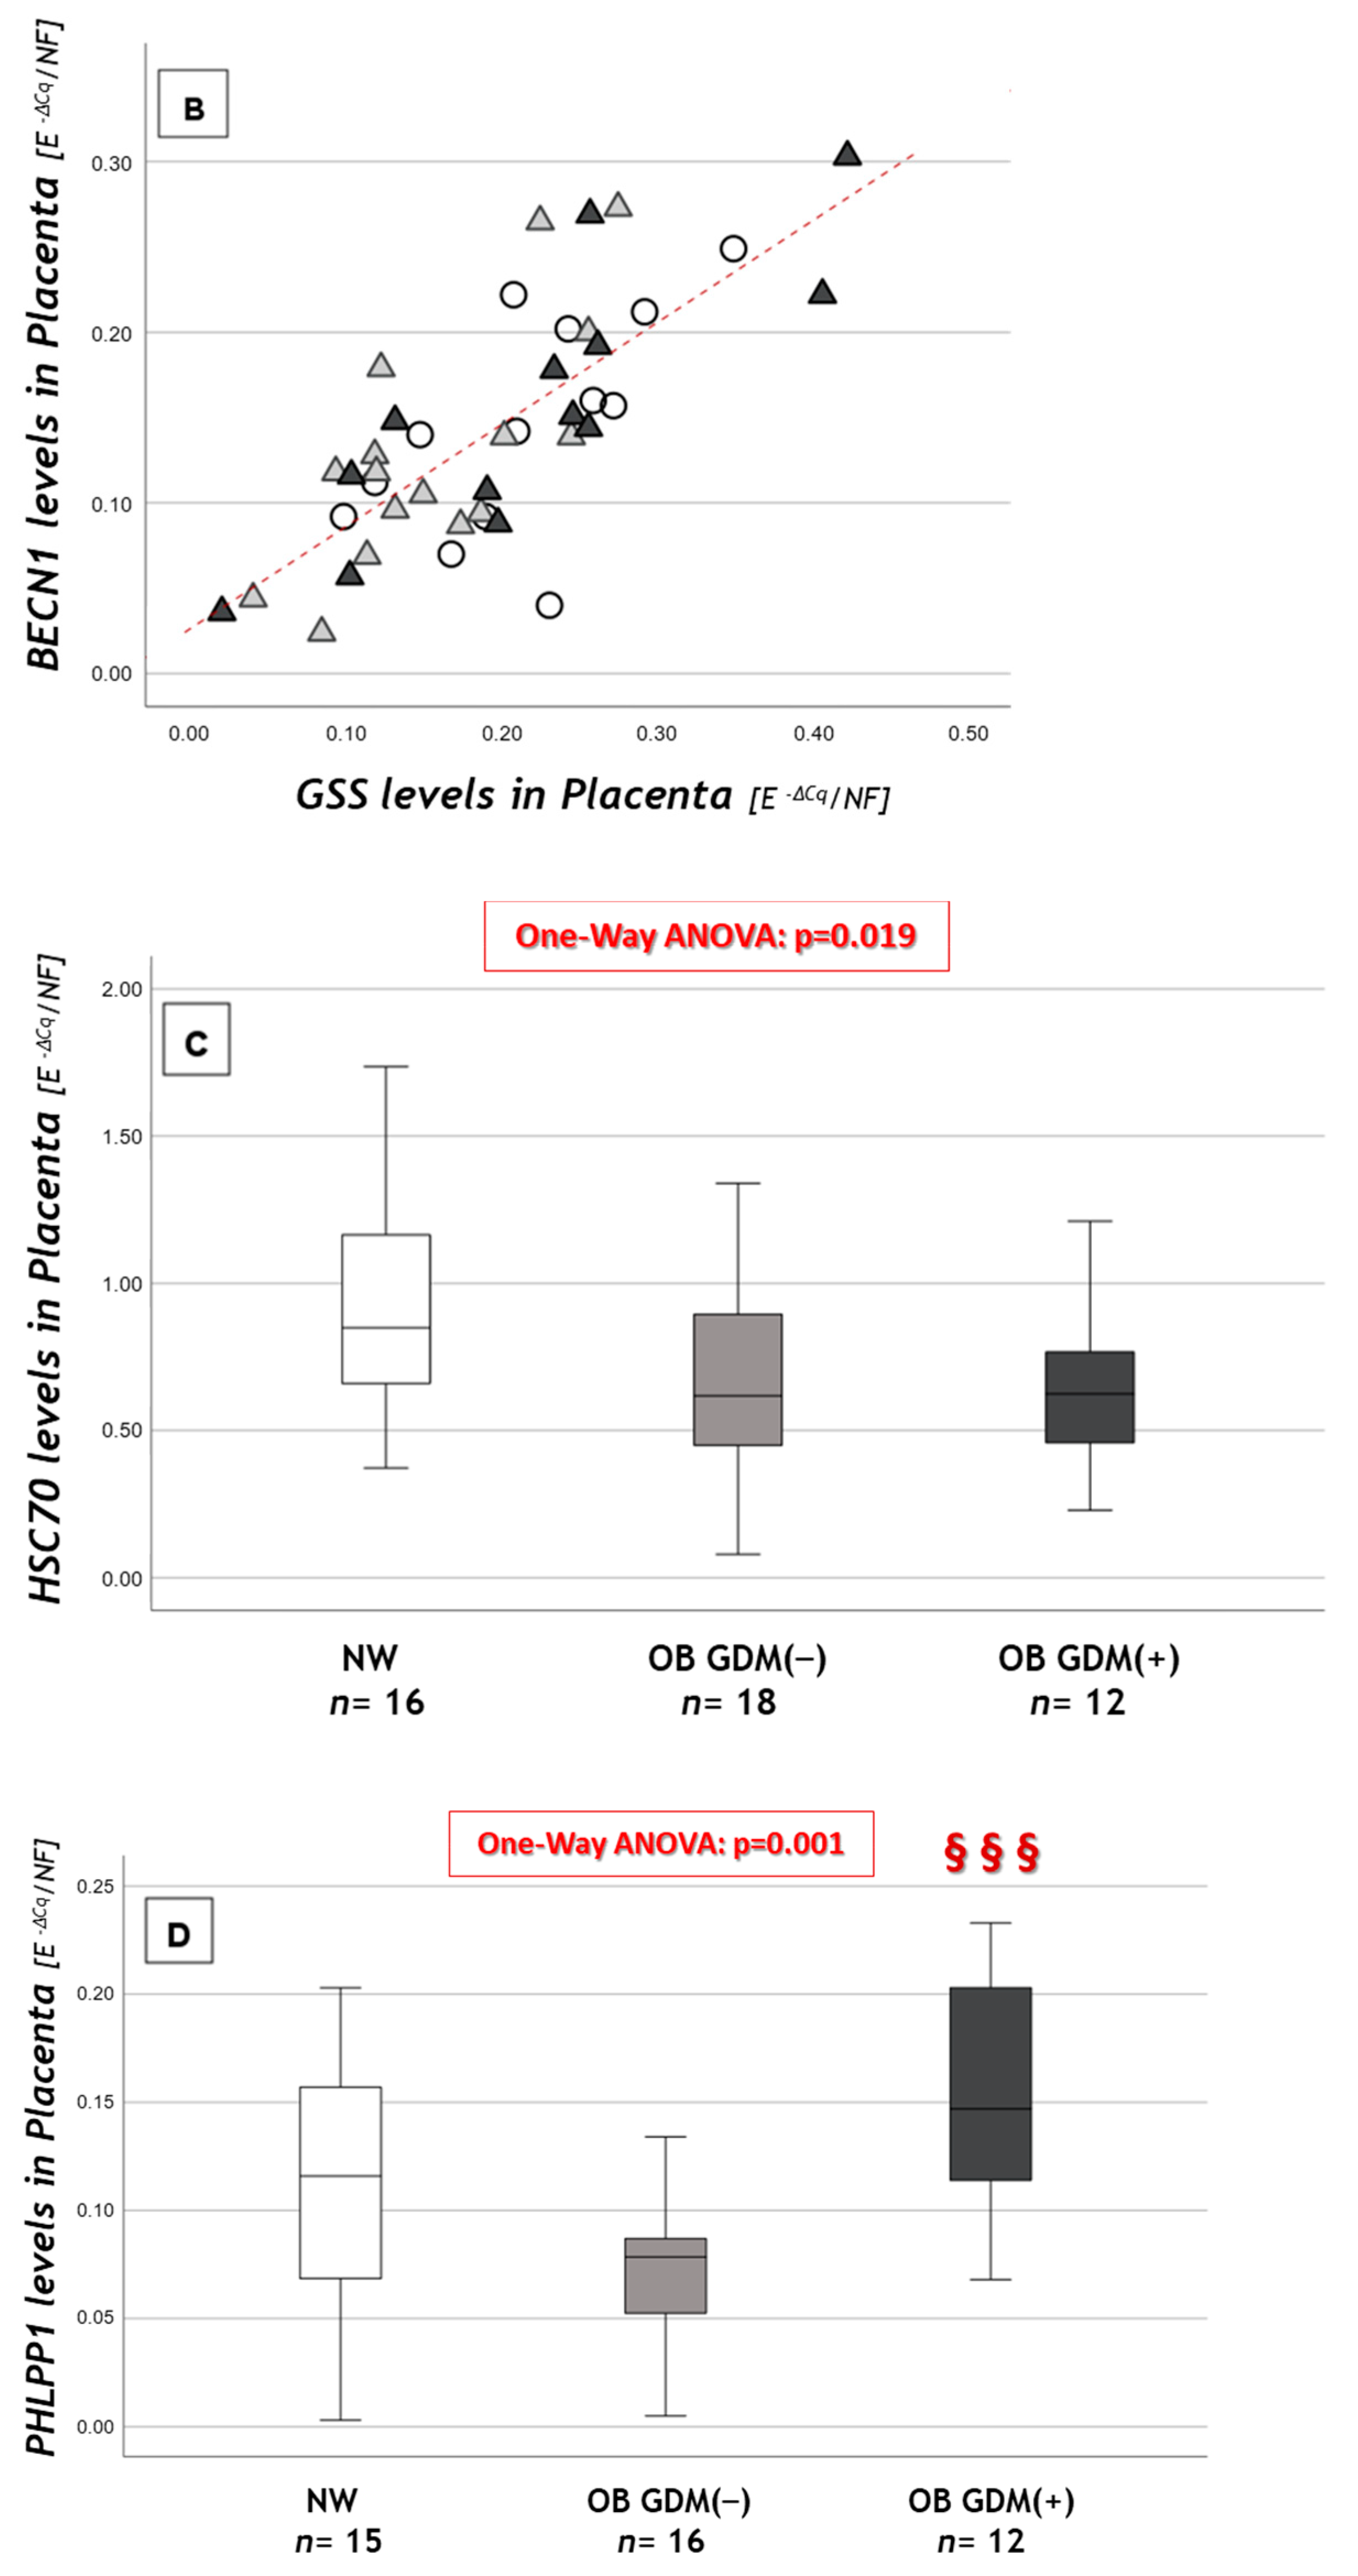
3.2. Expression of Antioxidant Defense Genes in Placenta

To assess the profile of redox homeostasis-related genes in the placentas of NW, OB GDM(−) and OB GDM(+) women, we evaluated the gene expression level of the main modulators of the detox machinery.
The mRNA levels of CATalase (CAT), Glutathione SynthetaSe (GSS), Glutathione ReductaSe (GSR) and Glutathione PeroXidase 1 (GPX1) genes are reported in Table 4.
Placental expression was detected for all the analyzed antioxidant genes, showing lower levels of CAT, GPX1 and GSS in the normoglycemic obese women vs. normal weight, though not significantly (Table 4).
Interestingly, although CAT did not reach statistical significance in the comparison between groups, its placental levels were significantly and positively correlated with GSS gene expression (r = +0.6, p < 0.001).
When considering subgroups with different placental efficiency, CAT expression values were significantly higher in the “more efficient” placentas subgroup (efficiency >6.9) compared to the less efficient ones (≤6.9) (0.14 ± 0.06 vs. 0.09 ± 0.07; p = 0.019) (Figure 2A). Moreover, we found a strong positive correlation between placental efficiency and CAT levels (r = +0.6, p < 0.001) (Figure 2B). CAT expression values were also inversely correlated with placental weight and thickness (r = −0.61, p < 0.001 and r = −0.5, p = 0.001, respectively).

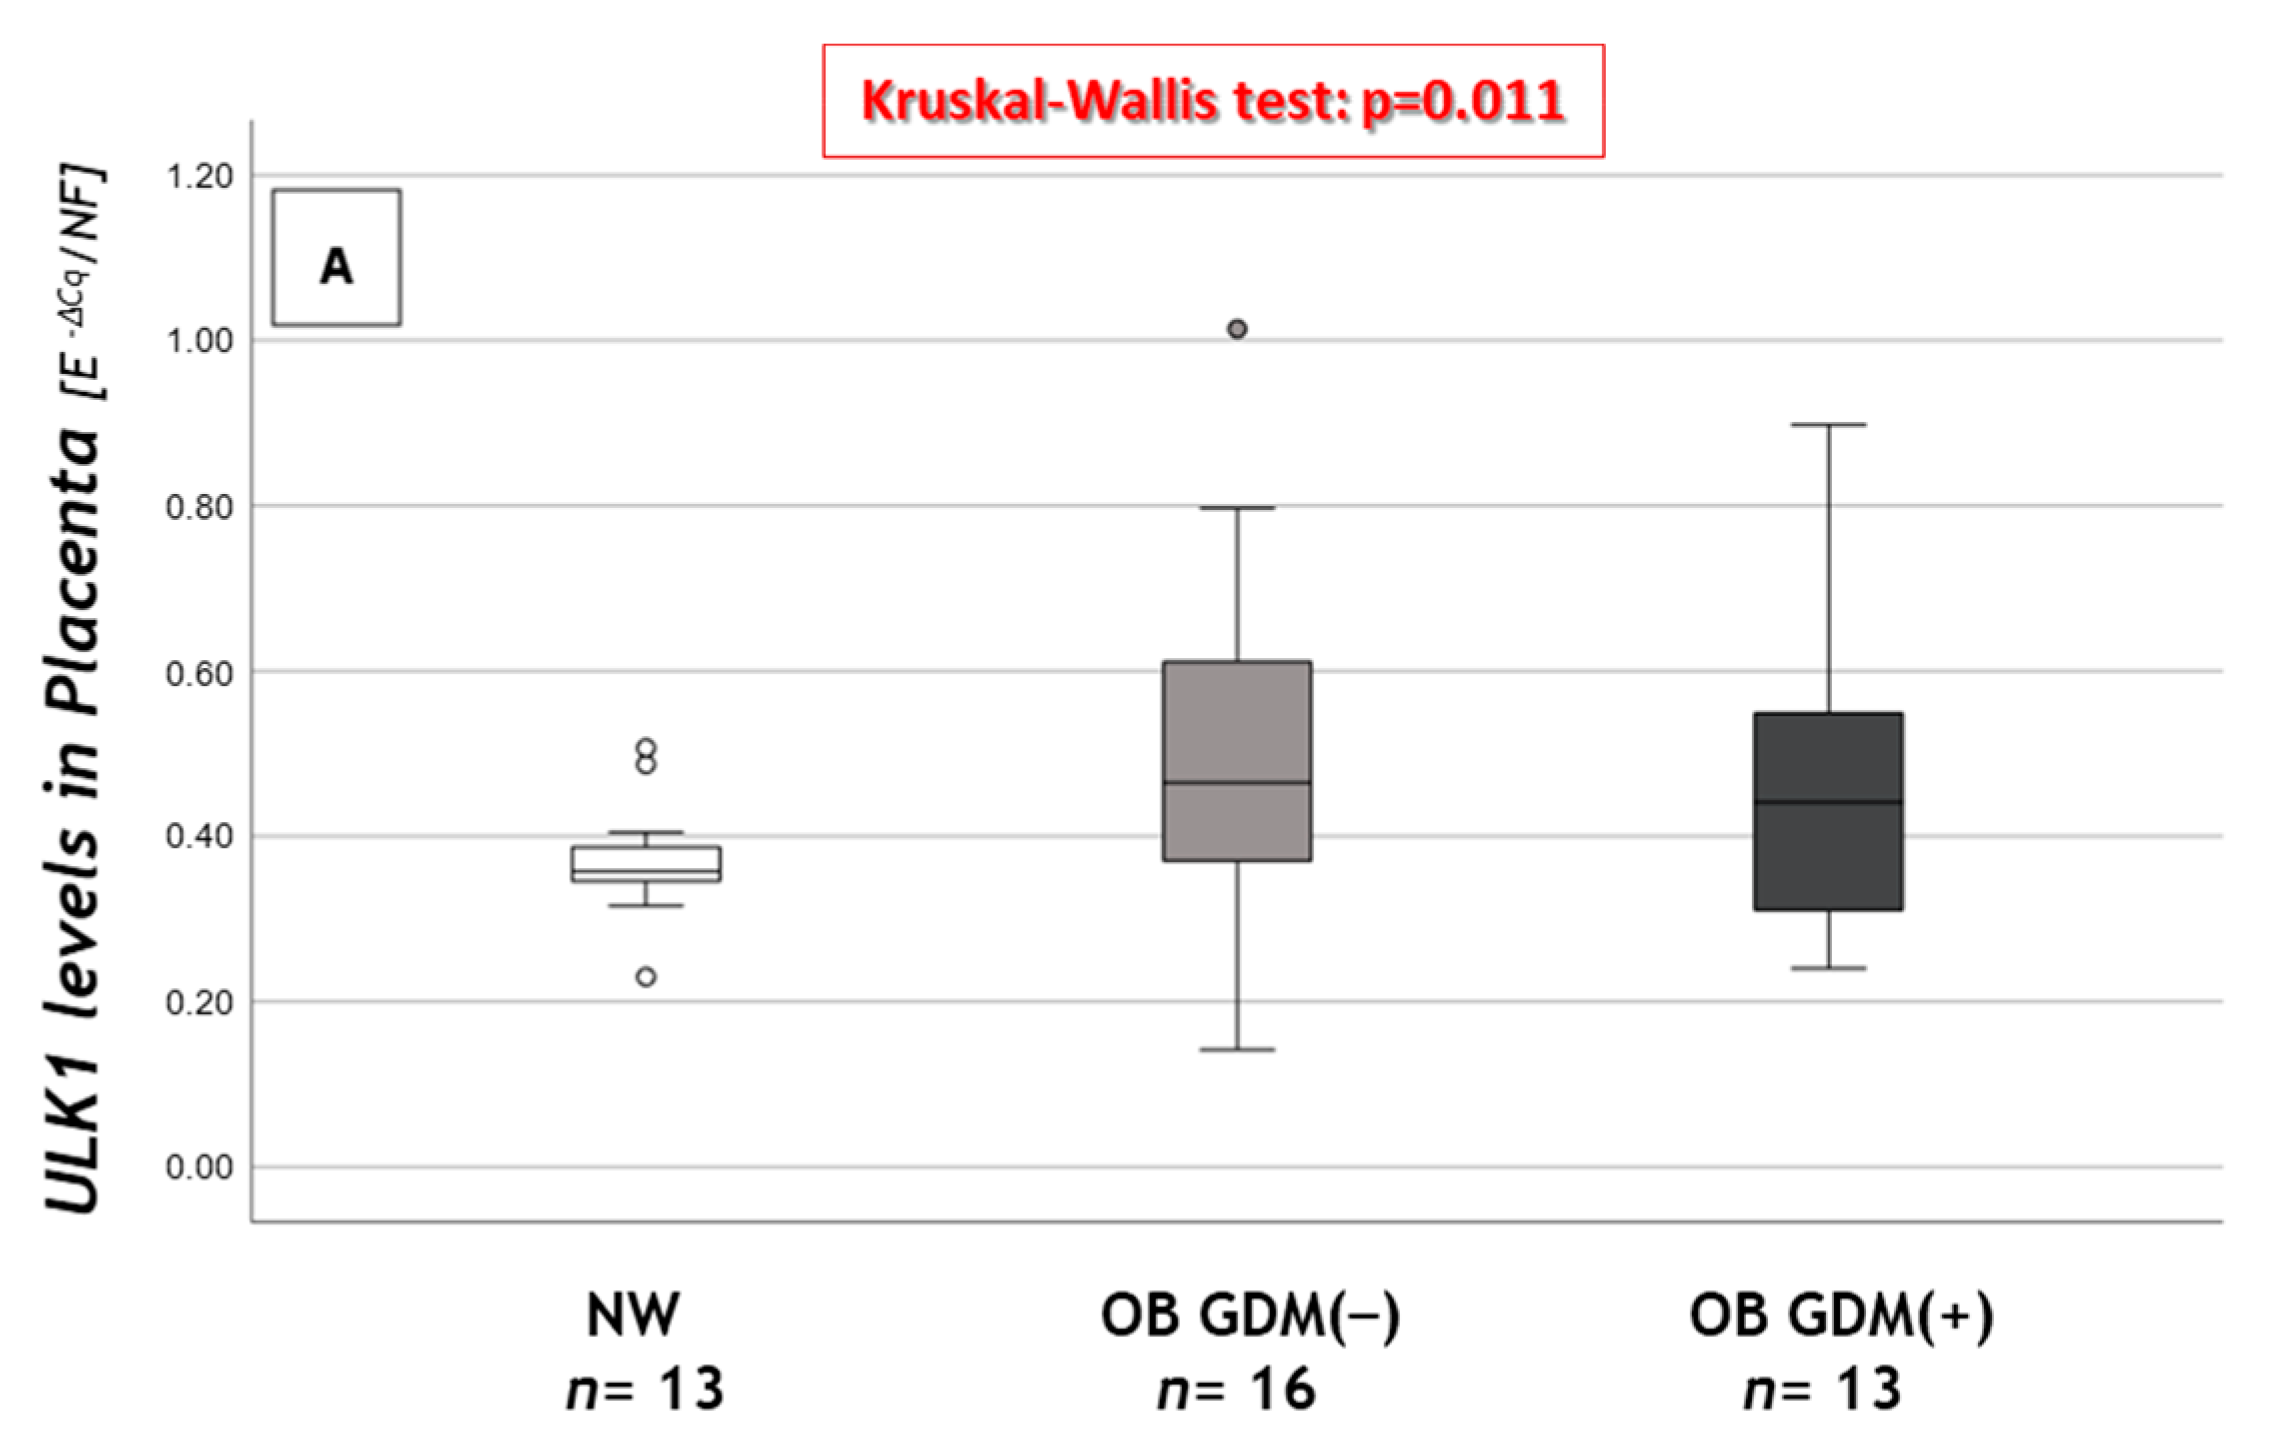
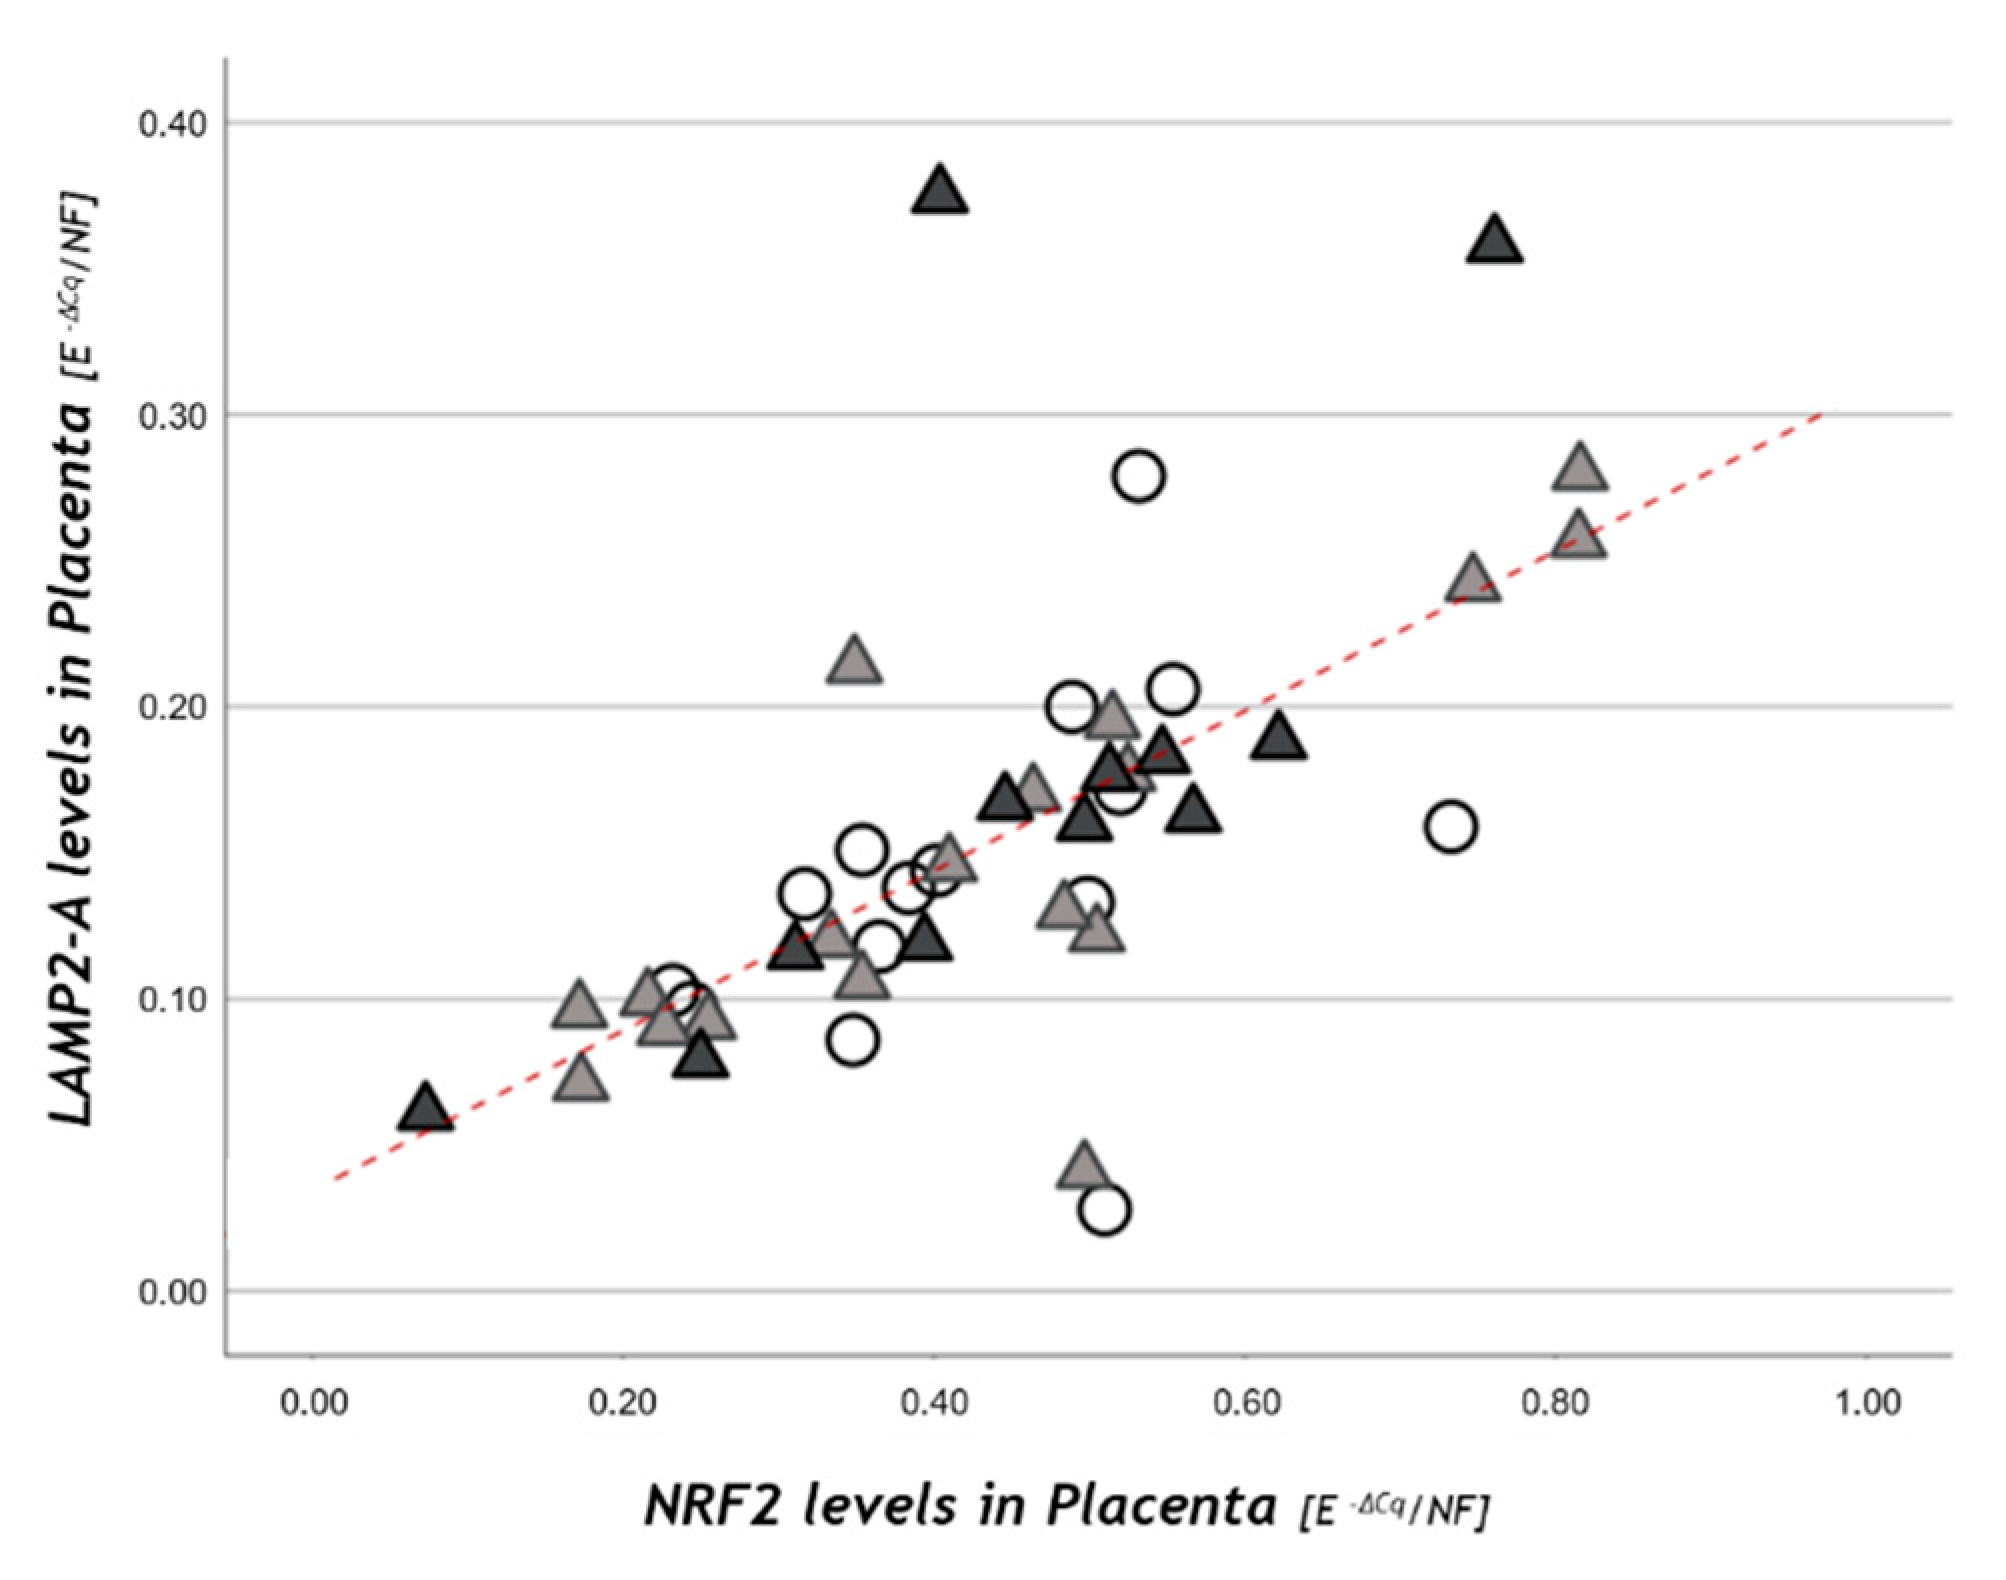
3.3. Autophagy-Related Gene Expression

To assess the autophagic processes, the expression of the genes encoding for the main drivers of the autophagic pathways was analyzed. The mRNA levels of Unc-51-Like Kinase 1 (ULK1), BECliN 1 (BECN1), Heat Shock Cognate 70 protein (HSC70), Lysosomal Associated Membrane Protein 2A (LAMP-2A) and Pleckstrin Homology domain and Leucine-rich repeat Protein Phosphatase 1 (PHLPP1) genes are reported in Table 5.
Significant results are reported in Figure 3.
As regards macroautophagy, ULK1 showed significantly increased placental mRNA levels in the OB groups compared to NW (Figure 3A).
BECN1 gene expression (Table 5) did not differ among the three groups. BECN1 mRNA levels were significantly and strongly correlated with GSS levels (r = +0.76, p < 0.001) in the whole population (Figure 3B), and in each of its subgroups.
As regards chaperone-mediated autophagy (CMA), we measured the expression of genes that are involved at different levels in CMA activity or regulation.
HSC70 expression was significantly different among groups. Indeed, both OB GDM(−) and OB GDM(+) presented lower levels compared to NW (Figure 3C).
LAMP-2A mRNA levels did not differ among groups (Table 5). In the NW subgroup, LAMP-2A placental levels were significantly and positively correlated with those of GSS (r = +0.8, p = 0.002).
In the obese subgroups, namely, OB GDM(−) and OB GDM(+), a significant positive correlation linked LAMP-2A and HIF-1α placental expressions (r = +0.67, p < 0.001).
PHLPP1 expression was significantly different among groups. Post hoc analysis showed that its levels were significantly increased in OB GDM(+) compared to OB GDM(−) placentas (Figure 3D).
When considering the NW subgroup, PHLPP1 placental levels were significantly correlated with HSC70 expression (r = +0.53, p = 0.034), while this correlation was not significant in both OB GDM(−) and OB GDM(+) groups.
Finally, the expression of genes encoding proteins involved in the cell response to stressors and related to CMA activity was evaluated (Table 6): Nuclear factor erythroid 2-Related Factor 2 (NRF2), Hypoxia-Inducible Factor 1 (HIF-1α), Vascular Endothelial Growth Factor (VEGF).
NRF2, HIF-1α and VEGF mRNA levels did not differ among the three groups (Table 6).
NRF2 placental levels resulted in being significantly correlated with LAMP-2A in the study population (r = +0.73, p < 0.001; Figure 4) and within each study group.

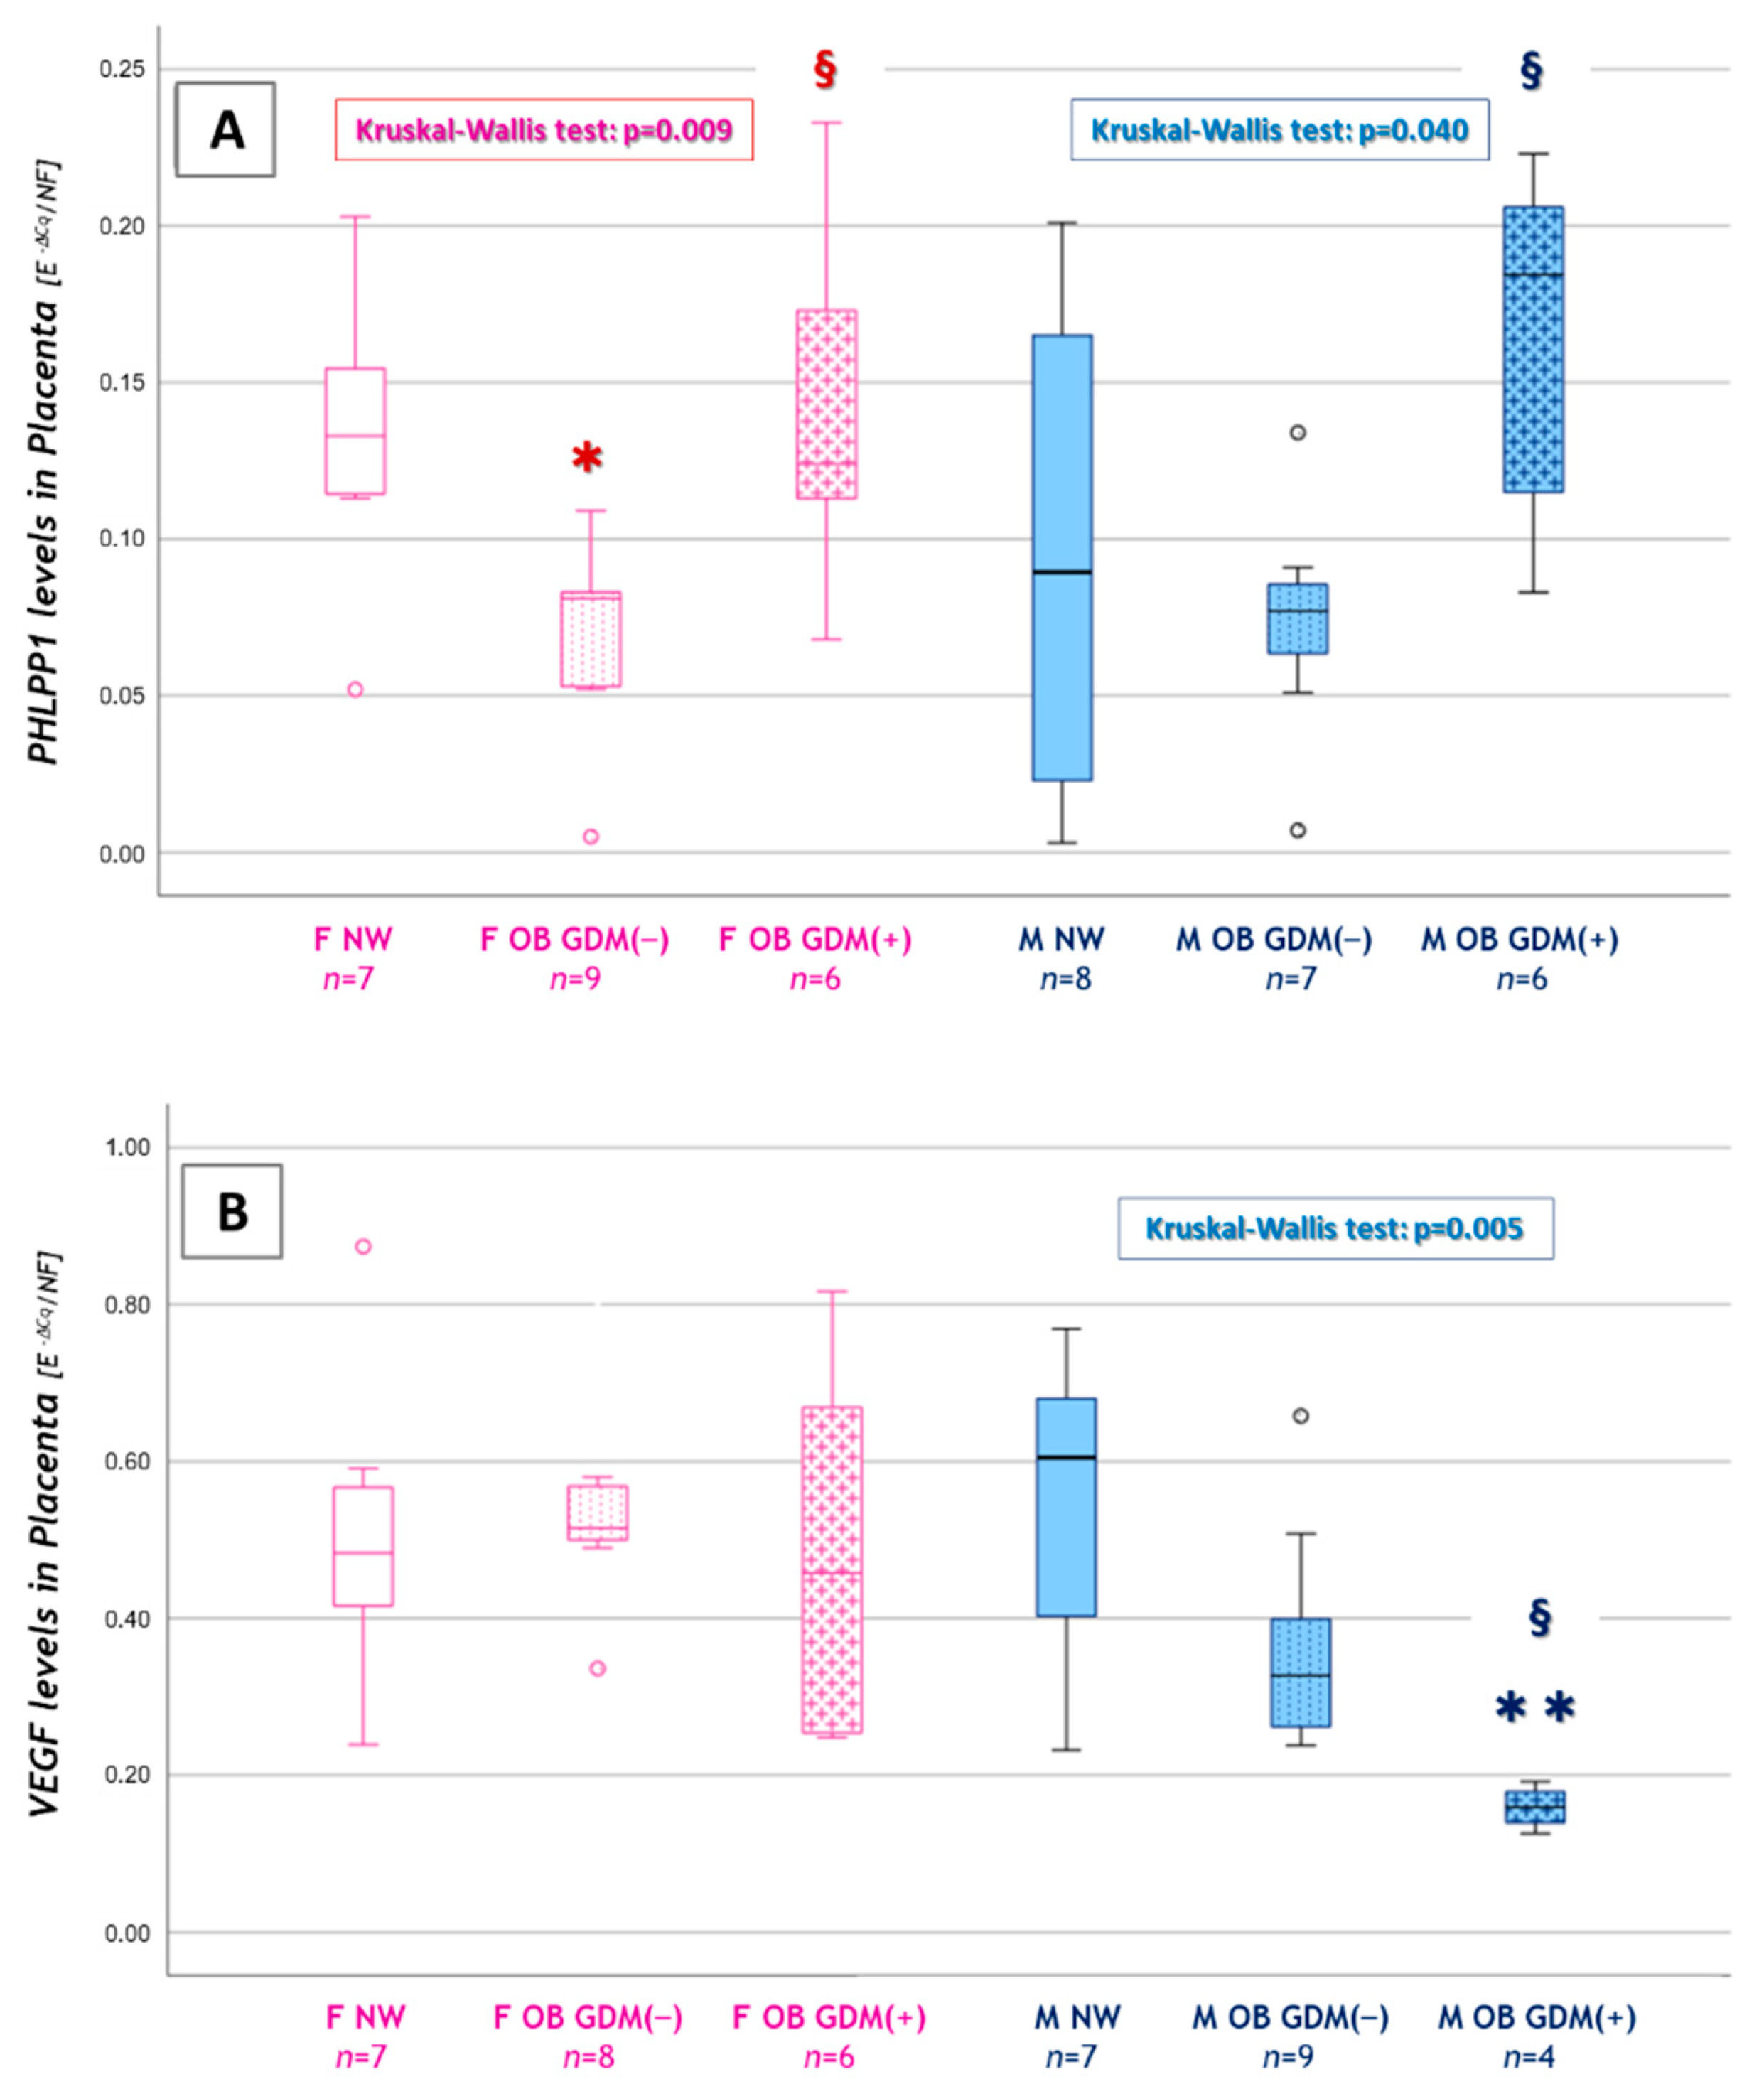
3.4. Sexually Dimorphic Placental Expressions

A chi-square for independence test (with continuity correction) indicated no significant association between fetal sex and body mass index (χ2 (1, n = 47) = 0.31, p = 0.86, Φ = 0.08). Indeed, fetal sex frequencies did not differ among the three study groups (Males- M: 56.25% of NW, 50% of OB GDM(−) and 46.2% of OB GDM(+); Females- F: 43.75% of NW, 50% of OB GDM(−) and 53.8% of OB GDM(+)).
To understand if there was a possible joint effect of fetal sex and maternal metabolic characteristics (BMI and maternal glycemia) on levels of the analyzed genes, we performed additional analyses.
A Two-way ANOVA explored the interaction effect of maternal BMI/hyperglycemia and fetal sex on our molecular variables, but no statistical significance was found.
A comparison among the three BMI groups was then performed in female or male placentas, using non-parametric statistics due to the sample sizes of the fetal sex subgroups.
In female, but not in male, placentas, a lower expression was recorded for CAT, GSS and GPX1 in OB GDM(−) (CAT: 0.070 ± 0.048; GSS: 0.133 ± 0.056; GPX1: 0.141 ± 0.062) vs. NW (CAT: 0.134 ± 0.040; GSS: 0.213 ± 0.368; GPX1: 0.212 ± 0.660), though not significantly.
Macroautophagy genes did not show any difference when dividing by both BMI/GDM and fetal sex.
Among chaperone-mediated autophagy-related genes, similarly to antioxidant enzymes, a lower HSC70 expression was found in OB GDM(−) (0.585 ± 0.234) compared to NW (0.886 ± 0.237) when analyzing placentas from female fetuses.
Significantly lower values were observed for PHLPP1 in females’ placentas (OB GDM(−): 0.069 ± 0.317 vs. NW: 0.132 ± 0.048; Figure 5A). Moreover, in placentas from female fetuses, PHLPP1 levels resulted in being significantly increased in OB GDM(+) (0.139 ± 0.057) compared to normoglycemic obese mothers.
Interestingly, PHLPP1 levels were significantly increased also in males’ placentas, in OB GDM(+) (0.166 ± 0.056) compared to OB GDM(−) (0.073 ± 0.039) (Figure 5A). An increased, though not significant, LAMP-2A expression was also observed in males’ placentas, in OB GDM(+) (0.226 ± 0.111) compared to NW (0.147± 0.045).
Finally, a significant reduction in VEGF expression was observed in males’ placentas in the OB GDM(+) group (0.159 ± 0.027) when compared to both OB GDM(−) (0.365 ± 0.140) and NW (0.539 ± 0.212). VEGF gene expression was also lower, though not significantly, in OB GDM(−) male placentas vs. NW (Figure 5B).

4. Discussion

This work focused on the description of placental function and molecular features related to cell response to oxidative stress and autophagy, in the context of metabolic deregulation characterizing maternal obesity and gestational diabetes. Indeed, placentas obtained from normal weight and obese women with or without gestational diabetes were analyzed for the expression of different gene subsets.
We found a decrease, though not significant, of placental antioxidant defense genes (CAT, GSS, GPX1) in OB GDM(−), but not in OB GDM(+), compared to NW. Interestingly, CAT was strongly correlated with placental efficiency and had significantly lower levels in less efficient placentas. Among genes playing an important role in macroautophagy, placental ULK1 was increased in OB groups compared to NW, while BECN1 presented a strong and positive correlation with GSS gene expression. The chaperone-mediated autophagy regulator PHLLP1 was reduced in OB GDM(−) placental tissues compared to NW and significantly increased in OB GDM(+) compared to OB GDM(−). PHLLP1 also correlated with HSC70 in NW placental tissues, but not in OB populations. Other CMA-related genes (NRF2, HIF-1a, VEGF) did not show significant differences in obesity and GDM.
When analyzing placental gene expression in relation to fetal sex, a sexual dimorphism was found for both antioxidant and CMA-related genes.
Importantly, in this study, placentas derived only from elective cesarean section, i.e., in the absence of labor, were included. This allowed avoiding any bias related to labor-induced oxidative stress, inflammation and changes in cell metabolism.
Furthermore, the clinical characteristics of the study population were deeply characterized: patients were carefully selected, and both NW and OB groups did not present any associated pathology, except for GDM in OB GDM(+). We excluded any maternal or fetal infection or autoimmune disease, maternal drug–alcohol abuse, fetal malformations, chromosomal disorders, preeclampsia and intrauterine growth restriction, all of which can affect the oxidative and the inflammatory status [28,29,30,31]. Moreover, only Caucasian women were selected, as different metabolic and oxidative characteristics have been identified and have been suggested to possibly contribute to the genetic component of complex disorders [32,33]. Our cases were also carefully matched to NW controls with similar characteristics except for BMI and GDM presence. Finally, all women included in this study were counseled with nutritional and lifestyle advice and recommendations on weight gain during pregnancy, and obese patients had regular specific checkups in a dedicated antenatal clinic with specific dietary indications. Therefore, we may assume that the reported findings can be related to metabolic dysfunctions related to increased BMI or hyperglycemic status [34].
Placental efficiency, calculated as fetal/placental weight, was lower in both obese groups compared to NW. When using the median value of placental efficiency as a cut-off, the percentage of the most efficient placentas (above the cut-off) decreased progressively, moving from the normal weight population to the obese and obese with GDM women. Since a decrease in placental efficiency has been described in relation to the oxidative stress induced by obesity [25,35], the expression of genes coding for proteins involved in cell redox homeostasis was analyzed in the different groups.
Expression of antioxidant defense genes (CAT, GSS, GSR, GPX1) tended to decrease in OB GDM(−) compared to NW. This trend supports an increase in oxidative stress and the evidence of altered placental metabolites involved in antioxidant defenses that has been previously described in the obese population [6,7,36].
Interestingly, expression levels of these genes in GDM women appeared to be more similar to those of NW. This might be due to different responses in the obese and diabetic impaired environment [37], leading to alternative mechanisms that result in an unchanged expression of the analyzed antioxidant genes. Indeed, previous studies showed that while placentas from obese women without comorbidities presented impaired mitochondrial biogenesis and respiratory chain enzyme activities [31], these were not altered in OB GDM(+) placentas, although mitochondrial morphological abnormalities were shown, accounting for mitochondrial dysfunctionality [7,38]. Moreover, we previously reported a differential alteration in antioxidant metabolites’ content in OB placentas, depending on the presence or absence of GDM, showing different profiles in these two groups [36].
The CAT gene aroused particular attention because of its strong correlation with placental efficiency. In fact, in most efficient placentas, a significant increase in CAT expression was found, suggesting the importance of the redox potential in the maintenance of organ functionality [39].
Another cellular mechanism involved in the maintenance of cell homeostasis is autophagy. Importantly, reactive oxygen species are master inducers of autophagy. Thus, the activation of this process is a key part of the cellular response to oxidative stress because it allows scavenging of defective components before further damage [9,40].
Autophagy activity has been documented in placentas, but only a few studies have investigated it in obese and diabetic placentas [20,21,41]. Autophagy includes different degradation systems, mainly divided into unspecific and selective strategies. The former group is mainly represented by macroautophagy, which acts by including cytoplasmic material and organelles within an autophagosome whose fusion with a lysosome induces the degradation of the content [42]. On the other hand, the selective strategies such as chaperone-mediated autophagy degrade only selected targets containing a specific consensus sequence called KFERQ. This motif is usually recognized and bound by the chaperone Heat Shock Cognate 70 (HSC70); the complex is then delivered to the lysosome where the protein, upon its interaction with the LAMP-2A multimer, forming a channel on the lysosomal membrane, is unfolded and enters the lysosome where it will be digested by different proteases [43].
The Unc-51-Like Kinase 1 (ULK1) complex plays a central role in the macroautophagy initiation stage and is also involved in promoting autophagosome–lysosome fusion [44]. Interestingly, our study showed an increase in ULK1 expression in the placentas of OB groups, possibly due to the metabolic stress caused by obesity and activating macroautophagy. This phenomenon correlates with the already mentioned expression reduction in genes involved in the detoxification from oxygen reactive species, inducing macroautophagy.
Another main player of macroautophagy is BECliN 1 (BECN1), being the principal driver of this degradative pathway [45]. Even if no statistically significant changes were observed in the three populations, a strong and positive correlation with GSS gene expression was noted in placentas and was sustained in each subgroup, as a clue of the relation between autophagy and the cell response to oxidative stress [46].
On the other hand, the chaperone-mediated autophagy machinery showed some changes in the expression of its players. In detail, HSC70 expression decreased in obese mothers, and also in the presence of diabetes, compared to normal weight, indicating a potential impairment in CMA activity. LAMP-2A expression did not change among groups. However, LAMP-2A positively correlated with GSS in NW, accounting for the expected oxidative stress-induced CMA activity in the control group. This correlation was not significant in OB GDM(−) and OB GDM(+). Nevertheless, a positive correlation between LAMP-2A and HIF-1α (a well-known CMA target) emerged only in OB placentas, suggesting a different activity of CMA in obesity. However, this hypothesis needs further investigations.
CMA is finely regulated by several proteins, including Pleckstrin homology domain and leucine-rich repeat protein phosphatase 1 (PHLPP1) [47]. This phosphatase is able to induce CMA activity by favoring the stabilization of the LAMP-2A multimers in the lysosomal membrane. Moreover, this protein has been described to be also involved in insulin resistance mechanisms [48,49]. Indeed, it supports insulin resistance by reducing insulin-dependent signal transduction, leading to a decrease in glucose transport and hyperglycemia [50].
In our study, PHLLP1 expression was reduced in OB GDM(−) placental tissues compared to NW, while it resulted in being significantly increased in OB GDM(+) compared to OB GDM(−), supporting a correlative hypothesis between PHLPP1 activity and GDM, as already hypothesized in type 2 diabetes by Andreozzi and colleagues [49]. Moreover, a positive and strong correlation between PHLPP1 and HSC70 was observed in NW placental tissues, but not in OB populations, again supporting the hypothesis of an impaired CMA function in obesity. This interesting result could suggest a role for PHLPP1 in GDM placentas. However, whether it has a causative or a secondary role in relation to insulin resistance still needs to be investigated [48]. In fact, it has been described that PHLPP1 overexpression induces insulin resistance. However, an increase in insulin levels also resulted in the overexpression of PHLPP1 itself, being probably involved in a regulating feedback loop that is lost in diabetes, for reasons that are not yet understood.
The expression of other genes whose transcription is triggered by stressors or modulated by CMA activity (NRF2, HIF-1α, VEGF) was also studied and did not show significant differences in obesity and GDM. Among these, NRF2 plays an important role in driving the transcription of different genes involved in cell detoxification and is also related to CMA activation because its activity is directly related to LAMP-2A expression [51]. Data reported herein confirm the strong positive correlation between NRF2 and LAMP-2A in each group.
We also explored the possibility of significant differences in relation to fetal sex. Indeed, different responses to an adverse intrauterine environment have been previously extensively documented depending on fetal sex [52,53,54,55].
We analyzed fetal weight, placental weight and placental efficiency in males and females across BMI groups. When considering female newborns, the diabetic obese placentas resulted in being heavier, with a significantly decreased efficiency when compared to normal weight. These results are supported by our previous reports in diabetic obese placentas [7,55], thus suggesting interesting evidence of sexual dimorphism in placental biometrical and functional features [21].
An interesting result was also obtained for the expression of PHLPP1, which dropped significantly in females’ placentas in the OB GDM(−) group, while it increased in both male and female placentas in OB GDM(+). However, PHLPP1 modulation seemed to have different consequences in the two sexes, with a significant decrease in VEGF expression only in males, which might be due to CMA activation. In fact, HIF-1α is both a CMA target and one of the main transcription factors driving VEGF expression (Figure 6). Supporting the hypothesis of a CMA activation, an increase in the expression of its main player, LAMP-2A, has been detected in the same samples even if it did not reach statistical significance. This mechanism was not observed in females’ tissues, providing clues about a dimorphic regulation and possibly different GDM outcomes depending on fetal sex.

5. Conclusions

In this study, we presented preliminary data on the expression of antioxidant and autophagy-related genes in placentas from normal weight and obese mothers, with or without gestational diabetes mellitus. Despite the small population size, which limited the statistical significance of some modulations, our analysis showed intriguing results, reporting differential alterations depending on the presence/absence of GDM and on fetal sex. These results confirm how metabolism, nutrient availability and cellular mechanisms such as OxS responses and autophagy are strictly connected. Further studies will be necessary to unravel processes below this observation. In detail, the role of PHLPP1 and chaperone-mediated autophagy activation in the etiopathology and also possibly in adverse outcomes of GDM might be suggested, deserving further investigations.
In the context of the current research, to our knowledge, this is the first report describing an increase in PHLPP1 expression in placentas in relation to GDM. New studies are needed to understand the mechanisms underlying this deregulation. Their comprehension could be useful for preventing the development of GDM. The elucidation of PHLPP1 involvement will pave the way for further analyses aimed at explaining its role in placental alterations in the context of metabolic disorders and its potential targetability for the treatment of negative consequences of diabetes.

Author Contributions

Conceptualization, C.M. (Chiara Mandò) and L.O.; formal analysis, G.M.A., C.N. and A.S.; funding acquisition, C.M. (Chiara Mandò), L.O. and I.C.; investigation, C.M. (Cristina Martelli), G.M.A., C.D., A.S., F.L. and A.L.D.; resources, F.P.; supervision, I.C., C.M. (Chiara Mandò) and L.O.; validation: G.M.A., C.D., C.M. (Cristina Martelli) and C.N.; writing—original draft, G.M.A. and C.D.; writing—review and editing, C.N., C.M. (Cristina Martelli), A.L.D., C.M. (Chiara Mandò), L.O., R.P. and I.C. All authors have read and agreed to the published version of the manuscript.

Funding

University Department Funding: Piano di Sviluppo di Ricerca 2019 Linea 2—Dotazione Annuale per Attività Istituzionali. Project Title: “Characterization of placental bioenergetics and lipidomics in maternal obesity”. The authors are thankful to Fondazione Ricerca Donna e Feto onlus and to ASM (Associazione Studio Malformazioni) for an unconditioned grant to the Laboratory of Maternal-Fetal Translational Research “Giorgio Pardi”.

Institutional Review Board Statement

The study was conducted according to the guidelines of the Declaration of Helsinki and approved by the ‘Medical Ethical and Institutional Review Board’ (Comitato Etico Milano Area 1 Prot. N. 17739/2018 approved on 05/04/2018).

Informed Consent Statement

Informed consent was obtained from all subjects involved in the study.

Data Availability Statement

All data that support the findings of this study are available from the corresponding author (L.O. and C.M.) on reasonable request.

Acknowledgments

We thank all the midwives and nurses of the Obstetric Units of L. Sacco Hospital and V. Buzzi Children Hospital (ASST Fatebenefratelli-Sacco Milano) for their expertise and cooperation. We are particularly grateful to all the pregnant women that contributed to the study with their clinical and biological data. The authors acknowledge support from the University of Milan through the APC initiative.

Conflicts of Interest

The authors declare no conflict of interest.

References

  1. Schaefer-Graf, U.; Napoli, A.; Nolan, C.J.; the Diabetic Pregnancy Study Group. Diabetes in pregnancy: A new decade of challenges ahead. Diabetologia 2018, 61, 1012–1021. [Google Scholar] [CrossRef] [Green Version]
  2. Catalano, P.M.; Shankar, K. Obesity and pregnancy: Mechanisms of short term and long term adverse consequences for mother and child. BMJ 2017, 356, j1. [Google Scholar] [CrossRef] [PubMed]
  3. Bordin, P.; Dotto, L.; Battistella, L.; Rosso, E.; Pecci, L.; Valent, F.; Collarile, P.; Vanin, M. Gestational diabetes mellitus yesterday, today and tomorrow: A 13 year italian cohort study. Diabetes Res. Clin. Pract. 2020, 167, 108360. [Google Scholar] [CrossRef]
  4. Martino, J.; Sebert, S.; Segura, M.T.; García-Valdés, L.; Florido, J.; Padilla, M.C.; Marcos, A.; Rueda, R.; McArdle, H.J.; Budge, H.; et al. Maternal Body Weight and Gestational Diabetes Differentially Influence Placental and Pregnancy Outcomes. J. Clin. Endocrinol. Metab. 2016, 101, 59–68. [Google Scholar] [CrossRef] [Green Version]
  5. Barker, D.J.P.; Thornburg, K.L.; Osmond, C.; Kajantie, E.; Eriksson, J.G. Beyond birthweight: The maternal and placental origins of chronic disease. J. Dev. Orig. Health Dis. 2010, 1, 360–364. [Google Scholar] [CrossRef]
  6. Saben, J.; Lindsey, F.; Zhong, Y.; Thakali, K.; Badger, T.M.; Andres, A.; Gomez-Acevedo, H.; Shankar, K. Maternal obesity is associated with a lipotoxic placental environment. Placenta 2014, 35, 171–177. [Google Scholar] [CrossRef] [PubMed] [Green Version]
  7. Mandò, C.; Anelli, G.M.; Novielli, C.; Panina-Bordignon, P.; Massari, M.; Mazzocco, M.I.; Cetin, I. Impact of Obesity and Hyperglycemia on Placental Mitochondria. Oxid. Med. Cell. Longev. 2018, 14, 2378189. [Google Scholar] [CrossRef]
  8. Li, M.; Wu, X.; An, P.; Dang, H.; Liu, Y.; Liu, R. Effects of resveratrol on autophagy and the expression of inflammasomes in a placental trophoblast oxidative stress model. Life Sci. 2020, 256, 117890. [Google Scholar] [CrossRef]
  9. De Andrade Ramos, B.R.; Witkin, S.S. The influence of oxidative stress and autophagy cross regulation on pregnancy outcome. Cell Stress Chaperones 2016, 5, 755–762. [Google Scholar] [CrossRef] [PubMed] [Green Version]
  10. Namkoong, S.; Cho, C.S.; Semple, I.; Lee, J.H. Autophagy Dysregulation and Obesity-Associated Pathologies. Mol. Cells 2018, 41, 3–10. [Google Scholar] [CrossRef] [PubMed]
  11. Jacob, J.A.; Salmani, J.M.M.; Jiang, Z.; Feng, L.; Song, J.; Jia, X.; Chen, B. Autophagy: An overview and its roles in cancer and obesity. Clin. Chim. Acta 2017, 468, 85–89. [Google Scholar] [CrossRef] [PubMed]
  12. Arias, E.; Koga, H.; Diaz, A.; Mocholi, E.; Patel, B.; Cuervo, A.M. Lysosomal mTORC2/PHLPP1/Akt Regulate Chaperone-Mediated Autophagy. Mol. Cell 2015, 59, 270–284. [Google Scholar] [CrossRef] [PubMed] [Green Version]
  13. Kiffin, R.; Christian, C.; Knecht, E.; Cuervo, A.M. Activation of chaperone-mediated autophagy during oxidative stress. Mol. Biol. Cell 2004, 15, 4829–4840. [Google Scholar] [CrossRef] [PubMed] [Green Version]
  14. Park, C.; Suh, Y.; Cuervo, A.M. Regulated degradation of Chk1 by chaperone-mediated autophagy in response to DNA damage. Nat. Commun. 2015, 6, 6823. [Google Scholar] [CrossRef] [PubMed] [Green Version]
  15. Cuervo, A.M.; Knecht, E.; Terlecky, S.R.; Dice, J.F. Activation of a selective pathway of lysosomal proteolysis in rat liver by prolonged starvation. Am. J. Physiol. 1995, 269, C1200–C1208. [Google Scholar] [CrossRef] [PubMed]
  16. Eisermann, D.J.; Wenzel, U.; Fitzenberger, E. Inhibition of chaperone-mediated autophagy prevents glucotoxicity in the Caenorhabditis elegans mev-1 mutant by activation of the proteasome. Biochem. Biophys. Res. Commun. 2017, 484, 171–175. [Google Scholar] [CrossRef]
  17. Zhao, X.; Jiang, Y.; Jiang, T.; Han, X.; Wang, Y.; Chen, L.; Feng, X. Physiological and pathological regulation of autophagy in pregnancy. Arch. Gynecol. Obstet. 2020, 302, 293–303. [Google Scholar] [CrossRef]
  18. Hubbi, M.E.; Hu, H.; Kshitiz, A.I.; Levchenko, A.; Semenza, G.L. Chaperone-mediated autophagy targets hypoxia-inducible factor-1α (HIF-1α) for lysosomal degradation. J. Biol. Chem. 2013, 288, 10703–10714. [Google Scholar] [CrossRef] [Green Version]
  19. Hung, T.H.; Hsieh, T.T.; Chen, S.F.; Li, M.J.; Yeh, Y.L. Autophagy in the human placenta throughout gestation. PLoS ONE 2013, 8, e83475. [Google Scholar] [CrossRef]
  20. Hung, T.H.; Huang, S.Y.; Chen, S.F.; Wu, C.P.; Hsieh, T.T. Decreased placental apoptosis and autophagy in pregnancies complicated by gestational diabetes with large-for-gestational age fetuses. Placenta 2020, 90, 27–36. [Google Scholar] [CrossRef]
  21. Muralimanoharan, S.; Gao, X.; Weintraub, S.; Myatt, L.; Maloyan, A. Sexual dimorphism in activation of placental autophagy in obese women with evidence for fetal programming from a placenta-specific mouse model. Autophagy 2016, 12, 752–769. [Google Scholar] [CrossRef] [Green Version]
  22. Rasmussen, K.M.; Yaktine, A.L.; Institute of Medicine (US); National Research Council (US); Committee to Reexamine IOM Pregnancy Weight Guidelines (Eds.) Weight Gain during Pregnancy: Reexamining the Guidelines; National Academies Press: Washington, DC, USA, 2009; p. 20669500. [CrossRef]
  23. Hod, M.; Kapur, A.; Sacks, D.A.; Hadar, E.; Agarwal, M.; Di Renzo, G.C.; Cabero Roura, L.; McIntyre, H.D.; Morris, J.L.; Divakar, H. The International Federation of Gynecology and Obstetrics (FIGO) Initiative on gestational diabetes mellitus: A pragmatic guide for diagnosis, management, and care. Int. J. Gynaecol. Obstet. 2015, 13, S173–S211. [Google Scholar] [CrossRef] [Green Version]
  24. International Association of Diabetes and Pregnancy Study Groups Consensus Panel; Metzger, B.E.; Gabbe, S.G.; Persson, B.; Buchanan, T.A.; Catalano, P.A.; Damm, P.; Dyer, A.R.; Leiva, A.D.; Hod, M.; et al. International association of diabetes and pregnancy study groups recommendations on the diagnosis and classification of hyperglycemia in pregnancy. Diabetes Care 2010, 3, 676–682. [Google Scholar] [CrossRef] [Green Version]
  25. Bianchi, C.; Taricco, E.; Cardellicchio, M.; Mandò, C.; Massari, M.; Savasi, V.; Cetin, I. The role of obesity and gestational diabetes on placental size and fetal oxygenation. Placenta 2021, 103, 59–63. [Google Scholar] [CrossRef]
  26. Anelli, G.M.; Mandò, C.; Letizia, T.; Mazzocco, M.I.; Novielli, C.; Lisso, F.; Personeni, C.; Vago, T.; Cetin, I. Placental ESRRG-CYP19A1 Expressions and Circulating 17-Beta Estradiol in IUGR Pregnancies. Front. Pediatr. 2019, 7, 154. [Google Scholar] [CrossRef] [Green Version]
  27. Vandesompele, J.; De Preter, K.; Pattyn, F.; Poppe, B.; Van Roy, N.; De Paepe, A.; Speleman, F. Accurate normalization of real-time quantitative RT-PCR data by geometric averaging of multiple internal control genes. Genome Biol. 2002, 3, research0034.1. [Google Scholar] [CrossRef] [PubMed] [Green Version]
  28. Cetin, I.; Taricco, E.; Mandò, C.; Radaelli, T.; Boito, S.; Nuzzo, A.M.; Giussani, D.A. Fetal Oxygen and Glucose Consumption in Human Pregnancy Complicated by Fetal Growth Restriction. Hypertension 2020, 3, 748–754. [Google Scholar] [CrossRef]
  29. Zambon, M.; Mandò, C.; Lissoni, A.; Anelli, G.M.; Novielli, C.; Cardellicchio, M.; Leone, R.; Monari, M.N.; Massari, M.; Cetin, I.; et al. Inflammatory and Oxidative Responses in Pregnancies with Obesity and Periodontal Disease. Reprod. Sci. 2018, 10, 1474–1484. [Google Scholar] [CrossRef]
  30. Pantham, P.; Aye, I.L.; Powell, T.L. Inflammation in maternal obesity and gestational diabetes mellitus. Placenta 2015, 7, 709–715. [Google Scholar] [CrossRef] [Green Version]
  31. Mandò, C.; De Palma, C.; Stampalija, T.; Anelli, G.M.; Figus, M.; Novielli, C.; Parisi, F.; Clementi, E.; Ferrazzi, E.; Cetin, I. Placental mitochondrial content and function in intrauterine growth restriction and preeclampsia. Am. J. Physiol. Endocrinol. Metab. 2014, 4, E404–E413. [Google Scholar] [CrossRef]
  32. Kenney, M.C.; Chwa, M.; Atilano, S.R.; Falatoonzadeh, P.; Ramirez, C.; Malik, D.; Tarek, M.; Del Carpio, J.C.; Nesburn, A.B.; Boyer, D.S.; et al. Molecular and bioenergetic differences between cells with African versus European inherited mitochondrial DNA haplogroups: Implications for population susceptibility to diseases. Biochim. Biophys. Acta (BBA) Mol. Basis Dis. 2014, 2, 208–219. [Google Scholar] [CrossRef] [Green Version]
  33. Gómez-Durán, A.; Pacheu-Grau, D.; López-Gallardo, E.; Díez-Sánchez, C.; Montoya, J.; López-Pérez, M.J.; Ruiz-Pesini, E. Unmasking the causes of multifactorial disorders: OXPHOS differences between mitochondrial haplogroups. Hum. Mol. Genet. 2010, 17, 3343–3353. [Google Scholar] [CrossRef] [PubMed] [Green Version]
  34. Catalano, P.; Demouzon, S.H. Maternal obesity and metabolic risk to the offspring: Why lifestyle interventions may have not achieved the desired outcomes. Int. J. Obes. 2015, 4, 642–649. [Google Scholar] [CrossRef] [Green Version]
  35. Wallace, J.M.; Horgan, G.W.; Bhattacharya, S. Placental weight and efficiency in relation to maternal body mass index and the risk of pregnancy complications in women delivering singleton babies. Placenta 2012, 8, 611–618. [Google Scholar] [CrossRef] [PubMed]
  36. Fattuoni, C.; Mandò, C.; Palmas, F.; Anelli, G.M.; Novielli, C.; Laudicina, E.P.; Savasi, V.M.; Barberini, L.; Dessì, A.; Pintus, R.; et al. Preliminary metabolomics analysis of placenta in maternal obesity. Placenta 2018, 61, 89–95. [Google Scholar] [CrossRef]
  37. Scifres, C.M.; Parks, W.T.; Feghali, M.; Caritis, S.N.; Catov, J.M. Placental maternal vascular malperfusion and adverse pregnancy outcomes in gestational diabetes mellitus. Placenta 2017, 49, 10–15. [Google Scholar] [CrossRef] [PubMed]
  38. Hastie, R.; Lappas, M. The effect of pre-existing maternal obesity and diabetes on placental mitochondrial content and electron transport chain activity. Placenta 2014, 9, 673–683. [Google Scholar] [CrossRef] [PubMed]
  39. Al-Gubory, K.H.; Fowler, P.A.; Garrel, C. The roles of cellular reactive oxygen species, oxidative stress and antioxidants in pregnancy outcomes. Int. J. Biochem. Cell. Biol. 2010, 10, 1634–1650. [Google Scholar] [CrossRef]
  40. Pietrocola, F.; Bravo-San Pedro, J.M. Targeting Autophagy to Counteract Obesity-Associated Oxidative Stress. Antioxidants 2021, 1, 102. [Google Scholar] [CrossRef]
  41. Oh, S.Y.; Roh, C.R. Autophagy in the placenta. Obstet. Gynecol. Sci. 2017, 3, 241–259. [Google Scholar] [CrossRef]
  42. Feng, Y.; He, D.; Yao, Z.; Klionsky, D.J. The machinery of macroautophagy. Cell Res. 2014, 24, 24–41. [Google Scholar] [CrossRef] [PubMed] [Green Version]
  43. Alfaro, I.E.; Albornoz, A.; Molina, A.; Moreno, J.; Cordero, K.; Criollo, A.; Budini, M. Chaperone Mediated Autophagy in the Crosstalk of Neurodegenerative Diseases and Metabolic Disorders. Front. Endocrinol. 2019, 9, 778. [Google Scholar] [CrossRef] [PubMed]
  44. Zachari, M.; Ganley, I.G. The mammalian ULK1 complex and autophagy initiation. Essays Biochem. 2017, 6, 585–596. [Google Scholar] [CrossRef] [Green Version]
  45. Menon, M.B.; Dhamija, S. Beclin 1 Phosphorylation—At the Center of Autophagy Regulation. Front. Cell Dev. Biol. 2018, 6, 137. [Google Scholar] [CrossRef] [PubMed] [Green Version]
  46. Huanhuan, L.V.; Zhen, C.; Liu, J.; Yang, P.; Hu, L.; Shang, P. Unraveling the Potential Role of Glutathione in Multiple Forms of Cell Death in Cancer Therapy. Oxid. Med. Cell. Longev. 2019, 3150145. [Google Scholar] [CrossRef] [Green Version]
  47. Lo Dico, A.; Martelli, C.; Diceglie, C.; Ottobrini, L. The Multifaceted Role of CMA in Glioma: Enemy or Ally? Review. Int. J. Mol. Sci. 2021, 22, 2217. [Google Scholar] [CrossRef]
  48. Mathur, A.; Pandey, V.K.; Kakkar, P. PHLPP: A putative cellular target during insulin resistance and type 2 diabetes. J. Endocrinol. 2017, 233, R185–R198. [Google Scholar] [CrossRef] [Green Version]
  49. Andreozzi, F.; Procopio, C.; Greco, A.; Mannino, G.C.; Miele, C.; Raciti, G.A.; Iadicicco, C.; Beguinot, F.; Pontiroli, A.E.; Hribal, M.L.; et al. Increased levels of the Akt-specific phosphatase PH domain leucine-rich repeat protein phosphatase (PHLPP)-1 in obese participants are associated with insulin resistance. Diabetologia 2011, 54, 1879–1887. [Google Scholar] [CrossRef] [Green Version]
  50. Leng, S.; Zhang, W.; Zheng, Y.; Liberman, Z.; Rhodes, C.J.; Eldar-Finkelman, H.; Sun, X.J. Glycogen synthase kinase 3 beta mediates high glucose-induced ubiquitination and proteasome degradation of insulin receptor substrate 1. J. Endocrinol. 2010, 2, 171–181. [Google Scholar] [CrossRef] [Green Version]
  51. Pajares, M.; Rojo, A.I.; Arias, E.; Díaz-Carretero, A.; Cuervo, A.M.; Cuadrado, A. Transcription factor NFE2L2/NRF2 modulates chaperone-mediated autophagy through the regulation of LAMP2A. Autophagy 2018, 8, 1310–1322. [Google Scholar] [CrossRef]
  52. Osei-Kumah, A.; Smith, R.; Jurisica, I.; Caniggia, I.; Clifton, V.L. Sex-specific differences in placental global gene expression in pregnancies complicated by asthma. Placenta 2011, 8, 570–578. [Google Scholar] [CrossRef] [PubMed]
  53. Clifton, V.L. Sexually dimorphic effects of maternal asthma during pregnancy on placental glucocorticoid metabolism and fetal growth. Cell Tissue Res. 2005, 1, 63–71. [Google Scholar] [CrossRef] [PubMed]
  54. Anelli, G.M.; Cardellicchio, M.; Novielli, C.; Antonazzo, P.; Mazzocco, M.I.; Cetin, I.; Mandò, C. Mitochondrial content and hepcidin are increased in obese pregnant mothers. J. Matern. Fetal Neonatal Med. 2018, 18, 2388–2395. [Google Scholar] [CrossRef] [PubMed]
  55. Mandò, C.; Calabrese, S.; Mazzocco, M.I.; Novielli, C.; Anelli, G.M.; Antonazzo, P.; Cetin, I. Sex specific adaptations in placental biometry of overweight and obese women. Placenta 2016, 38, 1–7. [Google Scholar] [CrossRef] [PubMed]
Figure 1. Distribution of placentas according to their efficiency for the three study groups (cut-off = 6.9, median value of placental efficiency). Data shown as a pie chart graph. Chi-square test: p = 0.049.
Nutrients 13 01303 g001
Figure 2. CAT placental levels (A) according to placental efficiency (PEff) cut-off and (B) in relation to PEff. (A) Data are shown as box plots, indicating the median and the 25th and 75th percentiles; ° values that extend more than 1.5 box-lengths from the edge of the box. * p < 0.05 (t-test); (B) statistical analysis by the Spearman rank order correlation (r = +0.6, p < 0.001) in NW (○), OB GDM(−) (), OB GDM(+) (▲).
Nutrients 13 01303 g002
Figure 3. Expression of macroautophagy and CMA genes in placental tissue. (A) ULK gene expression levels, (B) correlation between GSS and BECN1 placental levels, (C) HSC70 gene expression levels and (D) PHLPP1 gene expression levels among NW, OB GDM(−) and OB GDM(+). (A,C,D) Gene expressions were analyzed with Kruskal–Wallis test or One-way ANOVA (ULK1: p = 0.011; HSC70: p = 0.019; PHLPP1: p = 0.001). Data are shown as box plots, indicating the median and the 25th and 75th percentiles; ° values that extend more than 1.5 box-lengths from the edge of the box. §§§ p ≤ 0.001 vs. OB GDM(−) (all Tukey HSD post hoc tests, except for ULK analyzed with Mann–Whitney U test and Bonferroni correction). (B) Statistical analysis by the Spearman rank order correlation (r = +0.76, p < 0.001) in NW (○), OB GDM(−) (), OB/GDM(+) (▲).
Nutrients 13 01303 g003aNutrients 13 01303 g003b
Figure 4. NRF2 placental levels in relation to LAMP-2A. Statistical analysis by the Spearman rank order correlation (r = +0.73, p < 0.001) in NW (○), OB GDM(−) (), OB/GDM(+) (▲).
Nutrients 13 01303 g004
Figure 5. Sexually dimorphic expression of CMA or autophagy-related genes. (A) PHLPP1 and (B) VEGF levels among female or male placentas in NW, OB GDM(−) and OB GDM(+). Data were analyzed with Kruskal–Wallis test (PHLPP1: p = 0.009 for FEMALE placentas, p = 0.040 for MALE placentas. VEGF: p = 0.005 for MALE placentas). Data are shown as box plots, indicating the median and the 25th and 75th percentiles; ° values that extend more than 1.5 box-lengths from the edge of the box. FEMALE Placentas: * p < 0.05 vs. NW or § p < 0.05 vs. OB GDM(−). MALE Placentas: ** p < 0.01 vs. NW or § p < 0.05 vs. OB GDM(−); post-hoc by Mann–Whitney U test with Bonferroni correction.
Nutrients 13 01303 g005
Figure 6. Schematic representation of our hypothesis connecting the regulation of VEGF expression and chaperone-mediated autophagy (CMA) activity.
Nutrients 13 01303 g006
Table 1. Primer details.
GeneForward Sequence
(5′–3′)
Reverse Sequence
(3′–5′)
Fw Position *Rev Position *Amplicon Length
YWHAZACTTTTGGTACATTGTGGCTTCAACCGCCAGGACAAACCAGTAT1110–11331203–118451 bp
βACTINATCAAGATCATTGCTCCTCCTGACTGCTTGCTGATCCACATCTG1063–10851164–114459 bp
CATTAAGACTGACCAGGGCACAAACCTTGGTGAGATCGAA788–804988–969165 bp
GSSATGCTGTGCAGATGGACTTCAACCTGGATGTCAAACAGACGAGCGGTA285–308408–38577 bp
GSRAACATCCCAACTGTGGTCTTCAGCTTGGTAACTGCGTGATACATCGGG1239–12621378–135593 bp
GPX1CGCAACGATGTTGCCTGGAACTTTAGGCTCGATGTCAATGGTCTGGAA563–586664–64155 bp
ULK1TCATCTTCAGCCACGCTGCACGGTGCTGGAACATCT2724–27412789–277231 bp
BECN1GGCTGAGAGACTGGATCAGGCTGCGTCTGGGCATAACG806–825932–91590 bp
HSC70ATTGATCTTGGCACCACCTAACATAGCTTGAAGTGGTTCG103–122203–18462 bp
LAMP–2ATGCTGGCTACCATGGGGC TGGCAGCTGCCTGTGGAGTGAGT825–844922–90258 bp
PHLPP1CCTACCTTCTCCAGTGCACTCCAGCAGTTCCAAGTTTCCT3796–38153916–389782 bp
NRF2CAGCGACGGAAAGAGTATGAAAGAAACCTGGGAGTAG271–291471–454163 bp
HIF–1αTGATTGCATCTCCATCTCCTACCGACTCAAAGCGACAGATAACACG2205–22272381–2359132 bp
VEGFCGAGGGCCTGGAGTGTGTCGCATAATCTGCATGGTGATG335–352391–37119 bp
Table 1 shows the primer sequences (forward and reverse) used to amplify all the genes, their positions and the length of amplicons. * https://blast.ncbi.nlm.nih.gov/Blast.cgi. (Accessed on 30 March 2021).
Table 2. Maternal, fetal and placental data.
One-Way ANOVA or Kruskal–Wallis TestNW
n = 16
OB GDM(−)
n = 18
OB GDM(+)
n = 13
Maternal Data
Age (years) Ap = 0.00235.7 ± 3.530.2 ± 6.0 **35.8 ± 4.3 §§
Pregestational BMI (kg/m2) Bp = 0.00021.18 ± 2.1134.80 ± 4.06 ***35.05 ± 3.41 ***
OGTT I Value (mg/dL) Ans84.00 ± 5.1279.92 ± 6.5289.73 ± 15.08
OGTT II Value (mg/dL) Ap = 0.000117.73 ± 19.14113.10 ± 22.57164.67 ± 35.99 *** §§§
OGTT III Value (mg/dL) Bp = 0.001105.36 ± 36.2892.20 ± 14.19162.89 ± 32.28 ** §§§
Gestational Weight Gain (kg) Ans10.93 ± 2.868.44 ± 6.066.62 ± 5.91
Hemoglobin (mg/dL), at 34–36 weeks Bns12.13 ± 1.1611.35 ± 0.7611.37 ± 0.97
Fetal (F) and Placental (P) Data at Delivery
Gestational Age (weeks) Bns39.26 ± 0.5039.16 ± 0.3039.09 ± 0.16
Fetal Weight (g) Ans3337.94 ± 247.713339.44 ± 417.173330.00 ± 336.54
Placental Weight (g) Ans434.25 ± 80.43482.22 ± 81.50497.46 ± 102.55
Placental Surface (cm2) Ans245.59 ± 45.25232.34 ± 85.03245.44 ± 46.41
Placental Thickness (cm) Ans1.81 ± 0.422.21 ± 0.582.04 ± 0.55
Placental Efficiency (F/P weight) Bns7.97 ± 1.757.04 ± 1.046.98 ± 1.85
Data were analyzed according to their distribution with A. One-way ANOVA or B. Kruskal–Wallis test. Data are shown as mean ± standard deviation; ** p < 0.01, *** p ≤ 0.001 vs. Normal Weight (NW); §§ p < 0.01, §§§ p ≤ 0.001 vs. Obese without GDM (OB GDM(−)) refer to post hoc analyses, performed depending on data distribution by: A. Tukey’s HSD test or B. Mann–Whitney U test with Bonferroni correction. BMI: body mass index; OGTT: Oral Glucose Tolerance Test (OGTT I: fasting glycemic value; OGTT II: glycemic value after 60 min from 75 g glucose consumption; OGTT III: glycemic value after 120 min from 75 g glucose consumption).
Table 3. Fetal and placental characteristics separately described across sexes.
MALE FETUSES (n = 24)FEMALE FETUSES (n = 23)
One-Way ANOVA or
Kruskal–Wallis Test
NW
n = 9
OB GDM(−)
n = 9
OB GDM(+)
n = 6
One-Way ANOVA or
Kruskal–Wallis Test
NW
n = 7
OB GDM(−)
n = 9
OB GDM(+)
n = 7
Fetal (F) Weight
(g) A
ns3371.67 ± 287.263368.89 ± 450.683374.17 ± 369.49ns3294.57 ± 198.683310.00 ± 405.903292.14 ± 283.58
Placental (P) Weight (g) Ans451.44 ± 79.26495.56 ± 95.93441.17 ± 105.75p = 0.011412.14 ± 82.35468.89 ± 67.17545.71 ± 76.35 **
Placental Efficiency
(F/P weight) B
ns7.76 ± 2.026.92 ± 0.898.05 ± 2.27p = 0.0128.24 ± 1.467.16 ± 1.226.07 ± 0.68 **
Data were analyzed according to their distribution with A. One-way ANOVA or B. Kruskal–Wallis test. Data are shown as mean ± standard deviation; ** p < 0.01 vs. NW refers to post hoc analyses, performed depending on data distribution by: A. Tukey’s HSD test or B. Mann–Whitney U test with Bonferroni correction.
Table 4. Gene expression of antioxidant defense enzymes in placental tissue.
Antioxidant DefensesNW
n = 16
OB GDM(−)
n = 18
OB GDM(+)
n = 13
CATA0.146 ± 0.0540.087 ± 0.048 0.115 ± 0.104
GSSA0.215 ± 0.0710.159 ± 0.068 0.218 ± 0.114
GSRB0.265 ± 0.1310.213 ± 0.1160.294 ± 0.180
GPX1A0.207 ± 0.0670.152 ± 0.062 0.187 ± 0.061
Data are shown as mean ± standard deviation. Data were analyzed depending on their distribution with: A. One-way ANOVA or B. Kruskal–Wallis test.
Table 5. Expression levels of macroautophagy and chaperone-mediated autophagy (CMA) genes in placental tissue.
Macroautophagy and CMAOne-Way AnovaNW
n = 16
OB GDM(−)
n = 18
OB GDM(+)
n = 13
BECN1Ans0.145 ± 0.0630.142 ± 0.0880.155 ± 0.078
LAMP-2AAns0.143 ± 0.0580.147 ± 0.0680.179 ± 0.097
Data were analyzed according to their distribution with A. One-way ANOVA. Data are shown as mean ± standard deviation.
Table 6. Expression levels of autophagy-related genes in placental tissue.
Autophagy-Related GenesNW
n = 16
OB GDM(−)
n = 18
OB GDM(+)
n = 13
NRF2A0.433 ± 0.1280.437 ± 0.2030.449 ± 0.181
HIF-1αB0.235 ± 0.0800.275 ± 0.1680.218 ± 0.087
VEGFA0.524± 0.1980.447 ± 0.1580.354 ± 0.243
Data are shown as mean ± standard deviation. Data were analyzed depending on their distribution with: A. One-way ANOVA or B. Kruskal–Wallis test.
Publisher’s Note: MDPI stays neutral with regard to jurisdictional claims in published maps and institutional affiliations.

