Habitual Miso (Fermented Soybean Paste) Consumption Is Associated with a Low Prevalence of Sarcopenia in Patients with Type 2 Diabetes: A Cross-Sectional Study

 , , , , ,
Abstract
:1. Introduction
2. Materials and Methods
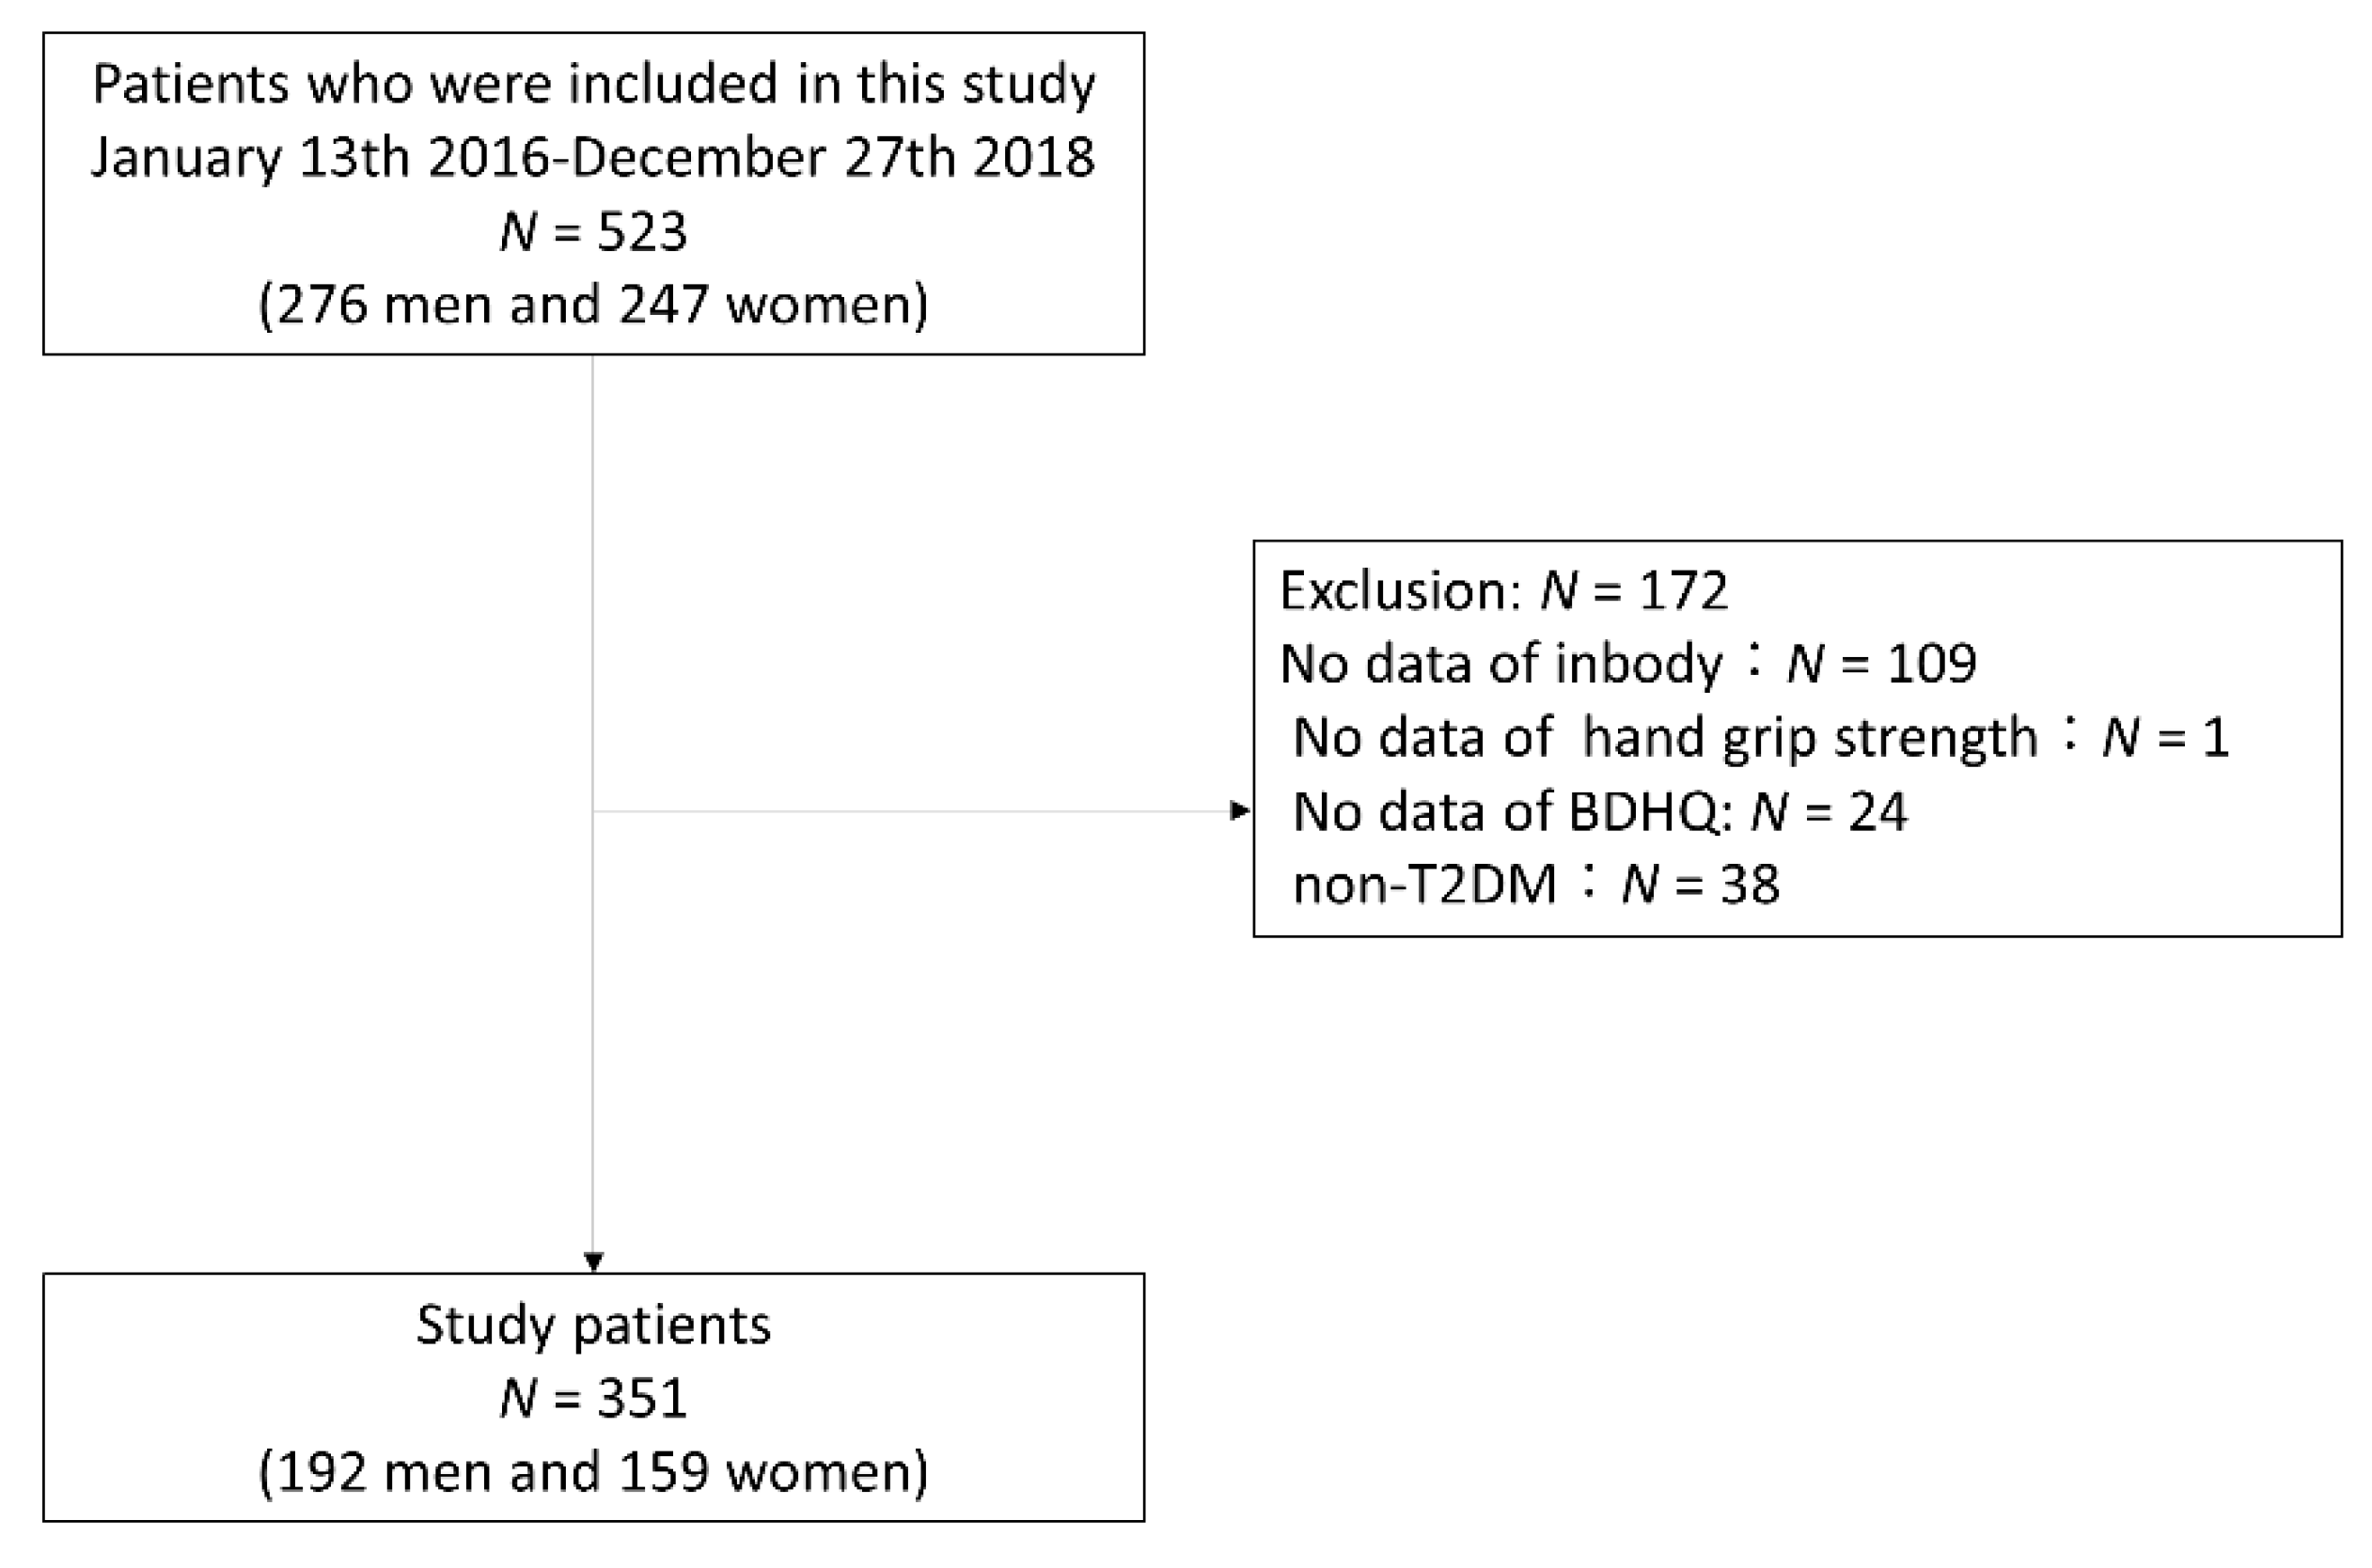
2.1. Study Participants
2.2. Data Collection
2.3. Definition of Sarcopenia
2.4. Data of Habitual Diet Intake, Including Habitual Miso Consumption
2.5. Statistical Analysis
3. Results
4. Discussion
Author Contributions
Funding
Institutional Review Board Statement
Informed Consent Statement
Data Availability Statement
Conflicts of Interest
References
- Charvat, H.; Goto, A.; Goto, M.; Inoue, M.; Heianza, Y.; Arase, Y.; Sone, H.; Nakagami, T.; Song, X.; Qiao, Q.; et al. Impact of population aging on trends in diabetes prevalence: A meta-regression analysis of 160,000 Japanese adults. J. Diabetes Investig. 2015, 6, 533–542. [Google Scholar] [CrossRef] [PubMed]
- Umegaki, H. Sarcopenia and frailty in older patients with diabetes mellitus. Geriatr. Gerontol. Int. 2016, 16, 293–299. [Google Scholar] [CrossRef] [PubMed]
- Hashimoto, Y.; Osaka, T.; Fukuda, T.; Tanaka, M.; Yamazaki, M.; Fukui, M. The relationship between hepatic steatosis and skeletal muscle mass index in men with type 2 diabetes. Endocr. J. 2016, 63, 877–884. [Google Scholar] [CrossRef] [PubMed] [Green Version]
- Hashimoto, Y.; Kaji, A.; Sakai, R.; Hamaguchi, M.; Okada, H.; Ushigome, E.; Asano, M.; Yamazaki, M.; Fukui, M. Sarcopenia is associated with blood pressure variability in older patients with type 2 diabetes: A cross-sectional study of the KAMOGAWA-DM cohort study. Geriatr. Gerontol. Int. 2018, 18, 1345–1349. [Google Scholar] [CrossRef]
- Chin, S.O.; Rhee, S.Y.; Chon, S.; Hwang, Y.C.; Jeong, I.K.; Oh, S.; Ahn, K.J.; Chung, H.Y.; Woo, J.T.; Kim, S.W.; et al. Sarcopenia Is Independently Associated with Cardiovascular Disease in Older Korean Adults: The Korea National Health and Nutrition Examination Survey (KNHANES) from 2009. PLoS ONE 2013, 8. [Google Scholar] [CrossRef] [Green Version]
- Abdul-Ghani, M.A.; Defronzo, R.A. Pathogenesis of insulin resistance in skeletal muscle. J. Biomed. Biotechnol. 2010, 2010. [Google Scholar] [CrossRef] [Green Version]
- Khamseh, M.E.; Malek, M.; Aghili, R.; Emami, Z. Sarcopenia and diabetes: Pathogenesis and consequences. Br. J. Diabetes Vasc. Dis. 2011, 11, 230–234. [Google Scholar] [CrossRef]
- Morley, J.E.; Malmstrom, T.K.; Rodriguez-Mañas, L.; Sinclair, A.J. Frailty, Sarcopenia and Diabetes. J. Am. Med. Dir. Assoc. 2014, 15, 853–859. [Google Scholar]
- Kim, T.N.; Choi, K.M. Sarcopenia: Definition, Epidemiology, and Pathophysiology. J. Bone Metab. 2013, 20, 1–10. [Google Scholar]
- Abbatecola, A.M.; Olivieri, F.; Corsonello, A.; Strollo, F.; Fumagalli, A.; Lattanzio, F. Frailty and safety: The example of diabetes. Drug Saf. 2012, 35, 63–71. [Google Scholar]
- Pedersen, M.; Bruunsgaard, H.; Weis, N.; Hendel, H.W.; Andreassen, B.U.; Eldrup, E.; Dela, F.; Pedersen, B.K. Circulating levels of TNF-alpha and IL-6-relation to truncal fat mass and muscle mass in healthy elderly individuals and in patients with type-2 diabetes. Mech. Ageing Dev. 2003, 124, 495–502. [Google Scholar] [PubMed]
- Song, M.Y.; Ruts, E.; Kim, J.; Janumala, I.; Heymsfield, S.; Gallagher, D. Sarcopenia and increased adipose tissue infiltration of muscle in elderly African American women. Am. J. Clin. Nutr. 2004, 79, 874–880. [Google Scholar] [CrossRef] [PubMed]
- Delmonico, M.J.; Harris, T.B.; Visser, M.; Park, S.W.; Conroy, M.B.; Velasquez-Mieyer, P.; Boudreau, R.; Manini, T.M.; Nevitt, M.; Newman, A.B.; et al. Longitudinal study of muscle strength, quality, and adipose tissue infiltration. Am. J. Clin. Nutr. 2009, 90, 1579–1585. [Google Scholar] [CrossRef] [PubMed]
- Son, J.W.; Lee, S.S.; Kim, S.R.; Yoo, S.J.; Cha, B.Y.; Son, H.Y.; Cho, N.H. Low muscle mass and risk of type 2 diabetes in middle-aged and older adults: Findings from the KoGES. Diabetologia 2017, 60, 865–872. [Google Scholar] [CrossRef] [PubMed] [Green Version]
- Takamura, T.; Kita, Y.; Nakagen, M.; Sakurai, M.; Isobe, Y.; Takeshita, Y.; Kawai, K.; Urabe, T.; Kaneko, S. Weight-adjusted lean body mass and calf circumference are protective against obesity-associated insulin resistance and metabolic abnormalities. Heliyon 2017, 3. [Google Scholar] [CrossRef] [Green Version]
- Brown, E.C.; Buchan, D.S.; Madi, S.A.; Gordon, B.N.; Drignei, D. Grip Strength Cut Points for Diabetes Risk Among Apparently Healthy U.S. Adults. Am. J. Prev. Med. 2020, 58, 757–765. [Google Scholar] [CrossRef] [PubMed]
- Watanabe, H.; Kashimoto, N.; Kajimura, J.; Kamiya, K. A miso (Japanese soybean paste) diet conferred greater protection against hypertension than a sodium chloride diet in Dahl salt-sensitive rats. Hypertens. Res. 2006, 29, 731–738. [Google Scholar] [CrossRef] [Green Version]
- Watanabe, H. Beneficial biological effects of miso with reference to radiation injury, cancer and hypertension. J. Toxicol. Pathol. 2013, 26, 91–103. [Google Scholar] [CrossRef] [Green Version]
- Kanda, A.; Hoshiyama, Y.; Kawaguchi, T. Association of lifestyle parameters with the prevention of hypertension in elderly Japanese men and women: A Four-Year followup of normotensive subjects. Asia-Pac. J. Public Health 1999, 11, 77–81. [Google Scholar] [CrossRef]
- Manzoni, M.S.J.; Rossi, E.A.; Carlos, I.Z.; Vendramini, R.C.; Duarte, A.C.G.O.; Dâmaso, A.R. Fermented soy product supplemented with isoflavones affected fat depots in juvenile rats. Nutrition 2005, 21, 1018–1024. [Google Scholar] [CrossRef]
- Ikeda, K.; Sato, T.; Nakayama, T.; Tanaka, D.; Nagashima, K.; Mano, F.; Joo, E.; Fujimoto, S.; Takahashi, Y.; Kosugi, S.; et al. Dietary habits associated with reduced insulin resistance: The Nagahama study. Diabetes Res. Clin. Pract. 2018, 141, 26–34. [Google Scholar] [CrossRef] [PubMed]
- Nakamoto, M.; Uemura, H.; Sakai, T.; Katsuura-Kamano, S.; Yamaguchi, M.; Hiyoshi, M.; Arisawa, K. Inverse association between soya food consumption and insulin resistance in Japanese adults. Public Health Nutr. 2015, 18, 2031–2040. [Google Scholar] [CrossRef] [PubMed] [Green Version]
- Katagiri, R.; Sawada, N.; Goto, A.; Yamaji, T.; Iwasaki, M.; Noda, M.; Iso, H.; Tsugane, S. Association of soy and fermented soy product intake with total and cause specific mortality: Prospective cohort study. BMJ 2020, 368, 1–12. [Google Scholar] [CrossRef] [PubMed] [Green Version]
- Okouchi, R.; Sakanoi, Y.; Tsuduki, T. Miso (Fermented soybean paste) suppresses visceral fat accumulation in mice, especially in combination with exercise. Nutrients 2019, 11, 560. [Google Scholar] [CrossRef] [PubMed] [Green Version]
- Nagata, C.; Wada, K.; Tamura, T.; Konishi, K.; Goto, Y.; Koda, S.; Kawachi, T.; Tsuji, M.; Nakamura, K. Dietary soy and natto intake and cardiovascular disease mortality in Japanese adults: The Takayama study. Am. J. Clin. Nutr. 2017, 105, 426–431. [Google Scholar] [CrossRef] [Green Version]
- Taku, K.; Lin, N.; Cai, D.; Hu, J.; Zhao, X.; Zhang, Y.; Wang, P.; Melby, M.K.; Hooper, L.; Kurzer, M.S.; et al. Effects of soy isoflavone extract supplements on blood pressure in adult humans: Systematic review and meta-analysis of randomized placebo-controlled trials. J. Hypertens. 2010, 28, 1971–1982. [Google Scholar] [CrossRef]
- Taku, K.; Umegaki, K.; Sato, Y.; Taki, Y.; Endoh, K.; Watanabe, S. Soy isoflavones lower serum total and LDL cholesterol in humans: A meta-analysis of 11 randomized controlled trials. Am. J. Clin. Nutr. 2007, 85, 1148–1156. [Google Scholar] [CrossRef]
- Okamoto, A.; Sugi, E.; Koizumi, Y.; Yanagida, F.; Udaka, S. Polyamine content of ordinary foodstuffs and various fermented foods. Biosci. Biotechnol. Biochem. 1997, 61, 1582–1584. [Google Scholar] [CrossRef] [Green Version]
- Sumi, H.; Hamada, H.; Tsushima, H.; Mihara, H.; Muraki, H. A novel fibrinolytic enzyme (nattokinase) in the vegetable cheese Natto; a typical and popular soybean food in the Japanese diet. Experientia 1987, 43, 1110–1111. [Google Scholar] [CrossRef]
- Sakai, R.; Hashimoto, Y.; Ushigome, E.; Miki, A.; Okamura, T.; Matsugasumi, M.; Fukuda, T.; Majima, S.; Matsumoto, S.; Senmaru, T.; et al. Late-night-dinner is associated with poor glycemic control in people with type 2 diabetes: The KAMOGAWA-DM cohort study. Endocr. J. 2018, 65, 395–402. [Google Scholar] [CrossRef] [Green Version]
- Matsuo, S.; Imai, E.; Horio, M.; Yasuda, Y.; Tomita, K.; Nitta, K.; Yamagata, K.; Tomino, Y.; Yokoyama, H.; Hishida, A.; et al. Revised Equations for Estimated GFR From Serum Creatinine in Japan. Am. J. Kidney Dis. 2009, 53, 982–992. [Google Scholar] [CrossRef] [PubMed]
- Kaji, A.; Hashimoto, Y.; Kobayashi, Y.; Sakai, R.; Okamura, T.; Miki, A.; Hamaguchi, M.; Kuwahata, M.; Yamazaki, M.; Fukui, M. Sarcopenia is associated with tongue pressure in older patients with type 2 diabetes: A cross-sectional study of the KAMOGAWA-DM cohort study. Geriatr. Gerontol. Int. 2019, 19, 153–158. [Google Scholar] [CrossRef] [PubMed]
- Lemmens, H.J.M.; Brodsky, J.B.; Bernstein, D.P. Estimating ideal body weight—A new formula. Obes. Surg. 2005, 15, 1082–1083. [Google Scholar] [CrossRef] [PubMed]
- Janssen, I.; Heymsfield, S.B.; Ross, R. Low relative skeletal muscle mass (sarcopenia) in older persons is associated with functional impairment and physical disability. J. Am. Geriatr. Soc. 2002, 50, 889–896. [Google Scholar] [CrossRef] [Green Version]
- Meng, G.; Wu, H.; Fang, L.; Li, C.; Yu, F.; Zhang, Q.; Liu, L.; Du, H.; Shi, H.; Xia, Y.; et al. Relationship between grip strength and newly diagnosed nonalcoholic fatty liver disease in a large-scale adult population. Sci. Rep. 2016, 6, 1–7. [Google Scholar] [CrossRef] [Green Version]
- Gan, D.; Wang, L.; Jia, M.; Ru, Y.; Ma, Y.; Zheng, W.; Zhao, X.; Yang, F.; Wang, T.; Mu, Y.; et al. Low muscle mass and low muscle strength associate with nonalcoholic fatty liver disease. Clin. Nutr. 2020, 39, 1124–1130. [Google Scholar] [CrossRef]
- Okamura, T.; Miki, A.; Hashimoto, Y.; Kaji, A.; Sakai, R.; Osaka, T.; Hamaguchi, M.; Yamazaki, M.; Fukui, M. Shortage of energy intake rather than protein intake is associated with sarcopenia in elderly patients with type 2 diabetes: A cross-sectional study of the KAMOGAWA-DM cohort. J. Diabetes 2019, 11, 477–483. [Google Scholar] [CrossRef]
- Kobayashi, S.; Murakami, K.; Sasaki, S.; Okubo, H.; Hirota, N.; Notsu, A.; Fukui, M.; Date, C. Comparison of relative validity of food group intakes estimated by comprehensive and brief-type self-administered diet history questionnaires against 16 d dietary records in Japanese adults. Public Health Nutr. 2011, 14, 1200–1211. [Google Scholar] [CrossRef]
- Hashimoto, Y.; Tanaka, M.; Miki, A.; Kobayashi, Y.; Wada, S.; Kuwahata, M.; Kido, Y.; Yamazaki, M.; Fukui, M. Intake of Carbohydrate to Fiber Ratio Is a Useful Marker for Metabolic Syndrome in Patients with Type 2 Diabetes: A Cross-Sectional Study. Ann. Nutr. Metab. 2018, 72, 329–335. [Google Scholar] [CrossRef]
- Kanda, Y. Investigation of the freely available easy-to-use software “EZR” for medical statistics. Bone Marrow Transpl. 2013, 48, 452–458. [Google Scholar] [CrossRef] [Green Version]
- Zhu, S.; Tian, Z.; Torigoe, D.; Zhao, J.; Xie, P.; Sugizaki, T.; Sato, M.; Horiguchi, H.; Terada, K.; Kadomatsu, T.; et al. Aging- And obesity-related peri-muscular adipose tissue accelerates muscle atrophy. PLoS ONE 2019, 14, 1–18. [Google Scholar] [CrossRef] [PubMed] [Green Version]
- Kim, T.N.; Park, M.S.; Ryu, J.Y.; Choi, H.Y.; Hong, H.C.; Yoo, H.J.; Kang, H.J.; Song, W.; Park, S.W.; Baik, S.H.; et al. Impact of visceral fat on skeletal muscle mass and vice versa in a prospective cohort study: The Korean Sarcopenic Obesity Study (KSOS). PLoS ONE 2014, 9, 1–13. [Google Scholar] [CrossRef] [PubMed] [Green Version]
- Beyer, I.; Mets, T.; Bautmans, I. Chronic low-grade inflammation and age-related sarcopenia. Curr. Opin. Clin. Nutr. Metab. Care 2012, 15, 12–22. [Google Scholar] [CrossRef] [PubMed]
- Yoshinaga, M.; Toda, N.; Tamura, Y.; Terakado, S.; Ueno, M.; Otsuka, K.; Numabe, A.; Kawabata, Y.; Uehara, Y. Japanese traditional miso soup attenuates salt-induced hypertension and its organ damage in Dahl salt-sensitive rats. Nutrition 2012, 28, 924–931. [Google Scholar] [CrossRef] [PubMed]
- Prevention by Long-Term Fermented Miso of Induction of Colonic Aberrant Crypt Foci by Azoxymethane in F344 Rats—PubMed. Available online: https://pubmed.ncbi.nlm.nih.gov/11748458/ (accessed on 6 November 2020).
- Shirako, S.; Kojima, Y.; Tomari, N.; Nakamura, Y.; Matsumura, Y.; Ikeda, K.; Inagaki, N.; Sato, K. Pyroglutamyl leucine, a peptide in fermented foods, attenuates dysbiosis by increasing host antimicrobial peptide. Npj Sci. Food 2019, 3, 18. [Google Scholar] [CrossRef]
- Ejima, A.; Nakamura, M.; Suzuki, Y.A.; Sato, K. Identification of food-derived peptides in human blood after ingestion of corn and wheat gluten hydrolysates. J. Food Bioact. 2018, 2, 104–111. [Google Scholar] [CrossRef] [Green Version]
- Wada, S.; Sato, K.; Ohta, R.; Wada, E.; Bou, Y.; Fujiwara, M.; Kiyono, T.; Park, E.Y.; Aoi, W.; Takagi, T.; et al. Ingestion of low dose pyroglutamyl leucine improves dextran sulfate sodium-induced colitis and intestinal microbiota in mice. J. Agric. Food Chem. 2013, 61, 8807–8813. [Google Scholar] [CrossRef]
- Castaner, O.; Goday, A.; Park, Y.M.; Lee, S.H.; Magkos, F.; Toh Ee Shiow, S.A. The Gut Microbiome Profile in Obesity: A Systematic Review. Int. J. Endocrinol. 2018, 2018, 4095789. [Google Scholar] [CrossRef]
- Dhakal, K.H.; Jung, K.H.; Chae, J.H.; Shannon, J.G.; Lee, J.D. Variation of unsaturated fatty acids in soybean sprout of high oleic acid accessions. Food Chem. 2014, 164, 70–73. [Google Scholar] [CrossRef]
- Okamura, T.; Hashimoto, Y.; Miki, A.; Kaji, A.; Sakai, R.; Iwai, K.; Osaka, T.; Ushigome, E.; Hamaguchi, M.; Yamazaki, M.; et al. Reduced dietary omega-3 fatty acids intake is associated with sarcopenia in elderly patients with type 2 diabetes: A cross-sectional study of KAMOGAWA-DM cohort study. J. Clin. Biochem. Nutr. 2020, 66, 233–237. [Google Scholar] [CrossRef] [Green Version]
- Oh, S.L.; Lee, S.R.; Kim, J.S. Effects of conjugated linoleic acid/n-3 and resistance training on muscle quality and expression of atrophy-related ubiquitin ligases in middle-aged mice with high-fat diet-induced obesity. J. Exerc. Nutr. Biochem. 2017, 30, 11–18. [Google Scholar] [CrossRef] [PubMed]
- Aoyama, T.; Fukui, K.; Takamatsu, K.; Hashimoto, Y.; Yamamoto, T. Soy protein isolate and its hydrolysate reduce body fat of dietary obese rats and genetically obese mice (yellow KK). Nutrition 2000, 16, 349–354. [Google Scholar] [CrossRef]
- Davis, J.; Higginbotham, A.; O’Connor, T.; Moustaid-Moussa, N.; Tebbe, A.; Kim, Y.C.; Cho, K.W.; Shay, N.; Adler, S.; Peterson, R.; et al. Soy protein and isoflavones influence adiposity and development of metabolic syndrome in the obese male ZDF rat. Ann. Nutr. Metab. 2007, 51, 42–52. [Google Scholar] [CrossRef] [PubMed]
- Vitale, D.C.; Piazza, C.; Melilli, B.; Drago, F.; Salomone, S. Isoflavones: Estrogenic activity, biological effect and bioavailability. Eur. J. Drug Metab. Pharmacokinet. 2013, 38, 15–25. [Google Scholar] [CrossRef] [PubMed]
- Takase, H.; Sakane, N.; Morimoto, T.; Uchida, T.; Mori, K.; Katashima, M.; Katsuragi, Y.; Sallam, R.M. Development of a Dietary Factor Assessment Tool for Evaluating Associations between Visceral Fat Accumulation and Major Nutrients in Japanese Adults. J. Obes. 2019, 2019. [Google Scholar] [CrossRef] [Green Version]
- Suthuvoravut, U.; Takahashi, K.; Murayama, H.; Tanaka, T.; Akishita, M.; Iijima, K. Association between Traditional Japanese Diet Washoku and Sarcopenia in Community-Dwelling Older Adults: Findings from the Kashiwa Study. J. Nutr. Health Aging 2020, 24, 282–289. [Google Scholar] [CrossRef]
- Zuo, L.; He, F.; Sergakis, G.G.; Koozehchian, M.S.; Stimpfl, J.N.; Rong, Y.; Diaz, P.T.; Best, T.M. Interrelated role of cigarette smoking, oxidative stress, and immune response in COPD and corresponding treatments. Am. J. Physiol. Lung Cell. Mol. Physiol. 2014, 307, L205–L218. [Google Scholar] [CrossRef] [Green Version]
- Rom, O.; Kaisari, S.; Aizenbud, D.; Reznick, A.Z. Sarcopenia and smoking: A possible cellular model of cigarette smoke effects on muscle protein breakdown. Ann. N. Y. Acad. Sci. 2012, 1259, 47–53. [Google Scholar] [CrossRef]


| All n = 351 | Men n = 192 | Women n = 159 | p | |
|---|---|---|---|---|
| Age, years | 66.6 (10.6) | 67.1 (10.9) | 66.0 (10.4) | 0.430 |
| Duration of diabetes, years | 14.1 (10.0) | 14.8 (9.5) | 13.3 (10.6) | 0.041 |
| Family history of diabetes (−/+) | 194/157 | 113/79 | 81/78 | 0.169 |
| Height, cm | 160.9 (9.2) | 167.2 (6.3) | 153.2 (5.6) | <0.001 |
| Body weight, kg | 62.9 (12.2) | 66.9 (11.4) | 58.0 (11.4) | <0.001 |
| Body mass index, kg/m2 | 24.5 (4.4) | 23.9 (3.7) | 25.1 (5.1) | 0.062 |
| SBP, mmHg | 134.4 (19.0) | 133.8 (18.3) | 135.2 (20.0) | 0.690 |
| DBP, mmHg | 78.9 (11.3) | 79.3 (10.9) | 78.5 (11.8) | 0.198 |
| Insulin (−/+) | 263/88 | 145/47 | 118/41 | 0.875 |
| DPP4 inhibitor (−/+) | 169/182 | 86/106 | 83/76 | 0.202 |
| SU (−/+) | 270/81 | 144/48 | 126/33 | 0.417 |
| Glinide (−/+) | 320/31 | 180/12 | 140/19 | 0.092 |
| Biguanide (−/+) | 207/144 | 118/74 | 89/70 | 0.352 |
| Thiazolidinediones (−/+) | 338/13 | 183/9 | 155/4 | 0.430 |
| α- GI (−/+) | 306/45 | 169/23 | 137/22 | 0.721 |
| SGLT2 inhibitor (−/+) | 294/57 | 160/32 | 134/25 | 0.926 |
| GLP-1 receptor agonist (−/+) | 296/55 | 167/25 | 129/30 | 0.176 |
| RAS inhibitor (−/+) | 194/157 | 98/94 | 96/63 | 0.100 |
| Smoking (−/+) | 301/50 | 152/40 | 149/10 | <0.001 |
| Habit of exercise (−/+) | 181/170 | 95/97 | 86/73 | 0.452 |
| HbA1c, mmol/mol | 56.8 (13.6) | 57.1 (13.6) | 56.4 (13.6) | 0.777 |
| HbA1c, % | 7.3 (1.2) | 7.4 (1.2) | 7.3 (1.2) | 0.777 |
| Plasma glucose, mmol/L | 8.3 (2.8) | 8.4 (2.7) | 8.1 (2.8) | 0.130 |
| Creatinine, umol/L | 73.2 (32.1) | 83.4 (36.2) | 60.9 (20.5) | <0.001 |
| eGFR, mL/min/1.73 m2 | 69.7 (19.3) | 69.1 (20.3) | 70.5 (18.1) | 0.524 |
| Uric acid, mmol/L | 305.6 (74.4) | 319.3 (78.4) | 288.8 (65.8) | <0.001 |
| Triglycerides, mmol/L | 1.5 (0.9) | 1.5 (0.9) | 1.5 (0.8) | 0.854 |
| HDL cholesterol, mmol/L | 1.6 (0.4) | 1.5 (0.4) | 1.6 (0.4) | <0.001 |
| Body fat mass, kg | 19.0 (8.5) | 17.2 (7.6) | 21.3 (9.1) | <0.001 |
| Percent body fat mass, % | 29.3 (9.0) | 24.8 (7.1) | 34.7 (8.1) | <0.001 |
| Appendicular muscle mass, kg | 18.3 (4.2) | 21.1 (3.2) | 14.9 (2.4) | <0.001 |
| SMI, % | 29.0 (4.3) | 31.7 (3.2) | 25.7 (2.9) | <0.001 |
| Low skeletal muscle mass (−/+) | 275/76 | 164/28 | 111/48 | 0.001 |
| HGS, kg | 27.9 (9.3) | 33.7 (7.7) | 20.8 (5.2) | <0.001 |
| AGS, % | 44.1 (12.0) | 50.7 (10.1) | 36.1 (9.0) | <0.001 |
| Low muscle strength (−/+) | 175/176 | 95/97 | 80/79 | 0.961 |
| Presence of sarcopenia (−/+) | 293/58 | 170/22 | 123/36 | 0.008 |
| All n = 351 | Men n = 192 | Women n = 159 | p | |
|---|---|---|---|---|
| Total energy intake, kcal/day | 1748.4 (636.9) | 1933.0 (646.4) | 1525.4 (549.6) | <0.001 |
| Energy intake, kcal/IBW kg/day | 30.7 (10.9) | 31.5 (10.8) | 29.6 (10.9) | 0.058 |
| Total fat intake, g/day | 55.4 (23.4) | 59.0 (23.4) | 51.1 (22.9) | <0.001 |
| Fat intake, g/IBW kg/day | 1.0 (0.4) | 1.0 (0.4) | 1.0 (0.5) | 0.836 |
| Fat intake per energy intake, % | 28.7 (6.3) | 27.6 (6.5) | 30.0 (5.9) | <0.001 |
| Total protein intake, g/day | 73.0 (29.7) | 76.8 (30.0) | 68.4 (28.8) | 0.002 |
| Protein intake, g/IBW kg/day | 1.3 (0.5) | 1.3 (0.5) | 1.3 (0.6) | 0.220 |
| Protein intake per energy intake, % | 16.8 (3.5) | 16.0 (3.1) | 17.9 (3.5) | <0.001 |
| Animal protein intake, g/day | 44.8 (23.1) | 46.4 (23.4) | 42.8 (22.7) | 0.072 |
| Animal protein intake, g/IBW kg/day | 0.8 (0.4) | 0.8 (0.4) | 0.8 (0.5) | 0.105 |
| Vegetable protein intake, g/day | 28.2 (10.0) | 30.4 (10.3) | 25.6 (9.0) | <0.001 |
| Vegetable protein intake, g/IBW kg/day | 0.5 (0.2) | 0.5 (0.2) | 0.5 (0.2) | 0.874 |
| Total carbohydrate intake, g/day | 220.3 (86.1) | 243.0 (90.5) | 193.0 (71.7) | <0.001 |
| Carbohydrate intake, g/IBW kg/day | 3.9 (1.5) | 4.0 (1.5) | 3.7 (1.4) | 0.125 |
| Carbohydrate intake per energy intake, % | 50.6 (8.7) | 50.5 (9.1) | 50.8 (8.2) | 0.708 |
| Dietary fiber intake, g/day | 12.2 (5.1) | 12.6 (5.4) | 11.7 (4.7) | 0.209 |
| Carbohydrate/fiber ratio | 19.5 (7.3) | 21.1 (7.9) | 17.5 (5.9) | <0.001 |
| Alcohol consumption, g/day | 8.0 (20.0) | 14.1 (25.3) | 0.7 (3.0) | <0.001 |
| Miso soup intake, g/day | 115.9 (103.0) | 132.8 (114.5) | 95.6 (83.1) | <0.001 |
| Habitual miso consumption (−/+) | 49/302 | 23/169 | 26/133 | 0.307 |
| Men, n = 192 | Women, n = 159 | |||||
|---|---|---|---|---|---|---|
| Habitual Miso Consumption (−) n = 23 | Habitual Miso Consumption (+) n = 169 | p | Habitual Miso Consumption (−) n = 26 | Habitual Miso Consumption (+) n = 133 | p | |
| Age, years | 70.8 (10.6) | 66.6 (10.8) | 0.133 | 64.3 (13.4) | 66.3 (9.7) | 0.699 |
| Duration of diabetes, years | 18.9 (9.4) | 14.2 (9.4) | 0.014 | 17.8 (12.5) | 12.5 (10.0) | 0.018 |
| Family history of diabetes (−/+) | 14/9 | 99/70 | 1.000 | 10/16 | 71/62 | 0.239 |
| Height, cm | 165.7 (7.0) | 167.4 (6.1) | 0.227 | 152.3 (6.2) | 153.4 (5.5) | 0.382 |
| Body weight, kg | 66.5 (10.6) | 66.9 (11.5) | 0.906 | 62.5 (11.5) | 57.2 (11.2) | 0.022 |
| Body mass index, kg/m2 | 24.2 (2.9) | 23.9 (3.8) | 0.567 | 27.3 (5.3) | 24.7 (5.0) | 0.022 |
| SBP, mmHg | 127.4 (16.6) | 134.6 (18.4) | 0.087 | 138.2 (18.6) | 134.6 (20.2) | 0.215 |
| DBP, mmHg | 74.8 (10.8) | 79.9 (10.8) | 0.034 | 76.0 (9.0) | 79.0 (12.2) | 0.253 |
| Insulin (−/+) | 20/3 | 125/44 | 0.271 | 15/11 | 103/30 | 0.063 |
| DPP4 (−/+) | 9/14 | 77/92 | 0.720 | 12/14 | 71/62 | 0.645 |
| SU (−/+) | 13/10 | 131/38 | 0.054 | 19/7 | 107/26 | 0.559 |
| Glinide (−/+) | 21/2 | 159/10 | 0.954 | 23/3 | 117/16 | 1.000 |
| Biguanide (−/+) | 9/14 | 109/60 | 0.034 | 16/10 | 73/60 | 0.683 |
| Thiazolidinediones (−/+) | 22/1 | 161/8 | 1.000 | 25/1 | 130/3 | 1.000 |
| α- GI (−/+) | 18/5 | 151/18 | 0.232 | 24/2 | 113/20 | 0.496 |
| SGLT2 (−/+) | 16/7 | 144/25 | 0.112 | 23/3 | 111/22 | 0.729 |
| GLP-1 (−/+) | 18/5 | 149/20 | 0.320 | 18/8 | 111/22 | 0.155 |
| RAS inhibitor (−/+) | 10/13 | 88/81 | 0.582 | 12/14 | 84/49 | 0.161 |
| Smoking (−/+) | 19/4 | 133/36 | 0.873 | 23/3 | 126/7 | 0.445 |
| Habit of exercise (−/+) | 14/9 | 81/88 | 0.346 | 14/12 | 72/61 | 1.000 |
| HbA1c, mmol/mol | 58.2 (17.1) | 56.9 (13.1) | 0.908 | 65.3 (20.3) | 54.7 (11.1) | 0.006 |
| HbA1c, % | 7.5 (1.6) | 7.4 (1.2) | 0.908 | 8.1 (1.9) | 7.2 (1.0) | 0.006 |
| Plasma glucose, mmol/L | 8.2 (2.7) | 8.4 (2.7) | 0.593 | 9.1 (3.9) | 7.9 (2.5) | 0.084 |
| Creatinine, umol/L | 81.9 (17.4) | 83.6 (38.1) | 0.305 | 68.0 (35.1) | 59.5 (16.0) | 0.994 |
| eGFR, mL/min/1.73 m2 | 66.0 (19.5) | 69.6 (20.4) | 0.435 | 69.3 (23.7) | 70.7 (16.9) | 0.726 |
| Uric acid, mmol/L | 323.0 (59.9) | 318.8 (80.7) | 0.843 | 296.5 (67.8) | 287.3 (65.6) | 0.585 |
| Triglycerides, mmol/L | 1.4 (0.7) | 1.5 (0.9) | 0.876 | 1.5 (0.7) | 1.4 (0.9) | 0.453 |
| HDL cholesterol, mmol/L | 1.5 (0.4) | 1.5 (0.5) | 0.469 | 1.6 (0.3) | 1.6 (0.4) | 0.567 |
| Body fat mass, kg | 18.6 (6.1) | 17.0 (7.8) | 0.189 | 25.6 (9.6) | 20.4 (8.7) | 0.009 |
| Percent body fat mass, % | 27.4 (5.6) | 24.4 (7.2) | 0.056 | 39.3 (7.3) | 33.8 (8.0) | 0.001 |
| Appendicular muscle mass, kg | 20.4 (3.3) | 21.2 (3.1) | 0.233 | 15.2 (2.7) | 14.9 (2.3) | 0.507 |
| SMI, % | 30.7 (2.3) | 31.9 (3.3) | 0.078 | 24.3 (3.0) | 26.0 (2.8) | 0.011 |
| Low skeletal muscle mass (−/+) | 19/4 | 145/25 | 0.735 | 14/13 | 98/35 | 0.024 |
| HGS, kg | 31.0 (7.1) | 34.0 (7.8) | 0.138 | 20.4 (5.2) | 20.9 (5.2) | 0.872 |
| AGS, % | 46.9 (10.3) | 51.2 (10.0) | 0.055 | 32.9 (8.6) | 36.7 (8.9) | 0.043 |
| Low muscle strength (−/+) | 9/14 | 87/83 | 0.278 | 7/19 | 73/60 | 0.009 |
| Presence of sarcopenia (−/+) | 20/3 | 150/19 | 1.000 | 15/11 | 108/25 | 0.018 |
| Men, n = 192 | Women, n = 159 | |||||
|---|---|---|---|---|---|---|
| Habitual Miso Consumption (−) n = 23 | Habitual Miso Consumption (+) n = 169 | p | Habitual Miso Consumption (−) n = 26 | Habitual Miso Consumption (+) n = 133 | p | |
| Total energy intake, kcal/day | 1767.8 (566.0) | 1955.5 (654.8) | 0.099 | 1201.1 (333.9) | 1588.8 (561.9) | <0.001 |
| Energy intake, kcal/IBW kg/day | 29.4 (10.2) | 31.8 (10.9) | 0.192 | 23.5 (6.3) | 30.8 (11.2) | <0.001 |
| Total protein intake, g/day | 71.5 (23.4) | 77.5 (30.7) | 0.383 | 51.2 (18.1) | 71.7 (29.3) | <0.001 |
| Protein intake, g/IBW kg/day | 1.2 (0.4) | 1.3 (0.5) | 0.469 | 1.0 (0.3) | 1.4 (0.6) | <0.001 |
| Protein intake per energy intake, % | 16.3 (3.2) | 15.9 (3.1) | 0.497 | 17.1 (3.9) | 18.0 (3.4) | 0.102 |
| Animal protein intake, g/day | 44.3 (19.1) | 46.7 (24.0) | 0.672 | 32.2 (14.5) | 44.8 (23.5) | 0.005 |
| Animal protein intake, g/IBW kg/day | 0.7 (0.3) | 0.8 (0.4) | 0.817 | 0.6 (0.3) | 0.9 (0.5) | 0.006 |
| Vegetable protein intake, g/day | 27.2 (9.3) | 30.8 (10.4) | 0.051 | 19.0 (6.0) | 26.9 (9.0) | <0.001 |
| Vegetable protein intake, g/IBW kg/day | 0.5 (0.2) | 0.5 (0.2) | 0.073 | 0.4 (0.1) | 0.5 (0.2) | <0.001 |
| Total fat intake, g/day | 61.9 (19.0) | 58.6 (23.9) | 0.295 | 40.3 (15.1) | 53.3 (23.5) | 0.004 |
| Fat intake, g/IBW kg/day | 1.0 (0.3) | 1.0 (0.4) | 0.256 | 0.8 (0.3) | 1.0 (0.5) | 0.006 |
| Fat intake per energy intake, % | 32.1 (6.8) | 27.0 (6.2) | 0.001 | 29.9 (7.0) | 30.0 (5.7) | 0.939 |
| Total carbohydrate intake, g/day | 218.8 (100.7) | 246.2 (88.8) | 0.031 | 154.0 (44.2) | 200.6 (73.6) | 0.002 |
| Carbohydrate intake, g/IBW kg/day | 3.7 (1.8) | 4.0 (1.5) | 0.060 | 3.0 (0.8) | 3.9 (1.4) | 0.003 |
| Carbohydrate intake per energy intake, % | 49.2 (9.9) | 50.6 (9.0) | 0.468 | 61.6 (9.5) | 50.7 (8.0) | 0.584 |
| Dietary fiber intake, g/day | 11.1 (3.6) | 12.8 (5.6) | 0.302 | 8.1 (2.9) | 12.4 (4.6) | <0.001 |
| Carbohydrate/fiber ratio | 21.1 (8.4) | 21.1 (7.8) | 0.914 | 20.1 (6.6) | 17.0 (5.6) | 0.028 |
| Alcohol consumption, g/day | 4.1 (11.9) | 15.5 (26.3) | 0.003 | 0.4 (1.5) | 0.7 (3.2) | 0.800 |
| Men | Model 1 | Model 2 | Model 3 | |||
| OR (95% CI) | p | OR (95% CI) | p | OR (95% CI) | p | |
| Habitual miso consumption (+) | 0.84 (0.23–3.11) | 0.799 | 0.91 (0.24–3.40) | 0.887 | 1.11 (0.27–4.57) | 0.882 |
| Age (years) | - | - | 1.02 (0.97–1.06) | 0.425 | 1.03 (0.97–1.08) | 0.361 |
| HbA1c (mmol/mol) | - | - | - | - | 0.99 (0.95–1.04) | 0.789 |
| Insulin treatment | - | - | - | - | 0.30 (0.06–1.46) | 0.137 |
| Habit of exercise | - | - | - | - | 0.76 (0.29–1.95) | 0.564 |
| Habit of smoking | - | - | - | - | 0.63 (0.17–2.33) | 0.484 |
| Duration of diabetes (years) | - | - | - | - | 0.98 (0.92–1.04) | 0.456 |
| Energy intake (kcal/IBW kg/day) | - | - | - | - | 0.96 (0.87–1.06) | 0.424 |
| Protein intake (g/IBW kg/day) | - | - | - | - | 1.24 (0.17–9.09) | 0.831 |
| Alcohol consumption (g/day) | - | - | - | - | 0.99 (0.97–1.02) | 0.614 |
| Women | Model 1 | Model 2 | Model 3 | |||
| OR (95% CI) | p | OR (95% CI) | p | OR (95% CI) | p | |
| Habitual miso consumption (+) | 0.32 (0.13–0.77) | 0.011 | 0.33 (0.13–0.80) | 0.015 | 0.20 (0.06–0.62) | 0.005 |
| Age (years) | - | - | 0.98 (0.94–1.01) | 0.212 | 1.01 (0.96–1.05) | 0.795 |
| HbA1c (mmol/mol) | - | - | - | - | 1.01 (0.98–1.04) | 0.692 |
| Insulin treatment | - | - | - | - | 0.64 (0.22–1.88) | 0.419 |
| Habit of exercise | - | - | - | - | 0.79 (0.34–1.84) | 0.579 |
| Habit of smoking | - | - | - | - | 2.07 (0.49–8.71) | 0.321 |
| Duration of diabetes (years) | - | - | - | - | 0.95 (0.91–1.01) | 0.085 |
| Energy intake (kcal/IBW kg/day) | - | - | - | - | 1.04 (0.96–1.13) | 0.296 |
| Protein intake (g/IBW kg/day) | - | - | - | - | 0.65 (0.14–3.05) | 0.584 |
| Alcohol consumption (g/day) | - | - | - | - | 1.07 (0.95–1.20) | 0.298 |
| Men | Model 1 | Model 2 | Model 3 | |||
| OR (95% CI) | p | OR (95% CI) | p | OR (95% CI) | p | |
| Log (miso soup intake + 1) | 0.94 (0.73–1.20) | 0.618 | 0.95 (0.74–1.23) | 0.703 | 1.01 (0.76–1.34) | 0.952 |
| Age (years) | - | - | 1.02 (0.97–1.06) | 0.445 | 1.03 (0.97–1.08) | 0.368 |
| HbA1c (mmol/mol) | - | - | - | - | 0.94 (0.60–1.48) | 0.783 |
| Insulin treatment | - | - | - | - | 0.31 (0.06–1.48) | 0.141 |
| Habit of exercise | - | - | - | - | 0.76 (0.30–1.96) | 0.574 |
| Habit of smoking | - | - | - | - | 0.63 (0.17–2.33) | 0.484 |
| Duration of diabetes (years) | - | - | - | - | 0.98 (0.92–1.04) | 0.448 |
| Energy intake (kcal/IBW kg/day) | - | - | - | - | 0.96 (0.87–1.06) | 0.418 |
| Protein intake (g/IBW kg/day) | - | - | - | - | 1.25 (0.17–9.20) | 0.823 |
| Alcohol consumption (g/day) | - | - | - | - | 0.99 (0.97–1.02) | 0.621 |
| Women | Model 1 | Model 2 | Model 3 | |||
| OR (95% CI) | p | OR (95% CI) | p | OR (95% CI) | p | |
| Log (miso soup intake + 1) | 0.77 (0.64–0.93) | 0.007 | 0.77 (0.64–0.94) | 0.008 | 0.67 (0.52–0.86) | 0.002 |
| Age (years) | - | - | 0.98 (0.94–1.01) | 0.192 | 1.00 (0.96–1.05) | 0.832 |
| HbA1c (mmol/mol) | - | - | - | - | 1.04 (0.75–1.45) | 0.825 |
| Insulin treatment | - | - | - | - | 0.66 (0.22–1.96) | 0.457 |
| Habit of exercise | - | - | - | - | 0.76 (0.32–1.81) | 0.541 |
| Habit of smoking | - | - | - | - | 2.28 (0.54–9.69) | 0.262 |
| Duration of diabetes (years) | - | - | - | - | 0.95 (0.90–1.00) | 0.067 |
| Energy intake (kcal/IBW kg/day) | - | - | - | - | 1.05 (0.97–1.14) | 0.261 |
| Protein intake (g/IBW kg/day) | - | - | - | - | 0.69 (0.14–3.30) | 0.639 |
| Alcohol consumption (g/day) | - | - | - | - | 1.07 (0.95–1.21) | 0.262 |
Publisher’s Note: MDPI stays neutral with regard to jurisdictional claims in published maps and institutional affiliations. |
© 2020 by the authors. Licensee MDPI, Basel, Switzerland. This article is an open access article distributed under the terms and conditions of the Creative Commons Attribution (CC BY) license (http://creativecommons.org/licenses/by/4.0/).
Share and Cite
Takahashi, F.; Hashimoto, Y.; Kaji, A.; Sakai, R.; Kawate, Y.; Okamura, T.; Kitagawa, N.; Okada, H.; Nakanishi, N.; Majima, S.; et al. Habitual Miso (Fermented Soybean Paste) Consumption Is Associated with a Low Prevalence of Sarcopenia in Patients with Type 2 Diabetes: A Cross-Sectional Study. Nutrients 2021, 13, 72. https://doi.org/10.3390/nu13010072
Takahashi F, Hashimoto Y, Kaji A, Sakai R, Kawate Y, Okamura T, Kitagawa N, Okada H, Nakanishi N, Majima S, et al. Habitual Miso (Fermented Soybean Paste) Consumption Is Associated with a Low Prevalence of Sarcopenia in Patients with Type 2 Diabetes: A Cross-Sectional Study. Nutrients. 2021; 13(1):72. https://doi.org/10.3390/nu13010072
Chicago/Turabian StyleTakahashi, Fuyuko, Yoshitaka Hashimoto, Ayumi Kaji, Ryosuke Sakai, Yuka Kawate, Takuro Okamura, Noriyuki Kitagawa, Hiroshi Okada, Naoko Nakanishi, Saori Majima, and et al. 2021. "Habitual Miso (Fermented Soybean Paste) Consumption Is Associated with a Low Prevalence of Sarcopenia in Patients with Type 2 Diabetes: A Cross-Sectional Study" Nutrients 13, no. 1: 72. https://doi.org/10.3390/nu13010072