Article

An Assessment of Three Carbohydrate Metrics of Nutritional Quality for Packaged Foods and Beverages in Australia and Southeast Asia

1
Department of Food Science and Technology, National University of Singapore, Singapore 117543, Singapore
2
Science and Technology Department, Nestlé R&D Center (Pte) Ltd., Singapore 618802, Singapore
3
Department of Metabolic Health, Nestlé Research, 1000 Lausanne 26, Switzerland
4
Nutrition Research Australia, Sydney NSW 2000, Australia
*
Authors to whom correspondence should be addressed.
Nutrients 2020, 12(9), 2771; https://doi.org/10.3390/nu12092771
Submission received: 20 August 2020 / Revised: 8 September 2020 / Accepted: 9 September 2020 / Published: 11 September 2020

Abstract

:
Carbohydrate quality is an aetiological factor of diet-related disease. Indices of carbohydrate quality featuring various ratios of carbohydrates-to-dietary fibre-to-sugar have been associated with improved product and/or diet quality in westernised countries. Carbohydrate intake is especially high in Asia Pacific. Thus, this study evaluated the ability of such carbohydrate metrics to discriminate the nutritional quality of carbohydrate-rich packaged foods and beverages in Australia, Malaysia, Singapore, Thailand and the Philippines, with an additional focus on beverages. This evaluation was conducted by comparing product nutritional composition and assessing products against three national nutrient profiling models. Results showed that Australia had the highest proportion of products meeting all metrics, compared to the Southeast Asian countries. Beverages had a low adherence to all metrics compared to solid foods. Across the five countries, both processed food and beverages meeting the metrics generally contained higher dietary fibre, protein, and certain vitamins and minerals whilst having lower energy, total sugars, free sugars, trans fat and cholesterol content compared to products not meeting the metrics. The metrics were also aligned with national nutrient profiling models to identify nutritious products. In conclusion, these metrics allowed us to discriminate product nutritional quality in the countries assessed and are applicable to beverages.

1. Introduction

Carbohydrates are the primary energy source of the human diet. Its intake is especially high in Asian countries, where the average consumption ranges from 65% to >80% of daily energy intake, contributed primarily by starch-based foods (e.g., rice-based foods) [1,2,3]. In contrast, western countries, such as Australia, have a lower carbohydrate consumption at an average of <55% to 65% of daily energy intake, and consists of a mix of starch-based foods (e.g., breads) and sugars [1,3,4,5].
Recent scientific literature has established that carbohydrate quality over quantity is more predictive of disease risk, and the topic of how to define carbohydrate quality has raised much debate over the past years in an attempt to unify recommendations beyond single nutrient targets, such as “high in fibre” or “low in sugar” [6,7,8,9]. Among the most well-known measures, the glycaemic index (GI) and whole grain content have been proposed as markers of carbohydrate quality in a product. While GI is a notable measure of dietary carbohydrate quality [10,11,12], its use and understanding by the broader population is limited, owing to the measure being too technical and its need to be tested clinically [13]. Whole grain, in contrast, is more broadly known and recognised [14,15,16], but the lack of universal definition of what constitutes a “whole grain food” and a minimum nutritional requirement have led to heterogeneous quality of products bearing a whole grain claim [17,18]. Thus, there is a need to develop a measure of nutritional quality for carbohydrate-rich products, which is nutritionally credible yet straightforward to communicate and compute.
As there is a general consensus that dietary fibre intake, in particular from whole grain sources, should be promoted [6,7,19,20], and free sugars intake be limited [21,22], novel alternative metrics of carbohydrate quality beyond absolute recommendations of these nutrients have emerged. These are expressed as ratios of total carbohydrates and/or starch to dietary fibre. AlEssa and team reported that diets with low total carbohydrates-to-cereal fibre ratios are associated with lower risk for type 2 diabetes mellitus (T2DM) and coronary heart disease in the United States of America (USA) [6,19]. Recently, Blumfield et al., 2020, showed that diets compliant with similar carbohydrate metrics but integrating a free sugar threshold had an improved overall nutritional intake in the Australian population, reflected by a higher Healthy Eating Index score [23].
While the relevance of such metrics has been demonstrated at diet level, it remains a challenge for consumers to relate their daily food selections with absolute nutrient recommendations. Packaged foods and beverages make up a large part of the modern-day urban diet, and the ability to select healthful products is a key contribution to healthier diets [24,25,26]. Recently, such metrics have also been proven useful at a product level, with products meeting these metrics found to be nutritionally superior in the USA [17,27] and Brazil [28]. Though the metric has been established in these countries, differences in eating culture and food regulation have a vast influence on the availability and choice of products. For instance, there is a greater history and more extensive range of plant-based milk substitutes in Asia [29,30], and cereal-based drinks, which are consumed extensively as a snack and/or breakfast, are non-negligible sources of carbohydrate intake in these countries [31]. However, due to the low availability of such products in the USA and Brazil, previous studies [27,28] failed to capture whether the carbohydrate metrics could be relevant to beverages. Nutrient labelling and permitted product claims also influence product formulations in the market significantly. For example, unlike the USA, labelling of added and/or free sugars is voluntary in the countries assessed in this paper, and consumer knowledge of its importance may be limited. Thus, whether the metrics developed based on USA-style dietary patterns may apply to products in Asia Pacific, and especially beverages, remains unknown.
The objective of this study was to investigate whether these carbohydrate metrics could help identify products, particularly beverages, of a higher nutritional quality in countries from the Asia Pacific region, namely Australia, Malaysia, Singapore, Thailand and the Philippines.

2. Materials and Methods

2.1. Definition of the Carbohydrate Metrics

Three carbohydrate metrics were assessed; these are, per 10 g of total carbohydrates in a product:
  • At least 1 g of dietary fibre (simple ratio);
  • At least 1 g of dietary fibre and no more than 2 g of free sugars (modified ratio);
  • At least 1 g of dietary fibre, and no more than 2 g of free sugar per 1 g of dietary fibre (dual ratio).
The simple ratio was developed by the American Heart Association (AHA) and follows a recommendation based on the ratio of total carbohydrates to dietary fibre in whole wheat [32]. The modified ratio includes an upper limit for free sugars based on the WHO free sugars recommendations described above [33], and on an average recommendation that about 50% of total energy intake is derived from carbohydrates, then individuals should consume no more than 2 g of free sugar per 10 g of carbohydrates. The dual ratio was developed to put emphasis on the dietary fibre content, rather than the total carbohydrates. In this metric, free sugar content is restricted to 2 g for every 1 g of dietary fibre in the product [27]. This is based on AHA recommendations to consume at least 25 g of dietary fibre [14] and the WHO free sugar recommendation (equivalent to 50 g of free sugars for a diet of 2000 kcal a day). The dual and modified ratio are subsets of the simple ratio and take free sugars into account.

2.2. Food Databases and Product Selection Criteria

Carbohydrate-based packaged foods and beverages from two different databases—Australian Food Composition Database Release 1 (AFCD-1) and Mintel Global New Products Database (Mintel Database)—were curated. Data from AFCD-1 are available as food and beverage sub-categories, whereas data from the Mintel databases are of individual products. AFCD-1 is a national database that contains the nutrient composition of common Australian food and beverage sub-categories [34]. Data were obtained predominantly from analysis of typical Australian products within a sub-category, and the remainder were derived from product labels, imputations or burrowed from other countries. The Mintel Database is a collation of products launched in a country, with details of its on-pack product information including its declared nutrient content, product description, ingredients list and claims [35]. To ensure identification of the most relevant products—predominantly cereal-based—packaged foods and beverages with more than 50% energy from carbohydrates were included in the analysis.
A total of 127 carbohydrate-based packaged food and beverage sub-categories in AFCD-1 were assessed. Several sub-categories in the database were similar in sampling and nutritional composition (e.g., “coconut, fresh, mature, water or juice” and “coconut, fresh, young or immature, water or juice”) and were merged, resulting in a revised total of 101 sub-categories, including 86 food sub-categories and 15 beverage sub-categories.
A total of 8390 carbohydrate-based packaged food and beverage products in the Mintel Database were assessed. These included products from Australia (Mintel Australia) and four Southeast Asian countries (Mintel Asia) during the period of January 2014–August 2019. Mintel Asia consisted of products from Malaysia, Singapore, Thailand and the Philippines.
All sub-categories from AFCD-1 and products from the Mintel Database assessed were classified into 12 food categories and 6 beverage categories (Table 1). Analyses on beverages were separated into ready-to-drink (RTD) and powdered beverages due to differences in nutrient declaration between the two categories (i.e., “per 100 g” for powdered beverages and “per 100 mL” for RTD beverages).

2.3. Proportion of Carbohydrate-Based Packaged Foods and Beverages Based on the Carbohydrate Metrics

The sub-categories from AFCD-1 were weighted by the number of products available on the market for each category using the Mintel Database and then assessed for whether they passed each of the three carbohydrate metrics.
The products from the Mintel Database were evaluated for their ability to meet each metric using their declared carbohydrates, dietary fibre and sugar content. As it is not mandatory for free sugars to be declared on packaging in these countries, the former was obtained through an imputation from the product’s total sugars content using a modified methodology adopted from Louie et al., 2015 [36] (Figure 1).
A product category was considered to have a high adherence to a metric if at least 40% of products in the category met its criteria (highest quartile of product categories), and moderate adherence to the metric if at least 20% but less than 40% of products in the category met its criteria. A product category was considered to have a low adherence to a metric if less than 20% of products met the metric.

2.4. Nutritional Quality of Carbohydrate-Based Packaged Foods and Beverages Based on the Carbohydrate Metrics

2.4.1. Evaluation of Product Nutritional Composition

The nutritional quality between foods and beverages that passed and failed each metric was first evaluated by comparing the level of nutrients.
For AFCD-1, this was carried out by using the energy, protein, total fat, saturated fat, trans fat, cholesterol, total sugar, free sugar, dietary fibre, sodium, calcium, potassium, iron, iodine, magnesium, zinc, selenium and vitamins A (retinol equivalent), E, B1, B2, B3, B6, B9 and B12 values of sub-categories from the database.
For the Mintel Database, the nutritional comparison between products that passed or failed each metric was assessed by using the declared energy, carbohydrates, protein, total fat, saturated fat, total sugar, dietary fibre and sodium content. An additional category-specific analysis was performed on categories that had the highest adherence to the metrics—hot cereals, cold cereals, cereal and fruit bars and breads (unfilled).
Due to large variations in serving size across the range of sub-categories and products assessed, all nutrient comparisons were conducted as per 100 g/100 mL of product.

2.4.2. Evaluation of Products against Nutrient Profiling Models

In addition to comparing individual nutrients, products from the Mintel Database were also evaluated against national nutrient profiling models specific to the region. Products from Mintel Australia were evaluated against the Food Standards Australia New Zealand Nutrient Profiling Score Criterion (NPSC) and the Australia New Zealand Health Star Rating (HSR). Products from Mintel Asia were assessed against NPSC, HSR and the Singapore Healthier Choice Symbol (HCS). Under the guidelines of the respective nutrient profiling models, a product is considered a nutritious product if it is within the category-specific score limit for the NPSC, ≥3.5 stars for the HSR or passed the HCS [37,38,39]. The fruits, vegetable, nut and legume content and whole grain content of products were required for this assessment; where undeclared, these values were imputed to complete this assessment.
This evaluation was not carried out for the AFCD-1 as the database is comprised of the nutrient composition of sub-categories and not individual products.

2.5. Proportion of Whole Grain Product Choices and Their Association with the Carbohydrate Metrics

As each carbohydrate metric stemmed from the carbohydrates and dietary fibre content of whole grains, the number of whole grain product choices from the Mintel Database (i.e., products that had whole grain claims or communication) were quantified. To determine if this was associated with the metrics, this parameter was compared with products that passed and failed each metric.

2.6. Comparison of Data from AFCD-1 and Mintel Australia

A qualitative comparison of product categories that met each metric from the two Australian databases (AFCD-1 and Mintel Australia) was carried out.
The imputed free sugars content used in the Mintel Database was compared against the free sugars content of sub-categories from the same product category in AFCD-1.

2.7. Statistical Analysis

Unequal variances t-tests were performed to analyse differences in nutritional composition between product sub-categories from AFCD-1 and products from the Mintel Database that passed and failed the metrics.
The Pearson’s chi-square test was conducted to determine significant associations between the carbohydrate metrics and whole grain product variants amongst products from the Mintel Database.
To validate that the free sugars estimation calculated for Mintel database using the modified Louie methodology was similar to that of AFCD-1, a paired two-tailed t-test was performed and the Nash–Sutcliffe efficiency (NSE) model coefficient was determined.
All statistical analyses were performed using Mintab 18 and Microsoft Excel 2016, and p < 0.05 was used as the criterion to determine statistical significance.

3. Results

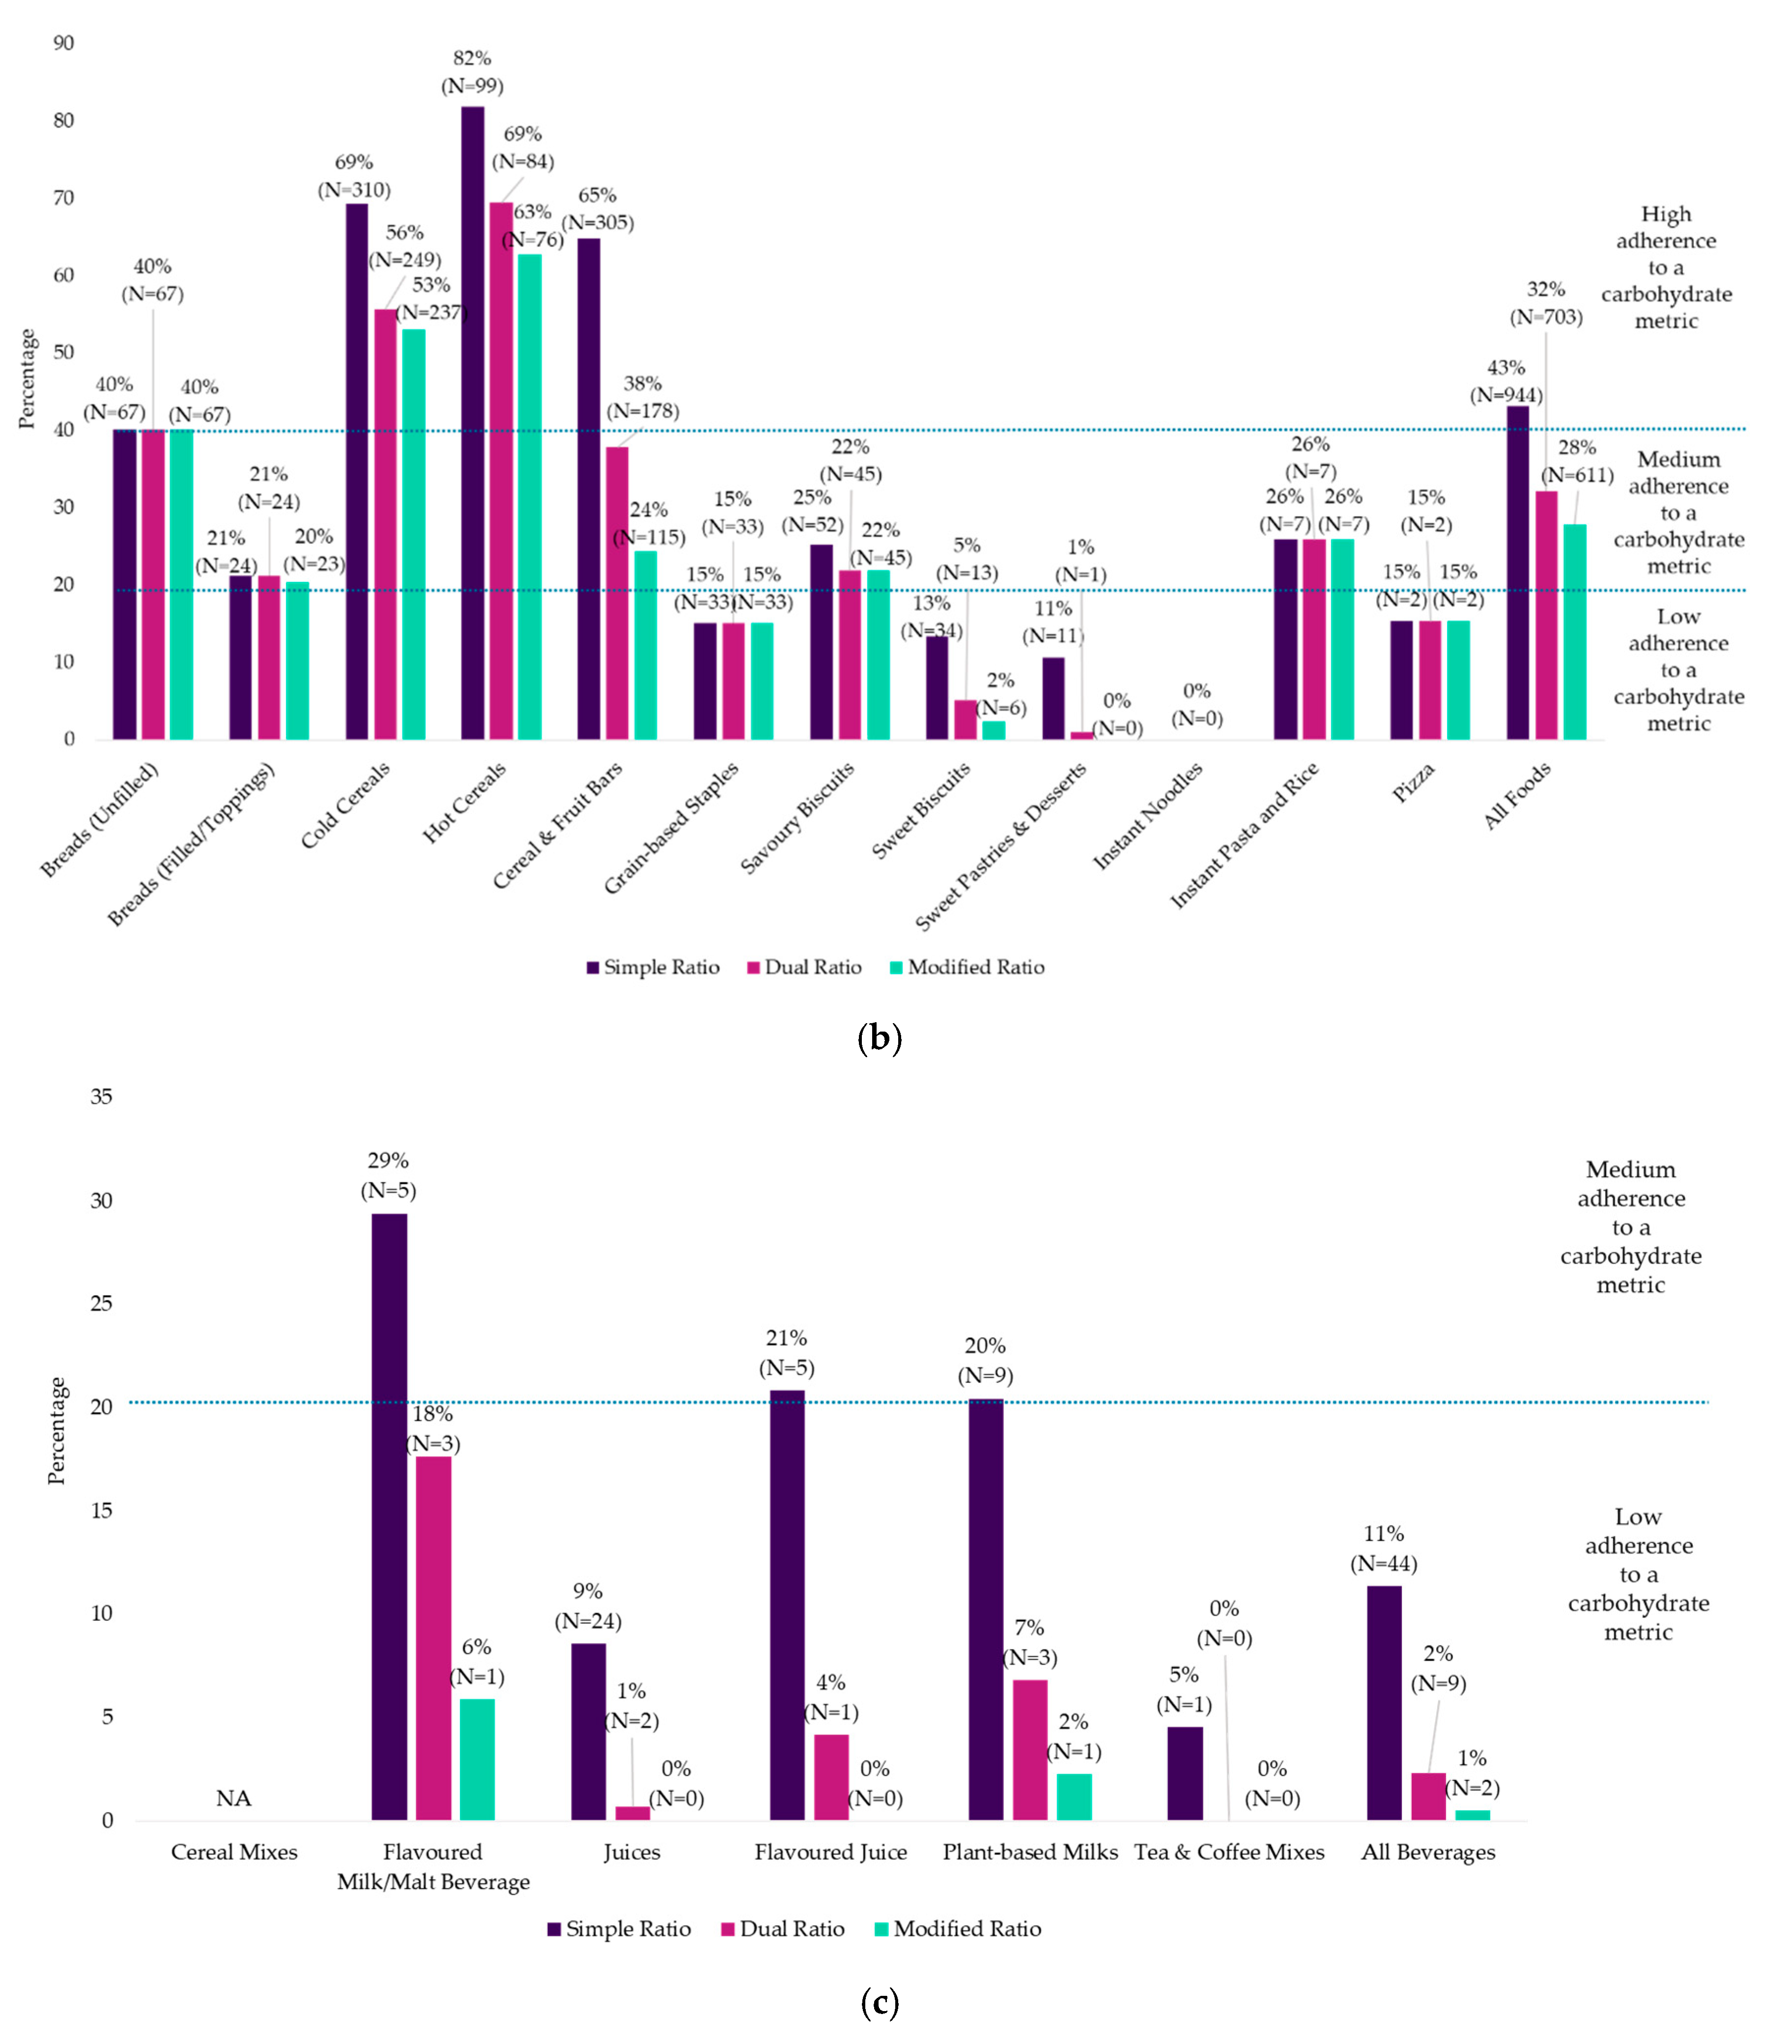
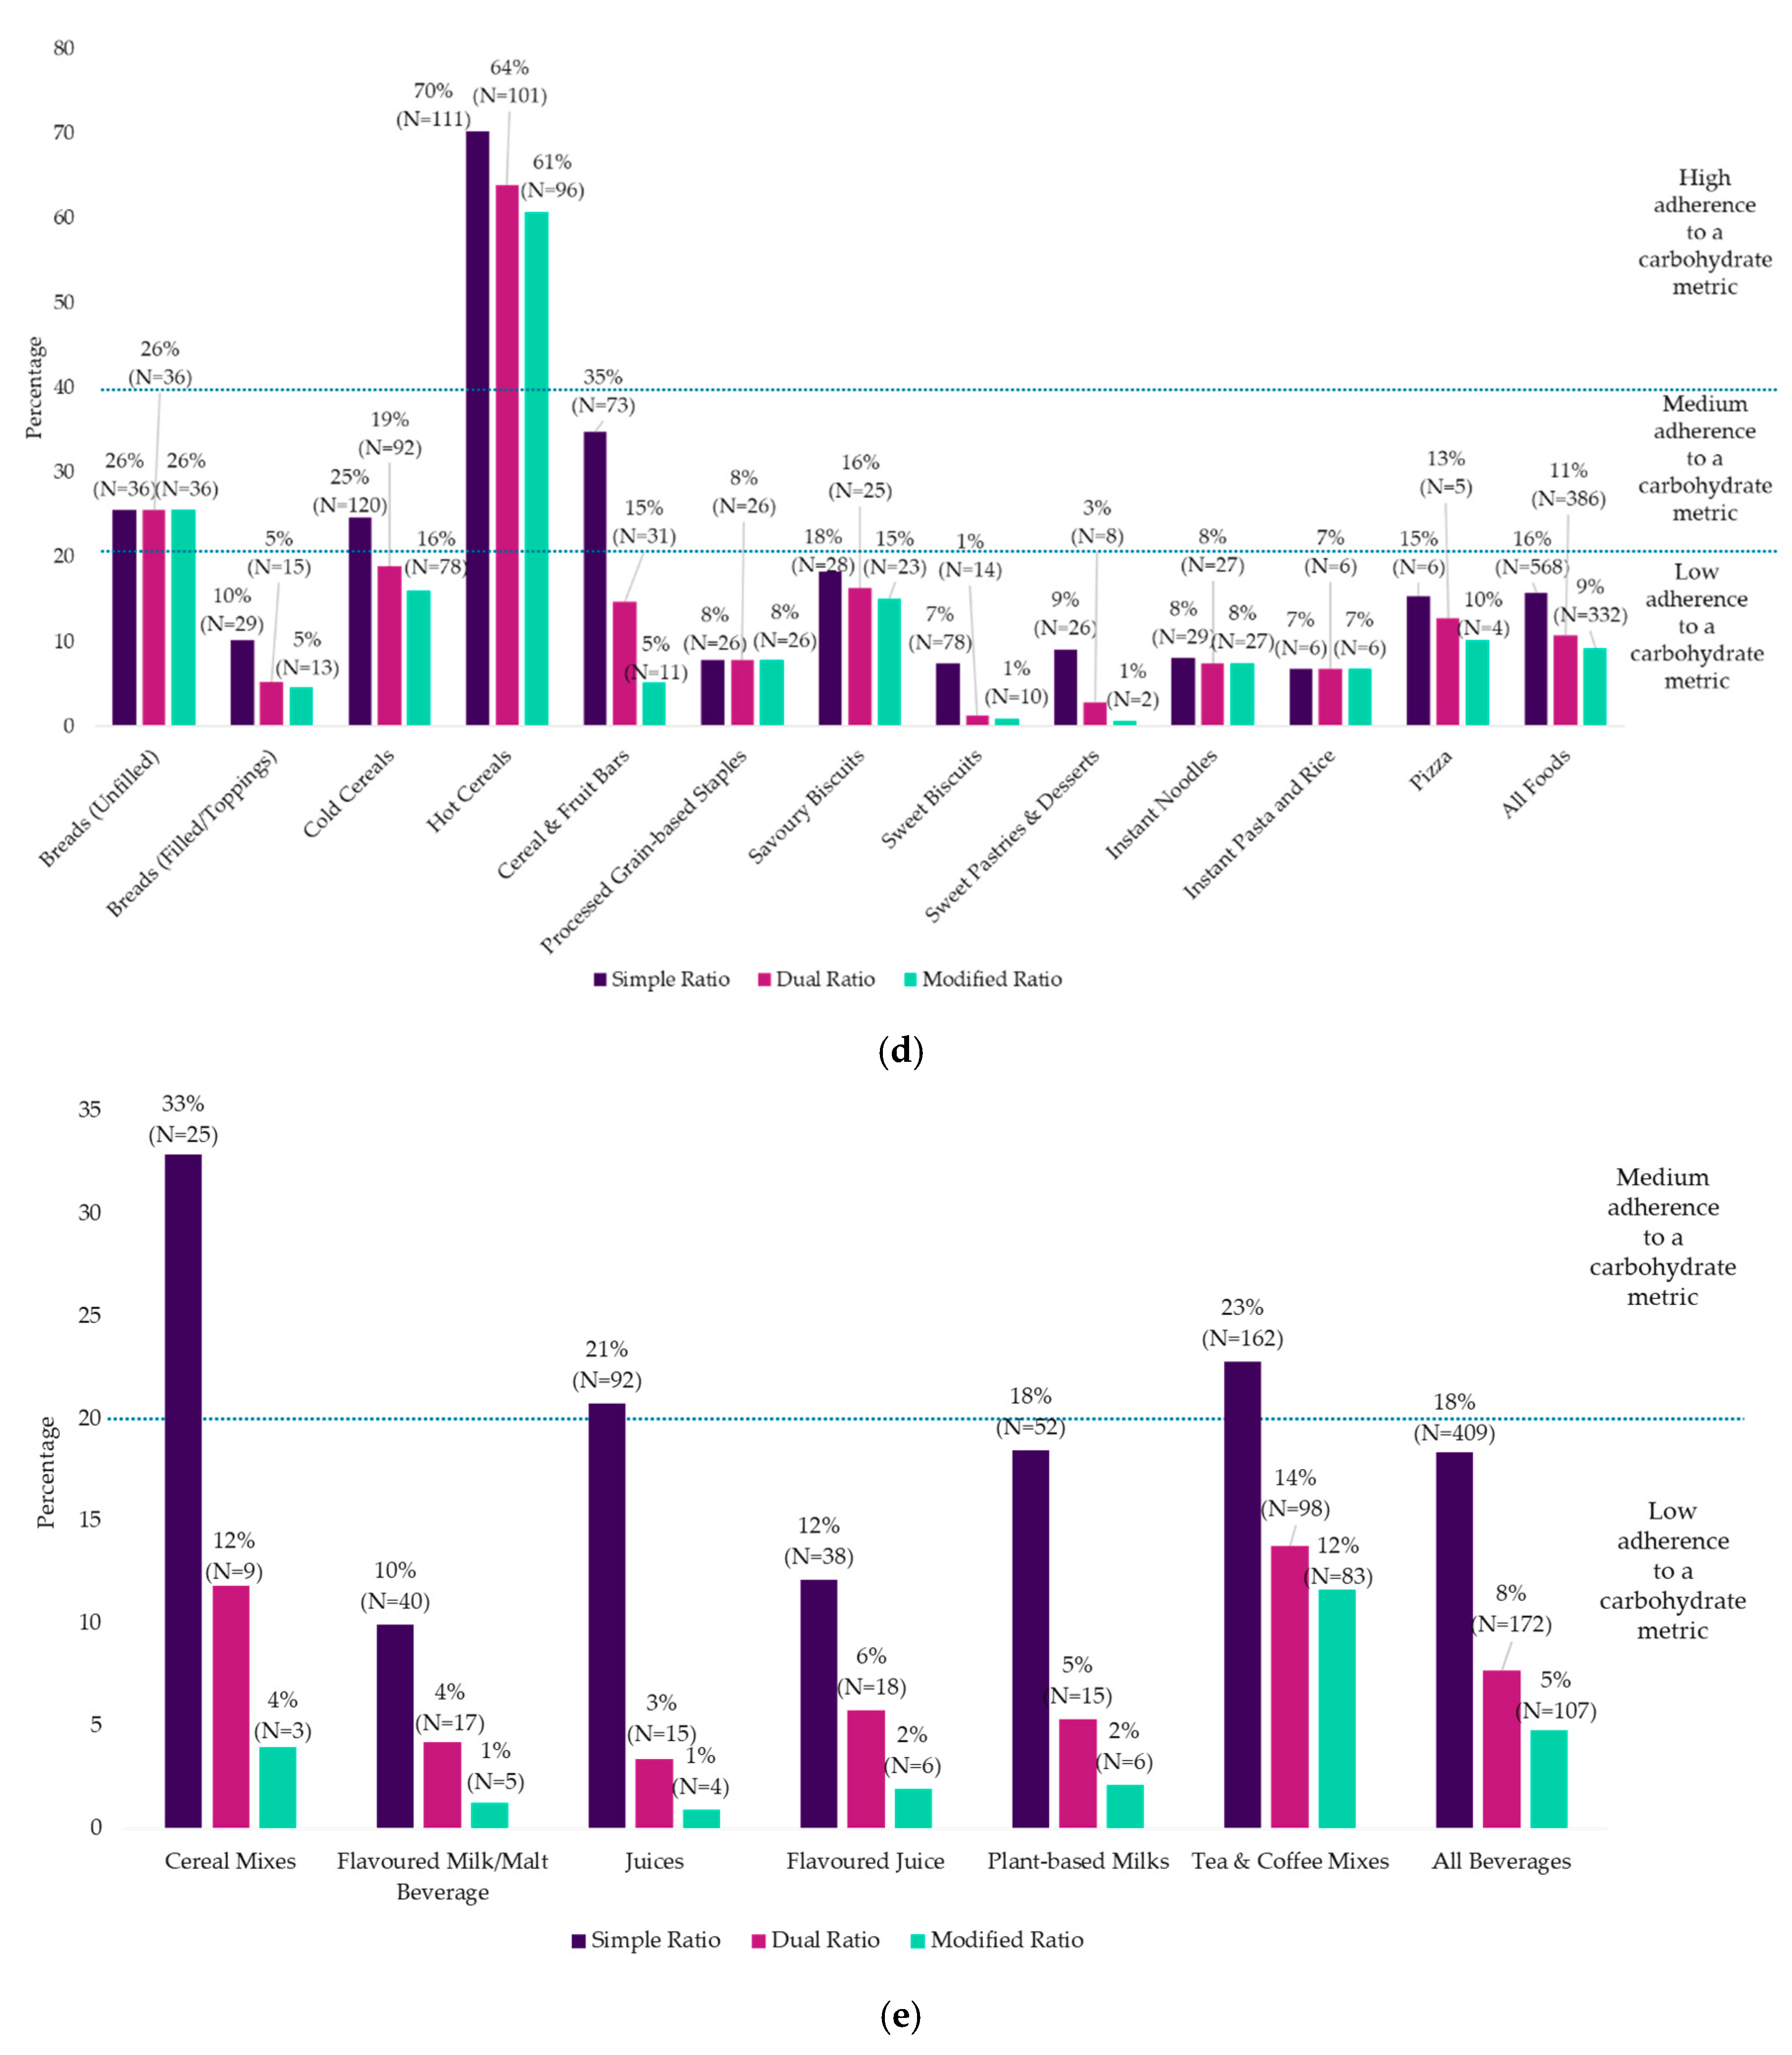
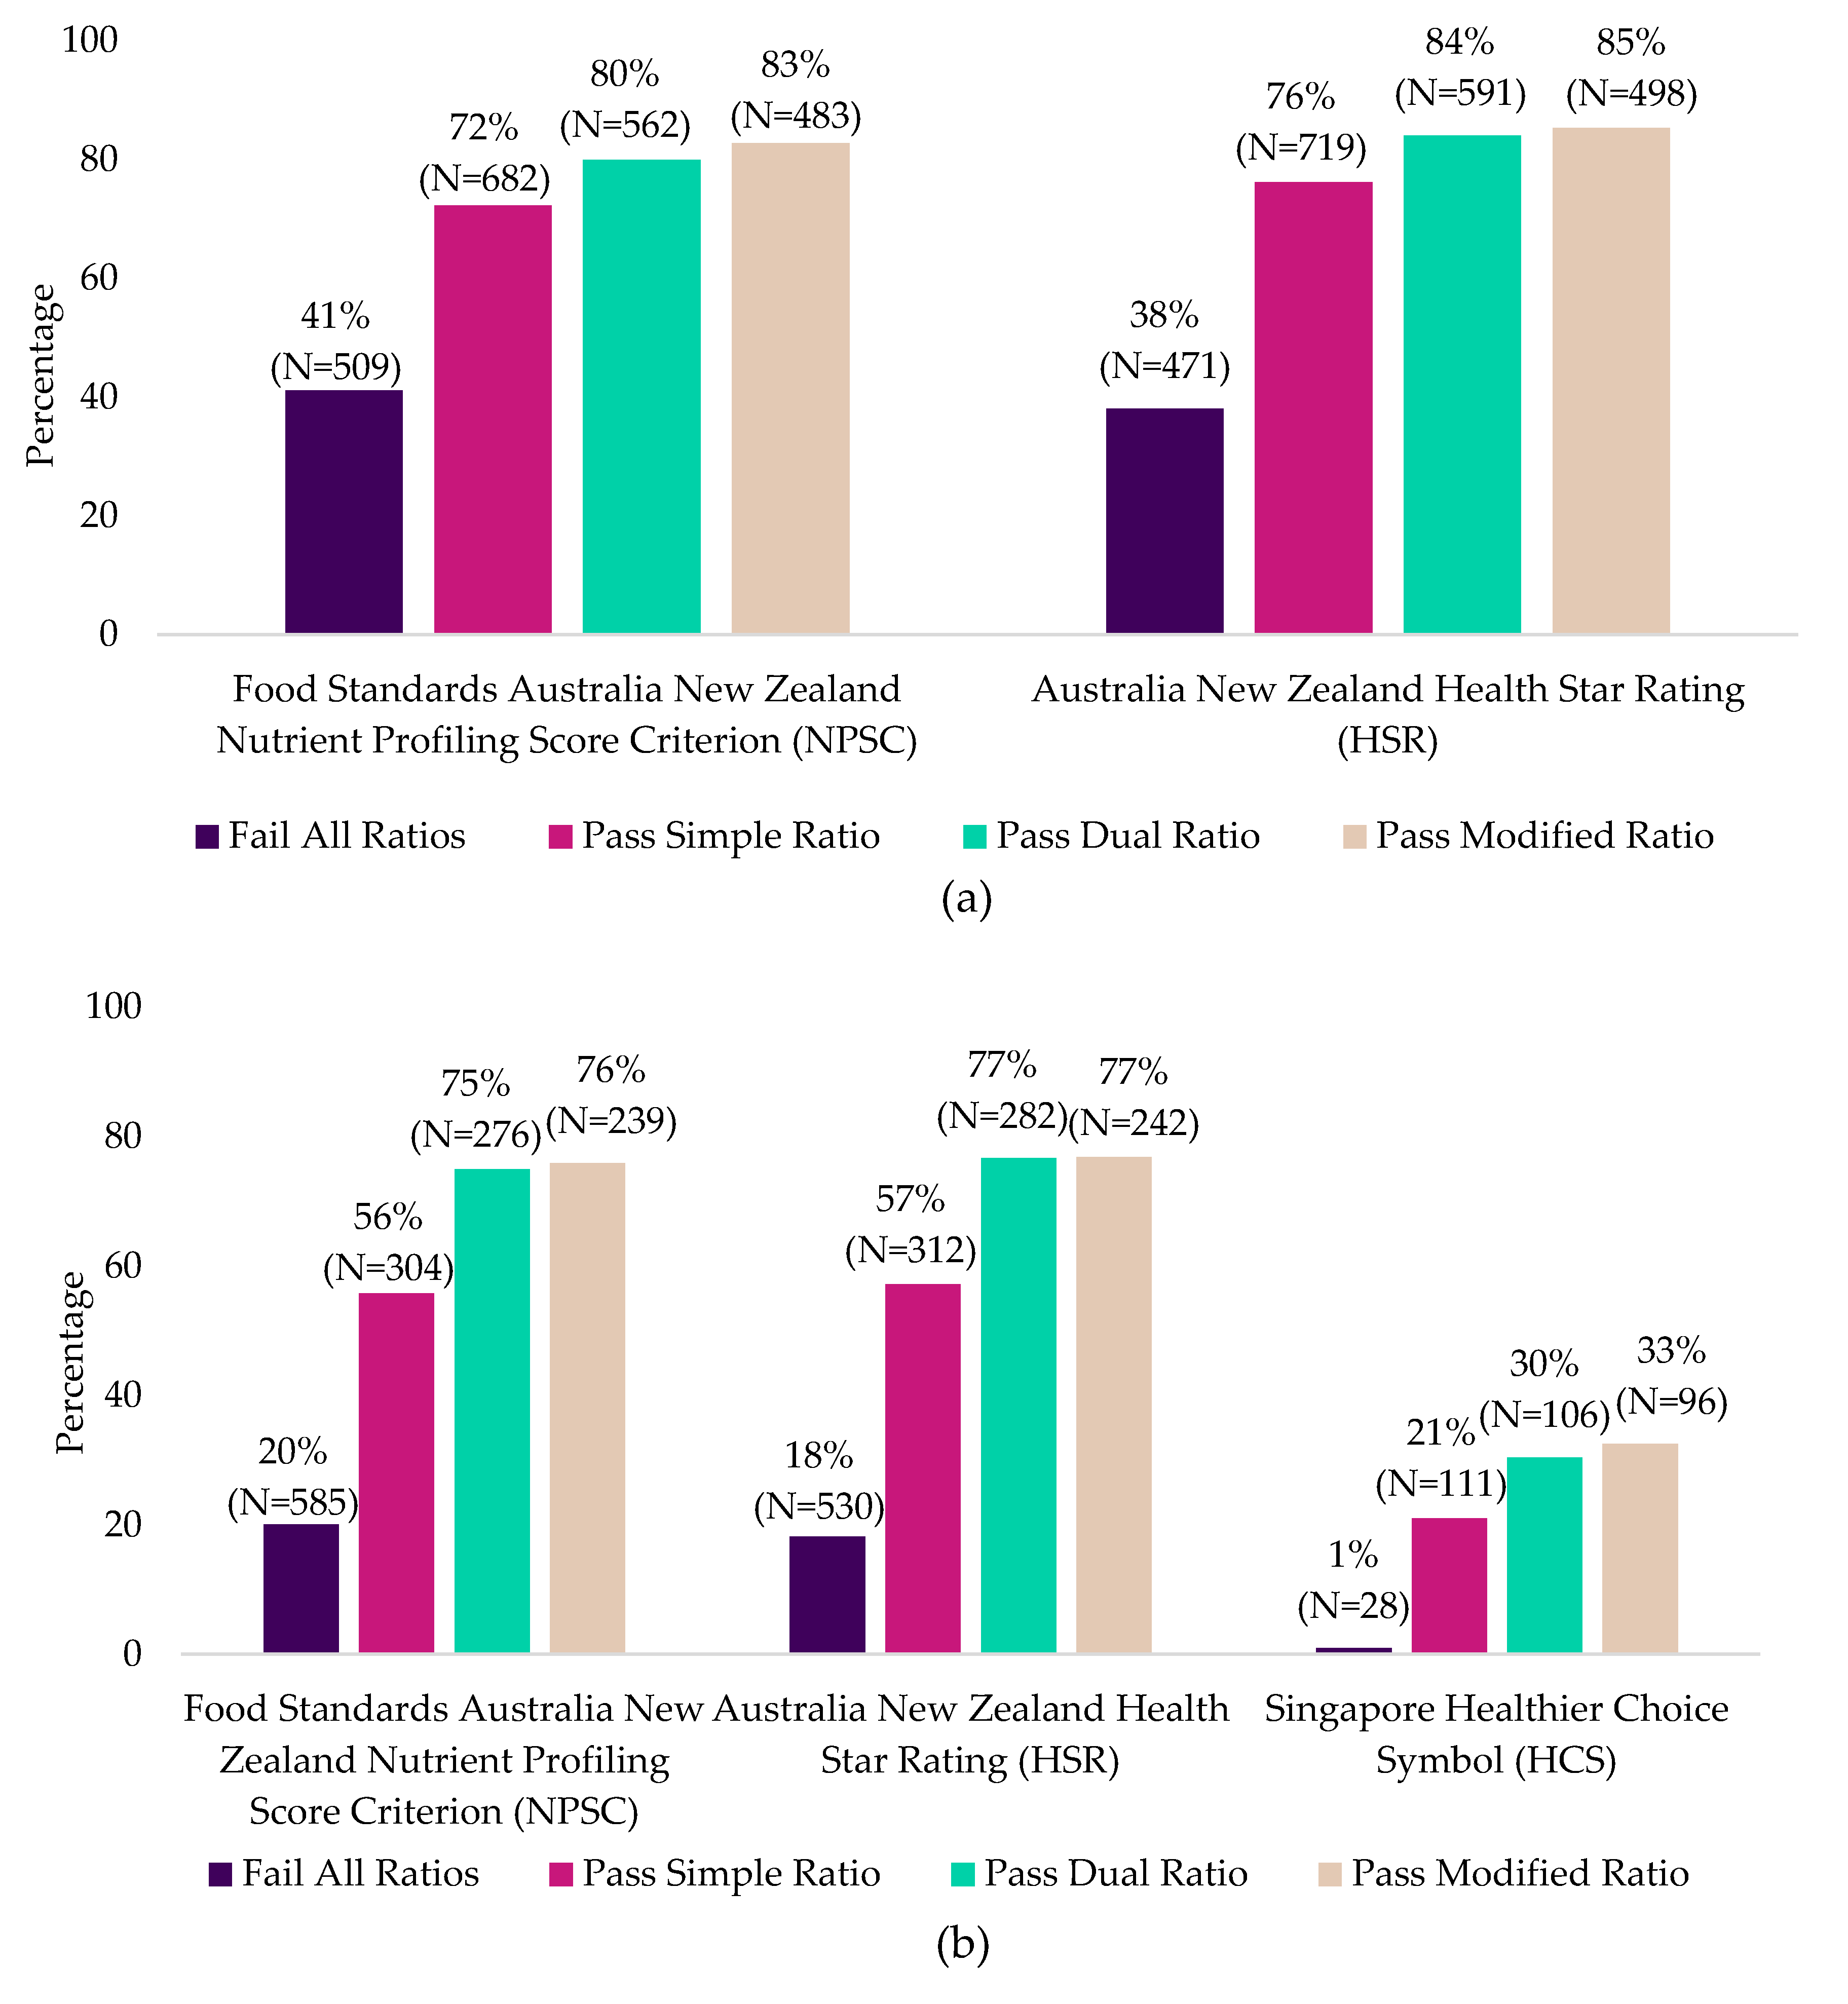
3.1. Proportion of Carbohydrate-Based Packaged Foods and Beverages Based on the Carbohydrate Metrics

In the AFCD-1, all food sub-categories that passed the simple ratio (32%) also passed the dual and modified ratios, whilst only one beverage sub-category passed the simple ratio (2%) and no beverage sub-categories passed the dual or modified ratio (Figure 2a).
When carbohydrate-based products from Mintel Australia were assessed, 43%, 32% and 28% of foods met the simple, dual and modified ratios, respectively, whilst only 11%, 2% and 1% of beverages met each of these metrics (Figure 2b,c). In Mintel Asia, 16%, 11% and 9% of foods and 18%, 8% and 5% of beverages met the simple ratio, dual ratio and modified ratio, respectively (Figure 2d,e).
From the Mintel Database, foods that were predominantly cereal-based had the highest adherence to all metrics, in particular, hot cereals, cold cereals, breads (unfilled) and cereal and fruit bars. None of the beverage categories had a high adherence to any metric, though various beverage categories had a moderate adherence to the simple ratio in selected countries (Figure 2c,e). There was a considerable drop in adherence to the metrics when free sugars were taken into consideration (i.e., dual and modified ratios) and this was primarily due to the major decline in the proportion of cereal and fruit bars and beverages meeting these metrics. However, cereal and fruit bars still had a moderate adherence to the dual ratio (38%) and modified ratio (24%) in Australia. When free sugars were taken into account, then all beverage categories had a low adherence to any metric in any database.
When comparing the range products from the Mintel Database assessed across the five countries, Australia was found to have the largest proportion of products that met the metrics (approximately two times more) compared to Southeast Asian countries (Figure 3).

3.2. Nutritional Quality of Carbohydrate-Based Packaged Foods and Beverages Based on the Carbohydrate Metrics

3.2.1. Comparison of the Nutritional Composition between Carbohydrate-Based Packaged Foods

From the assessment of products from AFCD-1, foods that met all metrics had significantly higher levels of dietary fibre (+264%), protein (+34%), iron (+122%), magnesium (+220%), potassium (+101%), zinc (+106%), selenium (+43%), vitamins B1 (+152%), B3 (+137%) and B9 (+111%) and lower levels of total sugars (−58%), free sugars (−78%) saturated fat (−76%), trans fat (−88%) and cholesterol (−100%) content compared to foods that did not meet any metric (Table 2). However, these products also had significantly lower levels of Vitamin A (−98%) and B12 (−91%).
Foods from Mintel Australia that met the dual and modified ratios were found to have a significantly greater fibre (+167% and +124%, respectively) and protein content (+35% and +30%, respectively) and a lower total energy (−4% and −6%, respectively), total sugars (−23% and −26%, respectively), free sugars (−65% and −80%, respectively) and saturated fat (−34% and −40%, respectively) content compared to foods that did not pass any metric (Table 3).
In the analysis of products from Mintel Asia, foods that passed the simple, dual and modified ratios all had a higher dietary fibre (+246%, +236% and +211%, respectively) and protein content (+27%, +37% and +40%, respectively), in addition to a reduced energy (−7%, −11% and −11%, respectively), total sugar (−33%, −60% and −68%, respectively), free sugar (−43%, −76% and −87%, respectively), total fat (−14%, −28% and −29%, respectively), saturated fat (−34%, −53% and −54%, respectively) and sodium (−76%, −75% and −73%, respectively) content compared to foods that did not pass the ratio (Table 4).
When a category-specific analysis of hot cereals, cold cereals, cereal and fruit bars and breads (unfilled) was performed, products that met all the ratios had better levels of positive nutrients and lower levels of negative nutrients (Table S1). This is with the exception of a higher saturated fat content in cold cereals that met the simple (+53%), dual (+37%) and modified (+38%) ratios, and a higher total sugars (+18%) content in the cereal and fruit bars that met the modified ratio.

3.2.2. Comparison of the Nutritional Composition between Carbohydrate-Based Packaged Beverages

An assessment from Mintel Australia showed that RTD beverages that passed the simple ratio had a lower energy (−20%), total sugars (−40%), and free sugars content (−41%), as well as a greater dietary fibre (+295%) and protein (+51%) content compared to products that failed (Table 3). However, they also had a higher sodium content (+167%).
The analysis of RTD beverages from Mintel Asia found that products that met the simple and dual ratio had a lower total energy (−13% and −19%, respectively), total sugar (−28% and −52%, respectively) and free sugar (−23% and −52%, respectively) content, as well as a greater dietary fibre (+855% and +711%, respectively) content. In addition, RTD beverages that passed the simple ratio also had a lower fat (−26%) and saturated fat (−37%) content. However, RTD beverages that passed the dual ratio had a lower protein (+26%) content (Table 4).
The analysis of powdered beverages from Mintel Asia found that products that passed any metric had a lower total sugar (−46%, −80% and −86%, respectively) and free sugar (−44%, −79% and −86%, respectively) content, as well as a greater dietary fibre (+347%, +305% and +261%, respectively) and protein (+22%, +28% and +24%, respectively) content. Powdered beverages that passed the simple ratio also had a lower energy (−2%) and sodium (−17%) content. However, powdered beverages that passed the dual and modified ratio had a higher saturated fat content (+23% and +24%, respectively) (Table 4).

3.2.3. Evaluation of Products from Mintel Database against Nutrient Profiling Models

In Mintel Australia, a greater proportion of foods that passed any carbohydrate metric also met the NPSC and HSR as a nutritious food (72–85%) compared to foods that did not (38–41%) (Figure 4a). Similarly, in Mintel Asia, a higher proportion of foods that passed any carbohydrate metric also met the NPSC, HSR and HCS as a nutritious food (21–77%) compared to foods that did not (1–20%) (Figure 4b).
When beverages were compared against the national nutrient profiling models, there were mixed results. More RTD beverages from Mintel Australia that passed the simple ratio also passed the NPSC criteria (98%), compared to products that failed (88%). However, fewer RTD beverages that passed the simple ratio passed the HSR criteria (78%), compared to products that failed the ratio (81%) (Figure 5a). RTD beverages from Mintel Asia that met any metric were more likely to meet the criteria for the three nutrient profiling models as a nutritious product (50–78%), compared to products that failed (33–44%). Similarly, powdered beverages from Mintel Asia that passed the three metrics were more likely to meet the criteria of the three nutrient profiling models as a nutritious product (2–70%) compared to products that failed all metrics (1–16%) (Figure 5b,c).

3.3. Proportion of Whole Grain Product Choices and Their Association with the Carbohydrate Metrics

There was a greater proportion of whole grain food choices from Mintel Australia (31.6%) compared to Mintel Asia (18.8%). There were very few whole grain beverage choices in both Mintel Australia (1.6%) and Mintel Asia (3.7%) (Table S2).
When foods from the Mintel Database were analysed, there was a significant association between adherence to the three metrics and availability of whole grain product variants (p < 0.001) (Table S3). When beverages from the Mintel Database were analysed, there was also a significant association between adherence to the simple and dual metrics and the availability of whole grain product variants (p < 0.001). However, this was no longer observed with the modified ratio (p = 0.070) (Table S4).

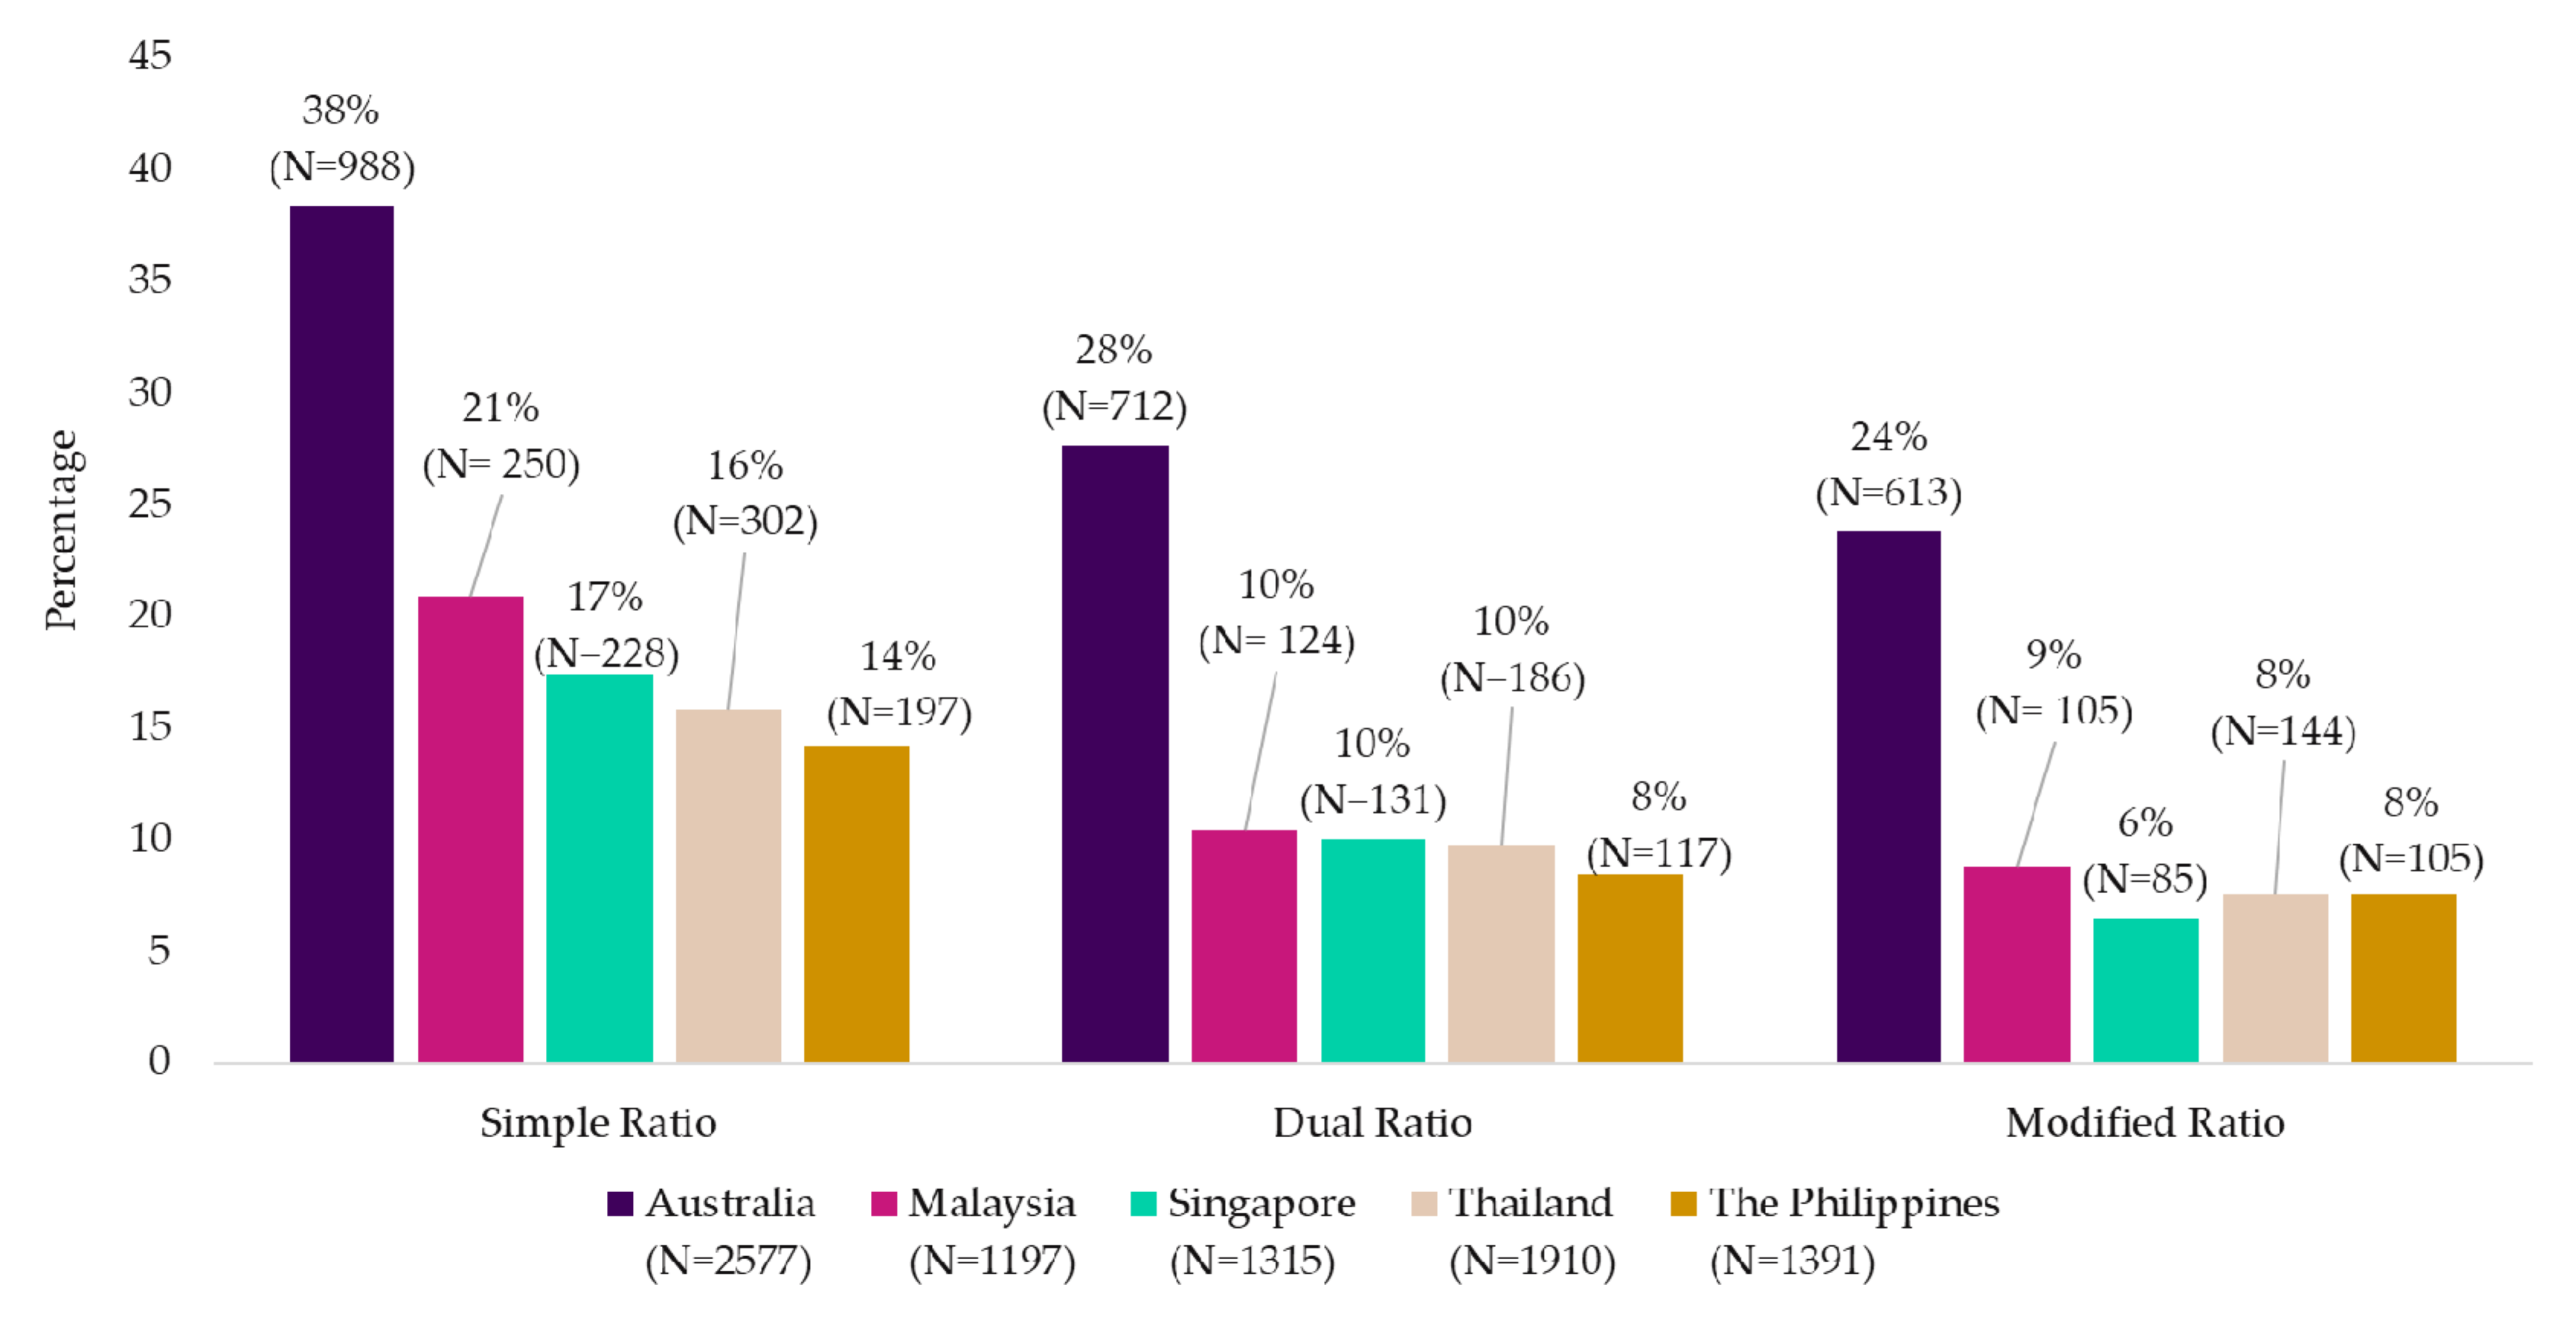
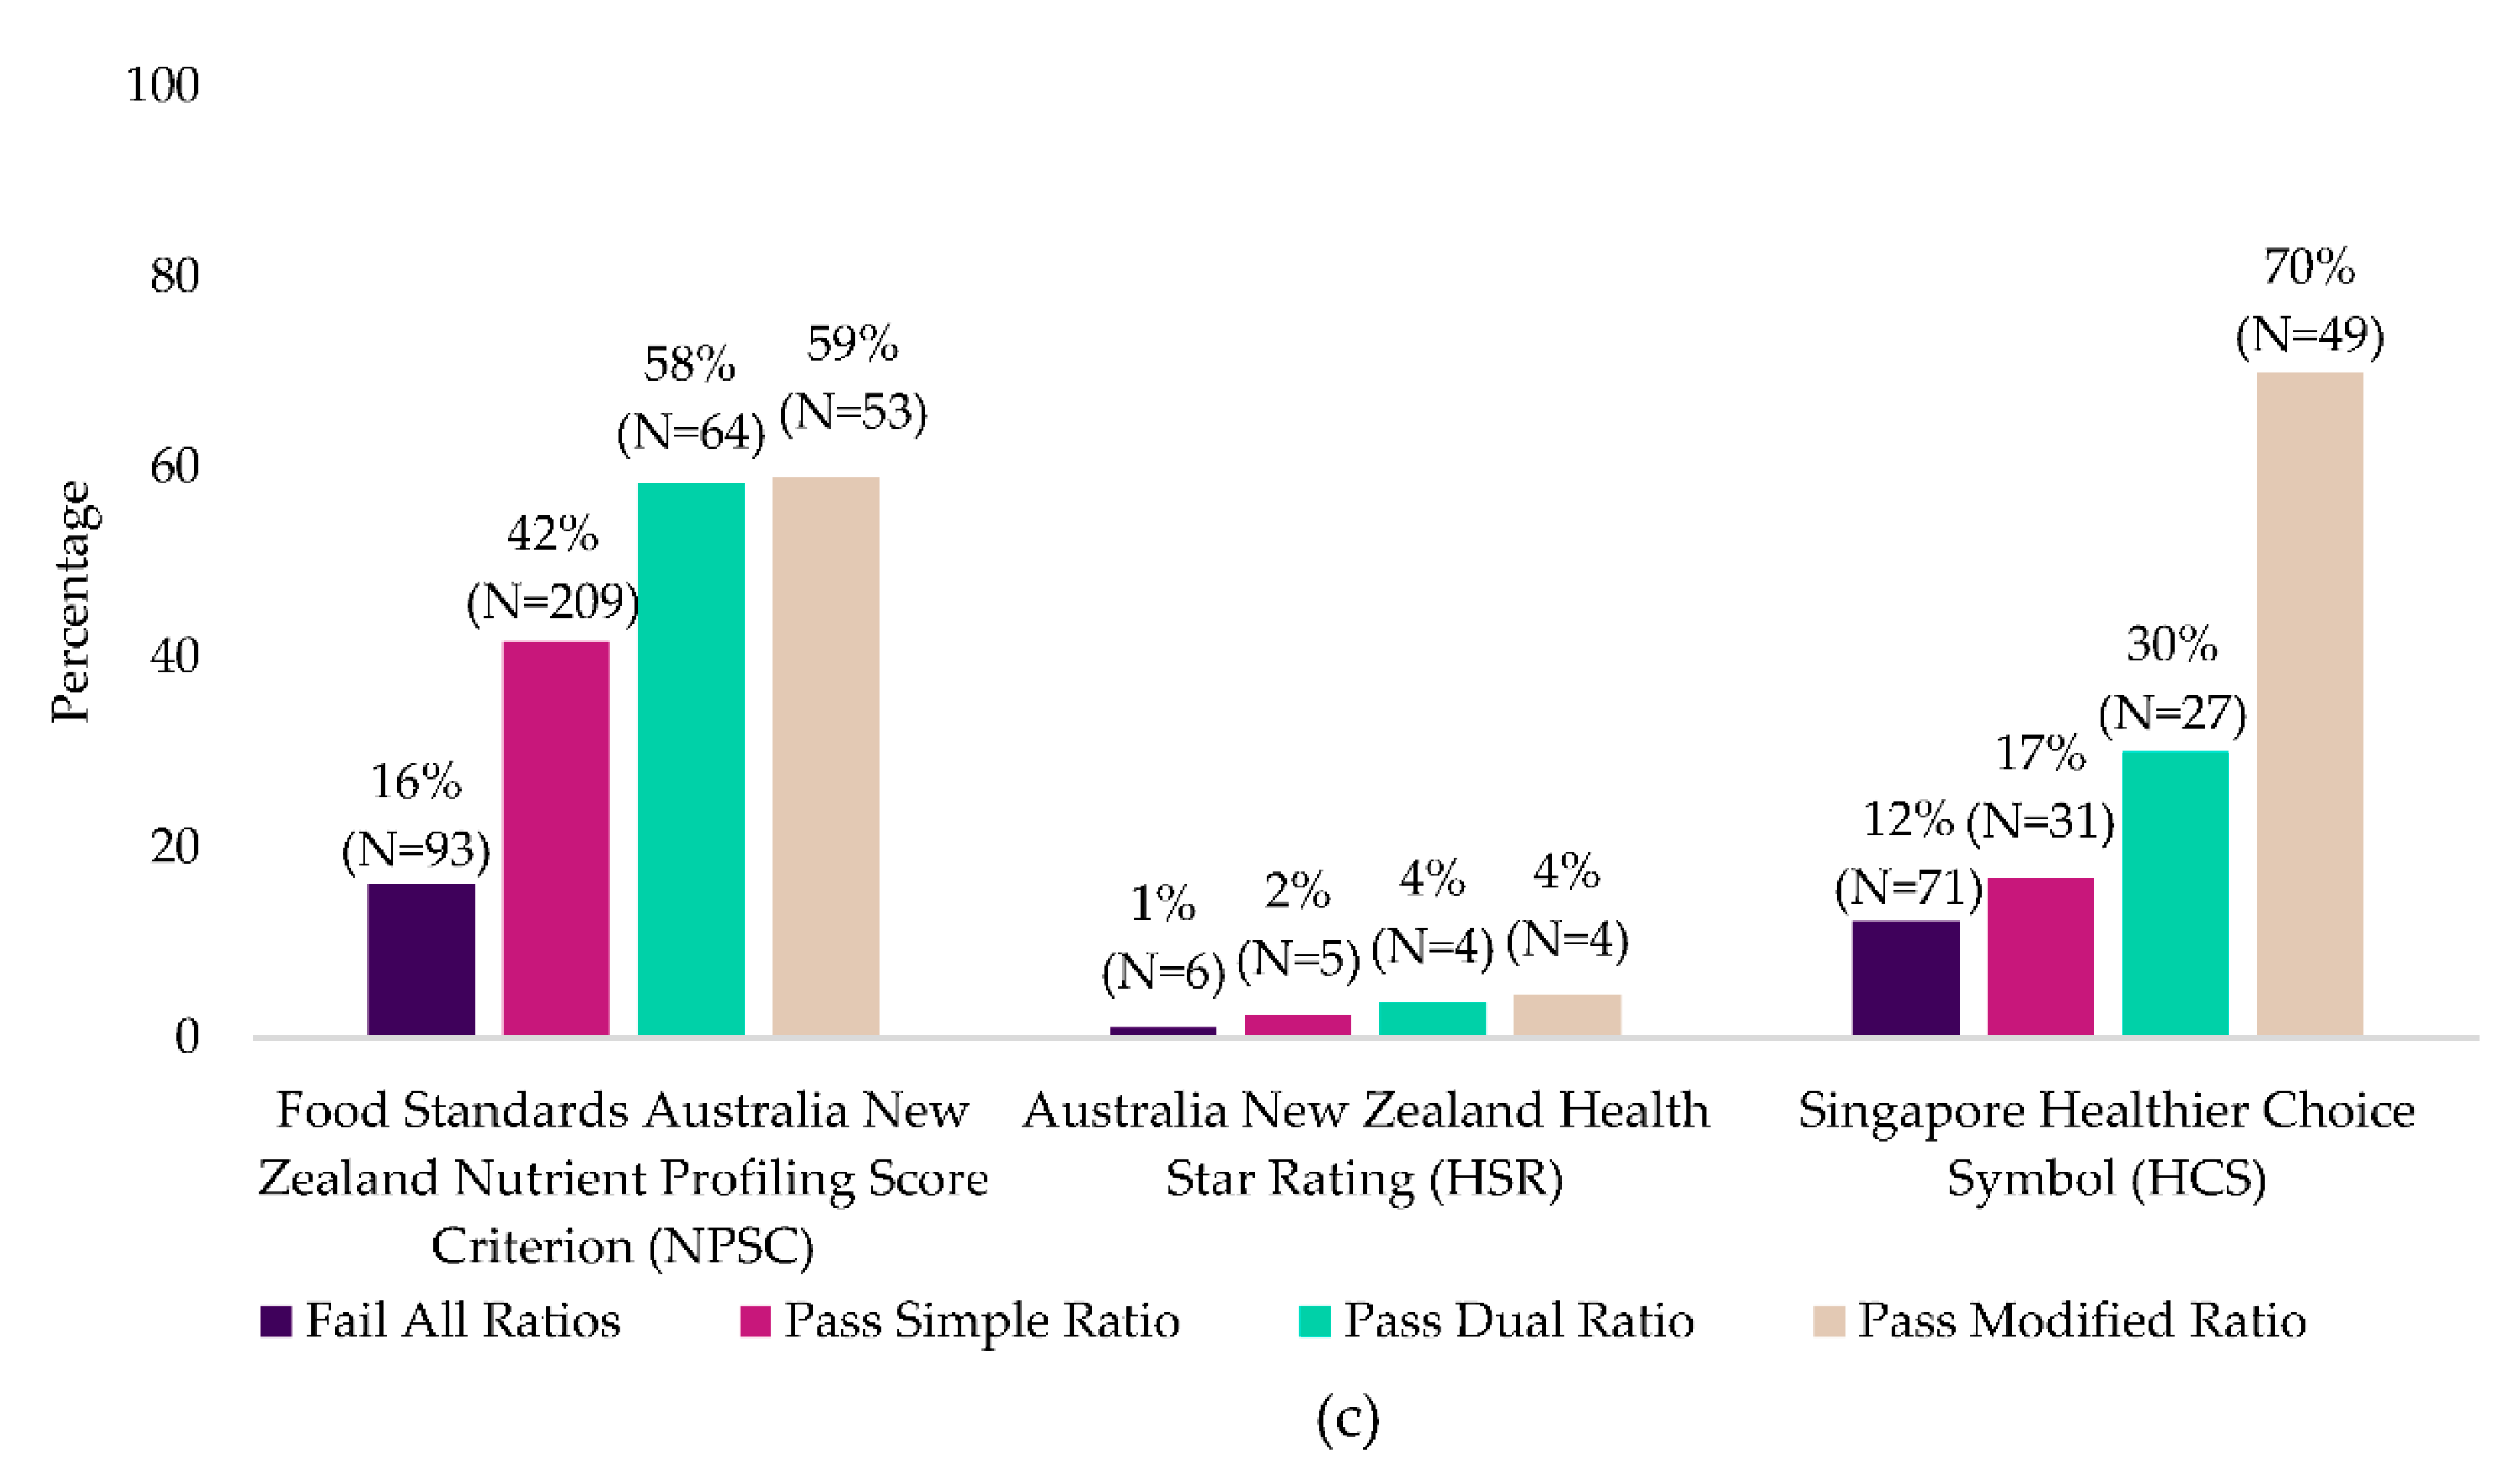
3.4. Comparison of Data from AFCD-1 and Mintel Australia

A comparison of products sold in Australia between the two databases showed similar results, whereby breads (unfilled), cold cereal and hot cereal had a high adherence and savoury biscuits had a moderate adherence to all of the metrics (Figure 2a,b). Several differences were observed, including cereal and fruit bars to be of high adherence to the simple ratio, and moderate adherence to the dual and modified ratios in Mintel Australia but not in AFCD-1. This is due to the absence of several types of cereal and fruit bars from the AFCD-1 (e.g., cold press bars, meal replacement bars). Additionally, instant pasta and rice had a moderate adherence to all three metrics in Mintel Australia but not in AFCD-1, potentially because the product sampling for AFCD-1 was older.
Figure S1 shows the mean free sugars content of products within a sub-category from Mintel Australia versus the free sugars content of the same sub-category from AFCD-1. The two-tailed t-test conducted showed that there was no significant difference between the free sugars content imputed for the Mintel Database and the free sugars content of the respective product sub-categories in the AFCD-1 (p = 0.33). The NSE coefficient of the imputation was analysed to be 0.83. These results verify the concurrency of the free sugars content used in the analysis of products from both databases.

4. Discussion

In this study, the adherence of carbohydrate-based packaged foods and beverages to three variations of the carbohydrate metrics characterised by ratios of total carbohydrates, dietary fibre and/or free sugars was examined. Products that met the metrics were generally of a higher nutritional quality and this applied to all countries. Australia had the highest overall number of products meeting all metrics, with twice as many products compared to the Southeast Asian countries. Foods that were predominantly cereal-based had the highest adherence to all metrics, whilst beverages had a relatively low adherence to all metrics compared to foods.
Previous studies point to the fact that the carbohydrate metrics reflected by similar ratios of total carbohydrates, dietary fibre and/or free sugars may be associated with multiple benefits, as they may help identify more nutritious products [27,28], or improve diet quality [23], thus contributing to chronic disease reduction when calculated on a diet level [6,19]. Findings of the current analysis are consistent with these studies, showing that packaged foods from Southeast Asia and Australia that met the carbohydrate metrics reported a higher nutritional quality, having higher levels of health-promoting nutrients (e.g., dietary fibre, protein, various vitamins and minerals) and lower levels of nutrients of public health concern (e.g., calories, free sugars, trans fat, cholesterol). This is reinforced by the metrics’ alignment with the various national nutrient profiling models to identify nutritious foods and beverages.
Cereal-based foods, which are more likely to contain whole grains or cereal fibres, had the highest adherence to the metrics. In addition to being a good source of dietary fibre, whole grains are also rich in minerals, vitamins, antioxidants, phytochemicals and other micronutrients that have been linked to disease prevention [40,41], alluding to the higher nutrient density of foods that passed the metrics. However, the presence of whole grains or whole grain communication on a product alone does not necessarily reflect a superior nutritional quality as identified by Mozaffarian et al., who found a higher energy and sugar content in these products in the USA [17]. In some countries (e.g., Singapore), whole grain claims can only be made on the packaging if nutrients of public health concern (e.g., sugar or saturated fat) are within a stipulated threshold [39], ensuring the product’s overall nutritional quality. This discrepancy in results highlights the value of specifying other important nutrient criteria to support content claims such as "high in whole grains".
There were several concessions and interesting findings to the conclusion that foods meeting the metrics were of a higher nutritional quality. In the AFCD-1, foods that passed the metrics had a lower Vitamin A (retinol equivalent) and B12 content. This is likely because cereal-based products in Australia (e.g., cold cereals) are not fortified with these vitamins [42], and the range of product categories that passed the metrics also had a lower content of animal-derived (e.g., liver, fish oils) and carotenoids-rich (e.g., carrots, tomatoes) ingredients, which are rich sources of these vitamins [43]. In the assessment of the Mintel Database, there was occasionally a higher total fat content found in several food categories that passed the metrics. This was due to differences in macronutrient proportion, with products passing the metrics containing fewer total carbohydrates, but more protein and fat in general. While a modest increase in protein content can be nutritionally beneficial [44,45,46], it is important to ensure that the higher fat content does not translate to a greater saturated fat, trans fat, cholesterol or energy content as excessive consumption is associated with metabolic syndrome [47]. Nevertheless, such an occurrence was rarely observed in this study or the analysis of products in the USA [27].
Beverages had a relatively low adherence to all metrics compared to solid foods and were a key category responsible for the steep drop in adherence to the dual and modified metrics when free sugars were taken into consideration. This further highlights previous findings that beverages are a potential source of added and/or free sugars intake in Australia and Southeast Asia [48,49,50,51]. The low adherence to the ratio is specifically due to the intrinsic nature of beverages, causing formulation challenges by removing sugars and incorporating fibres. Most carbohydrates need to be solubilised for the beverage to be palatable and sugars are the most soluble form of carbohydrates [52]. Product formulation is further complicated when dietary fibres are taken into consideration as the former brings in solubility, viscosity and stability challenges [53].
Despite such technical challenges, the simple ratio was able to select nutritionally superior beverages in Australia and Southeast Asia, though it is less clear if the dual and modified ratios selected products of a higher nutritional quality. Beverages that passed the dual and modified ratios were more likely to be low or no sugar beverage variants. Recent governmental and non-governmental pressure on food manufacturers to reduce sugar in beverages may have prompted the growth of such products in the market [54,55,56]. In low or no sugar variants, soluble fibres (e.g., inulin, resistant dextrins) are commonly used in place of sugar to help compensate for the loss of bulk, mouthfeel and stability brought to beverages by sugar [52]. Unlike whole grains, such isolated or synthetic fibre-based ingredients do not bring an added nutritional value beyond its dietary fibre content. Hence, food manufacturers can consider using cereal processing methods (e.g., extrusion, fermentation) to improve formulation of high cereal-fibre beverages [57,58,59,60,61]. Such technologies may improve the palatability of high fibre cereals (e.g., cereal bran or whole grain) in beverages, yet retain the ingredient’s fibre integrity and nutrient density. Given the product category limitations today, from a practical perspective, the simple ratio may be the most relevant metric for identifying beverages with a higher nutritional quality.
These findings are important as studies have reported an increase in consumption of packaged foods and beverages in these countries [25,62,63,64]. Such products have been highlighted to be responsible for the reduced fibre intake and increased sugar, saturated fat and sodium consumption [62,65]. In Southeast Asia, sweetened beverages were identified to be the primary malefactor of sugar intake in the Philippines and Thailand, whilst dried processed foods (e.g., instant noodles) were the main contributors of negative nutrients in Malaysia and Singapore [66]. In Australia, packaged foods and beverages made up 65% of total energy intake and were the major source of free sugar intake [67].
There were noteworthy differences observed between countries. Twice the proportion of carbohydrate-based products in Australia met the three metrics compared to the Southeast Asian countries assessed. A possible explanation for this may be the more mature nutrition education program and food labelling regulation in Australia compared to Southeast Asia, allowing both the food industry and population to adapt to healthier foods and the recommendations. For instance, with the exception of Singapore, a front-of-pack labelling system for consumers to identify nutritious variants of products was implemented much earlier in Australia (the HSR scheme) compared to the Southeast Asian countries, which implemented variations of healthier choice schemes only recently [68,69,70,71,72]. Strong governmental and non-governmental advocacy against discretionary food have also compelled food manufacturers to accelerate reformulation of healthier alternatives in Australia [16,73,74,75,76]. Notwithstanding this hypothesis, the key contributing factor likely to account for the large disproportion between these two culturally different regions is the lower availability of whole grain product choices in these Asian countries compared to Australia. This is potentially because whole grain foods are not part of the local eating culture [77], leading to a lower whole grain consumption in Southeast Asia [78,79,80,81,82]. Recent health promotion efforts to increase awareness of the nutritional value of whole grains may increase its intake in these Asian countries in the coming years [78]. Fewer beverages in Australia also passed the dual and modified ratios compared to beverages in Southeast Asia, potentially due to newly instated sugar tax in Thailand, the Philippines and, more recently, Malaysia, which is mostly targeted at beverages [54,55]. It would be of public health interest to monitor the evolution of the overall nutritional quality of these products to validate the effectiveness of these measures to improve the holistic nutritional profile.
As introduced, there are other indices of carbohydrate quality used by the public health sector, scientific community and food industry. The benefits of the carbohydrate metrics over whole grain claims were addressed above, and common single nutrient content claims such as “high in fibre” or “low in sugar” share a similar limitation whereby a holistic understanding of a product’s nutritional quality might be overlooked [83,84,85]. The GI and glycaemic load (GL) system is one of the more notable measures of carbohydrate quality. When comparing the carbohydrate metrics against this as a measure of overall nutritional quality, both systems were found to have their merits and shortcomings. The GI and GL of diets are predictive of T2DM and heart disease risk [10,11,12,86]. However, Goff and team found that low GI diets were only effective against cardiovascular disease when it had sufficient fibre [87], the principal criteria of the carbohydrate metrics. As described earlier, there is a limited understanding and use of the GI and GL system due to its complexity [13], and the inter-subject and even intra-subject day-to-day variability observed during clinical testing limits its reliability [88,89]. This has led to a lack of consensus amongst the scientific community on its practical use as a measure of nutritional quality [7,11,88,89,90] and inconsistent global legislative advice of its application for product communication [13,91,92,93]. Nevertheless, future studies are required to compare the effectiveness of the carbohydrate metrics, whole grain content and GI as measures of nutritional quality and a means of nutrition communication to evaluate how the different approaches can be complementary to each other.
An advantage of the carbohydrate metric is that it provides a straightforward means to assess nutritional quality based on nutritional content. However, labelling regulations across countries are an important consideration for its implementation. Carbohydrates are declared as available carbohydrates (e.g., Australia) in some countries and the declaration of added/free sugars is not compulsory in most countries, including the countries assessed in this paper [94,95]. This may add confusion to consumer understanding of the carbohydrate metrics. On the other hand, the metric does present an opportunity to increase awareness of the importance of these nutrients, helping consumers select carbohydrate-rich products of a higher nutritional quality, as diets with a high dietary fibre, high whole grain and low free sugar intake have all been associated with a reduction in risk to several chronic diseases [7,21,22,79]. A potential limitation of the metric is its inability to indisputably account for the amount of readily digestible starches in a product [27]. High intakes of refined carbohydrates contribute to metabolic syndrome and an increased risk to its associated diseases [86,96]. However, the fact that the metric has set a minimum for the dietary fibre content in relation to the total carbohydrates content allows it to partially control for this, as the simple ratio criteria effectively selects for less refined whole grain variants of starch-based foods [17].
This study has several limitations and strengths. Firstly, it focuses on products sold in a country, but a direct analysis against consumption levels of these products or diet-disease data could not be carried out due to data unavailability. Further analyses linking product nutritional quality with dietary intake at a population level may provide a clearer picture of the real impact on diet quality. Secondly, both databases employed have their limitations. Data from AFCD-1 are aggregated in sub-categories obtained from a sampling of common Australian products, of which several had not been updated in recent years. In the Mintel Database, the free sugars content employed for the analysis had to be imputed from the declared total sugars content. This study addressed some of the limitations by complementing the strengths of each database. The Mintel Database reflected recent products out in the market today and provided granularity for product assessment. Its free sugars imputation was validated against the AFCD-1. Results between AFCD-1 and Mintel were comparable, and the overall findings of this analysis parallel the previous studies cited [23,27,28]. The study also provides a valuable comparison of carbohydrate-based products in two culturally diverse regions. These findings have public health implications and show that both government (e.g., claims and product labelling regulation) and non-governmental advocacy for nutritious products have positive implications on products in the market and, thus, potentially population level nutritional intake.
Whilst the findings of the previous studies [23,27,28] and this analysis show that products that meet the carbohydrate metrics have an improved nutritional quality, whether the consumption of products or diets meeting the dual and modified ratios contribute to improved health outcomes remains to be validated. Therefore, future research from epidemiological and clinical studies to correlate dietary data with disease risk can help strengthen the integrity of the carbohydrate metrics. If validated, the carbohydrate metrics may be translated for public health use such as through novel front-of-pack labels or as guidelines for food manufacturers to develop healthier carbohydrate-based foods.

5. Conclusions

The carbohydrate metric is a straightforward indicator of product nutritional quality and is relevant to Asian and Australian packaged foods and beverages. In all investigated countries, it allowed identification of carbohydrate-based products rich in whole grains, dietary fibre and other health-promoting nutrients, but lower in energy density, free sugars and other nutrients of public health concern. In solid foods, all three metrics were good indicators of healthier carbohydrate-based packaged foods, whilst in beverages, due to the nature of the product category, the simple ratio was the best metric for selecting products of a higher nutritional density and alignment with national nutrient profiling models. The carbohydrate metrics can be used by consumers to select more nutritious carbohydrate-rich products. Findings from this study may also contribute to product nutritional guidelines for governments and guide food manufacturers on product reformulation.

Supplementary Materials

The following are available online at https://www.mdpi.com/2072-6643/12/9/2771/s1, Table S1. Comparison of mean nutrient composition of hot cereals, cold cereals, cereal and fruit bars, and breads (unfilled) from the Mintel Database which pass or fail the three carbohydrate metrics, Table S2. Proportion of packaged carbohydrate-based foods and beverages which have whole grain claims and/or communication, Table S3. Association between carbohydrate metrics and whole grain claims and/or communication for foods assessed from the Mintel Database, Table S4. Association between carbohydrate metrics and whole grain claims and/or communication for beverages assessed from the Mintel Database, Figure S1. Mean free sugars content of products within a sub-category from Mintel Australia versus the free sugars content of the same sub-category from AFCD-1. Each point represents a product sub-category. The mean free sugars content of 1565 products which belonged to 69 sub-categories in AFCD-1 were tabulated.

Author Contributions

D.T. and K.-A.L. designed the study; D.T., A.O., and C.F. conducted the data extraction; D.T. conducted the statistical analysis; A.N.O. conducted an independent quality assessment of the extracted data to minimise bias; D.T., K.-A.L. and A.N.O. interpreted the conclusions from the data. D.T. drafted the manuscript. K.-A.L., J.E.K. and F.F.-M. reviewed the final manuscript, with inputs from V.C.C. and C.F. All authors have read and agreed to the published version of the manuscript.

Funding

This study was funded by Société des Produits Nestlé SA and Singapore Economic Development Board Industrial Post-Graduate Programme.

Acknowledgments

The authors would like to thank Suzana Almoosawi, who was involved in the conception of this study.

Conflicts of Interest

D.T. and A.N.O. are employed by Nestlé R&D Nestlé R&D Center (Pte) Ltd. in Singapore. K.A.L., C.F., A.O. and V.C.C. are employed by Nestlé Research, Switzerland. D.T., J.E.K. and F.F.-M. have received research grants from Société des Produits Nestlé SA.

References

  1. Ritchie, H.; Roser, M. Diet Compositions. Available online: https://ourworldindata.org/diet-compositions (accessed on 8 July 2020).
  2. Zhou, B.F.; Stamler, J.; Dennis, B.; Moag-Stahlberg, A.; Okuda, N.; Robertson, C.; Zhao, L.; Chan, Q.; Elliott, P.; Group, I.R. Nutrient intakes of middle-aged men and women in China, Japan, United Kingdom, and United States in the late 1990s: The INTERMAP study. J. Hum. Hypertens. 2003, 17, 623–630. [Google Scholar] [CrossRef] [PubMed] [Green Version]
  3. Schmidhuber, J.; Sur, P.; Fay, K.; Huntley, B.; Salama, J.; Lee, A.; Cornaby, L.; Horino, M.; Murray, C.; Afshin, A. The Global Nutrient Database: Availability of macronutrients and micronutrients in 195 countries from 1980 to 2013. Lancet Planet. Health 2018, 2, e353–e368. [Google Scholar] [CrossRef] [Green Version]
  4. Australian Bureau of Statistics. 4364.0.55.007—Australian Health Survey: Nutrition First Results—Food and Nutrients, 2011–2012; Australian Bureau of Statistics: Canberra, Australia, 2014. Available online: https://www.abs.gov.au/ausstats/[email protected]/Lookup/by%20Subject/4364.0.55.007~2011-12~Main%20Features~Foods%20Consumed~2 (accessed on 3 September 2020).
  5. Shan, Z.; Rehm, C.D.; Rogers, G.; Ruan, M.; Wang, D.D.; Hu, F.B.; Mozaffarian, D.; Zhang, F.F.; Bhupathiraju, S.N. Trends in Dietary Carbohydrate, Protein, and Fat Intake and Diet Quality Among US Adults, 1999–2016. JAMA 2019, 322, 1178–1187. [Google Scholar] [CrossRef] [PubMed] [Green Version]
  6. AlEssa, H.B.; Bhupathiraju, S.N.; Malik, V.S.; Wedick, N.M.; Campos, H.; Rosner, B.; Willett, W.C.; Hu, F.B. Carbohydrate quality and quantity and risk of type 2 diabetes in US women. Am. J. Clin. Nutr. 2015, 102, 1543–1553. [Google Scholar] [CrossRef]
  7. Reynolds, A.; Mann, J.; Cummings, J.; Winter, N.; Mete, E.; Te Morenga, L. Carbohydrate quality and human health: A series of systematic reviews and meta-analyses. Lancet 2019, 393, 434–445. [Google Scholar] [CrossRef] [Green Version]
  8. Ludwig, D.S.; Hu, F.B.; Tappy, L.; Brand-Miller, J. Dietary carbohydrates: Role of quality and quantity in chronic disease. BMJ 2018, 361, k2340. [Google Scholar] [CrossRef] [Green Version]
  9. Lamothe, L.M.; Le, K.A.; Samra, R.A.; Roger, O.; Green, H.; Mace, K. The scientific basis for healthful carbohydrate profile. Crit. Rev. Food Sci. Nutr. 2019, 59, 1058–1070. [Google Scholar] [CrossRef] [Green Version]
  10. Livesey, G.; Taylor, R.; Hulshof, T.; Howlett, J. Glycemic response and health—A systematic review and meta-analysis: Relations between dietary glycemic properties and health outcomes. Am. J. Clin. Nutr. 2008, 87, 258S–268S. [Google Scholar] [CrossRef] [Green Version]
  11. Barclay, A.W.; Petocz, P.; McMillan-Price, J.; Flood, V.M.; Prvan, T.; Mitchell, P.; Brand-Miller, J.C. Glycemic index, glycemic load, and chronic disease risk—A meta-analysis of observational studies. Am. J. Clin. Nutr. 2008, 87, 627–637. [Google Scholar] [CrossRef]
  12. Mirrahimi, A.; de Souza, R.J.; Chiavaroli, L.; Sievenpiper, J.L.; Beyene, J.; Hanley, A.J.; Augustin, L.S.A.; Kendall, C.W.C.; Jenkins, D.J.A. Associations of glycemic index and load with coronary heart disease events: A systematic review and meta-analysis of prospective cohorts. J. Am. Heart Assoc. 2012, 1, e000752. [Google Scholar] [CrossRef] [Green Version]
  13. Mitchell, H.L. The glycemic index concept in action. Am. J. Clin. Nutr. 2008, 87, 244S–246S. [Google Scholar] [CrossRef] [PubMed] [Green Version]
  14. Krauss, R.M.; Eckel, R.H.; Howard, B.; Appel, L.J.; Daniels, S.R.; Deckelbaum, R.J.; Erdman, J.W., Jr.; Kris-Etherton, P.; Goldberg, I.J.; Kotchen, T.A.; et al. AHA Dietary Guidelines: Revision 2000: A statement for healthcare professionals from the Nutrition Committee of the American Heart Association. Circulation 2000, 102, 2284–2299. [Google Scholar] [CrossRef] [Green Version]
  15. Health Promotion Board. Health Promotion Board Introduces My Healthy Plate to Inculcate Healthy Eating Habits amongst Singaporeans; Health Promotion Board: Singapore, 2014. Available online: https://www.hpb.gov.sg/article/health-promotion-board-introduces-my-healthy-plate-to-inculcate-healthy-eating-habits-amongst-singaporeans (accessed on 18 June 2020).
  16. National Health and Medical Research Council. Australian Dietary Guidelines; NHMRC: Canberra, Australia, 2013. Available online: https://www.nhmrc.gov.au/_files_nhmrc/file/publications/n55_australian_dietary_guidelines1.pdf (accessed on 18 June 2020).
  17. Mozaffarian, R.S.; Lee, R.M.; Kennedy, M.A.; Ludwig, D.S.; Mozaffarian, D.; Gortmaker, S.L. Identifying whole grain foods: A comparison of different approaches for selecting more healthful whole grain products. Public Health Nutr. 2013, 16, 2255–2264. [Google Scholar] [CrossRef] [PubMed]
  18. Ross, A.B.; van der Kamp, J.W.; King, R.; Lê, K.A.; Mejborn, H.; Seal, C.J.; Thielecke, F. Perspective: A Definition for Whole-Grain Food Products-Recommendations from the Healthgrain Forum. Adv. Nutr. 2017, 8, 525–531. [Google Scholar] [CrossRef] [Green Version]
  19. AlEssa, H.B.; Cohen, R.; Malik, V.S.; Adebamowo, S.N.; Rimm, E.B.; Manson, J.E.; Willett, W.C.; Hu, F.B. Carbohydrate quality and quantity and risk of coronary heart disease among US women and men. Am. J. Clin. Nutr. 2018, 107, 257–267. [Google Scholar] [CrossRef]
  20. Threapleton, D.E.; Greenwood, D.C.; Evans, C.E.; Cleghorn, C.L.; Nykjaer, C.; Woodhead, C.; Cade, J.E.; Gale, C.P.; Burley, V.J. Dietary fibre intake and risk of cardiovascular disease: Systematic review and meta-analysis. BMJ 2013, 347, f6879. [Google Scholar] [CrossRef] [PubMed] [Green Version]
  21. Khan, T.A.; Sievenpiper, J.L. Controversies about sugars: Results from systematic reviews and meta-analyses on obesity, cardiometabolic disease and diabetes. Eur. J. Nutr. 2016, 55, 25–43. [Google Scholar] [CrossRef] [Green Version]
  22. Ruxton, C.H.; Gardner, E.J.; McNulty, H.M. Is sugar consumption detrimental to health? A review of the evidence 1995–2006. Crit. Rev. Food Sci. Nutr. 2010, 50, 1–19. [Google Scholar] [CrossRef]
  23. Blumfield, M.; McConnell, A.; Campos, V.; Lê, K.-A.; Fayet-Moore, F. Carbohydrate Quality Metrics and Their Association with Population Nutrient Intakes and Diet Quality in Australia. Curr. Dev. Nutr. 2020, 4, 510. [Google Scholar] [CrossRef]
  24. Monteiro, C.A.; Moubarac, J.C.; Cannon, G.; Ng, S.W.; Popkin, B. Ultra-processed products are becoming dominant in the global food system. Obes. Rev. 2013, 14 (Suppl. 2), 21–28. [Google Scholar] [CrossRef]
  25. Baker, P.; Friel, S. Food systems transformations, ultra-processed food markets and the nutrition transition in Asia. Glob. Health 2016, 12, 80. [Google Scholar] [CrossRef] [PubMed] [Green Version]
  26. Weaver, C.M.; Dwyer, J.; Fulgoni, V.L., III; King, J.C.; Leveille, G.A.; MacDonald, R.S.; Ordovas, J.; Schnakenberg, D. Processed foods: Contributions to nutrition. Am. J. Clin. Nutr. 2014, 99, 1525–1542. [Google Scholar] [CrossRef] [PubMed]
  27. Liu, J.; Rehm, C.D.; Shi, P.; McKeown, N.M.; Mozaffarian, D.; Micha, R. A comparison of different practical indices for assessing carbohydrate quality among carbohydrate-rich processed products in the US. PLoS ONE 2020, 15, e0231572. [Google Scholar] [CrossRef]
  28. Fontanelli, M.d.M.; Micha, R.; Sales, C.H.; Liu, J.; Mozaffarian, D.; Fisberg, R.M. Application of the ≤10:1 carbohydrate to fiber ratio to identify healthy grain foods and its association with cardiometabolic risk factors. Eur. J. Clin. Nutr. 2019. [Google Scholar] [CrossRef]
  29. Fortune Business Insights. Dairy Alternatives Market Size, Share and Industry Analysis, by Source (Soy, Almond, Coconut, Rice, Oats and Others), Product Type (Non-Dairy Milk, Butter, Cheeses, Yogurts, Ice Cream, and Others), Distribution Channel (Supermarkets/Hypermarkets, Convenience Stores, Online Retail, and Others), and Regional Forecasts, 2019–2026; Fortune Business Insights: 2020. Available online: https://www.fortunebusinessinsights.com/industry-reports/dairy-alternatives-market-100221 (accessed on 19 July 2020).
  30. Mäkinen, O.E.; Wanhalinna, V.; Zannini, E.; Arendt, E.K. Foods for Special Dietary Needs: Non-dairy Plant-based Milk Substitutes and Fermented Dairy-type Products. Crit. Rev. Food Sci. Nutr. 2016, 56, 339–349. [Google Scholar] [CrossRef]
  31. Walji, A. A Year of Innovation in Tea, Malt & Other Hot Drinks, 2019. Mintel Group. Retrieved from Mintel. Available online: https://store.mintel.com/india-malt-and-other-hot-drinks-market-research-report (accessed on 9 September 2020).
  32. Lloyd-Jones, D.M.; Hong, Y.; Labarthe, D.; Mozaffarian, D.; Appel, L.J.; Van Horn, L.; Greenlund, K.; Daniels, S.; Nichol, G.; Tomaselli, G.F.; et al. Defining and setting national goals for cardiovascular health promotion and disease reduction: The American Heart Association’s strategic Impact Goal through 2020 and beyond. Circulation 2010, 121, 586–613. [Google Scholar] [CrossRef] [Green Version]
  33. World Health Organization. Guideline: Sugars Intake for Adults and Children; World Health Organization: Geneva, Switzerland, 2015; Available online: https://www.who.int/publications/i/item/9789241549028 (accessed on 19 July 2020).
  34. Food Standards Australia New Zealand. Australian Food Composition Database—Release 1; Food Standards Australia New Zealand: Canberra, Australia, 2019. Available online: https://www.foodstandards.gov.au/science/monitoringnutrients/afcd/Pages/downloadableexcelfiles.aspx (accessed on 10 September 2019).
  35. Mintel. Mintel Global New Product Database (GNPD). Available online: https://www.mintel.com/global-new-products-database (accessed on 10 September 2019).
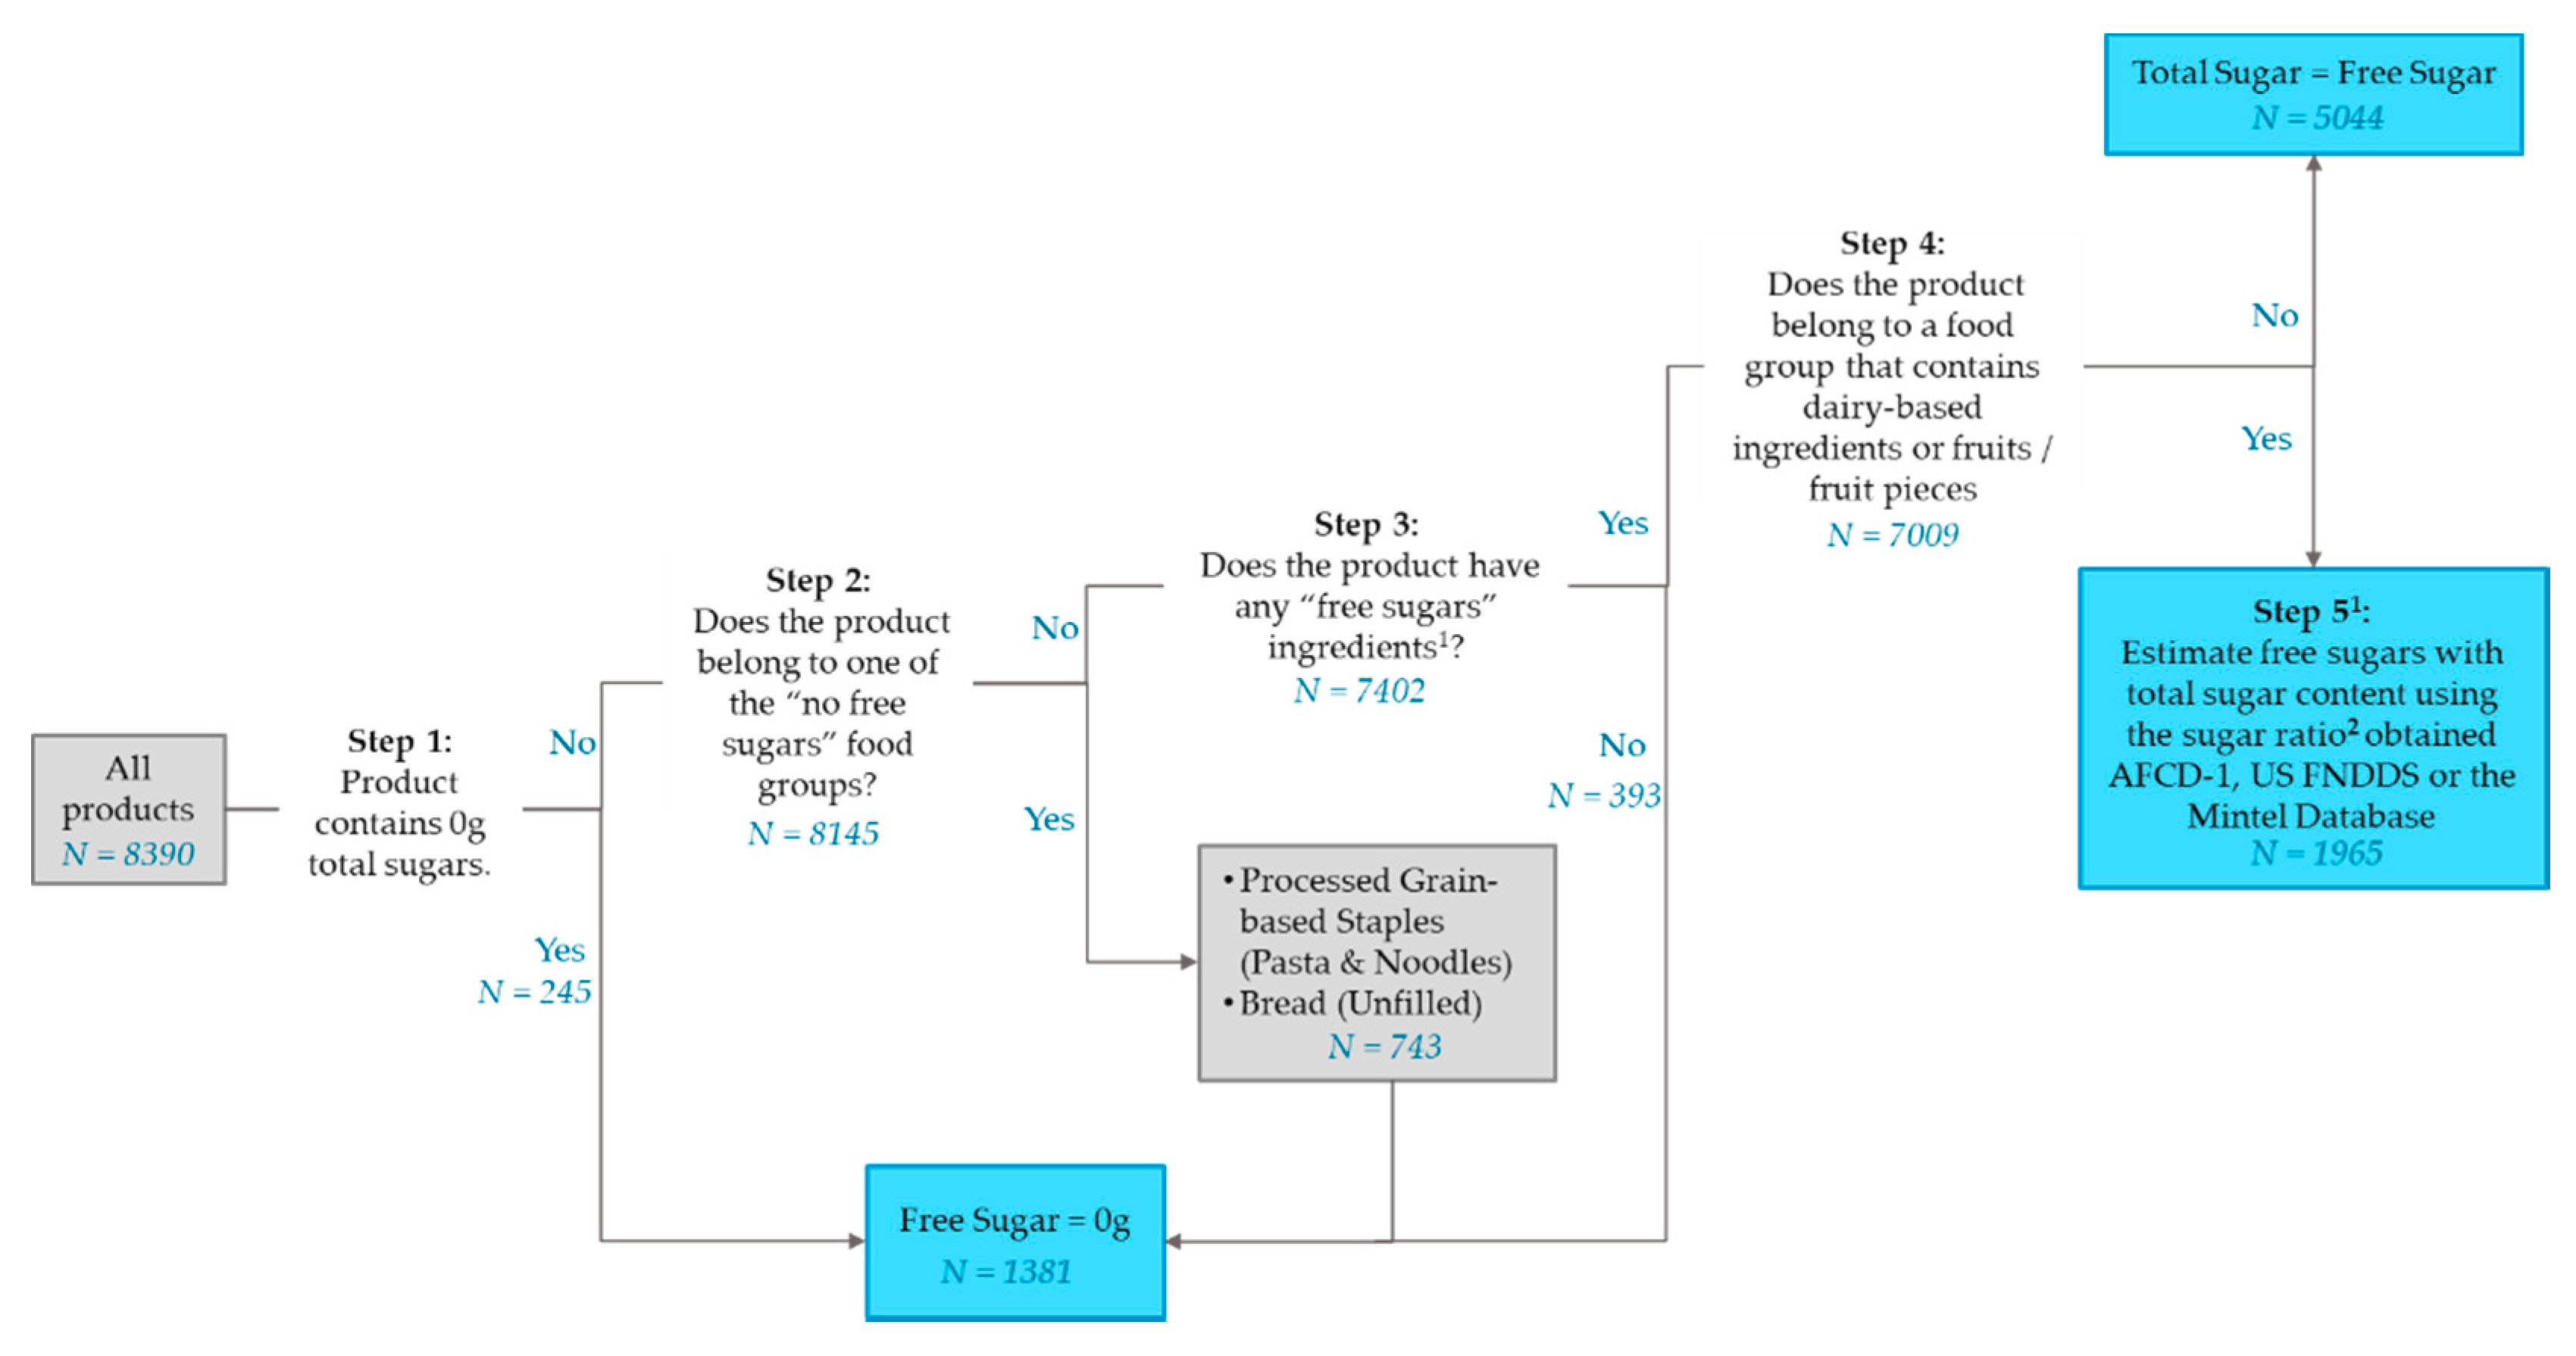
  36. Louie, J.C.; Moshtaghian, H.; Boylan, S.; Flood, V.M.; Rangan, A.M.; Barclay, A.W.; Brand-Miller, J.C.; Gill, T.P. A systematic methodology to estimate added sugar content of foods. Eur. J. Clin. Nutr. 2015, 69, 154–161. [Google Scholar] [CrossRef]
  37. Food Standards Australia New Zealand. Short Guide for Industry to the Nutrient Profiling Scoring Criterion in Standard 1.2.7—Nutrition, Health and Related Claims; Food Standards Australia New Zealand: Canberra, Australia, 2016. Available online: https://www.foodstandards.gov.au/industry/labelling/Documents/Short-guide-for-industry-to-the-NPSC.pdf (accessed on 10 September 2019).
  38. Health Star Rating Advisory Committee. Guide for Industry to the Health Star Rating Calculator (HSRC); Health Star Rating Advisory Committee: Canberra, Australia, 2018. Available online: http://www.healthstarrating.gov.au/internet/healthstarrating/publishing.nsf/Content/guide-for-industry-document (accessed on 10 September 2019).
  39. Health Promotion Board. Healthier Choice Symbol Nutrient Guidelines; Health Promotion Board: Singapore, 2018. Available online: https://www.hpb.gov.sg/docs/default-source/default-document-library/hcs-guidelines-(january-2018)9ab599f6468366dea7adff00000d8c5a.pdf?sfvrsn=2d36ff72_0 (accessed on 10 September 2019).
  40. Anderson, J.W.; Hanna, T.J.; Peng, X.; Kryscio, R.J. Whole grain foods and heart disease risk. J. Am. Coll. Nutr. 2000, 19, 291S–299S. [Google Scholar] [CrossRef]
  41. Slavin, J. Whole grains and human health. Nutr. Res. Rev. 2004, 17, 99–110. [Google Scholar] [CrossRef] [Green Version]
  42. Food Standards Australia New Zealand. Australia New Zealand Food Standards Code—Standard 2.1.1—Cereal and Cereal Products; Commonwealth of Australia Gazette No. FSC 96, 2015; Food Standards Australia New Zealand: Canberra, Australia, 2015.
  43. Booth, S.L.; Johns, T.; Kuhnlein, H.V. Natural food sources of vitamin A and provitamin A. Food Nutr. Bull. 1992, 14, 1–15. [Google Scholar] [CrossRef] [Green Version]
  44. Bouchonville, M.F.; Villareal, D.T. Sarcopenic obesity: How do we treat it? Curr. Opin. Endocrinol. Diabetes Obes. 2013, 20, 412–419. [Google Scholar] [CrossRef] [PubMed] [Green Version]
  45. Artaza-Artabe, I.; Saez-Lopez, P.; Sanchez-Hernandez, N.; Fernandez-Gutierrez, N.; Malafarina, V. The relationship between nutrition and frailty: Effects of protein intake, nutritional supplementation, vitamin D and exercise on muscle metabolism in the elderly. A systematic review. Maturitas 2016, 93, 89–99. [Google Scholar] [CrossRef] [PubMed]
  46. Westerterp-Plantenga, M.S.; Lejeune, M.P. Protein intake and body-weight regulation. Appetite 2005, 45, 187–190. [Google Scholar] [CrossRef] [PubMed]
  47. Riccardi, G.; Rivellese, A.A. Dietary treatment of the metabolic syndrome—The optimal diet. Br. J. Nutr. 2000, 83 (Suppl. 1), S143–S148. [Google Scholar] [CrossRef] [PubMed]
  48. Johnson, B.; Bell, L.; Zarnowiecki, D.; Rangan, A.; Golley, R. Contribution of Discretionary Foods and Drinks to Australian Children’s Intake of Energy, Saturated Fat, Added Sugars and Salt. Children 2017, 4, 104. [Google Scholar] [CrossRef] [Green Version]
  49. Kriengsinyos, W.; Chan, P.; Amarra, M.S.V. Consumption and sources of added sugar in Thailand: A review. Asia Pac. J. Clin. Nutr. 2018, 27, 262–283. [Google Scholar] [CrossRef]
  50. Atmarita; Imanningsih, N.; Jahari, A.B.; Permaesih, I.D.; Chan, P.; Amarra, M.S. Consumption and sources of added sugar in Indonesia: A review. Asia Pac. J. Clin. Nutr. 2018, 27, 47–64. [Google Scholar] [CrossRef]
  51. Louie, J.C.; Moshtaghian, H.; Rangan, A.M.; Flood, V.M.; Gill, T.P. Intake and sources of added sugars among Australian children and adolescents. Eur. J. Nutr. 2016, 55, 2347–2355. [Google Scholar] [CrossRef]
  52. Paquin, P. Functional and Speciality Beverage Technology; Woodhead Publishing Limited: Cambridge, UK, 2009. [Google Scholar]
  53. Hosseinian, F.; Oomah, B.D.; Campos-Vega, R. Dietary Fibre Functionality in Food and Nutraceuticals: From Plant to Gut; Wiley-Blackwell: Chichester, UK, 2017. [Google Scholar]
  54. Backholer, K.; Vandevijvere, S.; Blake, M.; Tseng, M. Sugar-sweetened beverage taxes in 2018: A year of reflections and consolidation. Public Health Nutr. 2018, 21, 3291–3295. [Google Scholar] [CrossRef] [Green Version]
  55. Neo, P. Malaysia Sugar Tax: Innovation and Reformulation Underway, But Is It Enough? Available online: https://www.foodnavigator-asia.com/Article/2019/07/02/Malaysia-sugar-tax-Innovation-and-reformulation-underway-but-is-it-enough (accessed on 15 May 2020).
  56. Shrapnel, W.S.; Butcher, B.E. Sales of Sugar-Sweetened Beverages in Australia: A Trend Analysis from 1997 to 2018. Nutrients 2020, 12, 1016. [Google Scholar] [CrossRef] [Green Version]
  57. Vasanthan, T.; Gaosong, J.; Yeung, J.; Li, J. Dietary fiber profile of barley flour as affected by extrusion cooking. Food Chem. 2002, 77, 35–40. [Google Scholar] [CrossRef]
  58. Zhang, M.; Bai, X.; Zhang, Z. Extrusion process improves the functionality of soluble dietary fiber in oat bran. J. Cereal Sci. 2011, 54, 98–103. [Google Scholar] [CrossRef]
  59. Ralet, M.C.; Thibault, J.F.; Della Valle, G. Influence of extrusion-cooking on the physico-chemical properties of wheat bran. J. Cereal Sci. 1990, 11, 249–259. [Google Scholar] [CrossRef]
  60. Chavan, J.K.; Kadam, S.S.; Beuchat, L.R. Nutritional improvement of cereals by fermentation. Crit. Rev. Food Sci. Nutr. 1989, 28, 349–400. [Google Scholar] [CrossRef]
  61. Peyer, L.C.; Zannini, E.; Arendt, E.K. Lactic acid bacteria as sensory biomodulators for fermented cereal-based beverages. Trends Food Sci. Technol. 2016, 54, 17–25. [Google Scholar] [CrossRef]
  62. Drewnowski, A.; Popkin, B.M. The nutrition transition: New trends in the global diet. Nutr. Rev. 1997, 55, 31–43. [Google Scholar] [CrossRef]
  63. Kelly, M.; Seubsman, S.-A.; Banwell, C.; Dixon, J.; Sleigh, A. Thailand’s food retail transition: Supermarket and fresh market effects on diet quality and health. Br. Food J. 2014, 116, 1180–1193. [Google Scholar] [CrossRef]
  64. Venn, D.; Banwell, C.; Dixon, J. Australia’s evolving food practices: A risky mix of continuity and change. Public Health Nutr. 2017, 20, 2549–2558. [Google Scholar] [CrossRef] [Green Version]
  65. Popkin, B.M. An overview on the nutrition transition and its health implications: The Bellagio meeting. Public Health Nutr. 2002, 5, 93–103. [Google Scholar] [CrossRef]
  66. Baker, P.; Friel, S. Processed foods and the nutrition transition: Evidence from Asia. Obes. Rev. 2014, 15, 564–577. [Google Scholar] [CrossRef] [Green Version]
  67. Machado, P.P.; Steele, E.M.; Louzada, M.; Levy, R.B.; Rangan, A.; Woods, J.; Gill, T.; Scrinis, G.; Monteiro, C.A. Ultra-processed food consumption drives excessive free sugar intake among all age groups in Australia. Eur. J. Nutr. 2020, 59, 2783–2792. [Google Scholar] [CrossRef] [PubMed]
  68. Health Star Rating Advisory Committee. About Health Star Ratings. Available online: http://www.healthstarrating.gov.au/internet/healthstarrating/publishing.nsf/Content/About-health-stars (accessed on 20 April 2020).
  69. Food Standards Australia New Zealand. Overview of the Nutrient Profiling Scoring Criterion. Available online: https://www.foodstandards.gov.au/industry/labelling/Pages/Consumer-guide-to-NPSC.aspx (accessed on 10 September 2019).
  70. Food Industry Asia. Healthier Product Reformulation in Thailand; Food Industry Asia: Bangkok, Thailand, 2019; Available online: https://foodindustry.asia/documentdownload.axd?documentresourceid=31518 (accessed on 12 May 2020).
  71. Ministry of Health Malaysia. Guidelines on Healthier Choice Logo Malaysia; Ministry of Health Malaysia: Putrajaya, Malaysia, 2017. Available online: http://nutrition.moh.gov.my/wp-content/uploads/2018/01/Guidelines%20on%20Healthier%20Choice%20Logo%20Malaysia.pdf (accessed on 12 May 2020).
  72. Ministry of Health, Brunei Darussalam. Nutrient Criteria of Foods and Beverages with the Healthier Choice Logo. Brunei Darussalam. 2016. Available online: https://extranet.who.int/nutrition/gina/sites/default/files/BRN%202016%20Nutrient%20Criteria%20for%20Healthier%20Choice%20Logo.pdf (accessed on 12 May 2020).
  73. Ridoutt, B.; Baird, D.; Bastiaans, K.; Hendrie, G.; Riley, M.; Sanguansri, P.; Syrette, J.; Noakes, M. Changes in Food Intake in Australia: Comparing the 1995 and 2011 National Nutrition Survey Results Disaggregated into Basic Foods. Foods 2016, 5, 40. [Google Scholar] [CrossRef] [PubMed] [Green Version]
  74. National Heart Foundation of Australia. Improving Food Supply. Available online: https://www.heartfoundation.org.au/activities-finding-or-opinion/improving-food-supply (accessed on 13 July 2020).
  75. LiveLighter. Available online: https://livelighter.com.au/ (accessed on 13 July 2020).
  76. Rethink Sugary Drink. Available online: http://www.rethinksugarydrink.org.au/ (accessed on 13 July 2020).
  77. Neo, J.E.; Brownlee, I.A. Wholegrain Food Acceptance in Young Singaporean Adults. Nutrients 2017, 9, 371. [Google Scholar] [CrossRef] [PubMed]
  78. Brownlee, I.A.; Durukan, E.; Masset, G.; Hopkins, S.; Tee, E.S. An Overview of Whole Grain Regulations, Recommendations and Research across Southeast Asia. Nutrients 2018, 10, 752. [Google Scholar] [CrossRef] [PubMed] [Green Version]
  79. Dahl, W.J.; Stewart, M.L. Position of the Academy of Nutrition and Dietetics: Health Implications of Dietary Fiber. J. Acad. Nutr. Diet 2015, 115, 1861–1870. [Google Scholar] [CrossRef] [PubMed]
  80. Galea, L.M.; Beck, E.J.; Probst, Y.C.; Cashman, C.J. Whole grain intake of Australians estimated from a cross-sectional analysis of dietary intake data from the 2011-13 Australian Health Survey. Public Health Nutr. 2017, 20, 2166–2172. [Google Scholar] [CrossRef] [PubMed] [Green Version]
  81. Neo, J.E.; Binte Mohamed Salleh, S.; Toh, Y.X.; How, K.Y.; Tee, M.; Mann, K.; Hopkins, S.; Thielecke, F.; Seal, C.J.; Brownlee, I.A. Whole-grain food consumption in Singaporean children aged 6–12 years. J. Nutr. Sci. 2016, 5, e33. [Google Scholar] [CrossRef] [Green Version]
  82. Ross, A.B.; Colega, M.T.; Lim, A.L.; Silva-Zolezzi, I.; Mace, K.; Saw, S.M.; Kwek, K.; Gluckman, P.; Godfrey, K.M.; Chong, Y.S.; et al. Whole grain intake, determined by dietary records and plasma alkylresorcinol concentrations, is low among pregnant women in Singapore. Asia Pac. J. Clin. Nutr. 2015, 24, 674–682. [Google Scholar] [CrossRef]
  83. Taillie, L.S.; Ng, S.W.; Xue, Y.; Busey, E.; Harding, M. No Fat, No Sugar, No Salt…No Problem? Prevalence of "Low-Content" Nutrient Claims and Their Associations with the Nutritional Profile of Food and Beverage Purchases in the United States. J. Acad. Nutr. Diet. 2017, 117, 1366–1374. [Google Scholar] [CrossRef]
  84. Hughes, C.; Wellard, L.; Lin, J.; Suen, K.L.; Chapman, K. Regulating health claims on food labels using nutrient profiling: What will the proposed standard mean in the Australian supermarket? Public Health Nutr. 2013, 16, 2154–2161. [Google Scholar] [CrossRef] [Green Version]
  85. Harris, J.L.; Thompson, J.M.; Schwartz, M.B.; Brownell, K.D. Nutrition-related claims on children’s cereals: What do they mean to parents and do they influence willingness to buy? Public Health Nutr. 2011, 14, 2207–2212. [Google Scholar] [CrossRef] [Green Version]
  86. Rebello, S.A.; Koh, H.; Chen, C.; Naidoo, N.; Odegaard, A.O.; Koh, W.P.; Butler, L.M.; Yuan, J.M.; van Dam, R.M. Amount, type, and sources of carbohydrates in relation to ischemic heart disease mortality in a Chinese population: A prospective cohort study. Am. J. Clin. Nutr. 2014, 100, 53–64. [Google Scholar] [CrossRef] [PubMed] [Green Version]
  87. Goff, L.M.; Cowland, D.E.; Hooper, L.; Frost, G.S. Low glycaemic index diets and blood lipids: A systematic review and meta-analysis of randomised controlled trials. Nutr. Metab. Cardiovasc. Dis. 2013, 23, 1–10. [Google Scholar] [CrossRef] [PubMed] [Green Version]
  88. Venn, B.J.; Green, T.J. Glycemic index and glycemic load: Measurement issues and their effect on diet-disease relationships. Eur. J. Clin. Nutr. 2007, 61 (Suppl. 1), S122–S131. [Google Scholar] [CrossRef] [PubMed]
  89. Matthan, N.R.; Ausman, L.M.; Meng, H.; Tighiouart, H.; Lichtenstein, A.H. Estimating the reliability of glycemic index values and potential sources of methodological and biological variability. Am. J. Clin. Nutr. 2016, 104, 1004–1013. [Google Scholar] [CrossRef]
  90. Augustin, L.S.; Kendall, C.W.; Jenkins, D.J.; Willett, W.C.; Astrup, A.; Barclay, A.W.; Bjorck, I.; Brand-Miller, J.C.; Brighenti, F.; Buyken, A.E.; et al. Glycemic index, glycemic load and glycemic response: An International Scientific Consensus Summit from the International Carbohydrate Quality Consortium (ICQC). Nutr. Metab. Cardiovasc. Dis. 2015, 25, 795–815. [Google Scholar] [CrossRef] [Green Version]
  91. Aziz, A.; Dumais, L.; Barber, J. Health Canada’s evaluation of the use of glycemic index claims on food labels. Am. J. Clin. Nutr. 2013, 98, 269–274. [Google Scholar] [CrossRef] [Green Version]
  92. European Food Safety Authority. Scientific Opinion on the substantiation of health claims related to carbohydrates that induce low/reduced glycaemic responses (ID 474, 475, 483, 484) and carbohydrates with a low glycaemic index (ID 480, 481, 482, 1300) pursuant to Article 13(1) of Regulation (EC) No 1924/2006. EFSA J. 2010, 8, 1491. [Google Scholar] [CrossRef]
  93. Food Standards Australia New Zealand. Australia New Zealand Food Standards Code—Standard 1.2.7—Nutrition, Health and Related Claims; Food Standards Australia New Zealand: Canberra, Australia, 2016. Available online: https://www.legislation.gov.au/Details/F2017C01048 (accessed on 12 May 2020).
  94. Food Standards Australia New Zealand. Australia New Zealand Food Standards Code—Standard 1.2.8—Nutrition Information Requirements; Food Standards Australia New Zealand: Canberra, Australia, 2012. Available online: https://www.legislation.gov.au/Details/F2012C00218 (accessed on 8 September 2020).
  95. ASEAN Food and Beverage Alliance. Nutrition Labelling on Prepackaged Food: Impact on Trade in ASEAN. 2018. Available online: https://foodindustry.asia/documentdownload.axd?documentresourceid=30656 (accessed on 8 September 2020).
  96. Liu, S. Intake of refined carbohydrates and whole grain foods in relation to risk of type 2 diabetes mellitus and coronary heart disease. J. Am. Coll. Nutr. 2002, 21, 298–306. [Google Scholar] [CrossRef]
Figure 1. Free sugars imputation process for determining the free sugars content of products from the MintelDatabase. 1 “Free sugars” ingredients refers to sugar, maltodextrin, syrup, sucrose, glucose, fructose, maltose, honey, nectar, malt, non-dairy creamer, juice, jam, sweetened ingredients (e.g., sweetened fruits). 2 Sugar ratio refers to the ratio of free sugars:total sugars. This is the mean content of free sugars divided by the mean total sugars content of a product sub-category with dairy-based ingredients or whole fruit/fruit pieces. These were obtained from either the Australian Food Composition Database Release 1 (AFCD-1), US Food and Nutrient Database for Dietary Studies (FNDDS) or declared values from the Mintel Database.
Nutrients 12 02771 g001
Figure 2. Percentage of carbohydrate-based packaged food and beverage sub-categories and products from AFCD-1 and the Mintel Database that met each carbohydrate metric. (a) Comparison of carbohydrate-based packaged food and beverage sub-categories from AFCD-1. The following categories were omitted from this graph as no sub-categories passed any metric: breads (filled/toppings), cereal and fruit bars, sweet biscuits, sweet pastries and desserts, instant noodles, instant pasta and rice, pizza, cereal mixes, juices, flavoured juice, plant-based milks and tea and coffee mixes. (b) Comparison of carbohydrate-based packaged foods from Mintel Australia. (c) Comparison of carbohydrate-based packaged beverages from Mintel Australia. NA indicates no products within the category from the respective database. (d) Comparison of carbohydrate-based packaged foods from Mintel Asia. (e) Comparison of carbohydrate-based packaged beverages from Mintel Asia.
Nutrients 12 02771 g002aNutrients 12 02771 g002bNutrients 12 02771 g002c
Figure 3. Comparison of the percentage of carbohydrate-based packaged foods and beverages from the Mintel Database that meet each metric across the five countries (n = 8390).
Nutrients 12 02771 g003
Figure 4. Percentage of carbohydrate-based packaged foods from (a) Mintel Australia and (b) Mintel Asia that passed or failed the three metrics and met the respective national nutrient profiling models as a nutritious product.
Nutrients 12 02771 g004
Figure 5. Percentage of carbohydrate-based (a) RTD beverages from Mintel Australia (b) RTD beverages from Mintel Asia and (c) powdered beverages from Mintel Asia that passed or failed the three metrics and met the respective national nutrient product models as a nutritious product.
Nutrients 12 02771 g005aNutrients 12 02771 g005b
Table 1. Packaged food and beverage categories in the scope of this analysis and their descriptions.
Product CategoriesDescription
Breads (Unfilled)Breads with no filling or topping (e.g., bread loaves, naan, pita)
Breads (Filled/Toppings)Breads with filling (e.g., cream) or toppings (e.g., raisins)
Cold CerealsReady-to-eat breakfast cereals which are typically consumed cold with milk or milk substitutes (e.g., muesli, corn flakes)
Hot CerealsSolid or semi-solid cereal products that are intended to be consumed hot (e.g., oatmeal, porridges)
Cereal and Fruit BarsSnack bars that are cereal or fruit-based
Processed Grain-based StaplesStaples which have been processed (pastas and noodles)
Savoury BiscuitsBiscuits with a savoury flavour
Sweet BiscuitsBiscuits with a sweet flavour (e.g., cookies, sandwich biscuits)
Sweet Pastries and DessertsReady-to-eat desserts (e.g., cakes, muffins, pies, tarts, scones, puddings, pastries)
Instant NoodlesDried noodles with added flavours for a soup or sauce base
Instant Pasta and RiceDried or chilled pasta or rice ready meals with added flavours for a sauce base
PizzaChilled or frozen pizza with toppings
All FoodsAggregation of all food categories assessed
Cereal MixesCereal-based (e.g., oat, rice, barley, corn) beverages, often containing solid cereal flakes/bits
Flavoured Milk/Malt BeveragesFlavoured-milks (e.g., chocolate milk), powdered concentrates for flavoured milks (e.g., hot chocolate) and flavoured malt-based beverages which also contain dairy
JuicesBeverages that are >95% fruit or vegetable juice, either freshly squeezed or from concentrate
Flavoured JuiceNon-carbonated fruit or vegetable flavoured juices, excluding flower/herbal drinks
Plant-based MilksDairy-based alternative drinks
Tea and Coffee MixesTea and coffee-based beverages with more than one ingredient (e.g., sugar, creamer, milk)
All BeveragesAggregation of all beverage categories assessed
All Products AssessedAggregation of all food and beverage categories assessed
Table 2. Comparison of mean nutrient composition of carbohydrate-based packaged food sub-categories from AFCD-1 that passed or failed all of the three carbohydrate metrics.
NutrientUnitMeanp Value
PassFail
Percentage of sub-categories (n = 86) 2278
Energykcal318.9333.30.399
Proteing10.47.8<0.001
Total Fatg4.79.0<0.001
Saturated fatg0.93.7<0.001
Trans fatmg20.9176.0<0.001
Cholesterolmg0.022.2<0.001
Total Carbohydratesg63.356.90.080
Available Carbohydratesg53.154.10.759
Dietary Fibreg10.22.8<0.001
Total Sugarsg7.015.40.001
Free Sugarsg2.712.2<0.001
Sodiummg279.1385.20.052
Calciummg59.674.10.411
Ironmg4.52.00.010
Iodineug31.117.50.061
Magnesiummg97.030.3<0.001
Potassiummg337.4168.30.001
Zincmg2.11.00.005
Seleniumug11.88.20.011
Vitamin A (Retinol Equivalent)ug0.837.5<0.001
Vitamin Emg0.90.90.694
Vitamin B1mg0.70.30.014
Vitamin B2mg0.30.20.377
Vitamin B3mg4.41.90.014
Pyridoxine B6mg0.20.10.179
Vitamin B9 (Dietary Folate Equivalent)ug231.3109.50.037
Vitamin B12ug0.00.20.013
Table 3. Comparison of mean nutrient composition of carbohydrate-based packaged food and beverage products from Mintel Australia that passed or failed the three carbohydrate metrics.
Simple Ratio Dual RatioModified Ratio
NutrientUnitMeanp ValueMeanp ValueMeanp Value
PassFailPassFailPassFail
Foods (n = 2190)
Percentage of Products 4357 3268 2773
EnergyKcal364.8368.00.394355.7371.7<0.001349.0373.0<0.001
Dietary Fibreg10.23.4<0.00110.94.1<0.00110.64.7<0.001
Total Sugarsg16.817.20.56614.118.4<0.00113.518.3<0.001
Free Sugarsg9.914.9<0.0015.616.1<0.0013.316.2<0.001
Proteing10.57.7<0.00110.88.0<0.00110.78.3<0.001
Total Fatg10.39.50.0059.510.00.1148.910.1<0.001
Saturated Fatg2.83.8<0.0012.53.8<0.0012.33.8<0.001
Sodiummg167.0866.00.216170.0750.00.220174.0706.00.225
Ready-to-Drink (RTD) Beverages (n = 374)
Percentage of Products 1189
EnergyKcal34.242.80.005No analysis was conducted as only 6 products passed this metricNo analysis was conducted as no products passed this metric
Dietary Fibreg1.20.3<0.001
Total Sugarsg4.98.3<0.001
Free Sugarsg4.88.1<0.001
Proteing0.80.60.032
Total Fatg0.50.40.327
Saturated Fatg0.20.20.673
Sodiummg45.917.20.038
Table 4. Comparison of mean nutrient composition of carbohydrate-based packaged food and beverage products from Mintel Asia that passed or failed the three carbohydrate metrics.
Simple Ratio Dual RatioModified Ratio
NutrientUnitMeanp ValueMeanp ValueMeanp Value
PassFailPassFailPassFail
Foods (n = 3583)
Percentage of Products 1684 1189 991
EnergyKcal374.1403.1<0.001359.2403.2<0.001357.0402.7<0.001
Dietary Fibreg9.72.8<0.00110.43.1<0.00110.13.2<0.001
Total Sugarsg14.120.9<0.0018.521.2<0.0016.921.2<0.001
Free Sugarsg11.420.0<0.0014.920.3<0.0012.720.2<0.001
Proteing9.57.5<0.00110.27.5<0.00110.57.5<0.001
Total Fatg10.512.2<0.0018.912.3<0.0018.712.2<0.001
Saturated Fatg4.06.0<0.0012.86.0<0.0012.85.9<0.001
Sodiummg295.01219.0<0.001295.01167.0<0.001315.01150.0<0.001
Ready-to-Drink (RTD) Beverages (n = 1397)
Percentage of Products 1387 496 No analysis was conducted as only 13 products passed this metric
EnergyKcal43.750.1<0.00140.149.60.002
Dietary Fibreg2.10.2<0.0013.00.4<0.001
Total Sugarsg6.38.7<0.0014.18.6<0.001
Free Sugarsg6.17.9<0.0013.87.9<0.001
Proteing0.80.90.1130.70.90.025
Total Fatg0.50.70.0070.60.70.365
Saturated Fatg0.20.30.0010.30.30.858
Sodiummg230.0135.00.64636.7153.00.057
Powdered Beverages (n = 833)
Percentage of Products 2773 1486 1189
EnergyKcal413.0423.30.031411.9422.0<0.001413.3421.50.227
Dietary Fibreg13.23.0<0.00116.14.0<0.00115.94.4<0.001
Total Sugarsg25.347.1<0.0019.546.5<0.0016.245.7<0.001
Free Sugarsg24.543.5<0.0018.943.3<0.0016.042.6<0.001
Proteing7.56.10.0018.06.2<0.0017.86.30.018
Total Fatg11.210.10.03912.010.1<0.00112.310.20.009
Saturated Fatg9.08.00.1079.98.00.02310.08.10.019
Sodiummg161.0194.00.011172.0187.00.466134.0191.0<0.001

