Risk Reduction for End-Stage Renal Disease by Dietary Guidance Using the Gustatory Threshold Test for Salty Taste

 ,
,
Abstract
:1. Introduction
2. Materials and Methods
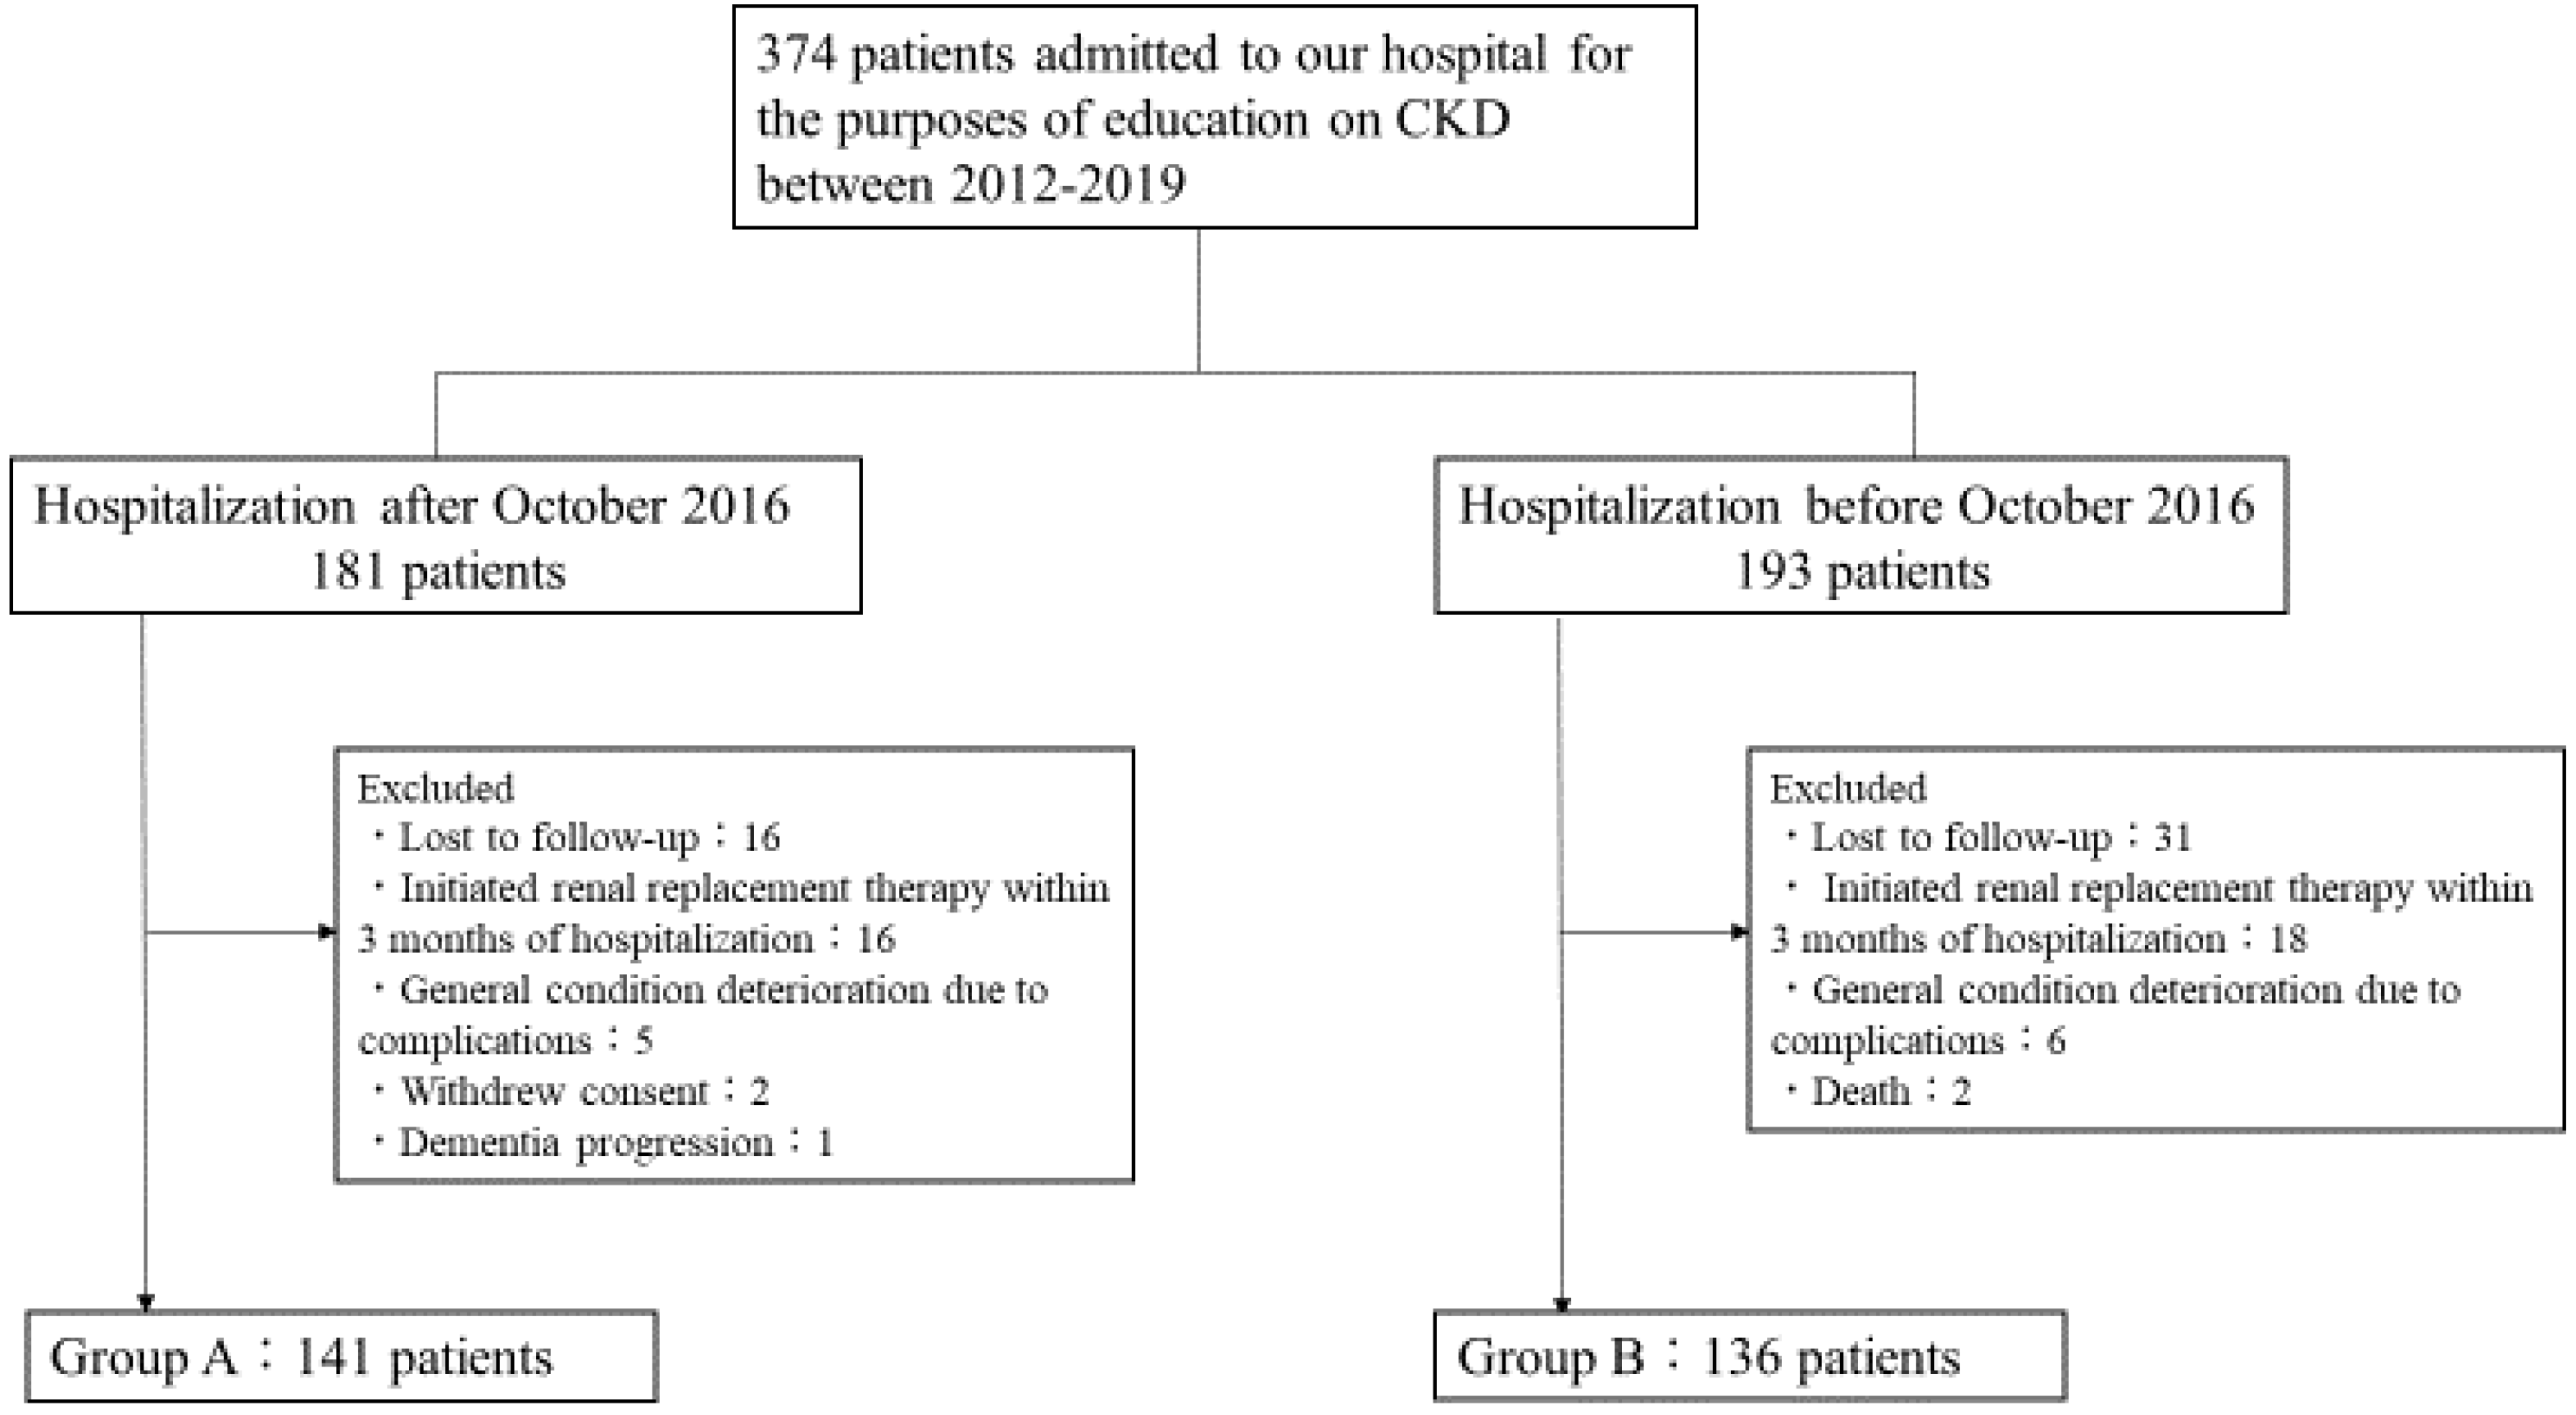
2.1. Subjects and Study Design
2.2. Assessments
2.2.1. Estimated Glomerular Filtration Rate: eGFR
2.2.2. Gustatory Threshold for Salty Taste
(mg/dL) × 10) × (−2.04 × age + 14.89 × body weight (kg) + 16.14 × height (cm) −
2244.45)}0.392
2.3. Statistical Analyses
3. Results
4. Discussion
5. Conclusions
Supplementary Materials
Author Contributions
Funding
Acknowledgments
Conflicts of Interest
References
- Bikbov, B.; Purcell, C.A.; Levey, A.S.; Smith, M.; Abdoli, A.; Abebe, M.; Adebayo, O.M.; Afarideh, M.; Agarwal, S.K.; Agudelo-Botero, M.; et al. Global, regional, and national burden of chronic kidney disease, 1990–2017: A systematic analysis for the Global Burden of Disease Study 2017. Lancet 2020, 395, 709–733. [Google Scholar] [CrossRef] [Green Version]
- He, F.J.; Tan, M.; Ma, Y.; MacGregor, G.A. Salt Reduction to Prevent Hypertension and Cardiovascular Disease: JACC State-of-the-Art Review. J. Am. Coll. Cardiol. 2020, 75, 632–647. [Google Scholar] [CrossRef]
- Saran, R.; Padilla, R.L.; Gillespie, B.W.; Heung, M.; Hummel, S.L.; Derebail, V.K.; Pitt, B.; Levin, N.W.; Zhu, F.; Abbas, S.R.; et al. A randomized crossover trial of dietary sodium restriction in stage 3–4 CKD. Clin. J. Am. Soc. Nephrol. 2017, 12, 399–407. [Google Scholar] [CrossRef]
- Garofalo, C.; Borrelli, S.; Provenzano, M.; De Stefano, T.; Vita, C.; Chiodini, P.; Minutolo, R.; Nicola, L.; Conte, G. Dietary Salt Restriction in Chronic Kidney Disease: A Meta-Analysis of Randomized Clinical Trials. Nutrients 2018, 10, 732. [Google Scholar] [CrossRef] [PubMed] [Green Version]
- Anderson, C.A.M.; Nguyen, H.A. Nutrition education in the care of patients with chronic kidney disease and end-stage renal disease. Semin. Dial. 2018, 31, 115–121. [Google Scholar] [CrossRef] [PubMed]
- Machida, S.; Shibagaki, Y.; Sakurada, T. An inpatient educational program for chronic kidney disease. Clin. Exp. Nephrol. 2019, 23, 493–500. [Google Scholar] [CrossRef] [PubMed]
- Kusaba, T.; Mori, Y.; Masami, O.; Hiroko, N.; Adachi, T.; Sugishita, C.; Sonomura, K.; Kimura, T.; Kishimoto, N.; Nakagawa, H.; et al. Sodium restriction improves the gustatory threshold for salty taste in patients with chronic kidney disease. Kidney Int. 2009, 76, 638–643. [Google Scholar] [CrossRef] [PubMed] [Green Version]
- Levey, A.S.; Eckardt, K.U.; Tsukamoto, Y.; Levin, A.; Coresh, J.; Rossert, J.; De Zeeuw, D.; Hostetter, T.H.; Lameire, N.; Eknoyan, G.; et al. Definition and classification of chronic kidney disease: A position statement from Kidney Disease: Improving Global Outcomes (KDIGO)z. Kidney Int. 2005, 67, 2089–2100. [Google Scholar] [CrossRef] [PubMed] [Green Version]
- Matsuo, S.; Imai, E.; Horio, M.; Yasuda, Y.; Tomita, K.; Nitta, K.; Yamagata, K.; Tomino, Y.; Yokoyama, H.; Hishida, A.; et al. Revised Equations for Estimated GFR From Serum Creatinine in Japan. Am. J. Kidney Dis. 2009, 53, 982–992. [Google Scholar] [CrossRef] [PubMed]
- Michikawa, T.; Nishiwaki, Y.; Okamura, T.; Asakura, K.; Nakano, M.; Takebayashi, T. The taste of salt measured by a simple test and blood pressure in Japanese women and men. Hypertens. Res. 2009, 32, 399–403. [Google Scholar] [CrossRef] [Green Version]
- Nishimoto, K.; Hirota, R.; Egawa, M.; Furuta, S. Clinical evaluation of taste dysfunction using a salt-impregnated taste strip. ORL 1996, 58, 258–261. [Google Scholar] [CrossRef]
- Tanaka, T.; Okamura, T.; Miura, K.; Kadowaki, T.; Ueshima, H.; Nakagawa, H. A simple method to estimate populational 24-h urinary sodium and potassium. J. Hum. Hypertens. 2002, 16, 97–103. [Google Scholar] [CrossRef] [Green Version]
- Ogura, M.; Kimura, A.; Takane, K.; Nakao, M.; Hamaguchi, A.; Terawaki, H.; Hosoya, T. Estimation of salt intake from spot urine samples in patients with chronic kidney disease. BMC Nephrol. 2012, 13, 36. [Google Scholar] [CrossRef] [PubMed] [Green Version]
- Imai, E.; Yasuda, Y.; Horio, M.; Shibata, K.; Kato, S.; Mizutani, Y.; Imai, J.; Hayashi, M.; Kamiya, H.; Oiso, Y.; et al. Validation of the equations for estimating daily sodium excretion from spot urine in patients with chronic kidney disease. Clin. Exp. Nephrol. 2011, 15, 861–867. [Google Scholar] [CrossRef] [PubMed]
- Bayliss, E.A.; Bhardwaja, B.; Ross, C.; Beck, A.; Lanese, D.M. Multidisciplinary team care may slow the rate of decline in renal function. Clin. J. Am. Soc. Nephrol. 2011, 6, 704–710. [Google Scholar] [CrossRef] [PubMed] [Green Version]
- Mills, K.T.; Chen, J.; Yang, W.; Appel, L.J.; Kusek, J.W.; Alper, A.; Delafontaine, P.; Keane, M.G.; Mohler, E.; Ojo, A.; et al. Sodium excretion and the risk of cardiovascular disease in patients with chronic kidney disease. JAMA J. Am. Med. Assoc. 2016, 315, 2200–2210. [Google Scholar] [CrossRef] [PubMed]
- Campbell, K.L.; Johnson, D.W.; Bauer, J.D.; Hawley, C.M.; Isbel, N.M.; Stowasser, M.; Whitehead, J.P.; Dimeski, G.; McMahon, E. A randomized trial of sodium-restriction on kidney function, fluid volume and adipokines in CKD patients. BMC Nephrol. 2014, 15, 57. [Google Scholar] [CrossRef] [PubMed] [Green Version]
- Mazarova, A.; Molnar, A.O.; Akbari, A.; Sood, M.M.; Hiremath, S.; Burns, K.D.; Ramsay, T.O.; Mallick, R.; Knoll, G.A.; Ruzicka, M. The association of urinary sodium excretion and the need for renal replacement therapy in advanced chronic kidney disease: A cohort study. BMC Nephrol. 2016, 17, 123. [Google Scholar] [CrossRef] [PubMed] [Green Version]
- McQuarrie, E.P.; Traynor, J.P.; Taylor, A.H.; Freel, E.M.; Fox, J.G.; Jardine, A.G.; Mark, P.B. Association between urinary sodium, creatinine, albumin, and long-term survival in chronic kidney disease. Hypertension 2014, 64, 111–117. [Google Scholar] [CrossRef] [Green Version]
- O’Donnell, M.; Mente, A.; Rangarajan, S.; McQueen, M.J.; Wang, X.; Liu, L.; Yan, H.; Lee, S.F.; Mony, P.; Devanath, A.; et al. Urinary sodium and potassium excretion, mortality, and cardiovascular events. N. Engl. J. Med. 2014, 371, 612–623. [Google Scholar] [CrossRef] [Green Version]
- Yoon, C.; Noh, J.; Lee, J.; Kee, Y.K.; Seo, C.; Lee, M.; Cha, M.; Kim, H.; Park, S.; Yun, H.; et al. High and low sodium intakes are associated with incident chronic kidney disease in patients with normal renal function and hypertension. Kidney Int. 93, 921–931. [CrossRef] [PubMed] [Green Version]
- Kim, T.H.; Kim, Y.H.; Bae, N.Y.; Kang, S.S.; Lee, J.B.; Kim, S.B. Salty taste thresholds and preference in patients with chronic kidney disease according to disease stage: A cross-sectional study. Nutr. Diet. 2018, 75, 59–64. [Google Scholar] [CrossRef] [PubMed]
- Fernström, A.; Hylander, B.; Rössner, S. Taste acuity in patients with chronic renal failure. Clin. Nephrol. 1996, 45, 169–174. [Google Scholar]
- Nomura, K.; Nakanishi, M.; Ishidate, F.; Iwata, K.; Taruno, A. All-Electrical Ca2+-Independent Signal Transduction Mediates Attractive Sodium Taste in Taste Buds. Neuron 2020. [Google Scholar] [CrossRef] [PubMed]
- Shigemura, N.; Iwata, S.; Yasumatsu, K.; Ohkuri, T.; Horio, N.; Sanematsu, K.; Yoshida, R.; Margolskee, R.F.; Ninomiya, Y. Angiotensin II modulates salty and sweet taste sensitivities. J. Neurosci. 2013, 33, 6267–6277. [Google Scholar] [CrossRef] [PubMed]


| All (277) | Group A (141) | Group B (136) | p-Value | |
|---|---|---|---|---|
| Age, years | 69.2 ± 12.2 | 67.7 ± 13.2 | 70.7 ± 10.8 | 0.045 |
| Male, % | 62.1% (172) | 64.5% (91) | 59.6% (81) | 0.46 |
| Height, cm | 160.0 ± 9.3 | 161.3 ± 61.3 | 158.6 ± 58.6 | 0.02 |
| Weight, kg | 60.2 ± 13.4 | 62.9 ± 14.3 | 57.5 ± 11.8 | <0.001 |
| BMI, kg/m2 | 23.4 ± 4.2 | 24.1 ± 4.8 | 22.7 ± 3.5 | 0.007 |
| CKD stage, % | G3: 18.0% (50) G4: 49.1% (136) G5: 32.9% (91) | G3: 24.1% (34) G4: 49.7% (70) G5: 26.2% (37) | G3: 11.8% (16) G4: 48.5% (66) G5: 39.7% (54) | |
| Primary disease, % | Diabetic nephropathy: 35.7% (99) Nephrosclerosis: 31.0% (86) Glomerulonephritis: 15.5% (43) ADPKD: 4.3% (12) One kidney: 4.3% (12) Others: 9.0% (25) | Diabetic nephropathy: 39.7% (56) Nephrosclerosis: 27.0% (38) Glomerulonephritis: 17.0% (24) ADPKD: 4.3% (6) One kidney: 5.7% (8) Others: 6.4% (9) | Diabetic nephropathy: 31.6% (43) Nephrosclerosis: 35.3% (48) Glomerulonephritis: 14.0% (19) ADPKD: 4.4% (6) One kidney: 2.9% (4) Others: 12.5% (16) | |
| Diabetes mellitus, % | 46.9% (130) | 51.1% (72) | 42.7% (58) | 0.23 |
| BUN, mg/dL | 39.7 ± 15.7 | 39.1 ± 15.8 | 40.3 ± 15.7 | 0.55 |
| Cr, mg/dL | 2.6 ± 1.1 | 2.6 ± 1.1 | 2.5 ± 1.1 | 0.51 |
| eGFR, mL/min/1.73 m2 | 20.8 ± 10.1 | 22.4 ± 10.3 | 19.1 ± 9.6 | 0.005 |
| Na, mmol/L | 139.8 ± 2.5 | 139.6 ± 2.3 | 140.2 ± 2.6 | 0.05 |
| K, mmol/L | 4.5 ± 0.5 | 4.4 ± 0.5 | 4.6 ± 0.5 | 0.06 |
| Ca, mg/dL | 9.1 ± 0.6 | 9.1 ± 0.6 | 9.0 ± 0.6 | 0.10 |
| P, mg/dL | 3.7 ± 0.8 | 3.7 ± 0.9 | 3.7 ± 0.8 | 0.99 |
| UA, mg/dL | 7.1 ± 1.6 | 7.1 ± 1.6 | 7.1 ± 1.7 | 0.87 |
| Intact-PTH a, pg/mL | 111 (67–177) | 104 (63.9–151) | 131 (71.7–217) | 0.004 |
| HCO3-, mmol/L | 23.1 ± 3.3 | 23.1 ± 3.4 | 23.1 ± 3.0 | 0.98 |
| Alb, g/dL | 3.8 ± 0.5 | 3.8 ± 0.5 | 3.7 ± 0.5 | 0.51 |
| LDL-C, mg/dL | 96.6 ± 30.1 | 96.8 ± 28.4 | 96.4 ± 32.3 | 0.91 |
| HbA1c, % | 6.1 ± 1.0 | 6.2 ± 1.1 | 6.1 ± 1.0 | 0.86 |
| Ferritin a, ng/mL | 133 (68–248) | 148 (82–273) | 111 (49–196) | 0.14 |
| Hb, g/dL | 11.4 ± 1.7 | 11.7 ± 1.8 | 11.1 ± 1.6 | 0.004 |
| UPCR a, g/gCr | 1.5 (0.4–3.3) | 1.5 (0.5–3.0) | 1.5 (0.3–3.5) | 0.58 |
| SBP, mmHg | 138 ± 21 | 138 ± 22 | 137 ± 20 | 0.72 |
| DBP, mmHg | 76 ± 13 | 77 ± 12 | 74 ± 13 | 0.06 |
| On Admission | 3 Months after Admission | p-Value | |
|---|---|---|---|
| Gustatory threshold for salty taste (mg/cm2) | 1.02 ± 0.35 | 0.85 ± 0.28 | <0.001 |
| Salt intake (g/day) | 8.5 ± 2.0 | 8.1 ± 2.5 | 0.04 |
| SBP, mmHg | 137 ± 21 | 133 ± 16 | 0.003 |
| DBP, mmHg | 76 ± 13 | 74 ± 11 | 0.02 |
| Group A (105) | Group B (105) | HR | p-Value | |
|---|---|---|---|---|
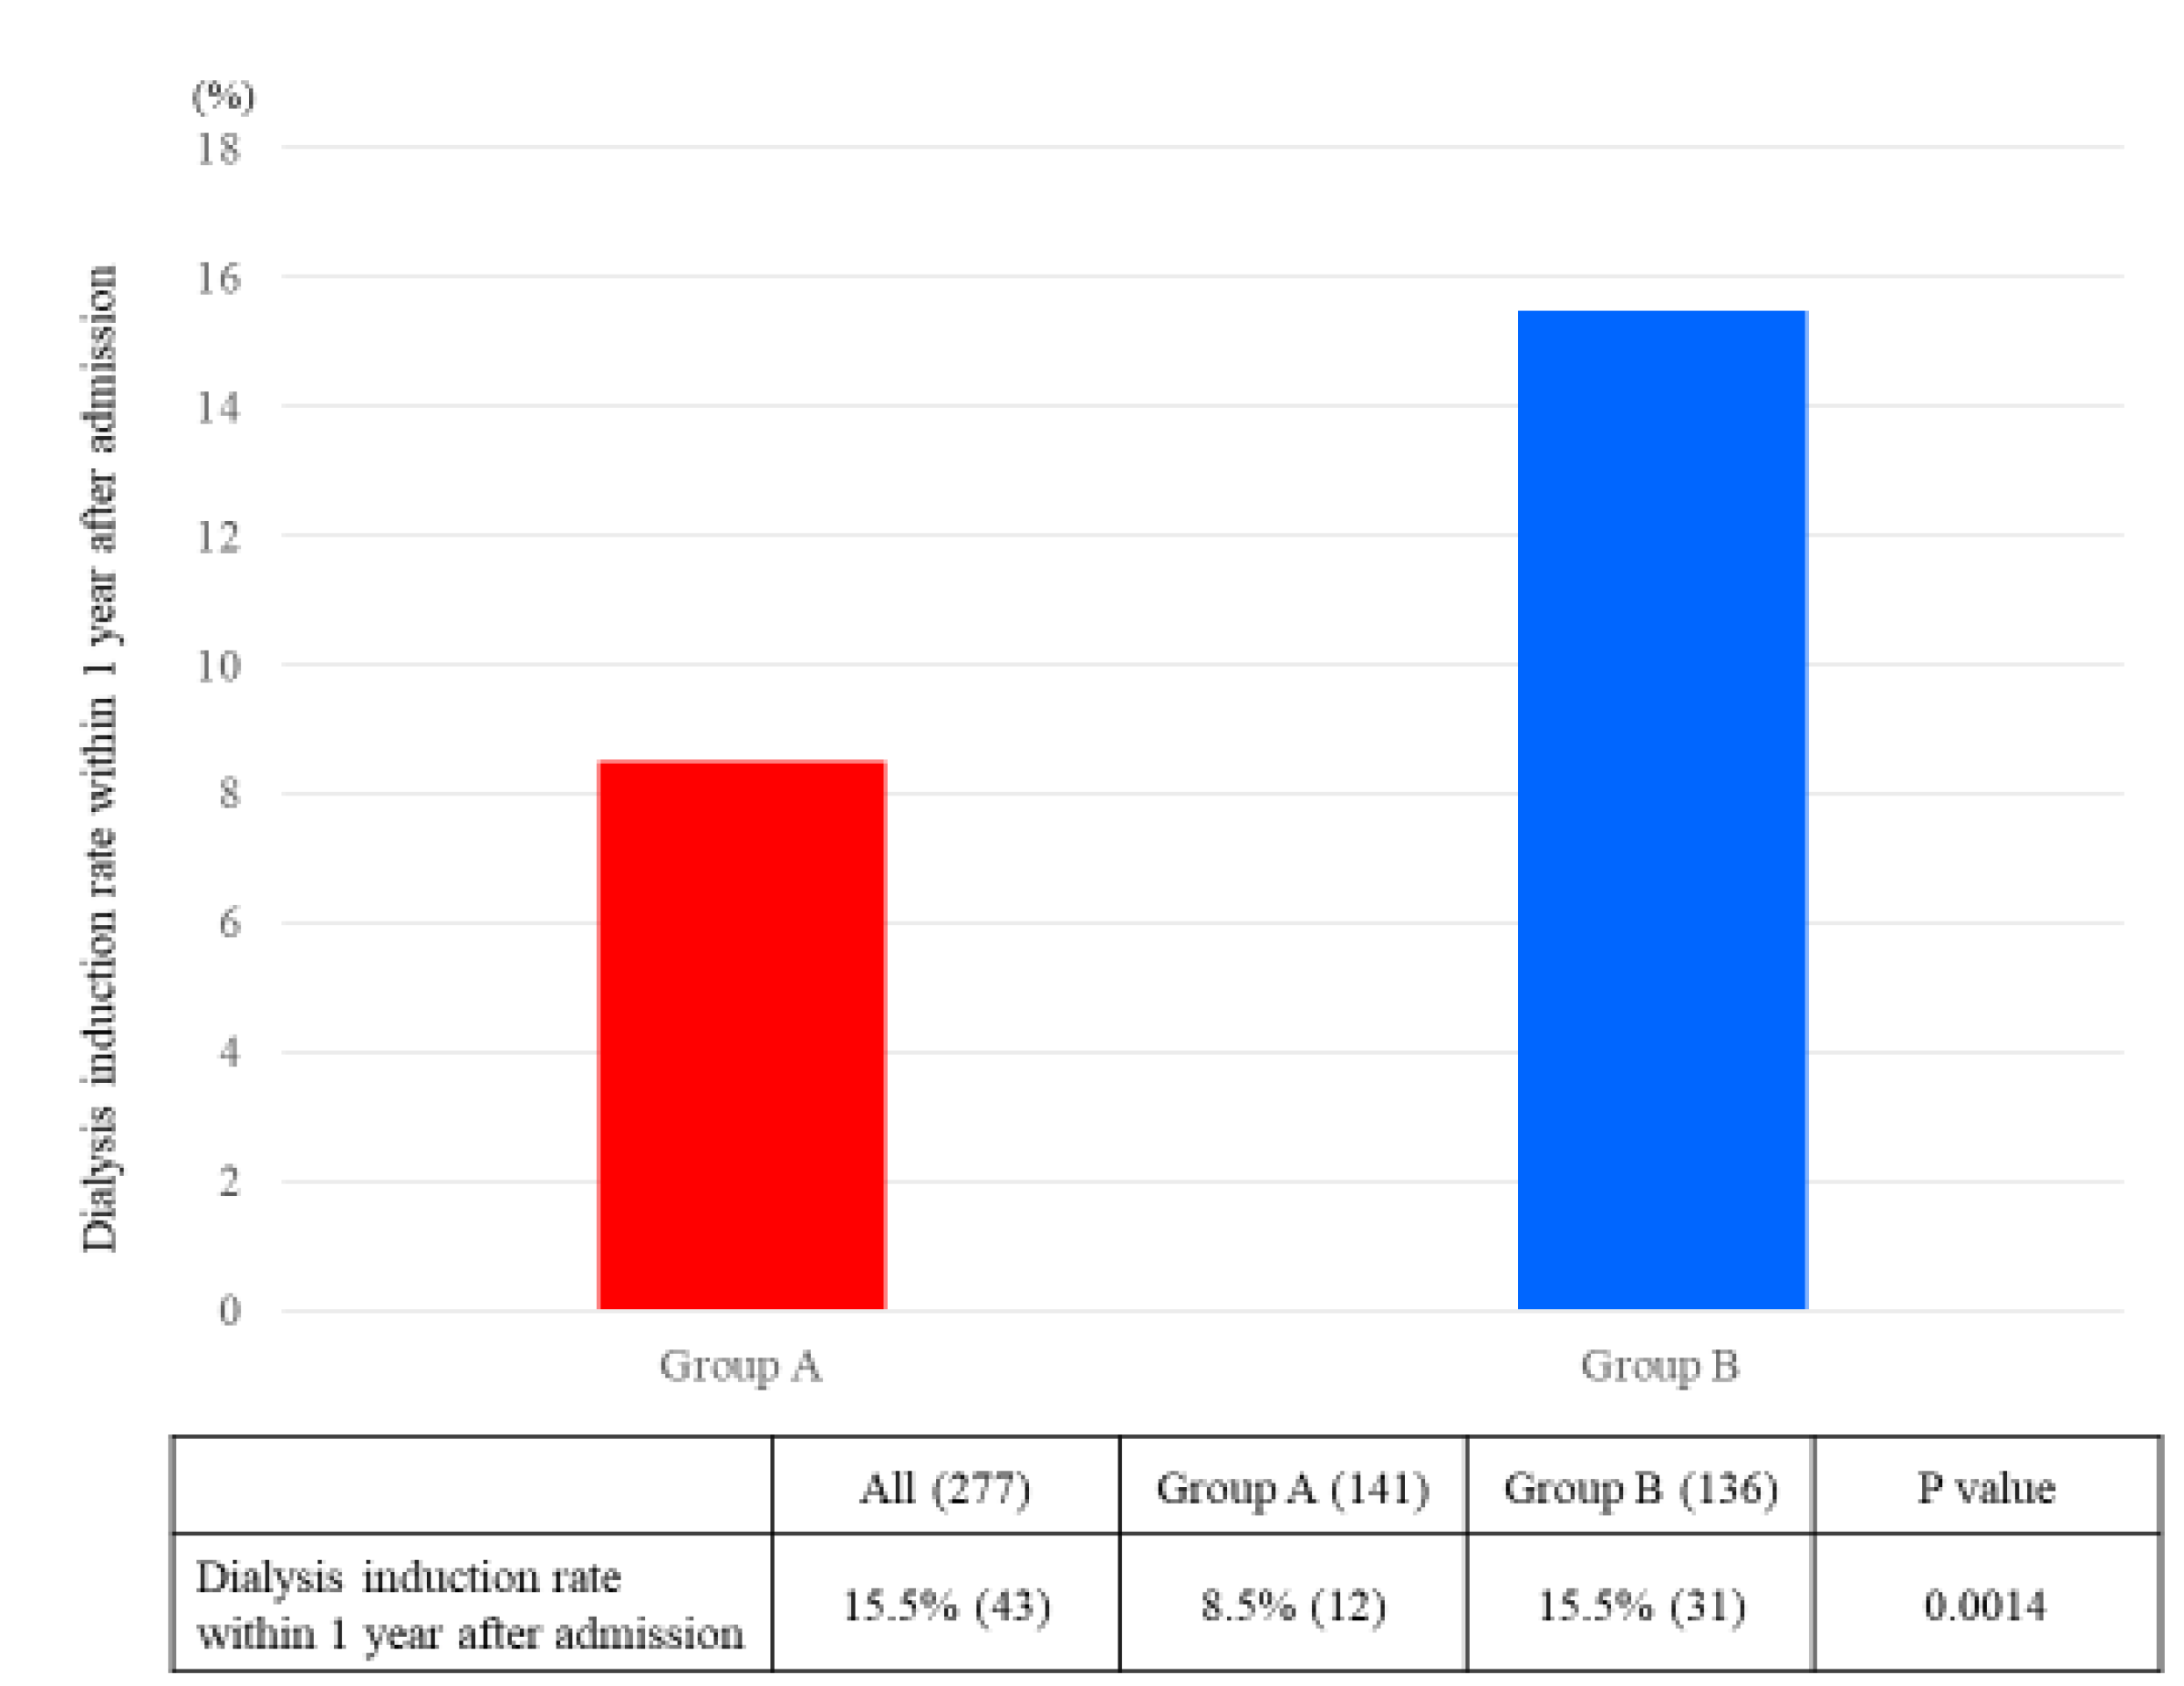
| Dialysis initiation rate, % | 9.5% (10) | 21.0% (22) | 0.40 (0.18–0.89) | 0.03 |
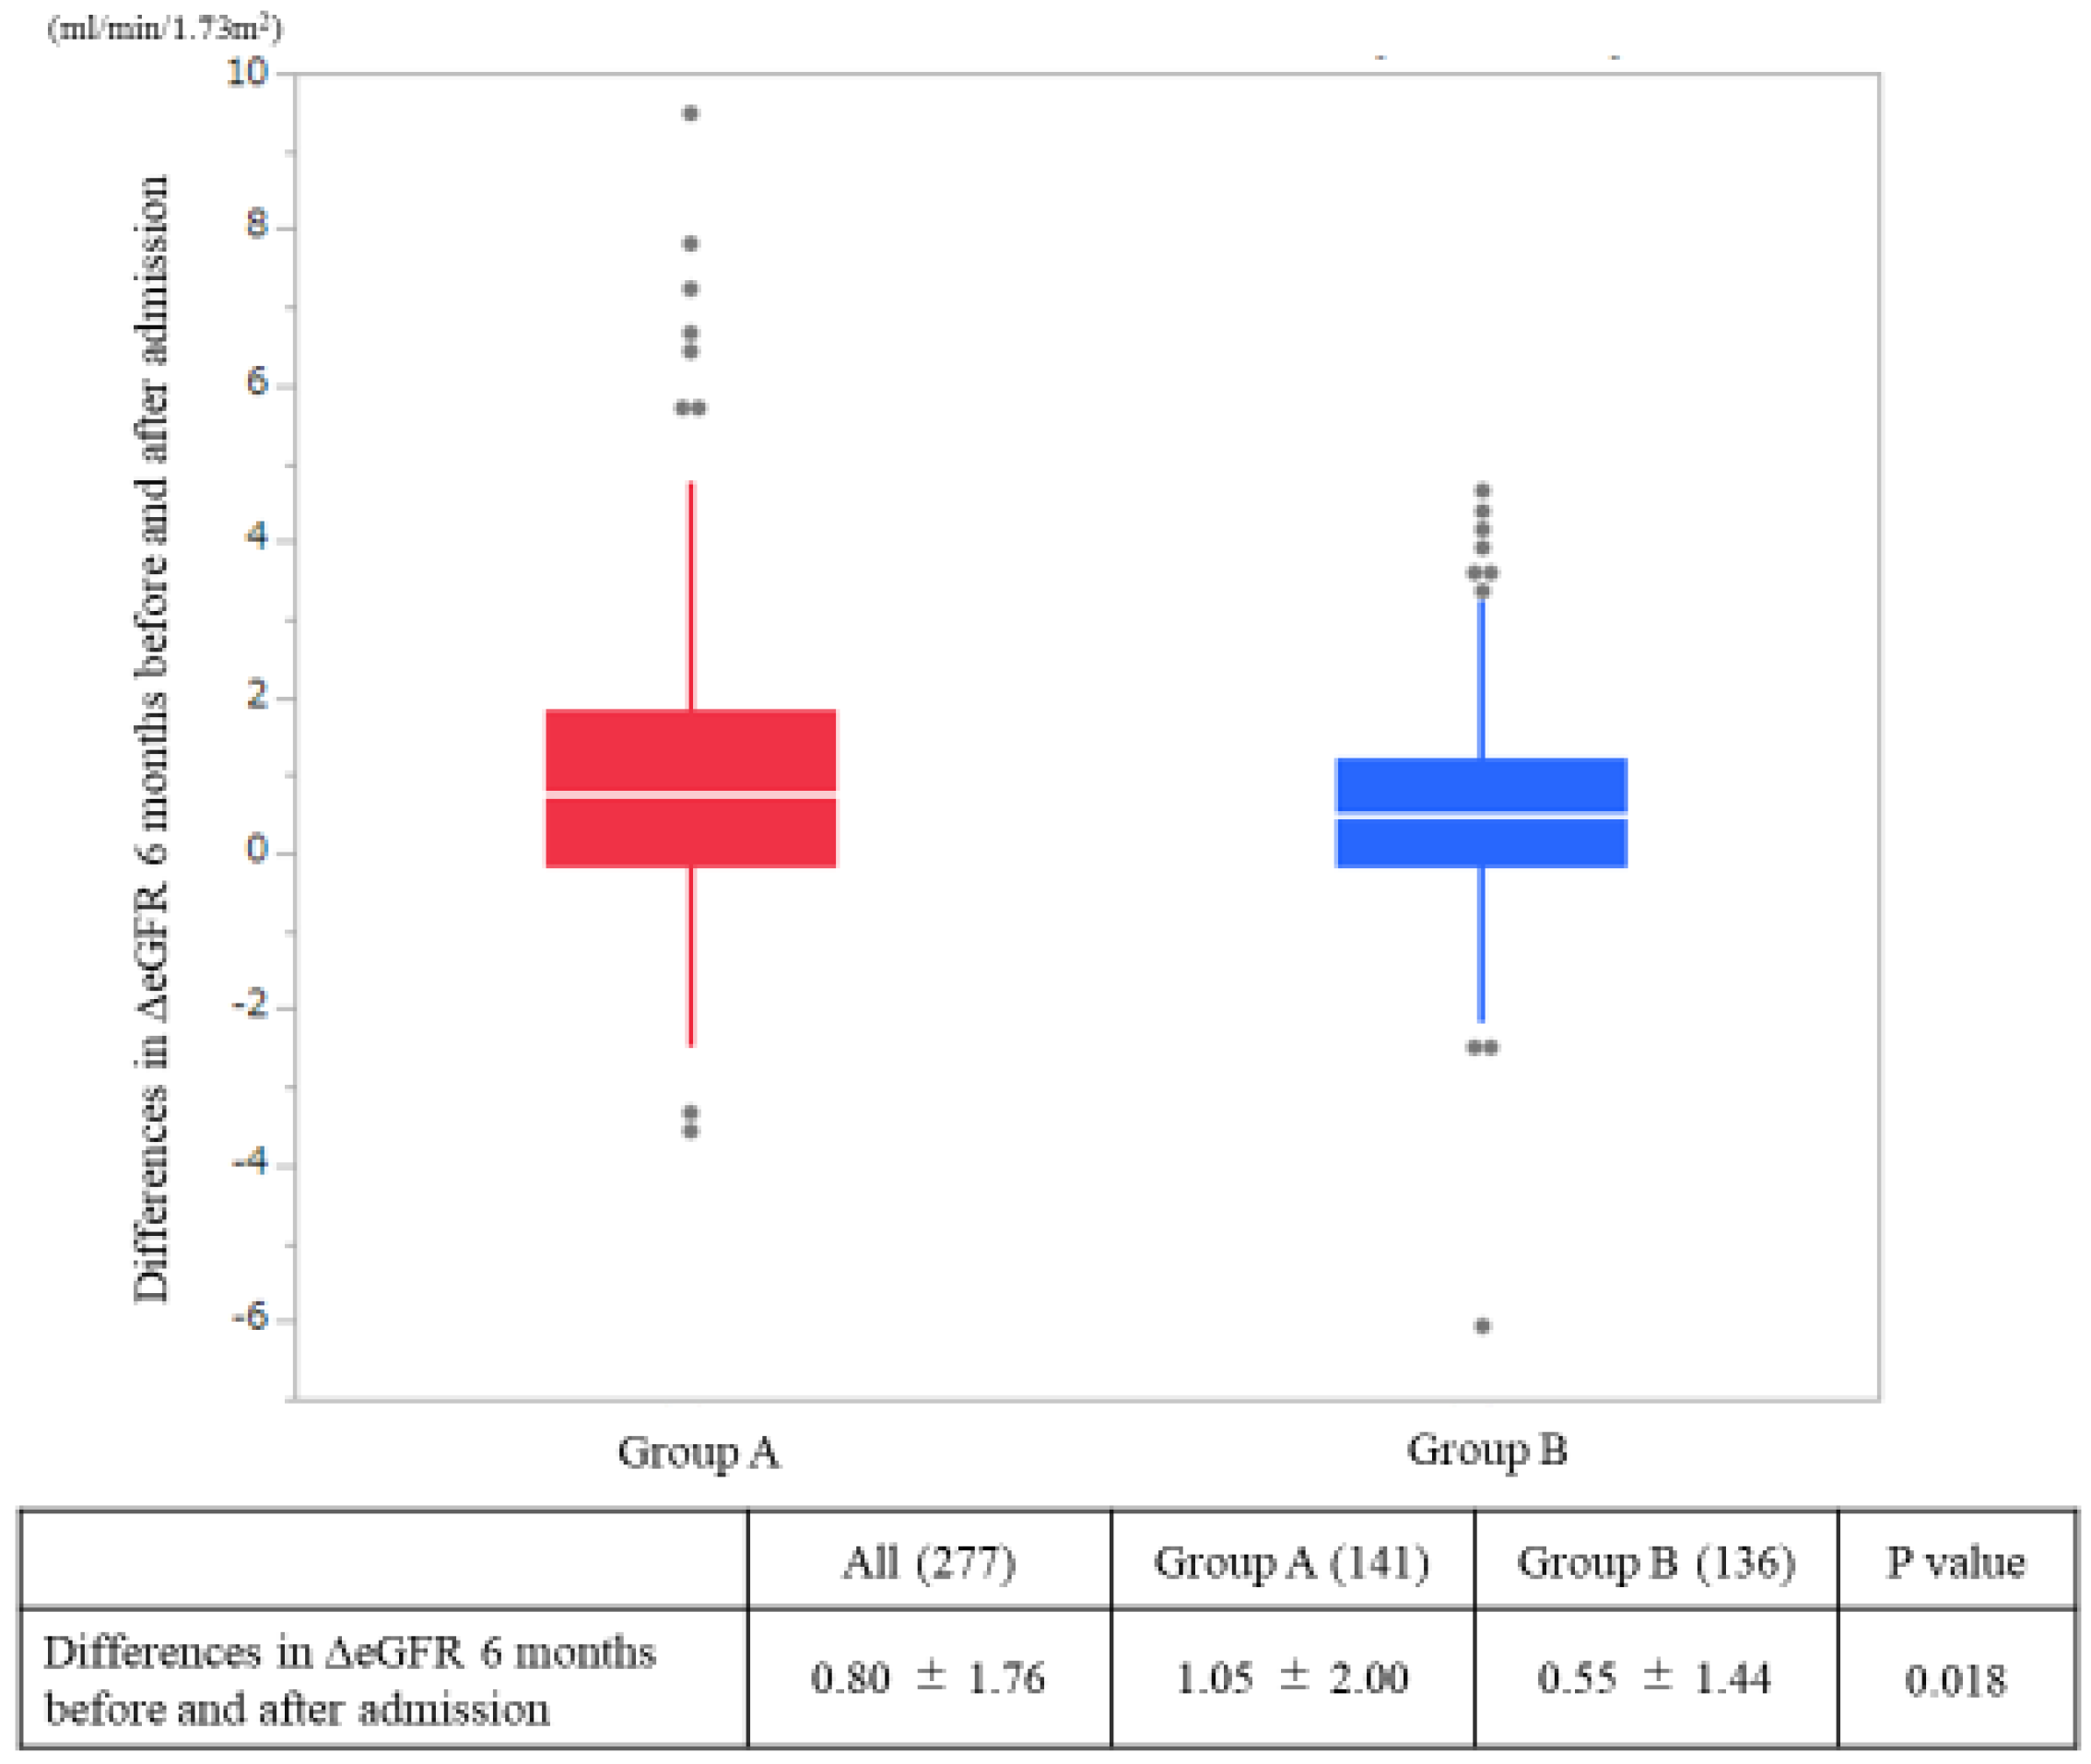
| ΔeGFR at admission and 6 months after admission (mL/min/1.73 m2/month) | 0.94 ± 1.79 | 0.49 ± 1.50 | 0.048 |
| Univariate | Multivariate (Model 1) | Multivariate (Model 2) | |||||||
|---|---|---|---|---|---|---|---|---|---|
| HR | 95% CI | p-Value | HR | 95% CI | p-Value | HR | 95% CI | p-Value | |
| Age, year | 0.99 | 0.96–1.01 | 0.33 | 0.98 | 0.95–1.01 | 0.13 | 0.96 | 0.93–0.99 | 0.01 |
| Male, % | 0.65 | 0.34–1.26 | 0.21 | 0.66 | 0.34–1.30 | 0.24 | 1.15 | 0.53–2.48 | 0.72 |
| Enhanced salt reduction guidance | 0.32 | 0.15–0.64 | 0.001 | 0.30 | 0.14–0.61 | <0.001 | 0.35 | 0.16–0.81 | 0.01 |
| BMI, kg/m2 | 0.91 | 0.83–1.00 | 0.03 | 0.94 | 0.85–1.04 | 0.23 | |||
| eGFR, mL/min/1.73 m2 | 0.82 | 0.77–0.88 | <0.001 | 0.81 | 0.75–0.88 | <0.001 | |||
| Diabetes mellitus, % | 0.98 | 0.51–1.88 | 0.95 | ||||||
| K, mmol/L | 1.37 | 0.81–2.33 | 0.24 | ||||||
| Ca, mg/dL | 0.38 | 0.21–0.69 | 0.002 | ||||||
| P, mg/dL | 1.91 | 1.28–2.86 | 0.001 | ||||||
| UA, mg/dL | 1.03 | 0.83–1.26 | 0.80 | ||||||
| Alb, g/dL | 0.31 | 0.17–0.59 | <0.001 | ||||||
| LDL-C, mg/dL | 0.99 | 0.98–1.00 | 0.18 | ||||||
| HbA1c, % | 0.87 | 0.58–1.30 | 0.48 | ||||||
| Hb, g/dL | 0.61 | 0.49–0.76 | <0.001 | ||||||
| UPCR, g/gCr | 1.37 | 1.21–1.55 | <0.001 | ||||||
| SBP, mmHg | 1.03 | 1.01–1.05 | <0.001 | ||||||
| DBP, mmHg | 1.04 | 1.01–1.07 | 0.002 | ||||||
© 2020 by the authors. Licensee MDPI, Basel, Switzerland. This article is an open access article distributed under the terms and conditions of the Creative Commons Attribution (CC BY) license (http://creativecommons.org/licenses/by/4.0/).
Share and Cite
Ota, Y.; Kitamura, M.; Tsuji, K.; Torigoe, K.; Yamashita, A.; Abe, S.; Muta, K.; Uramatsu, T.; Obata, Y.; Furutani, J.; et al. Risk Reduction for End-Stage Renal Disease by Dietary Guidance Using the Gustatory Threshold Test for Salty Taste. Nutrients 2020, 12, 2703. https://doi.org/10.3390/nu12092703
Ota Y, Kitamura M, Tsuji K, Torigoe K, Yamashita A, Abe S, Muta K, Uramatsu T, Obata Y, Furutani J, et al. Risk Reduction for End-Stage Renal Disease by Dietary Guidance Using the Gustatory Threshold Test for Salty Taste. Nutrients. 2020; 12(9):2703. https://doi.org/10.3390/nu12092703
Chicago/Turabian StyleOta, Yuki, Mineaki Kitamura, Kiyokazu Tsuji, Kenta Torigoe, Ayuko Yamashita, Shinichi Abe, Kumiko Muta, Tadashi Uramatsu, Yoko Obata, Junya Furutani, and et al. 2020. "Risk Reduction for End-Stage Renal Disease by Dietary Guidance Using the Gustatory Threshold Test for Salty Taste" Nutrients 12, no. 9: 2703. https://doi.org/10.3390/nu12092703