The Alignment of Dietary Intake and Symptom-Reporting Capture Periods in Studies Assessing Associations between Food and Functional Gastrointestinal Disorder Symptoms: A Systematic Review

 ,
,  , ,
, , 
Abstract
:1. Introduction
2. Material and Method
2.1. Search Strategy
2.2. Primary and Secondary Outcomes
2.3. Inclusion and Exclusion Criteria
2.3.1. Inclusion Criteria
2.3.2. Exclusion Criteria
2.4. Data Extraction
2.5. Critical Appraisal
2.6. Data Analysis
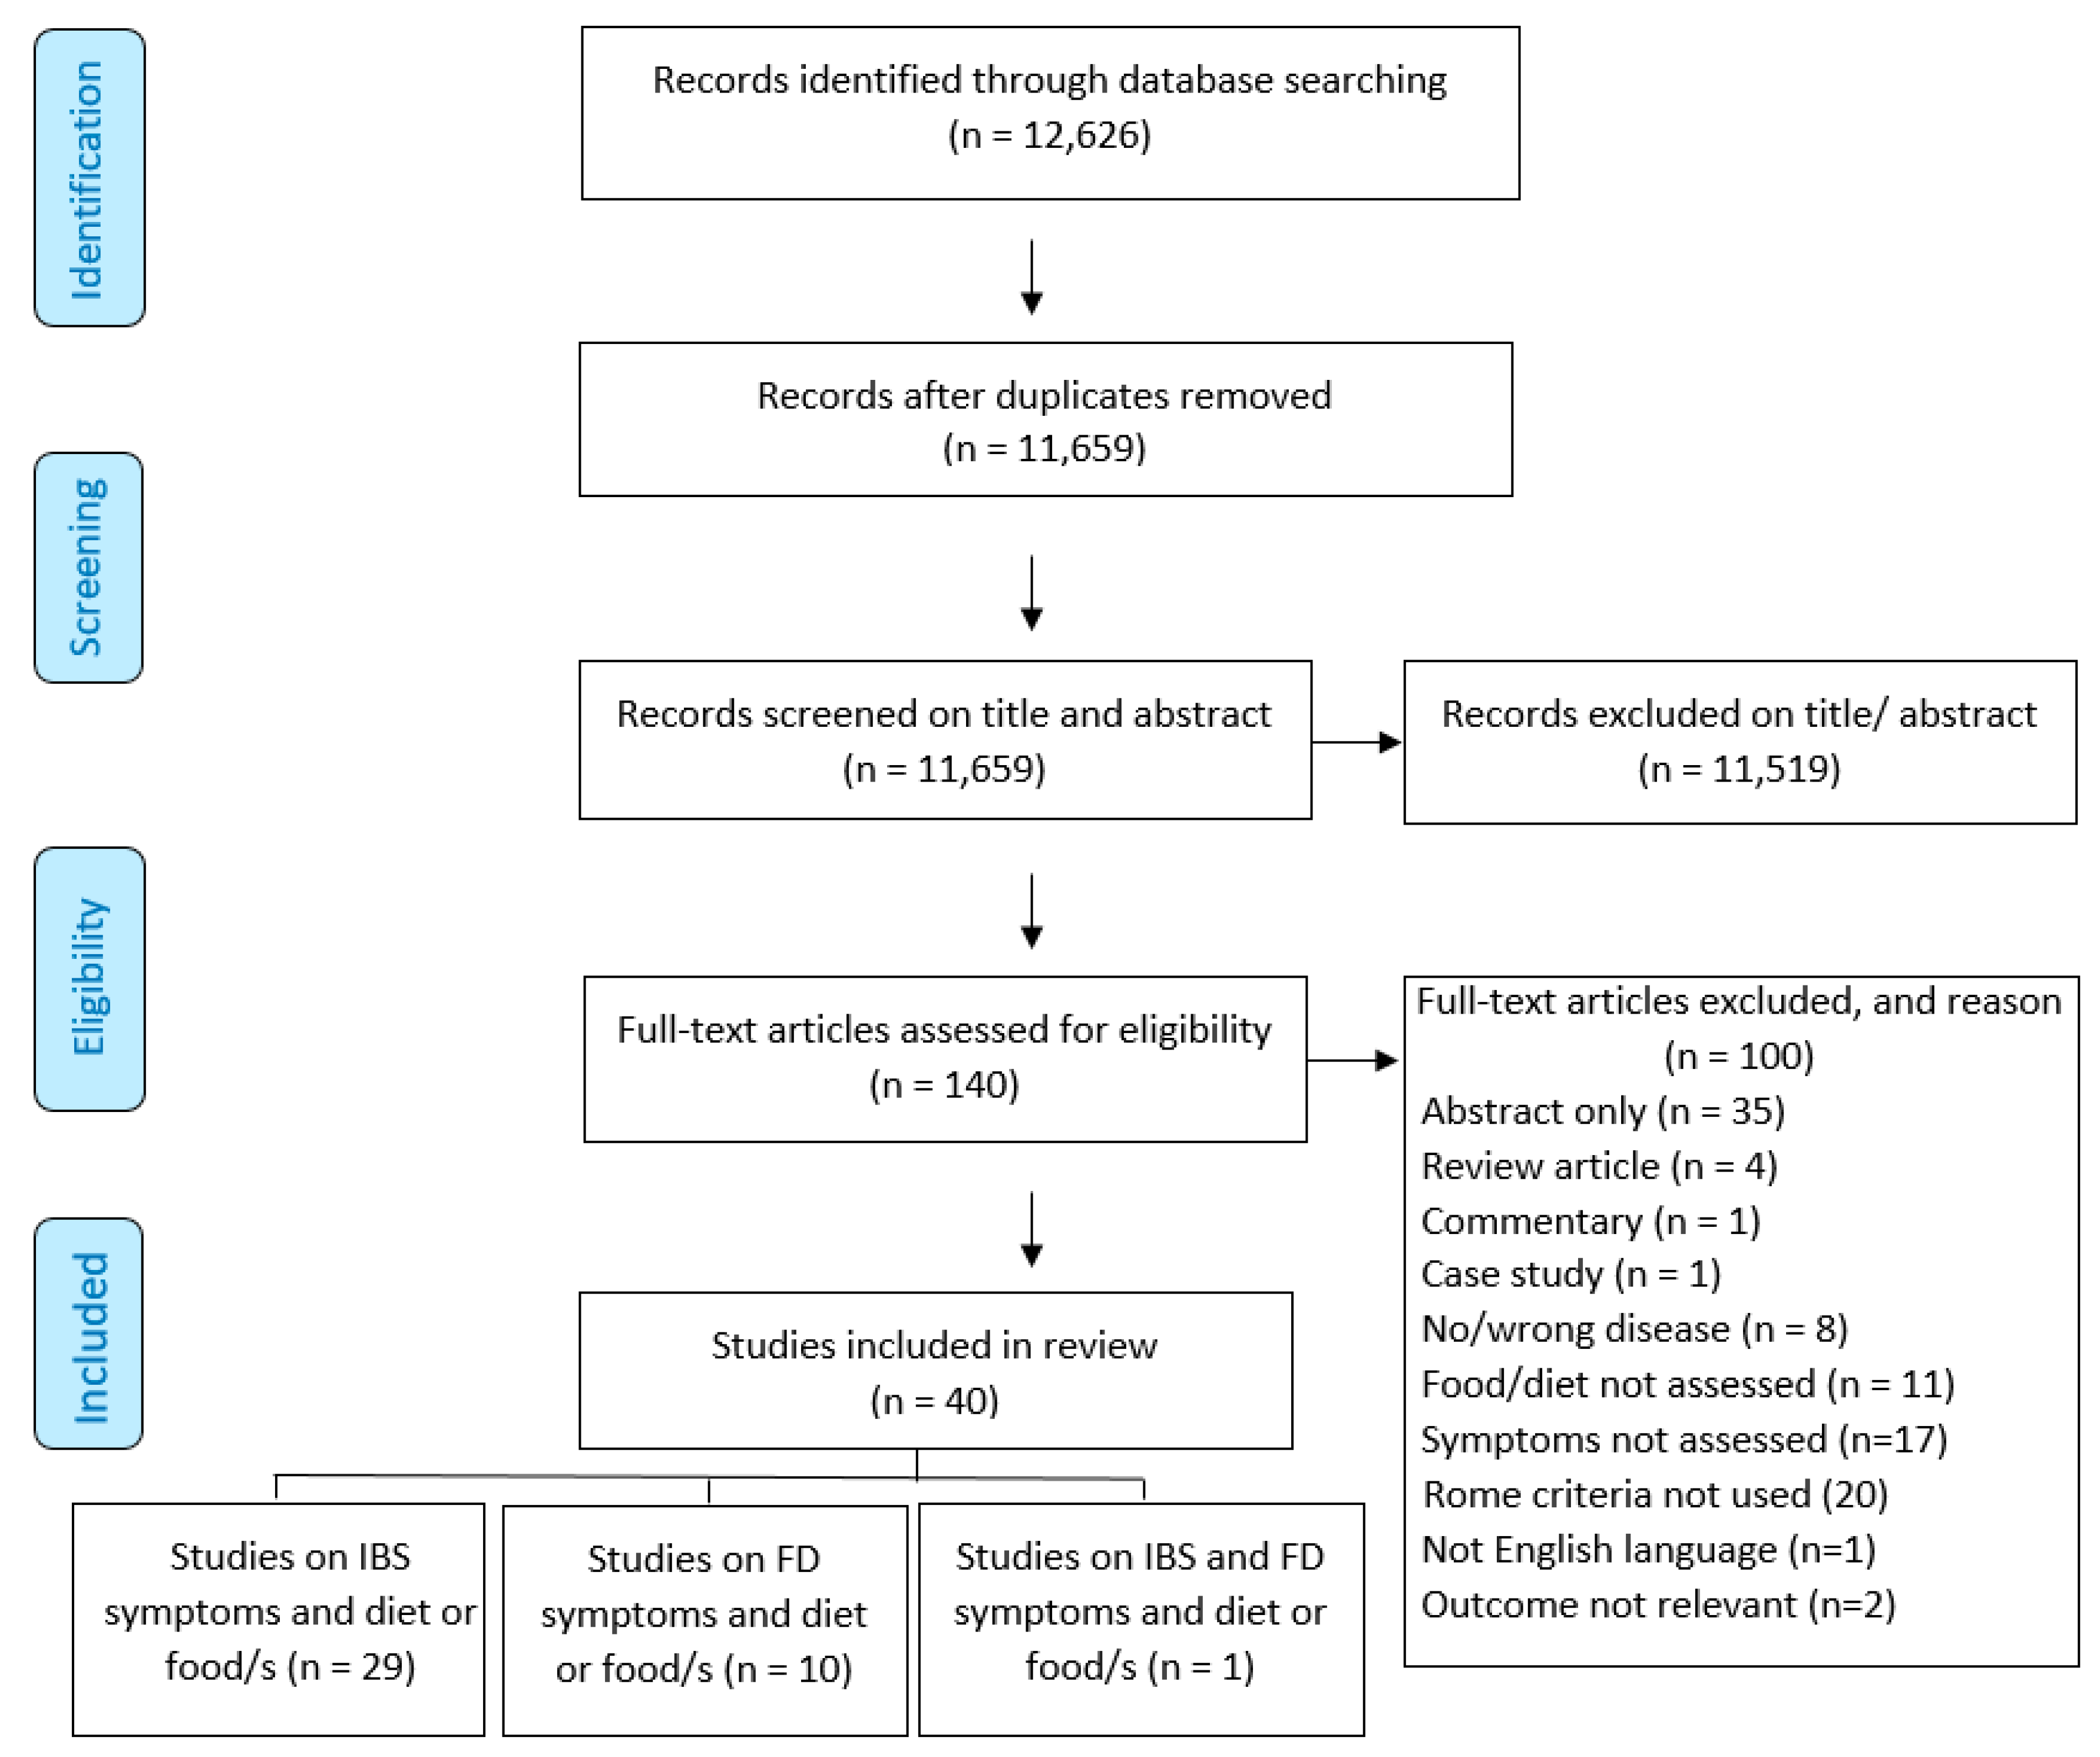
3. Results
3.1. Study Characteristics
3.2. Study Quality
3.3. Functional Gastrointestinal Disorder Diagnosis, Classifications and Symptom-Reporting Methods
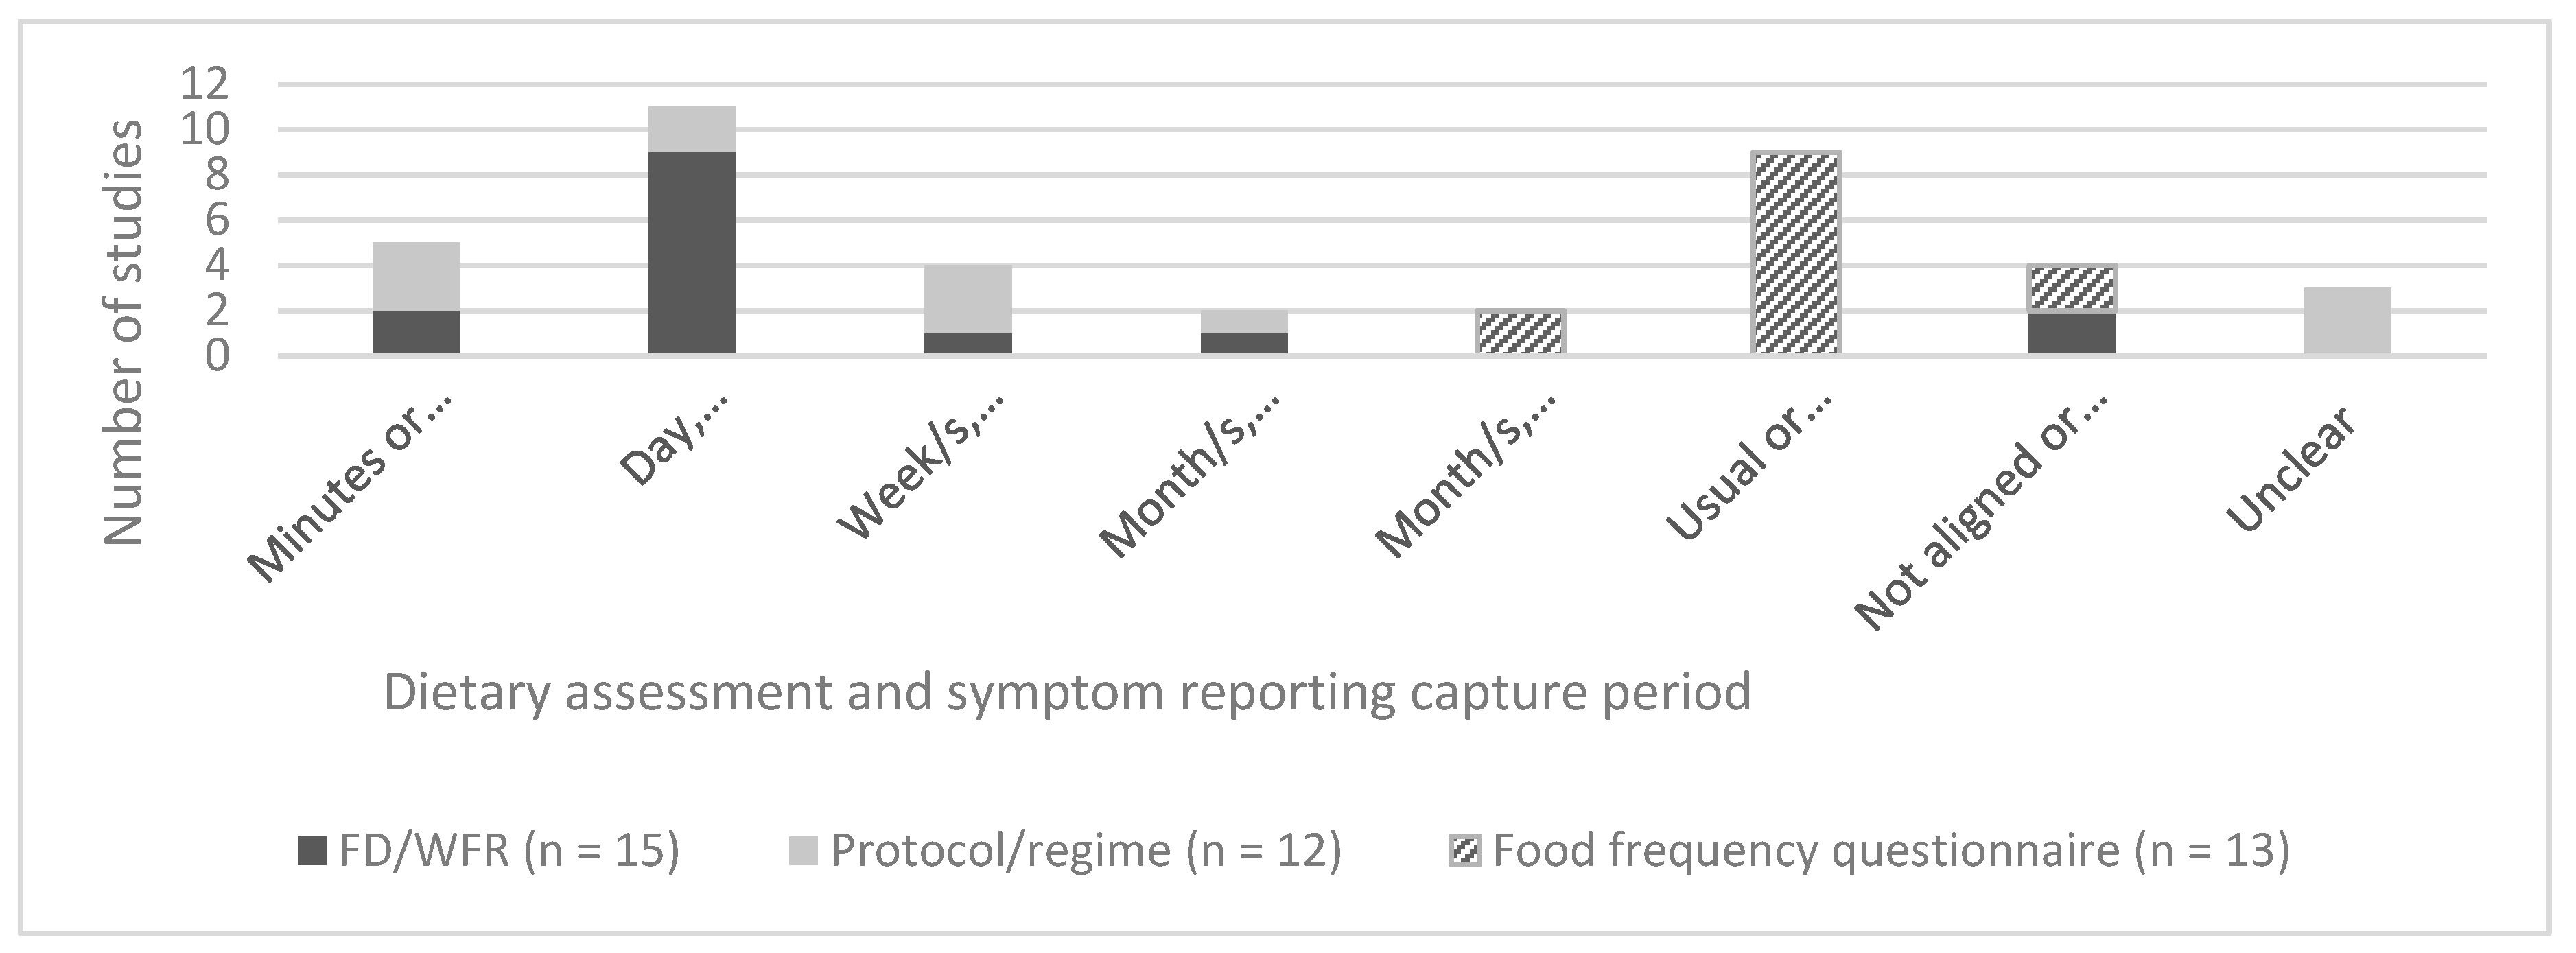
3.4. Dietary Assessment Methods (DAMs)
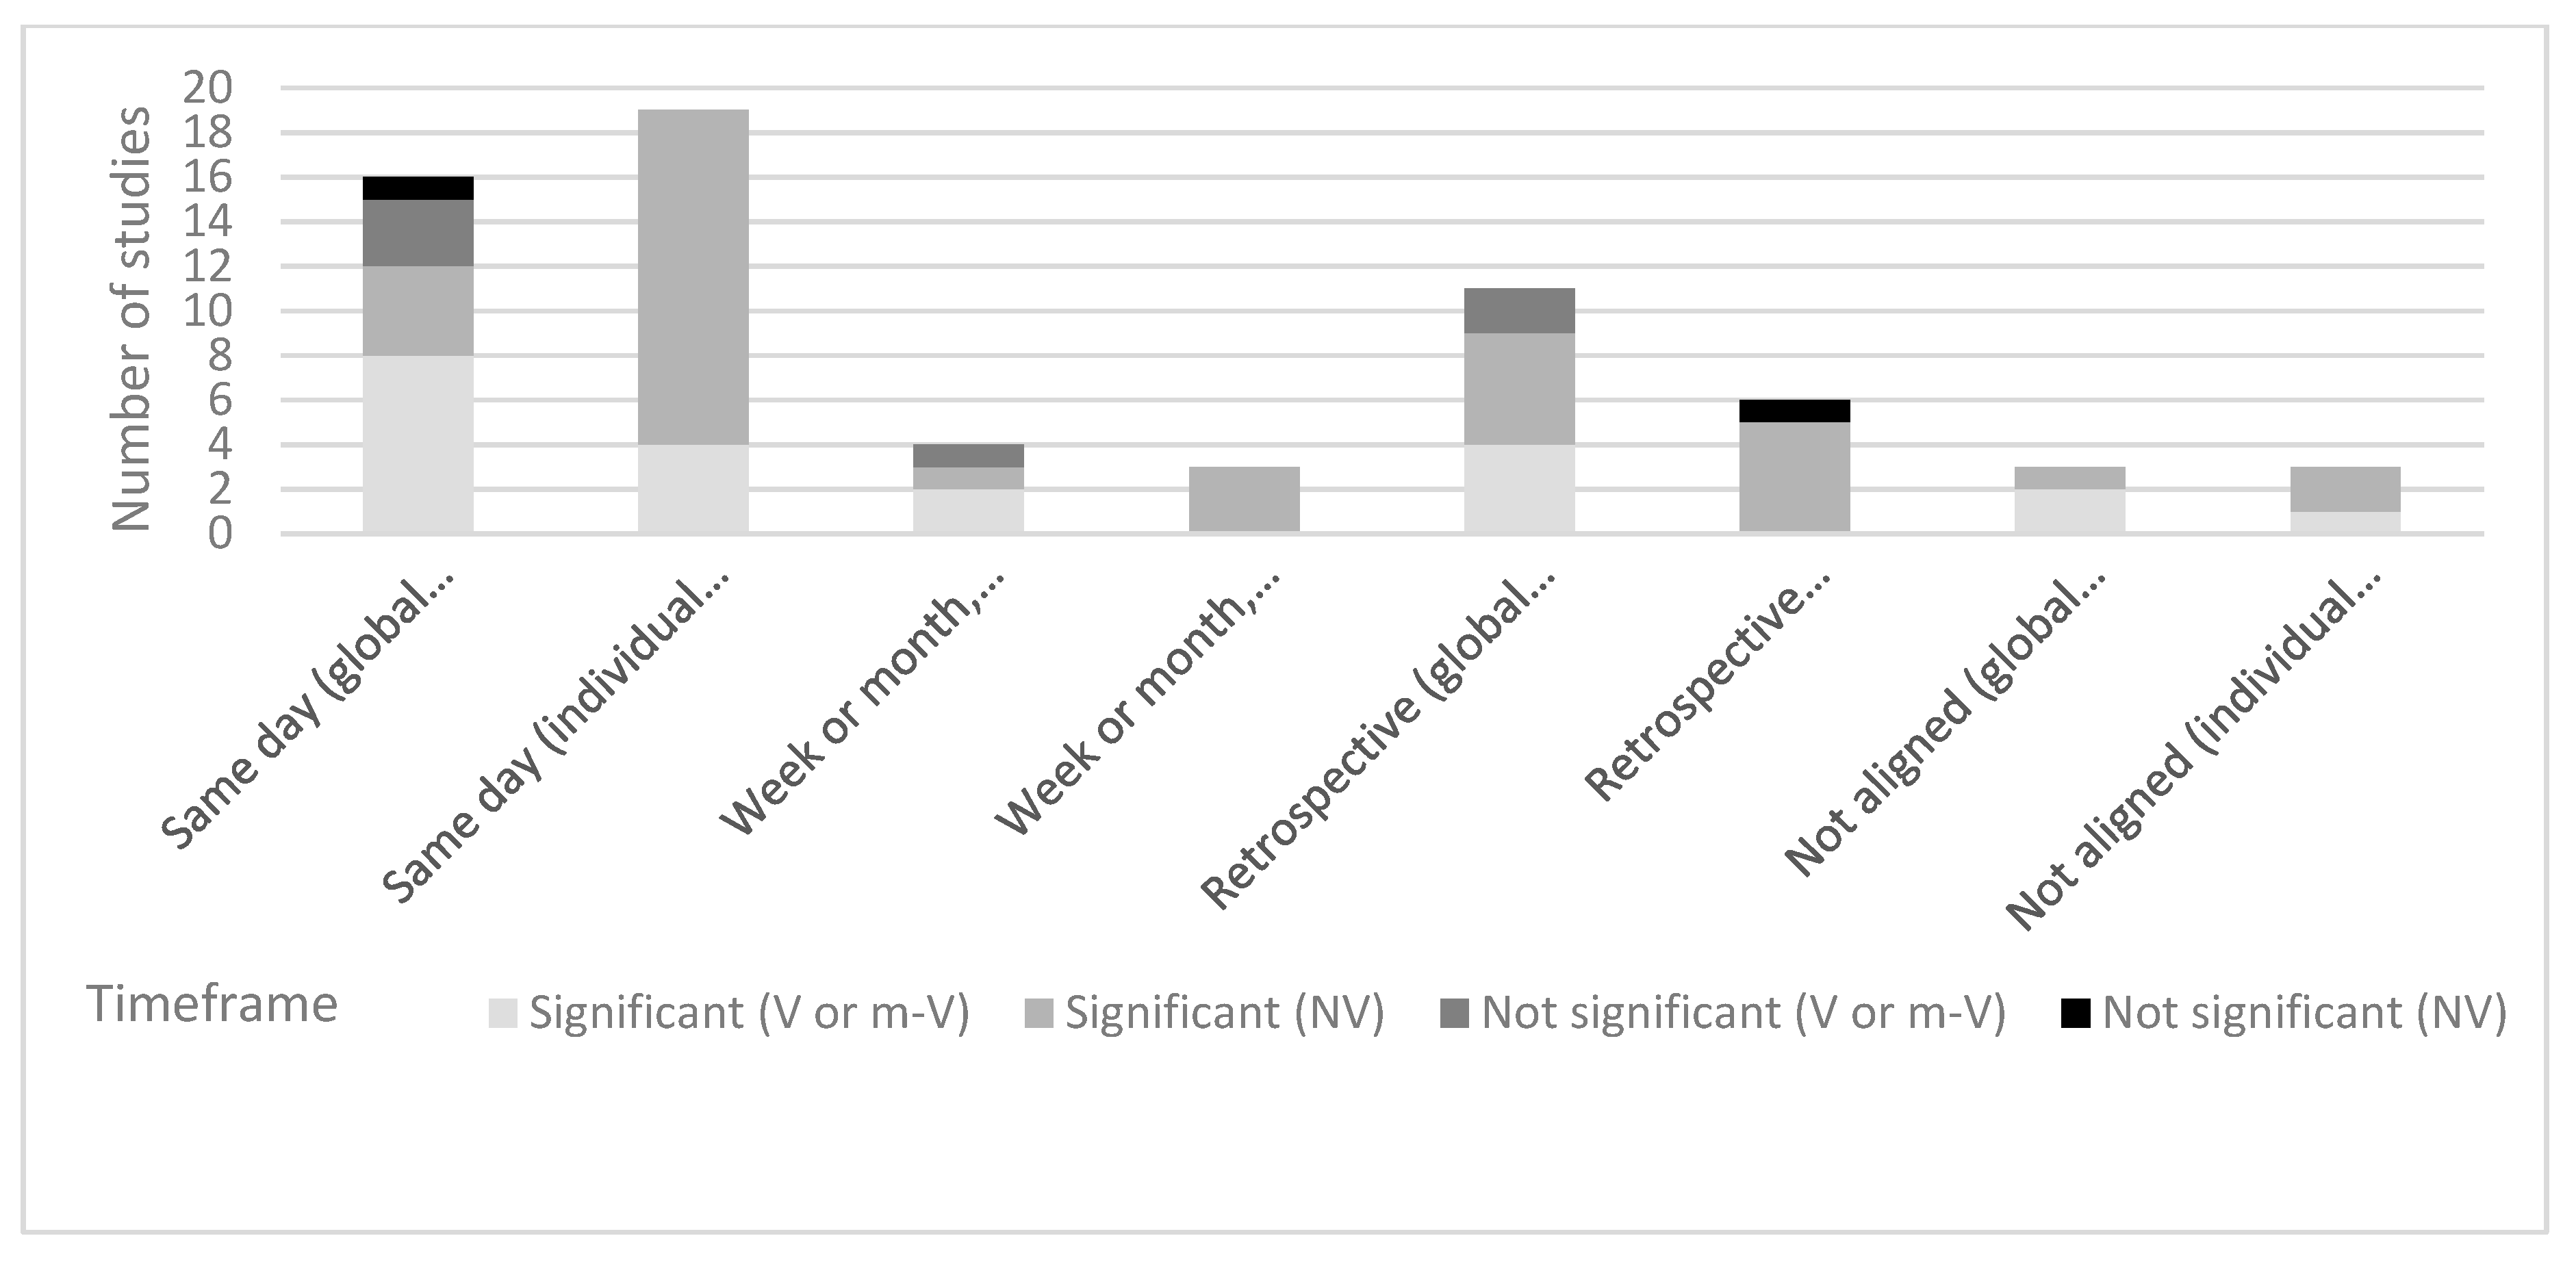
3.5. The Alignment of Dietary Assessment and Symptom Reporting
4. Discussion
- (i)
- An explicit explanation of hypothesised relationship between food and FGID symptoms;
- (ii)
- A clear differentiation between assessment of global symptomology and presence or induction of individual symptom;
- (iii)
- The selection of symptom-reporting tools be based on whether the study is investigating symptom induction versus presence (or retrospective assessment) of symptoms;
- (iv)
- The use of symptom-reporting tools that have been validated for use over the timeframe they were implemented (wherever possible);
- (v)
- The selection of appropriate dietary assessment methodologies and the implementation of these methods by researchers with dietary assessment expertise;
- (vi)
- The explicit explanation of the rationale for selected dietary assessment methodology, including the hypothesised association with symptom induction and the food composition database (and included nutrients) used for nutrient analysis;
- (vii)
- For dietary protocol implementation studies, more detailed reporting of dietary intake assessment than reporting of adherence alone;
- (viii)
- Protocols for the assessment of symptom induction in free-living settings, including dietary assessment methods that have a low participant and research burden but high specificity and sensitivity;
- (ix)
- The reporting of both significant and non-significant findings to reduce reporting bias.
Conclusions
5. Limitations
Supplementary Materials
Author Contributions
Funding
Acknowledgments
Conflicts of Interest
References
- Boyce, P.; Talley, N.; Burke, C.; Koloski, N. Epidemiology of the functional gastrointestinal disorders diagnosed according to Rome II criteria: An Australian population-based study. Int. Med. J 2006, 36, 28–36. [Google Scholar] [CrossRef]
- Koloski, N.A.; Talley, N.J.; Boyce, P.M. Epidemiology and health care seeking in the functional GI disorders: A population-based study. Am. J. Gastroenterol. 2002, 97, 2290–2299. [Google Scholar] [CrossRef]
- Drossman, D.A. Functional Gastrointestinal Disorders: History, Pathophysiology, Clinical Features, and Rome IV. Gastroenterology 2016, 150, 1262–1279. [Google Scholar] [CrossRef]
- Stanghellini, V.; Chan, F.K.; Hasler, W.L.; Malagelada, J.R.; Suzuki, H.; Tack, J.; Talley, N.J. Gastroduodenal Disorders. Gastroenterology 2016, 150, 1380–1392. [Google Scholar] [CrossRef]
- Longstreth, G.; Thompson, W.; Chey, W. Functional bowel disorders. Gastroenterology 2006, 130, 1480–1491. [Google Scholar] [CrossRef]
- Tack, J.; Talley, N.; Camilleri, M.; Holtmann, G.; Hu, P.; Malagelada, J.; Stanghellini, V. Functional gastroduodenal disorders. Gastroenterology 2006, 130, 1466–1479. [Google Scholar] [CrossRef]
- Drossman, D.A.; Hasler, W.L. Rome IV-Functional GI Disorders: Disorders of Gut-Brain Interaction. Gastroenterology 2016, 150, 1257–1261. [Google Scholar] [CrossRef]
- Mearin, F.; Lacy, B.E.; Chang, L.; Chey, W.D.; Lembo, A.J.; Simren, M.; Spiller, R. Bowel Disorders. Gastroenterology 2016. [Google Scholar] [CrossRef]
- Irvine, E.J.; Whitehead, W.E.; Chey, W.D.; Matsueda, K.; Shaw, M.; Talley, N.J.; van Zanten, S.J.V. Design of treatment trials for functional gastrointestinal disorders. Gut Liver 1999, 45, 69–77. [Google Scholar]
- Bijkerk, C.J.; De Wit, N.J.; Muris, J.W.M.; Jones, R.H.; Knottnerus, J.A.; Hoes, A.W. Outcome measures in irritable bowel syndrome: Comparison of psychometric and methodological characteristics. Am. J. Gastroenterol. 2003, 98, 122–127. [Google Scholar] [CrossRef]
- Duncanson, K.; Talley, N.; Walker, M.; Burrows, T. Food and functional dyspepsia: A systematic review. J. Hum. Nutr. Diet. 2018, 31, 390–407. [Google Scholar] [CrossRef] [PubMed]
- Farré, R.; Tack, J. Food and symptom generation in functional gastrointestinal disorders: Physiological aspects. Am. J. Gastroenterol. 2013, 108, 698–706. [Google Scholar] [CrossRef] [PubMed]
- Carbone, F.; Holvoet, L.; Tack, J. Rome III functional dyspepsia subdivision in PDS and EPS: Recognizing postprandial symptoms reduces overlap. Neurogastroenterol. Motil. 2015, 27, 1069–1074. [Google Scholar] [CrossRef] [PubMed]
- Bisschops, R.; Karamanolis, G.; Arts, J.; Caenepeel, P.; Verbeke, K.; Janssens, J.; Tack, J. Relationship between symptoms and ingestion of a meal in functional dyspepsia. Gut 2008, 57, 1495–1503. [Google Scholar] [CrossRef]
- Posserud, I.; Strid, H.; Störsrud, S.; Törnblom, H.; Svensson, U.; Tack, J.; Van Oudenhove, L.; Simrén, M. Symptom pattern following a meal challenge test in patients with irritable bowel syndrome and healthy controls. United Eur. Gastroenterol. J. 2013, 1, 358–367. [Google Scholar] [CrossRef] [Green Version]
- McKenzie, Y.; Bowyer, R.; Leach, H.; Gulia, P.; Horobin, J.; O’Sullivan, N.; Pettitt, C.; Reeves, L.; Seamark, L.; Williams, M. British Dietetic Association systematic review and evidence-based practice guidelines for the dietary management of irritable bowel syndrome in adults (2016 update). J. Hum. Nutr. Diet. 2016, 29, 549–575. [Google Scholar] [CrossRef] [Green Version]
- Rollo, M.E.; Williams, R.L.; Burrows, T.; Kirkpatrick, S.I.; Bucher, T.; Collins, C.E. What are they really eating? A review on new approaches to dietary intake assessment and validation. Curr. Nutr. Rep. 2016, 5, 307–314. [Google Scholar] [CrossRef]
- Gibson, R.S. Principles of Nutritional Assessment; Oxford University Press: New York, NY, USA, 2005. [Google Scholar]
- Moher, D.; Liberati, A.; Tetzlaff, J.; Altman, D.; Group, T.P. Preferred Reporting Items for Systematic Reviews and Meta-Analyses: The PRISMA Statement. PLoS Med. 2009, 6, e1000097. [Google Scholar] [CrossRef]
- Academy of Nutrition and Dietetics. Evidence Analysis Manual: Steps in the Academy Evidence Analysis Process; Academy of Nutrition and Dietetics: Chicago, IL, USA, 2016. [Google Scholar]
- Akhondi-Meybodi, M.; Aghaei, M.A.; Hashemian, Z. The role of diet in the management of non-ulcer dyspepsia. Middle East J. 2015, 7, 19–24. [Google Scholar]
- Aller, R.; de Luis, D.A.; Izaola, O.; la Calle, F.; del Olmo, L.; Fernandez, L.; Arranz, T.; Gonzalez Hernandez, J.M. Effects of a high-fiber diet on symptoms of irritable bowel syndrome: A randomized clinical trial. Nutrition 2004, 20, 735–737. [Google Scholar] [CrossRef]
- Aydinlar, E.; Dikmen, P.; Tiftikci, A.; Saruc, M.; Aksu, M.; Gunsoy, H.; Tozun, N. IgG-based elimination diet in migraine plus irritable bowel syndrome. Headache 2013, 53, 514–525. [Google Scholar] [CrossRef] [PubMed]
- Azpiroz, F.; Hernandez, C.; Guyonnet, D.; Accarino, A.; Santos, J.; Malagelada, J.R.; Guarner, F. Effect of a low-flatulogenic diet in patients with flatulence and functional digestive symptoms. Neurogastroenterol. Motil. 2014, 26, 779–785. [Google Scholar] [CrossRef] [PubMed]
- Bijkerk, C.; Wit, N.; Muris, J.; Whorwell, P.; Knottnerus, J.; Hoes, A. Soluble or insoluble fibre in irritable bowel syndrome in primary care? Randomised placebo controlled trial. BMJ 2009, 339, b3154. [Google Scholar] [CrossRef] [PubMed]
- Bohn, L.; Storsrud, S.; Liljebo, T.; Collin, L.; Lindfors, P.; Tornblom, H.; Simren, M. Diet low in FODMAPs reduces symptoms of irritable bowel syndrome as well as traditional dietary advice: A randomized controlled trial. Gastroenterology 2015, 149, 1399.e2–1407.e2. [Google Scholar] [CrossRef] [PubMed]
- Bohn, L.; Storsrud, S.; Simren, M. Nutrient intake in patients with irritable bowel syndrome compared with the general population. Neurogastroenterol. Motil. 2013, 25, 23.e21–30.e21. [Google Scholar] [CrossRef] [PubMed]
- Eswaran, S.L.; Chey, W.D.; Han-Markey, T.; Ball, S.; Jackson, K. A randomized controlled trial comparing the low FODMAP diet vs. modified NICE guidelines in US adults with IBS-D. Am. J. Gastroenterol. 2016, 111, 1824–1832. [Google Scholar] [CrossRef]
- Filipovic, B.F.; Randjelovic, T.; Kovacevic, N.; Milinic, N.; Markovic, O.; Gajic, M.; Filipovic, B.R. Laboratory parameters and nutritional status in patients with functional dyspepsia. Eur. J. Inter. Med. 2011, 22, 300–304. [Google Scholar] [CrossRef]
- Goktas, Z.; Koklu, S.; Dikmen, D.; Ozturk, O.; Yilmaz, B.; Asil, M.; Korkmaz, H.; Tuna, Y.; Kekilli, M.; Karamanoglu Aksoy, E.; et al. Nutritional habits in functional dyspepsia and its subgroups: A comparative study. Scand. J. Gastroenterol. 2016, 51, 903–907. [Google Scholar] [CrossRef]
- Halmos, E.P.; Power, V.A.; Shepherd, S.J.; Gibson, P.R.; Muir, J.G. A diet low in FODMAPs reduces symptoms of irritable bowel syndrome. Gastroenterology 2014, 146, 67.e65–75.e65. [Google Scholar] [CrossRef]
- Harvie, R.M.; Chisholm, A.W.; Bisanz, J.E.; Burton, J.P.; Herbison, P.; Schultz, K.; Schultz, M. Long-term irritable bowel syndrome symptom control with reintroduction of selected FODMAPs. World J. Gastroenterol. 2017, 23, 4632–4643. [Google Scholar] [CrossRef]
- Hayes, P.; Corish, C.; O’mahony, E.; Quigley, E. A dietary survey of patients with irritable bowel syndrome. J. Hum. Nutr. Diet. 2014, 27, 36–47. [Google Scholar] [CrossRef] [PubMed]
- Hustoft, T.; Hausken, T.; Ystad, S.; Valeur, J.; Brokstad, K.; Hatlebakk, J.; Lied, G. Effects of varying dietary content of fermentable short-chain carbohydrates on symptoms, fecal microenvironment, and cytokine profiles in patients with irritable bowel syndrome. Neurogastroenterol. Motil. 2017, 29, e12969. [Google Scholar] [CrossRef] [PubMed]
- Laatikainen, R.; Koskenpato, J.; Hongisto, S.M.; Loponen, J.; Poussa, T.; Hillila, M.; Korpela, R. Randomised clinical trial: Low-FODMAP rye bread vs. regular rye bread to relieve the symptoms of irritable bowel syndrome. Aliment. Pharmacol. Ther. 2016, 44, 460–470. [Google Scholar] [CrossRef] [PubMed]
- Lee, K.; Kim, J.; Cho, S. Dietary influence on electro-gastrography and association of alterations in gastric myoelectrical activity with symptoms in patients with functional dyspepsia. J. Gastroenterol. Hepatol. 2006, 21, 59–64. [Google Scholar] [CrossRef] [PubMed]
- Lee, S.Y.; Masaoka, T.; Han, H.; Matsuzaki, J.; Hong, M.; Fukuhara, S.; Choi, H.; Suzuki, H. A prospective study on symptom generation according to spicy food intake and TRPV 1 genotypes in functional dyspepsia patients. Neurogastroenterol. Motil. 2016, 28, 1401–1408. [Google Scholar] [CrossRef]
- Ligaarden, S.; Farup, P. Low intake of vitamin B6 is associated with irritable bowel syndrome symptoms. Nutr. Res. 2011, 31, 356–361. [Google Scholar] [CrossRef]
- Ligaarden, S.C.; Lydersen, S.; Farup, P.G. Diet in subjects with irritable bowel syndrome: A cross-sectional study in the general population. BMC Gastroenterol. 2012, 12. [Google Scholar] [CrossRef]
- Maagaard, L.; Ankersen, D.V.; Vegh, Z.; Burisch, J.; Jensen, L.; Pedersen, N.; Munkholm, P. Follow-up of patients with functional bowel symptoms treated with a low FODMAP diet. World J. Gastroenterol. 2016, 22, 4009–4019. [Google Scholar] [CrossRef]
- Mazzawi, T.; Hausken, T.; Gundersen, D.; El-Salhy, M. Effects of dietary guidance on the symptoms, quality of life and habitual dietary intake of patients with irritable bowel syndrome. Mol. Med. Rep. 2013, 8, 845–852. [Google Scholar] [CrossRef] [Green Version]
- Moritz, K.; Hemmer, W.; Jung, P.; Sesztak-Greinecker, G.; Götz, M.; Jarisch, R.; Wantke, F. Effect of a fructose and lactose elimination diet in patients with irritable bowel syndrome: A randomized double-blind placebo-controlled study. J. Gastroenterol. Hepatol. Res. 2013, 2, 833–839. [Google Scholar]
- Ong, D.; Mitchell, S.; Barrett, J.; Shepherd, S.; Irving, P.; Biesiekierski, J.R.; Smith, S.; Gibson, P.; Muir, J. Manipulation of dietary short chain carbohydrates alters the pattern of gas production and genesis of symptoms in irritable bowel syndrome. J. Gastroenterol. Hepatol. 2010, 25, 1366–1373. [Google Scholar] [CrossRef] [PubMed]
- Østgaard, H.; Hausken, T.; Gundersen, D.; El-Salhy, M. Diet and effects of diet management on quality of life and symptoms in patients with irritable bowel syndrome. Mol. Med. Rep. 2012, 5, 1382–1390. [Google Scholar] [PubMed] [Green Version]
- Park, H.J.; Jarrett, M.; Heitkemper, M. Quality of life and sugar and fiber intake in women with irritable bowel syndrome. West J. Nurs. Res. 2010, 32, 218–232. [Google Scholar] [CrossRef] [PubMed]
- Parker, T.; Woolner, J.; Prevost, A.; Tuffnell, Q.; Shorthouse, M.; Hunter, J. Irritable bowel syndrome: Is the search for lactose intolerance justified? Eur. J. Gastroenterol. Hepatol. 2001, 13, 219–225. [Google Scholar] [CrossRef]
- Pedersen, N.; Andersen, N.N.; Végh, Z.; Jensen, L.; Ankersen, D.V.; Felding, M.; Simonsen, M.H.; Burisch, J.; Munkholm, P. Ehealth: Low FODMAP diet vs Lactobacillus rhamnosus GG in irritable bowel syndrome. World J. Gastroenterol. 2014, 20, 16215–16226. [Google Scholar] [CrossRef]
- Perez y Lopez, N.; Torres-Lopez, E.; Zamarripa-Dorsey, F. Clinical response in Mexican patients with irritable bowel syndrome treated with a low diet low in fermentable carbohydrates (FODMAP). Rev. Gastroenterol. Mex. 2015, 80, 180–185. [Google Scholar] [CrossRef] [Green Version]
- Peters, S.; Yao, C.; Philpott, H.; Yelland, G.; Muir, J.; Gibson, P. Randomised clinical trial: The efficacy of gut-directed hypnotherapy is similar to that of the low FODMAP diet for the treatment of irritable bowel syndrome. Aliment. Pharmacol. Ther. 2016, 44, 447–459. [Google Scholar] [CrossRef]
- Pilichiewicz, A.N.; Feltrin, K.L.; Horowitz, M.; Holtmann, G.; Wishart, J.M.; Jones, K.L.; Talley, N.J.; Feinle-Bisset, C. Functional Dyspepsia Is Associated with a Greater Symptomatic Response to Fat But Not Carbohydrate, Increased Fasting and Postprandial CCK, and Diminished PYY. Am. J. Gastroenterol. 2008, 103, 2613–2623. [Google Scholar] [CrossRef]
- Pilichiewicz, A.N.; Horowitz, M.; Holtmann, G.J.; Talley, N.J.; Feinle-Bisset, C. Relationship between symptoms and dietary patterns in patients with functional dyspepsia. Clin. Gastroenterol. Hepatol. 2009, 7, 317–322. [Google Scholar] [CrossRef]
- Saneei, P.; Sadeghi, O.; Feizi, A.; Keshteli, A.H.; Daghaghzadeh, H.; Esmaillzadeh, A.; Adibi, P. Relationship between spicy food intake and chronic uninvestigated dyspepsia in Iranian adults. J. Dig. Dis. 2016, 17, 28–35. [Google Scholar] [CrossRef]
- Shepherd, S.; Parker, F.; Muir, J.; Gibson, P. Dietary triggers of abdominal symptoms in patients with irritable bowel syndrome: Randomized placebo-controlled evidence. Clin. Gastroenterol. Hepatol. 2008, 6, 765–771. [Google Scholar] [CrossRef] [PubMed]
- Simren, M.; Mansson, A.; Langkilde, A.M.; Svedlund, J.; Abrahamsson, H.; Bengtsson, U.; Bjornsson, E.S. Food-related gastrointestinal symptoms in the irritable bowel syndrome. Digestion 2001, 63, 108–115. [Google Scholar] [CrossRef] [PubMed]
- Staudacher, H.; Lomer, M.; Anderson, J.; Barrett, J.; Muir, J.; Irving, P.; Whelan, K. Fermentable carbohydrate restriction reduces luminal bifidobacteria and gastrointestinal symptoms in patients with irritable bowel syndrome. J. Nutr. 2012, 142, 1510–1518. [Google Scholar] [CrossRef] [PubMed]
- Tigchelaar, E.F.; Mujagic, Z.; Zhernakova, A.; Hesselink, M.A.M.; Meijboom, S.; Perenboom, C.W.M.; Masclee, A.A.M.; Wijmenga, C.; Feskens, E.J.M.; Jonkers, D.M.A.E. Habitual diet and diet quality in Irritable Bowel Syndrome: A case-control study. Neurogastroenterol. Motil. 2017, 29. [Google Scholar] [CrossRef]
- Wilder-Smith, C.H.; Materna, A.; Wermelinger, C.; Schuler, J. Fructose and lactose intolerance and malabsorption testing: The relationship with symptoms in functional gastrointestinal disorders. Aliment. Pharmacol. Ther. 2013, 37, 1074–1083. [Google Scholar] [CrossRef]
- Xu, J.-H.; Lai, Y.; Zhuang, L.-P.; Huang, C.-Z.; Li, C.-Q.; Chen, Q.-K.; Yu, T. Certain dietary habits contribute to the functional dyspepsia in South China rural area. Med Sci. Monit. 2017, 23, 3942–3951. [Google Scholar] [CrossRef]
- Yao, C.K.; Barrett, J.S.; Philpott, H.; Chung, A.R.T.; van Langenberg, D.; Garg, M.; Gibson, P.R. Poor predictive value of breath hydrogen response for probiotic effects in IBS. J. Gastroenterol. Hepatol. 2015, 30, 1731–1739. [Google Scholar] [CrossRef]
- Portincasa, P.; Bonfrate, L.; Scribano, M.L.; Kohn, A.; Caporaso, N.; Festi, D.; Campanale, M.C.; Di Rienzo, T.; Guarino, M.; Taddia, M. Curcumin and Fennel Essential Oil Improve Symptoms and Quality of Life in Patients with Irritable Bowel Syndrome. J. Gastrointest. Liver Dis. 2016, 25, 151–157. [Google Scholar] [Green Version]
- Sperber, A.D.; Drossman, D.A.; Quigley, E.M. The global perspective on irritable bowel syndrome: A Rome Foundation–World Gastroenterology Organisation symposium. Am. J. Gastroenterol. 2012, 107, 1602–1609. [Google Scholar] [CrossRef]
- Palsson, O.S.; Whitehead, W.E.; Van Tilburg, M.A.; Chang, L.; Chey, W.; Crowell, M.D.; Keefer, L.; Lembo, A.J.; Parkman, H.P.; Rao, S.S. Development and validation of the Rome IV diagnostic questionnaire for adults. Gastroenterology 2016, 150, 1481–1491. [Google Scholar] [CrossRef]
- Food Standards Australia New Zealand. Australian Food Composition Database. Available online: http://www.foodstandards.gov.au/science/monitoringnutrients/afcd/Pages/default.aspx (accessed on 8 August 2019).


| Dietary Assessment Method | Recall Period and Method | Recorded by | Usual Location | Usual Collection Period | Type of Validation |
|---|---|---|---|---|---|
| Food diary | Prospective: Actual intake collected per meal or day | Self-reported by participant | Free living | Between 1 day and up to several weeks | No |
| Weighed food record | Prospective: Actual intake collected per food item | Self-reported by participant or researcher report | Free living or lab | Between 1 meal and 3 days | Criterion or relative |
| 24 h recall | Retrospective: Recall previous 24 h | Interviewer administered or self-reported | Free living | 24 h (often 3 non-consecutive days) | Relative |
| Food history | Retrospective: Recall of usual intake | Often dietitian-administered | Lab or clinic | Previous week or usual week | No |
| Food frequency questionnaire | Retrospective: Usual frequency of 30–150 foods listed | Self-reported | Free living or lab | Previous 3–6 months | Relative |
| Food questionnaire | Retrospective: Questions about frequency of food items | Self-reported | Free living or lab | Usual intake | No |
| Author (Year) Country | Sample Size Study Design Study Quality | FGID Diagnostic Criteria | Dietary Factor | Dietary Assessment Method (DAM) and Measures | DAM Capture Period | Symptom-Reporting Method and Measures | Symptom Recording Period | Timeframe Alignment | Significant Association |
|---|---|---|---|---|---|---|---|---|---|
| Studies that used weighed food record DAM | |||||||||
| Pilichie-wicz (2009) USA | n = 41 Cross-sectional Quality (+) | FD Rome II | Dietary intake/dietary patterns/nutrients | DAM: A 7 day WFR Measures: Energy intake, amount eaten, macronutrients (g), distribution of fat/carbohydrate/protein/ alcohol (%) Self-report | In total, 7 days | Symptoms: Abdominal pain, cramps, bloating, nausea, postprandial fullness Measures: SSS (1–10), from not influencing (1–3); modest (score, 4–7), diverting from; or strong (score, 8–10), impairing activities of daily living reported within and after 2 h post meal | For 7 days | Hours, prospective | Y |
| Pilichie-wicz (2008) USA | n = 16 Non-randomised intervention Quality (+) | FD Rome II | High-fat (high-FAT) meal vs. high-carbohydrate (high-CHO) meal (500 kcal/400 g each), or a low-nutrient control meal (180 kcal/400 g) | DAM: A WFR over test period Measures: Energy kilocalories, carbohydrate, and protein (% energy, grams) | In total, 7 days of intervention period | Symptoms: Nausea, bloating, abdominal discomfort, pain, fullness, and hunger Measures: 100 mm VAS score for five symptoms at 0, <60 and 60–90 min post meal | Baseline, and before, 60 min and 90 min after each of the three test meals. | Hours, prospective | Y |
| Studies that used food diary DAM | |||||||||
| Eswaran (2016) USA | n = 92 Single-centre RCT Quality (+) | IBS-D Rome III | Low FODMAP diet vs. modified National Institute for Health and Care Excellence guidelines (mNICE) | Prospective 3 day food diary (and one 24 h dietary recall) Measures: Energy (kilocalories), FODMAPs, macronutrients, fibre, and alcohol (grams) Self-report | In total, 0, 2 and 4 weeks | Symptoms: Abdominal pain, bloating, urgency, stool consistency and frequency Measures: “Adequate relief of overall IBS symptoms” assessed weekly. Daily abdominal pain score (a ≥30% reduction). Daily BSF value of ≥1 compared with baseline for 2/4 weeks). Changes from baseline in abdominal pain score, bloating score, urgency score, stool consistency as measured by BSF, and stool frequency, averaged over each treatment week. Self-report | Daily symptom assessment, adequate relief assessed weekly | Daily, prospective (diet subset of SR) | Y |
| Laatikain-en (2016) Finland | n = 87 Randomised double-blind controlled crossover study Quality (+) | IBS Rome III | Low-FODMAP rye bread vs. regular rye bread | DAM: 4 day food records for run-in and treatment periods. Adherence via tick-box diary during treatment periods and from food records. Measures:Energy (kilocalories) macronutrients, fibre, starch, sodium (grams) Self-report | Baseline and 2 x 4 day out of 10 day trial each study period | Symptoms: 10 IBS symptoms Measures: IBS-SSS (total) and 10 symptoms were recorded (VAS 0–100 mm for each) at the baseline (week 0) and during study weeks 1, 2, 3 and 4 during both study periods. A total symptom score (= mean of all ten symptoms) calculated weekly. Mean values of weeks 1, 2, 3 and 4 calculated for individual symptoms (flatulence, abdominal pain, cramps, stomach rumbling) and for total symptom score. Not validated but cited as previously used. Self-report | IBS-SSS at 0, 2 and 4 weeks (past 10 days). Self-report | Weekly, prospective (SR subset of DAM at daily level) | Y |
| Böhn (2015) Sweden | n = 75 Parallel, single-blind RCT Quality (+) | IBS Rome III | Low FODMAPs (n = 38) or “IBS diet” (n = 38) (regular meals, avoid large meals, reduced fat, low insoluble fibres, low caffeine, and low gas-producing foods) | A 2 × 4 day food diary Measures: Energy, macronutrients, fibre, monosaccharides, FODMAPs, and pectin Self-report | In total, 4 days baseline and 4 days post study (4 weeks) | Symptoms: Stool formation, IBS symptoms Measures: BSF, IBS-SSS >175 (moderate to severe symptoms) at baseline for inclusion Self-report | BSFS (daily), IBS-SSS (day 0, 14, and 28). | Weekly, Prospective BSF (daily) | Y |
| Pilichie-wicz (2009) USA | n = 41 Cross-sectional Quality (+) | FD Rome II | Dietary intake/dietary patterns/nutrients | DAM: A 7 day WFR Measures: Energy intake, amount eaten, macronutrients (g), distribution of fat /carbohydrate/protein/alcohol (%) Self-report | In total, 7 days | Symptoms: Abdominal pain, cramps, bloating, nausea, postprandial fullness Measures: SSS (1–10), from not influencing (1–3); modest (score, 4–7), diverting from; or strong (score, 8–10), impairing activities of daily living reported within and after 2 h post meal | For 7 days | Hours, prospective | Y |
| Pilichie-wicz (2008) USA | n = 16 Non-randomised intervention Quality (+) | FD Rome II | High-fat (high-FAT) meal vs. high-carbohydrate (high-CHO) meal (500 kcal/400 g each), or a low-nutrient control meal (180 kcal/400 g) | DAM: A WFR over test period Measures: Energy kilocalories, carbohydrate, and protein (% energy, grams) | In total, 7 days of intervention period | Symptoms: Nausea, bloating, abdominal discomfort, pain, fullness, and hunger. Measures: 100 mm VAS score for five symptoms at 0, < 60 and 60–90 min post meal | Baseline then before, and 60 min and 90 min post each of the three test meals. | Hours, prospective | Y |
| Azpiroz (2014) Spain | n = 30 Single-blind RCT Quality (+) | PDS, IBS Rome III | Low-flatulogenic vs. Mediterranean diet | DAM: Daily food diary Measures: Calories (kcal) fibre (grams) Self-report | In total, 7 days | Symptoms: Daily anal gas evacuations and severity Measures: Severity of gas-related symptoms (0–10), Digestive comfort scale -5 (unpleasant) to +5 (pleasant) Self-report | Daily for 10 days (3 days prior to and or 7 days of trial) | Daily, prospective | Y |
| Halmos (2014) Australia | n = 38 Single-blind, crossover RCT Quality (+) | IBS Rome III | Less than 0.5 g intake of FODMAPs per meal (low FODMAPs) vs. typical Australian diet | DAM: Food diary Energy (Megajoules), macronutrients, sugar, starch, fibre, and FODMAPs (grams) Self-report | In total, 2 x 21 day food diary with 21 day washout | Symptoms: Overall gastrointestinal symptoms, abdominal pain, bloating, passage of wind, and dissatisfaction with stool consistency Measures: Daily symptoms rated using a 0 to 100 mm VAS score. Differences of 10 mm or more considered clinically significant. Self-report | Overall and individual symptom rating daily in weeks 2 and 3 each intervention | Daily, prospective (SR subset of DAM at daily level) | Y |
| Mazzawi (2013) Norway | n = 46 Retrospective cross-sectional Quality (N) | IBS Rome III | Usual diet vs. diet after dietary guidance (Low FODMAP and fibre) | DAM: Food diary (2 weeks usual intake pre-trial) and FFQ (226 item) Measures: Energy (kilojoules), macronutrient (% energy), fibre (grams) and micronutrients | Past 3 months | Symptoms: Pain (three items), diarrhoea (five items) and constipation (three items) Measures: Birmingham IBS symptom score: (11 IBS symptom questions: 6-point Likert scale, 0 (never) to 5 (all of the time); lower scores = fewer symptoms. Self-report | Past three months | Months (3), retrospective | Y |
| Staud-acher (2012) Australia | n = 41 RCT double-blinded, four-arm randomized trial Quality (+) | IBS Rome III | Four weeks of fermentable carbohydrate restriction | DAM: A 7 day food diary Measures: Total energy (Kcal), macro-nutrients (g), starch (g), micronutrients (mg), and FODMAPs (g) | Week 0 and Week 4 | Symptoms: bloating, abdominal pain, flatulence, borborygmi, urgency, diarrhoea, constipation, incomplete evacuation, heartburn, nausea, and lethargy Measures: Gastrointestinal symptom rating scale of each day using a 4-point scale (absent, mild, moderate, severe). Adequate relief question weekly | GSRS for 7 days, adequate relief question on 7th day (Week 0 and 4) | Daily, prospective | Y |
| Filipovic (2011) Serbia | n = 180 Cross-sectional Quality (N) | FD Rome II | All food eaten, drinks consumed, plus a standardized questionnaire to identify eating habits and dietary patterns reported to exacerbate or relieve GI symptoms | DAM: A 7 day diet diary Measures: Food item consumption Self-report | In total, 7 days | Symptoms: Epigastric pain and burning, heartburn, postprandial fullness, bloating and early satiety Measures: Occurrence of specific dyspeptic symptoms reported to be exacerbated or relieved by food/eating. Self-report | Daily for 7 days | Daily, prospective | Y |
| Ligaarden (2011) Norway | n = 17 Run-in to RCT Quality (+) | IBS Rome II | Dietary intake for macro- and micronutrients | DAM: A 7 day food diary Measures: Energy (kilojoules), macronutrient (% energy), fibre (grams) and micronutrients Self-report | In total, 7 days | Symptoms: Abdominal pain/discomfort, urgency, and bloating Measures: Symptoms graded as none, mild, moderate, or severe (scores 0–3), recorded on diary cards in the evening for 7 days. IBS sum score calculated (0–15). Self-report | Assessed daily | Daily, prospective | Y (Vitamin B6 only) |
| Ong (2010) Australia | n = 30 Randomised, single-blind, crossover trial Quality (+) | IBS Rome III | Low (9 g/day) or high (50 g/day) FODMAPs diet for 2 days each | DAM: Food diary Measures: Total energy (kJ), macronutrients (grams), individual FODMAP (grams), fibre (grams) and resistant starch (grams) Self-report | In total, 7 days run-in; 2 days (A); 7 days wash out, 2 days (B) | Symptoms: Abdominal pain, bloating and wind Measures: Composite symptom score, adding 3-point Likert scale ratings (0–3): 0 = none, 1 = mild, 2 = moderate and 3 = severe | Daily for 18 days | Daily, prospective | Y |
| Park (2010) South Korea | n = 95 Secondary analysis, cross-sectional Quality (N) | IBS Rome I | Usual intake | DAM: Food record: time of day, quantity, and type of food and beverage consumed Measures: Macronutrients, Micronutrients, sugar type, alcohol, and caffeine Self-report | In total, 3 days: Mid luteal menstrual phase | Symptoms: bloating (minimal, mild, moderate) abdominal pain, intestinal gas, constipation, diarrhoea, heartburn, indigestion, nausea, and stomach pain. Measures: Daily symptoms rating as: not present (0), minimal (1), mild (2), moderate (3), and extreme (4). Self-report | One full menstrual cycle plus 5 days | Daily, prospective (diet 3 day subset of SR one month) | Y –fructose only |
| Aller (2004) Spain | n = 56 Single-blind RCT Quality (+) | IBS Rome II | Group 1: 10.4 g/d of fibre/day; Group 2: 30.5 g/d of fibre/day | DAM: A 3 day written food diary Measures: grams of fibre Self-report | In total, 3 days | Symptoms: Self-reported abdominal pain (frequency and severity), bowel score (defecation frequency, defecation straining, incomplete evacuation, and laxatives), and general symptoms (nausea, vomiting, flatus, and bloating) Measures: 0–5 Likert scale Assessment period NR. Self-report | Baseline and 3 months (not specific to food diary collection) | No | No – improved both groups |
| Parker (2001) UK | n = 122 Double-blind, placebo-controlled challenges Quality (+) | IBS Rome criteria (NR) | Subgroups: Low lactose diet (positive breath test + placebo trial) or exclusion diet or low fibre for non- responders For breath teas negative: exclusion diet then reintroduction of foods (testing each over 2 days) for possible intolerances Low fibre diet alternative to elimination: 11 g non-starch polysaccharide | DAM: Food and symptom diary Measures: Dietary adherence vs. symptoms Self-report | In total, 3 weeks | Symptoms: Abdominal pain, number of bowel motions daily, urgency to defecate, consistency of faeces, flatulence, headache, abdominal distension, well-being. Measures eight symptoms scored 0 to 4 (0 = no symptoms and 4 = most severe, urgency scored from 0 to 3). Self-report | For 3 weeks (daily) | Daily, prospective | N |
| Studies that used questionnaire (including FFQ) DAM | |||||||||
| Harvie (2017) New Zealand | n = 50 Randomised unblinded, delayed control intervention trial Quality (+) | IBS Rome III | Low FODMAP diet, followed by the systematic reintroduction of individual FODMAPs | DAM: FODMAP-specific FFQ at 0, 3 and 6 months Measures: Total FODMAP sum of fructo-oligosaccharides, galacto-oligosaccharides, lactose, excess fructose to glucose, sorbitol, and mannitol | In total, 6 months | Symptoms: Bloating and abdominal pain IBS-SSS Scores range from 0–500, subscales for bloating and severity (0–100) and frequency of abdominal pain (days in 10: 0–10). Total scores and individual symptoms scores used in analysis Self-report | For 0, 3 and 6 months | Monthly, retrospective | Y |
| Tigchelaar (2017) Netherlands | n = 380 Case control Quality (+) | IBS Rome (NR) | Habitual diet of IBS vs. control participants | DAM: A 148-item FFQ (linked to Dutch Food Composition Database) Measures: Fruit, vegetables, fibre, docosahexaenoic acid, eicosapentaenoic acid, saturated fatty acids, trans fatty acids, sodium and alcohol in grams | Past 4 weeks | Symptoms: Abdominal pain, reflux, diarrhoea, constipation, and indigestion Measures: GI symptoms (14 day end-of-day diary, 1–5 point scale) and Gastrointestinal Symptom Rating Scale (1–7 point scale) for abdominal discomfort, abdominal pain, constipation, diarrhoea, bloating, flatulence, belching and nausea. GSRS total score = sum of all syndromes. | For 14 days | General, retrospective (diet) prospective (symptoms) | Y |
| Xu (2017) China | n = 1139 Longitudinal Quality (N) | FD mROME III (Chinese) | Dietary behaviours in the previous two months | DAM: Researcher-administered FFQ (specific food frequency and patterns) Measures: a) diet patterns (> 3 times per week): irregular mealtime, skipping breakfast, night snacking, and dining out; b) food frequency 3+ times/week): raw food or unboiled water, fatty food, spicy food, regular coffee or tea regularly, and alcohol intake Self-report | Past two months | Symptoms: Postprandial fullness, early satiation, upper abdominal pain, upper abdominal burning, reflux and nausea. Measures: mROME III only | Past 3 months (Rome III) | General, retrospective | Y |
| Göktaş (2016) Turkey | n = 303 Comparative cross-sectional Quality (N) | FD Rome III | Nutritional intake and habits | DAM: A 34 item FFQ (foods expected to exacerbate FD symptoms) Measures: Frequency of intake per item Self-report | Current intake | Symptoms: Epigastric pain symptom at least moderate severity, postprandial distress syndrome symptom (distress after a regular sized meal or early satiety) or a mix of both conditions Self-report | Survey of symptom induction by food in FFQ | General, retrospective | NA |
| Lee (2016) Korea | n = 121 Cross-sectional Quality (+) | FD Rome III | Spicy food intake: green chili, red pepper paste, Kimchi, rice cakes in hot sauce, and other food containing chilli or red pepper | DAM: Spicy food intake score (NV) Measures: Scores (0 to 5) almost none = 0, a few times/month = 1, few times/week = 2, 1/day = 3, 2/day = 4, and ≥ 3/day = 5. Self-report | Usual intake | Symptoms: Stomach fullness, abdominal distention, and retching. Measures: Assessment of gastrointestinal symptoms (PAGI-SYM), severity recorded as 0 (none), 1 (very mild), 2 (mild), 3 (moderate), 4 (severe), and 5 (very severe) Self-report | Cross-sectional Self-report | General, retrospective | Y |
| Saneei (2016) Iran | n = 4763 Repeat cross-sectional Quality (N) | CUD Rome III (Persia) | Spicy food consumption and chronic uninvestigated dyspepsia (CUD) | DAM: A self-administered questionnaire Measures: Frequency and regularity of meals, drinking fluids with meals, and weekly intake of spicy food (curry, ginger, cinnamon, chili pepper, turmeric, etc.) Options: “never”, “1–3 times”, “4–6 times”, “7–9 times” or “> 10 times” Self-report | Baseline (usual intake) | Symptoms: Distressing postprandial fullness, early satiation and/or epigastric pain or epigastric burning Measures: Four-item rating scale (i.e., “never” or “rarely”, “sometimes”, “often”, and “always”) | One month (no overlap with diet questionnaire) | N | Y |
| Akhondi-Meybodi (2015) Iran | n = 384 Cross-sectional Quality (+) | FD Rome III | “Aggravating” and “alleviating” foods | DAM: Questionnaire specific to study (NV) Measures: 114 commonly eaten foods Self-report | Usual intake | Symptoms: Pain, defecation, nausea, and vomiting Measures: A 4-point scale for either “aggravation” OR “alleviation,” rated as: low, medium, high, and very high (NV) Self-report | Retrospective— “Associated with food ingestion” | General, retrospective | NM |
| Hayes (2014) Ireland | n = 246 Cross-sectional Quality (N) | IBS Rome III | Self-reported food intolerance. Differentiated between specific foods and eating, and time to symptom induction after eating | DAM: Tailored FFQ questionnaire (NV) Measures: Specific foods and time between eating and symptoms Self-report | Current intake | Symptoms: Pain, bloating, distension, diarrhoea, constipation, and to specify the time between food intake and symptom onset. Measures: Select food-induced symptoms from a list Self-report | Cross-sectional–retrospective, timeframe NR | General, retrospective | NA |
| Böhn (2013) Sweden | n = 197 Cross-sectional Quality (+) | IBS Rome III | Foods containing amines; birch-related; benzoic acid; capsaicin; grass-related; histamine-releasing; latex-related; sulphites, fermentable carbohydrates; lectins; mugwort-related; mite-related; ragweed | FFQ: 56 food items (NV) Measures: average daily intakes for energy, macronutrients, and selected micronutrients (grams and % energy) Self-report | Usual (NR) | IBS symptoms (IBS Severity Scoring System) Self-report | Retrospective— “Associated with food ingestion” | General, retrospective | Y |
| Wilder-Smith (2013) Switzerland | n = 312 Intervention Quality (N) | FGIDs Rome III | Four-week dietary adaptation, 1 week of low saccharides and polyols, weekly introduction of specific foods containing fructose, fructan, inulin and lactose to determine individual tolerance. Lactose and fructose challenges 4 days apart | DAM: (1) Questionnaire and interview: (2) Maintain below threshold for breath testing Measures: Adequate compliance = adhered to diet for at least 50% of the meals consumed Self-report and researcher-reported | In total, 4 weeks: threshold In total, 1 week: breath tests | Symptoms: FGID (abdominal distension, flatulence, fullness, nausea, diarrhoea, abdominal cramps, borborygmi) Measures: Average relief 10-point Likert scales and proportion reporting “Adequate global symptom relief” and average relief on the 10-point symptom scale. Intolerance > 2 over baseline using a symptom score index, which was scored hourly concurrently with the collection of the breath samples (0–5 h) | For 4 weeks: threshold 1 week: breath tests | Hourly (breath tests) prospective | Y |
| Ligaarden (2012) Norway | n = 388 Cross-sectional Quality (+) | IBS Rome II | Beverages (milk, water, carbonated beverages, and alcoholic beverages), fruits, vegetables, fatty fish, cheese, and omega-3 fatty acid supplements | DAM: FFQ—usual intake Measures: Frequency Self-report | Usual intake | Severity of symptoms (score 1–12) calculated as the product of severity (mild, moderate, severe (score 1–3)) and frequency (one day or less per week, two to three days per week, four to five days per week, more than five days per week (score 1–4)) Self-report | Cross-sectional-current symptoms | General, retrospective- | Y |
| Ostgaard (2012) Norway | n = 114 Retrospective, cross-sectional Quality (+) | IBS Rome III | Usual intake after dietary guidance for low FODMAP vs. no guidance | DAM: FFQ Measures: Macronutrients, micronutrients, and FODMAPs Self-report | Past 2 years | Symptoms: Pain (three items), diarrhoea (five items) and constipation (three items) Measures: Birmingham IBS symptom score: (11 IBS symptom questions: 6-point Likert scale, 0 (never) to 5 (all of the time), and lower scores = fewer symptoms. Self-report | Past 2 years | Years (2), retrospective | N |
| Bijkerk (2009) Netherlands | n = 275 Single-blind RCT Quality (+) | IBS Rome II | Twelve weeks of treatment with 10 g psyllium, 10 g bran, or 10 g placebo (rice flour) | DAM: A 78 item FFQ for fibre, validated for ranking participants Adherence checked Self-report | In total, 12 weeks assessed monthly | Symptoms: Validated “adequate relief” of IBS-related abdominal pain or discomfort Measures: Validated symptom score (VAS for five aspects of bowel dysfunction and IBS symptom intensity. Self-report | Monthly at 4, 8, 12 weeks “adequate relief 2 out of 4 weeks” | Monthly, retrospective | Y |
| Simrén (2001) Sweden | n = 410 Cross-sectional Quality (N) | IBS Rome I | GI symptom “trigger” food intake | DAM: FFQ Measures: 35 reported trigger foods Self-report | Current intake | Symptoms: GI symptoms related to 35 meals and individual foods were described by participants (then grouped). Measures: Mean time from food intake until symptoms appeared and severity of subjective GI symptoms assessed using a 5-step scale ranging from no (0), mild (1), moderate (2), severe (3) to very severe (4) symptoms. | Associated with food (cross-sectional) | General, retrospective | Y |
| Studies that used a dietary protocol | |||||||||
| Hustoft (2017) Norway | n = 20 Randomized, double-blinded, placebo-controlled, Crossover trial Quality (+) | IBS Rome III | Nine-week low FODMAP diet with 3 week run-in, then 10 days of either (A) 16 g/d of fructo-oligosaccharide (FODMAP), a 3 week washout, then (B) 16 g/d of maltodextrin (placebo) or reverse sequence | DAM: Dietary protocol (Baseline, after 3 weeks of low FODMAP, after 10 days with (A/B), after a 3 week washout period, after 10 last days with (A/B)) Measures: By A/B vs. symptoms Self-report | In total, 9 weeks (compliance not reported) | Symptoms: Severity of abdominal pain, frequency of abdominal pain, severity of abdominal distension, dissatisfaction with bowel habits, and interference with daily life. Measures: IBS-SSS: five items on a 100-point VAS; overall score (0–500) to classify severity. ↓ 50 points = significant treatment response. Reporting of nausea and/or vomiting, early satiety, headache, backache, tiredness, belching and/or passing gas, heartburn, frequent or sudden urge to urinate, thigh pain, and muscle/ joint pain using a 100- point VAS. Self-report | IBS-SSS and symptoms previous 10 days. Global question symptom relief satisfaction past 7 days. | Weekly, prospective SR vs. diet protocol (SR subset of diet compliance) | Y |
| Maagaard (2016) Denmark | n = 131 (IBS) Retrospective cross-sectional Quality (+) | IBS and IBD Rome III | Low FODMAP diet | DAM: FODMAP adherence reporting scale: five questions, response options (never, rare, sometimes, often, always; each 1—5) = maximum score of 25 points. Measures: Score of at least 20 points (≥ 80%) = adherent to the diet. In addition, FODMAP diet satisfaction questionnaire Self-report | Past 16 months | Symptoms: Abdominal pain, bloating, constipation, diarrhoea, borborygmi, nausea/vomiting, and fatigue. Measures: Validated IBS-SSS using VAS-100 Self-report | Past 16 months | Months (16), retrospective | Y |
| Peters (2016) Australia [49] | n = 74 Randomised controlled trial Quality (+) | IBS Rome III | Comparison of hypnotherapy to the low FODMAP diet on GI symptoms | DAM: Dietary protocol Measures: Adherence = up to three accidental exposures to high FODMAP foods in 6 week study period. Self-report | In total, 6 weeks | Symptoms: Abdominal pain, bloating, wind, stool consistency and nausea. Measures: IBS-SSS, VAS 0–100 after 6 weeks and 6 months. Self-report | After 6 weeks and 6 months | Months, retrospective | Y |
| Portincasa (2016) Italy | n = 121 Randomized, double-blind, placebo-controlled trial Quality (+) | IBS Rome III | Dietary supplementation with Curcumin (84 mg) and Fennel seed (50 mg) oil daily for 30 days | DAM: Dietary supplement protocol only Measures: Compliance with supplementation protocol, and adverse events Self-report | In total, 30 days | Symptoms: Presence and intensity of abdominal pain and bloating, relief following defecation, and impact on QOL, and days of symptoms preceding 10 days. Measures: IBS-SSS five items on a 100-point VAS for severity (total score 0–500). IBS-SSS reduction level of 50 points was considered as an improvement. Self-report | For 30 days | Daily, prospective | Y |
| Yao (2015) Australia | n = 41 Double-blinded placebo control RCT Quality (+) | IBS Rome III | In total, 10 g sorbitol, mannitol or glucose ingestion | DAM: Study protocol—researcher administered Measures: Compliance Researcher-reported | In total, 4 h each test | Symptoms: Overall gastrointestinal symptoms, abdominal pain/discomfort, bloating and wind. Measures: IBS-SSS, 100 mm VAS visual analogue scale of severity from 0 (no symptoms) to 100 mm (worst it has been). Composite score calculated from individual symptom scores, corrected for baseline symptoms. | Previous 9 days (baseline) then pre- and 4 h post-ingestion for | Hourly, prospective | Y |
| Pedersen (2014) Denmark | n = 123 Randomised, unblinded controlled trial Quality (+) | IBS Rome III | Low FODMAP diet vs. Lactobacillus Rhamnosus vs. Danish/Western diet | DAM: Dietary protocol Measures: Adherence not reported Dietitian support during trial Self-report | In total, 6 weeks | Symptoms: Abdominal pain, frequency of abdominal pain, severity of abdominal distension, dissatisfaction with bowel habits, and interference with life in general. Measures: IBS-SSS five items on a 100-point VAS for severity (total score 0–500). IBS-SSS reduction level of 50 points was considered as an improvement. Self-report | Weekly | Weekly, prospective | Y |
| Pérez y López (2015) Mexico | n = 31 Longitudinal Quality (N) | IBS Rome III | Low FODMAP diet by IBS subtype | DAM: Dietary protocol Measures: Written meal plan adherence Self-report | Past 3 weeks | Symptoms: Abdominal pain, bloating, and flatulence (VAS) Measures: Graded for severity on a scale from 0 to 10. Global satisfaction scale: 5-point scale. BSF results quantified. Self-report | Weekly for 3 weeks | Weekly, prospective | Y |
| Aydinlar (2013) Turkey | n = 21 Double-blind, cross-over RCT Quality (N) | IBS Rome III | IgG antibody tests against 270 food allergens. Tailored IgG provoking or elimination diet for 6 weeks each (crossover) | DAM: Diet adherence (intrusions NR) Measures: Allergen food consumption Self-report | In total, 12 (2 × 6) weeks | Symptoms: IBS symptom diary (modified from IBS-SSS) Self-report | Daily for last 10 days of 2 × 6 weeks intervention | Daily, prospective (SR subset of DAM) | Y–pain/bloating |
| Moritz (2013) Austria | n = 320 Placebo control double-blind crossover RCT Quality (+) | IBS Rome II | Lactose or fructose elimination diet | DAM: Dietary protocol Measures: Allocation to group, adherence NR Self-report | In total, 3 weeks each | Symptoms: Abdominal pain severity, number of days with abdominal pain, bloating/flatulence, and contentment Measures: VAS graded from 0 (no perception) to 100 (very strong perception) for total symptom score Self-report | Post each three-week period | Weeks (3), retrospective | Y |
| Shepherd (2008) Australia | n = 25 Double-blinded, randomized, four-arm, placebo-controlled rechallenge trial Quality (+) | IBS and fructose malabsorption responsive to low FODMAP diet) ROME II | A 22 week individually energy tailored low FODMAP diet (food provided). Test drink containing (low/medium/high) dose (g/day) of fructan, fructose, or glucose, 3/day at 50 mL/meal for 3 days (low), 100 mL for 3 days (medium), or 170 mL (high) for rest of 2 weeks test if tolerated. A 10 day washout between each of the four tests. | DAM: Diary entries (timing and volume) of ingested test drinks, numbers of used and unused bottles counted to assess adherence Measures: Total energy (KJ), macronutrients (g), micronutrients (g), and FODMAPS (g) Self-report | In total, 22 weeks including baseline, 4 × 2 week test periods and washouts | Symptoms: Overall abdominal symptoms, wind, bloating, abdominal pain, tiredness, and nausea (at highest tolerated dose) Measures: Adequate relief question + daily symptom diary (based on VAS-100 mm) each symptom | Daily to highest tolerated dose | Daily, prospective | Y |
| Lee (2006) Korea | n = 42 Randomised crossover study Quality (+) | FD Rome II | In total, 500 mL of non-nutrient water or caloric nutrient drink (1 kilocalorie/mL, carbohydrate 64%, protein 14%, and fat 22%) in randomized order | DAM: Dietary protocol of 100 mL/minute for 5 min, stopping if nausea, discomfort or pain induced Measures: Volume consumed Researcher administered | In total, 30 min | Upper abdominal symptom severity post water or nutrient drink. A 100 mm VAS from 0 defined as none; 100 as worst severity imaginable. Symptoms included fullness, bloating, nausea, belching and epigastric pain measured immediately before and at 5 min intervals after ingestion of the test meal. Self-report | Sum of scores for each symptom during 30 min postprandial period. Self-report | Minutes, prospective (5 min intervals vs. protocol) | Y |
| Diagnostic Criteria | n | Studies |
|---|---|---|
| ROME I—IBS | 2 | [45,54] |
| ROME II—IBS | 6 | [22,25,38,39,42,53] |
| ROME II—FD | 4 | [29,36,50,51] |
| ROME III—IBS | 23 | [23,24,26,27,28,31,32,33,34,35,40,41,43,44,46,47,48,49,55,56,57,59,60] |
| ROME III—FD | 6 | [21,24,30,37,52,57,58] |
© 2019 by the authors. Licensee MDPI, Basel, Switzerland. This article is an open access article distributed under the terms and conditions of the Creative Commons Attribution (CC BY) license (http://creativecommons.org/licenses/by/4.0/).
Share and Cite
Duncanson, K.; Burrows, T.; Keely, S.; Potter, M.; Das, G.; Walker, M.; Talley, N.J. The Alignment of Dietary Intake and Symptom-Reporting Capture Periods in Studies Assessing Associations between Food and Functional Gastrointestinal Disorder Symptoms: A Systematic Review. Nutrients 2019, 11, 2590. https://doi.org/10.3390/nu11112590
Duncanson K, Burrows T, Keely S, Potter M, Das G, Walker M, Talley NJ. The Alignment of Dietary Intake and Symptom-Reporting Capture Periods in Studies Assessing Associations between Food and Functional Gastrointestinal Disorder Symptoms: A Systematic Review. Nutrients. 2019; 11(11):2590. https://doi.org/10.3390/nu11112590
Chicago/Turabian StyleDuncanson, Kerith, Tracy Burrows, Simon Keely, Michael Potter, Gayatri Das, Marjorie Walker, and Nicholas J. Talley. 2019. "The Alignment of Dietary Intake and Symptom-Reporting Capture Periods in Studies Assessing Associations between Food and Functional Gastrointestinal Disorder Symptoms: A Systematic Review" Nutrients 11, no. 11: 2590. https://doi.org/10.3390/nu11112590