Pretreatment Fasting Glucose and Insulin as Determinants of Weight Loss on Diets Varying in Macronutrients and Dietary Fibers—The POUNDS LOST Study

 , , ,
, , ,
Abstract
:1. Introduction
2. Materials and Methods
3. Results
4. Discussion
5. Conclusions
Supplementary Materials
Author Contributions
Funding
Conflicts of Interest
References
- Astrup, A.; Grunwald, G.; Melanson, E.; Saris, W.; Hill, J. The role of low-fat diets in body weight control: A meta-analysis of ad libitum dietary intervention studies. Int. J. Obes. 2000, 24, 1545–1552. [Google Scholar] [CrossRef]
- Hall, K.D.; Bemis, T.; Brychta, R.; Chen, K.Y.; Courville, A.; Crayner, E.J.; Goodwin, S.; Guo, J.; Howard, L.; Knuth, N.D.; et al. Calorie for Calorie, Dietary Fat Restriction Results in More Body Fat Loss than Carbohydrate Restriction in People with Obesity. Cell Metab. 2015, 22, 427–436. [Google Scholar] [CrossRef] [PubMed]
- Ebbeling, C.B.; Feldman, H.A.; Klein, G.L.; Wong, J.M.W.; Bielak, L.; Steltz, S.K.; Luoto, P.K.; Wolfe, R.R.; Wong, W.W.; Ludwig, D.S. Effects of a low carbohydrate diet on energy expenditure during weight loss maintenance: Randomized trial. BMJ 2018. [Google Scholar] [CrossRef] [PubMed]
- Astrup, A.; Larsen, T.M.; Harper, A. Atkins and other low-carbohydrate diets: Hoax or an effective tool for weight loss? Lancet 2004, 364, 897–899. [Google Scholar] [CrossRef]
- Larsen, T.M.; Dalskov, S.-M.; van Baak, M.; Jebb, S.A.; Papadaki, A.; Pfeiffer, A.F.H.; Martinez, J.A.; Handjieva-Darlenska, T.; Kunešová, M.; Pihlsgård, M. Diets with high or low protein content and glycemic index for weight-loss maintenance. N. Engl. J. Med. 2010, 363, 2102–2113. [Google Scholar] [CrossRef] [PubMed]
- Jensen, M.D.; Ryan, D.H.; Apovian, C.M.; Ard, J.D.; Comuzzie, A.G.; Donato, K.A.; Hu, F.B.; Hubbard, V.S.; Jakicic, J.M.; Kushner, R.F.; et al. 2013 AHA/ACC/TOS Guideline for the Management of Overweight and Obesity in Adults. J. Am. Coll. Cardiol. 2014, 63, 2985–3023. [Google Scholar] [CrossRef] [PubMed] [Green Version]
- Bray, G.A.; Heisel, W.E.; Afshin, A.; Jensen, M.D.; Dietz, W.H.; Long, M.; Kushner, R.F.; Daniels, S.R.; Wadden, T.A.; Tsai, A.G.; et al. The Science of Obesity Management: An Endocrine Society Scientific Statement. Endocr. Rev. 2018, 39, 79–132. [Google Scholar] [CrossRef] [PubMed] [Green Version]
- Brownlee, I.A.; Chater, P.I.; Pearson, J.P.; Wilcox, M.D. Dietary fibre and weight loss: Where are we now? Food Hydrocoll. 2017. [Google Scholar] [CrossRef]
- Roager, H.M.; Vogt, J.K.; Kristensen, M.; Hansen, L.B.S.; Ibrügger, S.; Mærkedahl, R.B.; Bahl, M.I.; Lind, M.V.; Nielsen, R.L.; Frøkiær, H.; et al. Whole grain-rich diet reduces body weight and systemic low-grade inflammation without inducing major changes of the gut microbiome: A randomised cross-over trial. Gut 2017. [Google Scholar] [CrossRef] [PubMed]
- Poulsen, S.K.; Due, A.; Jordy, A.B.; Kiens, B.; Stark, K.D.; Stender, S.; Holst, C.; Astrup, A.; Larsen, T.M. Health effect of the New Nordic Diet in adults with increased waist circumference: A 6-mo randomized controlled trial. Am. J. Clin. Nutr. 2014, 99, 35–45. [Google Scholar] [CrossRef] [PubMed]
- Woods, S.C. Metabolic signals and food intake. Forty years of progress. Appetite 2013, 71, 440–444. [Google Scholar] [CrossRef] [PubMed]
- Hwang, J.J.; Jiang, L.; Hamza, M.; Sanchez Rangel, E.; Dai, F.; Belfort-DeAguiar, R.; Parikh, L.; Koo, B.B.; Rothman, D.L.; Mason, G.; et al. Blunted rise in brain glucose levels during hyperglycemia in adults with obesity and T2DM. JCI Insight 2017, 2, 95913. [Google Scholar] [CrossRef] [PubMed]
- Slavin, J.L. Dietary fiber and body weight. Nutrition 2005, 21, 411–418. [Google Scholar] [CrossRef] [PubMed]
- Hjorth, M.F.; Zohar, Y.; Hill, J.O.; Astrup, A. Personalized Dietary Management of Overweight and Obesity Based on Measures of Insulin and Glucose. Annu. Rev. Nutr. 2018, 38, 245–272. [Google Scholar] [CrossRef] [PubMed]
- Sacks, F.M.; Bray, G.A.; Carey, V.J.; Smith, S.R.; Ryan, D.H.; Anton, S.D.; McManus, K.; Champagne, C.M.; Bishop, L.M.; Laranjo, N. Comparison of weight-loss diets with different compositions of fat, protein, and carbohydrates. N. Engl. J. Med. 2009, 360, 859–873. [Google Scholar] [CrossRef] [PubMed]
- Association, A.D. 2. Classification and Diagnosis of Diabetes. Diabetes Care 2016, 39 (Suppl. 1), S13–S22. [Google Scholar]
- Hjorth, M.F.; Ritz, C.; Blaak, E.E.; Saris, W.H.; Langin, D.; Poulsen, S.K.; Larsen, T.M.; Sørensen, T.I.; Zohar, Y.; Astrup, A. Pretreatment fasting plasma glucose and insulin modify dietary weight loss success: Results from 3 randomized clinical trials. Am. J. Clin. Nutr. 2017, 106, 499–505. [Google Scholar] [CrossRef] [PubMed]
- Wan, Y.; Wang, F.; Yuan, J.; Li, J.; Jiang, D.; Zhang, J.; Huang, T.; Zheng, J.; Mann, J.; Li, D. Effects of Macronutrient Distribution on Weight and Related Cardiometabolic Profile in Healthy Non-Obese Chinese: A 6-month, Randomized Controlled-Feeding Trial. EBioMedicine 2017, 22, 200–207. [Google Scholar] [CrossRef] [PubMed]
- Hjorth, M.F.; Due, A.; Larsen, T.M.; Astrup, A. Pretreatment Fasting Plasma Glucose Modifies Dietary Weight Loss Maintenance Success: Results from a Stratified, R.C.T. Obesity 2017, 25, 2045–2048. [Google Scholar] [CrossRef] [PubMed]
- Estruch, R.; Corella, D.; Salas-Salvado, J.; Hjorth, M.F.; Astrup, A.; Zohar, Y.; Urban, L.; Serra-Majem, L.; Lapetra, J.; Aros, F.; et al. Pretreatment fasting plasma glucose determines weight loss on high-fat diets: The PREDIMED Study. Obesity 2017, 25, 2045–2048. [Google Scholar]
- Chambers, L.; McCrickerd, K.; Yeomans, M.R. Optimising foods for satiety. Trends Food Sci. Technol. 2015, 41, 149–160. [Google Scholar] [CrossRef] [Green Version]
- de Vadder, F.; Mithieux, G. Gut-brain signaling in energy homeostasis: The unexpected role of microbiota-derived succinate. J. Endocrinol. 2018, 236, R105–R108. [Google Scholar] [CrossRef] [PubMed]
- Hjorth, M.F.; Blædel, T.; Bendtsen, L.Q.; Lorenzen, J.K.; Holm, J.B.; Kiilerich, P.; Roager, H.M.; Kristiansen, K.; Larsen, L.H.; Astrup, A. Prevotella-to-Bacteroides ratio predicts body weight and fat loss success on 24-week diets varying in macronutrient composition and dietary fiber: Results from a post-hoc analysis. Int. J. Obes. 2018, 43, 149–157. [Google Scholar] [CrossRef] [PubMed]
- Hjorth, M.F.; Roager, H.M.; Larsen, T.M.; Poulsen, S.K.; Licht, T.R.; Bahl, M.I.; Zohar, Y.; Astrup, A. Pre-treatment microbial Prevotella-to-Bacteroides ratio, determines body fat loss success during a 6-month randomized controlled diet intervention. Int. J. Obes. 2018, 42, 580–583. [Google Scholar] [CrossRef] [PubMed]
- Gu, Y.; Wang, X.; Li, J.; Zhang, Y.; Zhong, H.; Liu, R.; Zhang, D.; Feng, Q.; Xie, X.; Hong, J.; et al. Analyses of gut microbiota and plasma bile acids enable stratification of patients for antidiabetic treatment. Nat. Commun. 2017, 8, 1785. [Google Scholar] [CrossRef] [PubMed] [Green Version]
- Christensen, L.; Roager, H.M.; Astrup, A.; Hjorth, M.F. Microbial enterotypes in personalized nutrition and obesity management. Am. J. Clin. Nutr. 2018, 108, 645–651. [Google Scholar] [CrossRef] [PubMed]
- Belza, A.; Ritz, C.; Sørensen, M.Q.; Holst, J.J.; Rehfeld, J.F.; Astrup, A. Contribution of gastroenteropancreatic appetite hormones to protein-induced satiety. Am. J. Clin. Nutr. 2013, 97, 980–989. [Google Scholar] [CrossRef] [PubMed] [Green Version]
- Goff, H.D.; Repin, N.; Fabek, H.; El Khoury, D.; Gidley, M.J. Dietary fibre for glycaemia control: Towards a mechanistic understanding. Bioact. Carbohydr. Diet Fibre 2018, 14, 39–53. [Google Scholar] [CrossRef]
- Bray, G.A.; Ryan, D.H.; Johnson, W.; Champagne, C.M.; Johnson, C.M.; Rood, J.; Williamson, D.A.; Sacks, F.M. Markers of dietary protein intake are associated with successful weight loss in the POUNDS LOST trial. Clin. Obes. 2017, 7, 166–175. [Google Scholar] [CrossRef] [PubMed]
- Ajala, O.; English, P.; Pinkney, J. Systematic review and meta-analysis of different dietary approaches to the management of type 2 diabetes. Am. J. Clin. Nutr. 2013, 97, 505–516. [Google Scholar] [CrossRef] [PubMed] [Green Version]
- Snorgaard, O.; Poulsen, G.M.; Andersen, H.K.; Astrup, A. Systematic review and meta-analysis of dietary carbohydrate restriction in patients with type 2 diabetes. BMJ Open Diabetes Res. Care 2017, 5, e000354. [Google Scholar] [CrossRef] [PubMed] [Green Version]
- Lean, M.E.J.; Astrup, A.; Roberts, S.B. Making progress on the global crisis of obesity and weight management. Br. Med. J. 2018, 361, k2538. [Google Scholar] [CrossRef] [PubMed] [Green Version]
- Hall, K.D.; Sacks, G.; Chandramohan, D.; Chow, C.C.; Wang, Y.C.; Gortmaker, S.L.; Swinburn, B.A. Quantification of the effect of energy imbalance on bodyweight. Lancet 2011, 378, 826–837. [Google Scholar] [CrossRef] [Green Version]
- Hjorth, M.F.; Astrup, A.; Zohar, Y.; Urban, L.E.; Sayer, R.D.; Patterson, B.W.; Herring, S.J.; Klein, S.; Zemel, B.S.; Foster, G.D.; et al. Personalized nutrition: Pretreatment glucose metabolism determines individual long-term weight loss responsiveness in individuals with obesity on low-carbohydrate versus low-fat diet. Int. J. Obes. 2018. [Google Scholar] [CrossRef] [PubMed]
- Due, A.; Toubro, S.; Skov, A.R.; Astrup, A. Effect of normal-fat diets, either medium or high in protein, on body weight in overweight subjects: A randomised 1-year trial. Int. J. Obes. 2004, 28, 1283–1290. [Google Scholar] [CrossRef] [PubMed]
- Williamson, D.A.; Anton, S.D.; Han, H.; Champagne, C.M.; Allen, R.; Leblanc, E.; Ryan, D.H.; McManus, K.; Laranjo, N.; Carey, V.J.; et al. Adherence is a multi-dimensional construct in the POUNDS LOST trial. J. Behav. Med. 2010, 33, 35–46. [Google Scholar] [CrossRef] [PubMed]
- Astrup, A.; Hjorth, M.F. Low-Fat or Low Carb for Weight Loss? It Depends on Your Glucose Metabolism. EBioMedicine 2017, 22, 20–21. [Google Scholar] [CrossRef] [PubMed]


| FPG < 100 mg/dL & FI < 13.8 µIU/mL | FPG < 100 mg/dL & FI ≥ 13.8 µIU/mL | FPG ≥100 mg/dL & FI < 13.8 µIU/mL | FPG ≥ 100 mg/dL & FI ≥ 13.8 µIU/mL | p-Value | |
|---|---|---|---|---|---|
| All (n = 639) | 386 | 136 | 50 | 67 | |
| Completion (%) | 78.6 | 79.5 | 82.0 | 82.7 | 0.81 |
| Age | 50.9 ± 9.4 a | 52.3 ± 8.4 ab | 55.0 ± 6.9 b | 53.1 ± 9.7 ab | 0.008 |
| Sex, % females | 68.9 | 53.7 | 46.0 | 43.3 | <0.001 |
| Body weight, kg | 88.8 ± 14.6 a | 100.0 ± 14.7 bc | 95.3 ± 13.3 c | 101.4 ± 14.4 b | <0.001 |
| BMI, kg/m2 | 31.6 ± 3.7 a | 34.5 ± 3.6 c | 32.8 ± 3.8 b | 34.7 ± 3.1 c | <0.001 |
| Fasting glucose, mg/dL | 88 (83;92) | 92 (87;96) | 106 (102;115) | 108 (103;115) | |
| Fasting Insulin, µIU/mL | 7.9 (6.1;10.5) | 17.3 (15.4;21.8) | 10.3 (8.3;11.9) | 19.8 (16.7;26.2) | |
| HOMA-IR | 1.7 (1.3;2.3) a | 3.9 (3.5;4.7) b | 2.8 (2.2;3.3) c | 5.4 (4.6;7.1) d | <0.001 |
| Diet record subgroup (n = 317) | 179 | 75 | 31 | 32 | |
| Age | 52.3 ± 9.2 | 53.4 ± 8.6 | 55.1 ± 7.1 | 52.1 ± 8.8 | 0.38 |
| Sex, % females | 62.6 | 49.3 | 48.4 | 28.1 | 0.002 |
| Body weight, kg | 89.3 ± 15.8 a | 100.9 ± 14.3 b | 95.3 ± 14.2 b | 101.5 ± 14.4 b | <0.001 |
| BMI, kg/m2 | 31.4 ± 3.8 a | 34.3 ± 3.4 b | 32.6 ± 3.9 a | 34.7 ± 2.7 b | <0.001 |
| Fasting glucose, mg/dL | 88 (83;92) | 93 (87;96) | 106 (103;110) | 110 (106;119) | |
| Fasting Insulin, µIU/mL | 8.1 (6.1;10.5) | 17.2 (15.7;19.8) | 10.3 (8.3;11.9) | 19.1 (16.5;23.3) | |
| HOMA-IR | 1.7 (1.3;2.3) a | 3.9 (3.5;4.5) b | 2.8 (2.2;3.3) c | 5.3 (4.6;6.9) d | <0.001 |
| Energy intake (kcal/day) | 1976 ± 494 a | 2126 ± 579 b | 1856 ± 630 a | 2301 ± 647 b | 0.002 |
| Carbohydrate (E%) | 45.1 ± 7.7 | 44.7 ± 7.0 | 45.2 ± 8.4 | 41.9 ± 6.6 | 0.17 |
| Fat (E%) | 36.9 ± 6.0 ab | 37.9 ± 5.4 b | 35.4 ± 6.9 a | 39.3 ± 5.6 bc | 0.035 |
| Protein (E%) | 17.9 ± 3.4 | 17.4 ± 3.2 | 18.8 ± 3.8 | 17.6 ± 2.5 | 0.22 |
| Fiber intake (g/day) | 18.1 ± 7.3 | 16.9 ± 5.4 | 17.6 ± 5.4 | 17.9 ± 5.8 | 0.61 |
| Fiber intake (g/10 MJ) | 22.2 ± 7.7 a | 19.5 ± 5.7 b | 24.5 ± 10.1 a | 19.1 ± 6.3 b | 0.002 |
| LF-AP 65% Carb | LF-HP 55% Carb | ∆ (LF-AP vs. LF-HP) Weight Change (kg) | HF-AP 45% Carb | HF-HP 34% Carb | ∆ (HF-AP vs. HF-HP) Weight Change (kg) | |
|---|---|---|---|---|---|---|
| All 1 | (n = 166) −3.3 (−4.4; −2.1) a | (n = 157) −5.0 (−6.2; −3.9) b | 1.8 (0.2;3.4) * | (n = 148) −4.0 (−5.2; −2.8) ab | (n = 168) −4.0 (−5.1; −2.9) ab | −0.03 (−1.7;1.6) |
| FPG < 100 mg/dL | (n = 136) −2.9 (−4.2; −1.7) a | (n = 132) −5.6 (−6.8; −4.3) b | 2.6 (0.9;4.4) * | (n = 119) −4.2 (−5.5; −2.9) ab | (n = 135) −3.9 (−5.1; −2.6) ab | −0.4 (−2.1;1.4) |
| FI < 13.8 µIU/mL | (n = 97) −2.6 (−4.1; −1.2) a | (n = 105) −5.5 (−6.9; −4.1) b | 2.9 (0.9;4.9) * | (n = 80) −4.5 (−6.1; −2.9) ab | (n = 104) −3.6 (−5.0; −2.2) ab | −0.9 (−3.0;1.2) |
| FI ≥ 13.8 µIU/mL | (n = 39) −3.7 (−5.9; −1.4) | (n = 27) −5.7 (−8.5; −3.0) | 2.1 (−1.4;5.6) | (n = 39) −3.6 (−5.9; −1.3) | (n = 31) −4.7 (−7.3; −2.2) | 1.1 (−2.3;4.5) |
| FPG ≥ 100 mg/dL | (n = 30) −4.6 (−7.2; −2.0) | (n = 25) −3.2 (−6.0; −0.3) | −1.4 (−5.3;2.4) | (n = 29) −2.4 (−5.1;0.2) | (n = 33) −4.4 (−6.9; −2.0) | 2.0 (−1.6;5.6) |
| FI < 13.8 µIU/mL | (n = 11) −5.4 (9.7; −1.2) | (n = 9) −2.2 (−6.9;2.5) | −3.2 (−9.6;3.1) | (n = 14) −1.9 (−5.7;1.9) | (n = 16) −3.6 (−7.1; −0.1) | 1.7 (−3.4;6.9) |
| FI ≥ 13.8 µIU/mL | (n = 19) −4.1 (−7.4; −0.9) | (n = 16) −3.7 (−7.3; −0.2) | −0.4 (−5.2;4.4) | (n = 15) −3.0 (−6.6;0.7) | (n = 17) −5.3 (−8.7; −1.8) | 2.3 (−2.7;7.3) |
| HOMA-IR < 4.0 | (n = 131) −3.4 (−4.6; −2.1) a | (n = 130) −5.3 (−6.6; −4.1) b | 2.0 (0.2;3.7) * | (n = 115) −4.6 (−5.9; −3.3) ab | (n = 133) −3.7 (−4.9; −2.5) ab | −0.9 (−2.7;0.9) |
| HOMA-IR > 4.0 | (n = 35) −2.8 (−5.2; −0.4) ab | (n = 27) −4.5 (−7.2; −1.7) ab | 1.7 (−1.9;5.3) | (n = 33) −1.3 (−3.8;1.1) a | (n = 35) −5.0 (−7.4; −2.5) b | 3.6 (0.2;7.1) * |
| LF-AP 65% Carb | LF-HP 55% Carb | HF-AP 45% Carb | HF-HP 34% Carb | |
|---|---|---|---|---|
| Fiber g/10 MJ (month 6) | n = 80 36.6 ± 12.4 a | n = 79 32.1 ± 10.8 b | n = 68 32.1 ± 9.3 b | n = 80 28.0 ± 9.9 c |
| Fiber g/10 MJ (month 24) | n = 43 33.6 ± 12.8 a | n = 46 29.1 ± 9.3 ab | n = 41 28.6 ± 11.5 b | n = 39 26.2 ± 10.2 b |
| Fiber g/10 MJ (month 6 and 24) 1 | n = 83 35.4 ± 11.7 a | n = 81 31.4 ± 9.6 b | n = 72 30.9 ± 9.2 b | n = 81 27.3 ± 8.6 c |
| n | Correlations 1 (Change in Fiber Intake 2) | Correlations 1 (Fiber Intake during Intervention 3) | n | Weight Change (kg) [<35 g Fiber/10 MJ 3] | n | Weight Change (kg) [≥35 g Fiber/10 MJ 3] | ∆ Weight Change (kg) 3 | |
|---|---|---|---|---|---|---|---|---|
| All | 317 | −0.23 */−0.22 * | −0.17 */−0.18 * | 210 | −4.1 (−5.1;3.1) | 107 | −6.5 (−8.0; −4.9) | 2.4 (0.6;4.1) * |
| FPG (mg/dL) | ||||||||
| <100 | 254 | −0.21 */−0.21 * | −0.15 */−0.15 * | 170 | −4.0 (−5.1; −2.9) | 84 | −6.3 (−8.1; −4.5) | 2.3 (0.3;4.3) * |
| ≥100 | 63 | −0.31 */−0.27 * | −0.25 */−0.27 * | 40 | −4.5 (−6.9; −2.0) | 23 | −7.1 (−10.2; −4.0) | 2.7 (−1.3;6.6) |
| FI | ||||||||
| <13.8 | 210 | −0.28 */−0.28 * | −0.23 */−0.22 * | 138 | −3.3 (−4.3; −2.3) | 72 | −6.0 (−7.7; −4.3) | 2.7 (0.8;4.5) * |
| ≥13.8 | 107 | −0.15/−0.15 | −0.12/−0.12 | 72 | −5.6 (−7.8; −3.5) | 35 | −7.5 (−10.7; −4.3) | 1.9 (−1.9;5.6) |
| FPG & FI | ||||||||
| <100 & <13.8 | 179 | −0.24 */−0.24 * | −0.17 */−0.16 * | 122 | −3.4 (−4.5; −2.3) | 57 | −5.4 (−7.3; −3.6) | 2.0 (0.02;4.0) * |
| <100 & ≥13.8 | 75 | −0.15/−0.17 | −0.14/−0.16 | 48 | −5.6 (−8.2; −2.9) | 27 | −8.1 (−12.1; −4.1) | 2.6 (−2.0;7.2) |
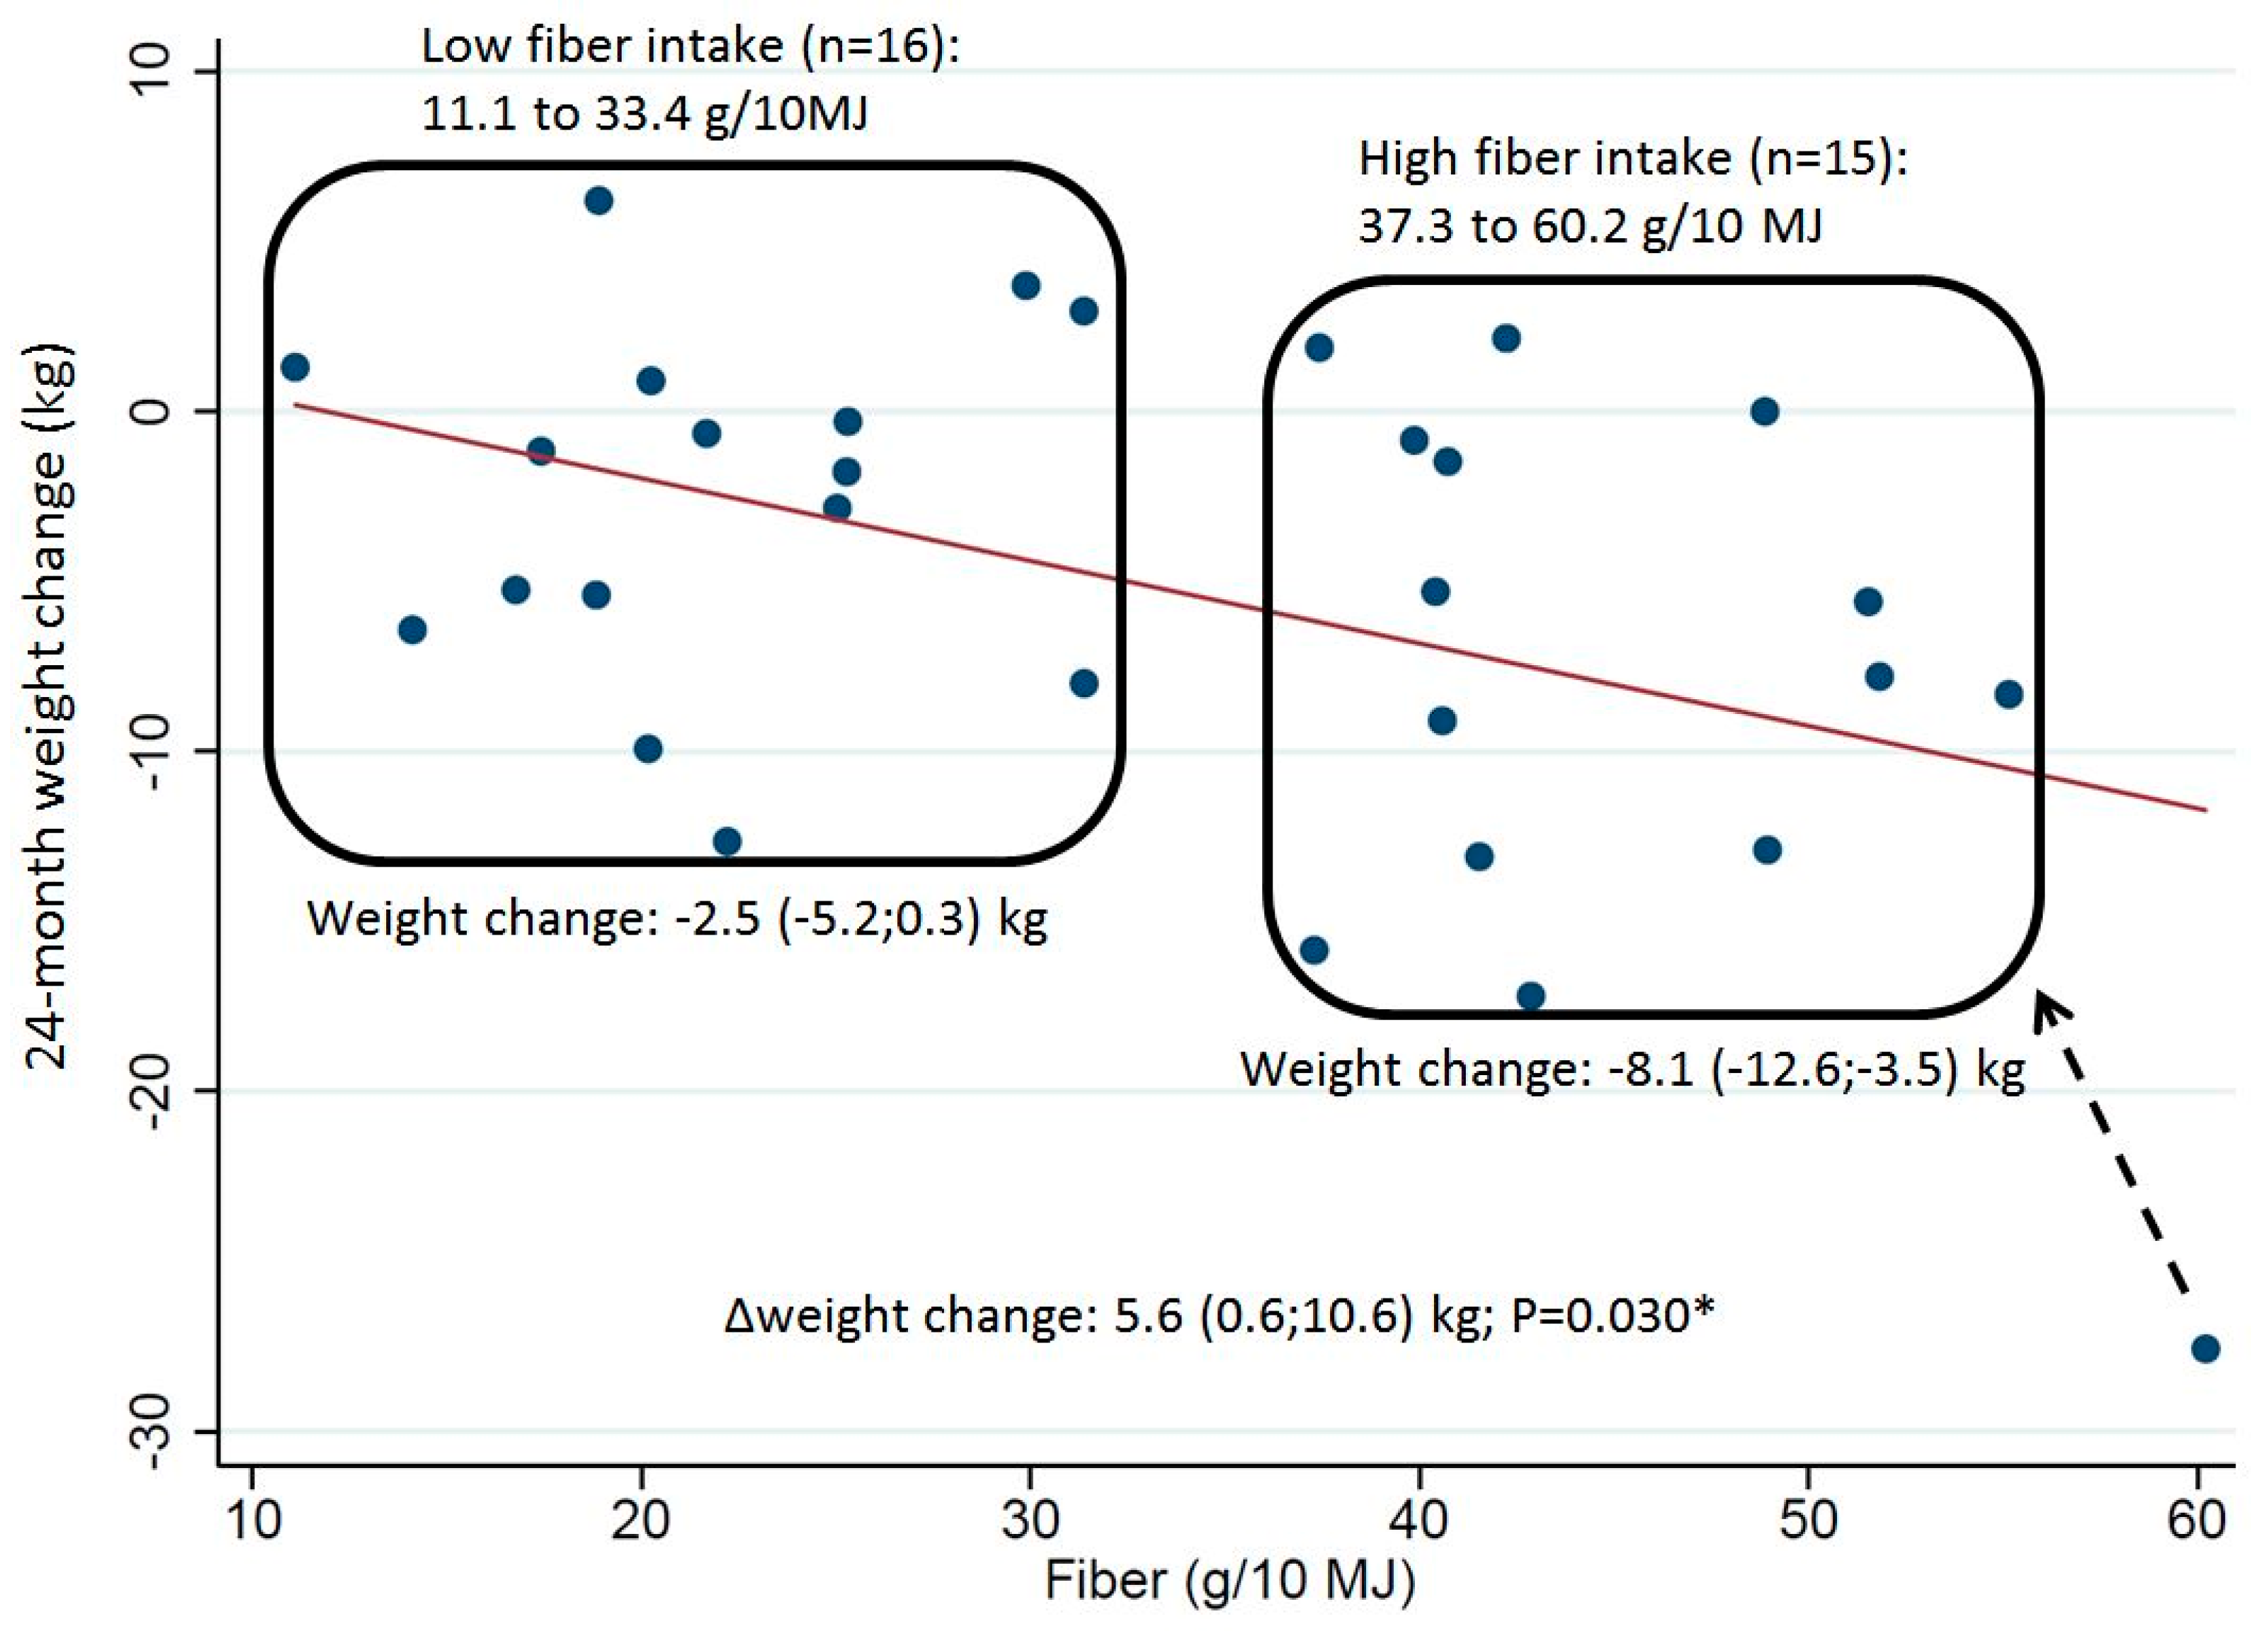
| ≥100 & <13.8 | 31 | −0.47 */−0.47 * | −0.45 */−0.47 * | 16 | −2.5 (−5.2;0.3) | 15 | −8.1 (−12.6; −3.5) | 5.6 (0.6;10.6) * |
| ≥100 & ≥13.8 | 32 | −0.14/−0.20 | −0.01/−0.05 | 24 | −5.8 (−9.6; −2.0) | 8 | −5.4 (−9.2; −1.6) | −0.4 (−7.2;6.4) |
| HOMA-IR | ||||||||
| <4.0 | 251 | −0.25 */−0.24 * | −0.19 */−0.19 * | 167 | −3.8 (−4.9; −2.8) | 84 | −6.5 (−8.2; −4.7) | 2.6 (0.7;4.5) * |
| >4.0 | 66 | −0.17/−0.16 | −0.12/−0.10 | 43 | −5.0 (−7.8; −2.3) | 23 | −6.5 (−9.7; −3.2) | 1.4 (−3.0;5.8) |
© 2019 by the authors. Licensee MDPI, Basel, Switzerland. This article is an open access article distributed under the terms and conditions of the Creative Commons Attribution (CC BY) license (http://creativecommons.org/licenses/by/4.0/).
Share and Cite
Hjorth, M.F.; Bray, G.A.; Zohar, Y.; Urban, L.; Miketinas, D.C.; Williamson, D.A.; Ryan, D.H.; Rood, J.; Champagne, C.M.; Sacks, F.M.; et al. Pretreatment Fasting Glucose and Insulin as Determinants of Weight Loss on Diets Varying in Macronutrients and Dietary Fibers—The POUNDS LOST Study. Nutrients 2019, 11, 586. https://doi.org/10.3390/nu11030586
Hjorth MF, Bray GA, Zohar Y, Urban L, Miketinas DC, Williamson DA, Ryan DH, Rood J, Champagne CM, Sacks FM, et al. Pretreatment Fasting Glucose and Insulin as Determinants of Weight Loss on Diets Varying in Macronutrients and Dietary Fibers—The POUNDS LOST Study. Nutrients. 2019; 11(3):586. https://doi.org/10.3390/nu11030586
Chicago/Turabian StyleHjorth, Mads F., George A. Bray, Yishai Zohar, Lorien Urban, Derek C. Miketinas, Donald A. Williamson, Donna H. Ryan, Jennifer Rood, Catherine M. Champagne, Frank M. Sacks, and et al. 2019. "Pretreatment Fasting Glucose and Insulin as Determinants of Weight Loss on Diets Varying in Macronutrients and Dietary Fibers—The POUNDS LOST Study" Nutrients 11, no. 3: 586. https://doi.org/10.3390/nu11030586