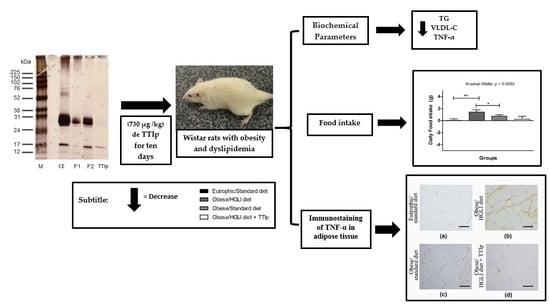
Anti-TNF-α Agent Tamarind Kunitz Trypsin Inhibitor Improves Lipid Profile of Wistar Rats Presenting Dyslipidemia and Diet-induced Obesity Regardless of PPAR-γ Induction

 , and
, and
Abstract
:
1. Introduction
2. Materials and Methods
2.1. Type of Study and Biological Material
2.2. In Vitro Experiment
2.3. In Vivo Experiments
2.4. Animals
2.5. Diets
2.6. Food Intake and Weight Gain Evolution
2.7. Biochemical Parameters
2.8. PPAR-γ and TNF-α Expression in Adipose Tissue
2.9. Immunohistochemistry of TNF-α
2.10. Statistical Analysis
3. Results
3.1. TTIp
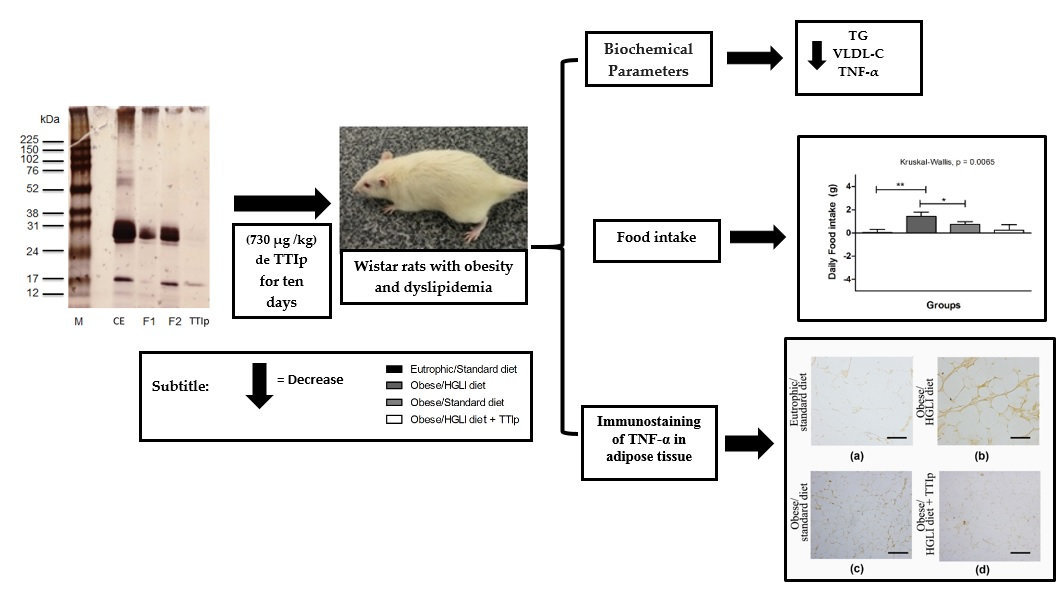
3.2. Food Intake and Weight Gain
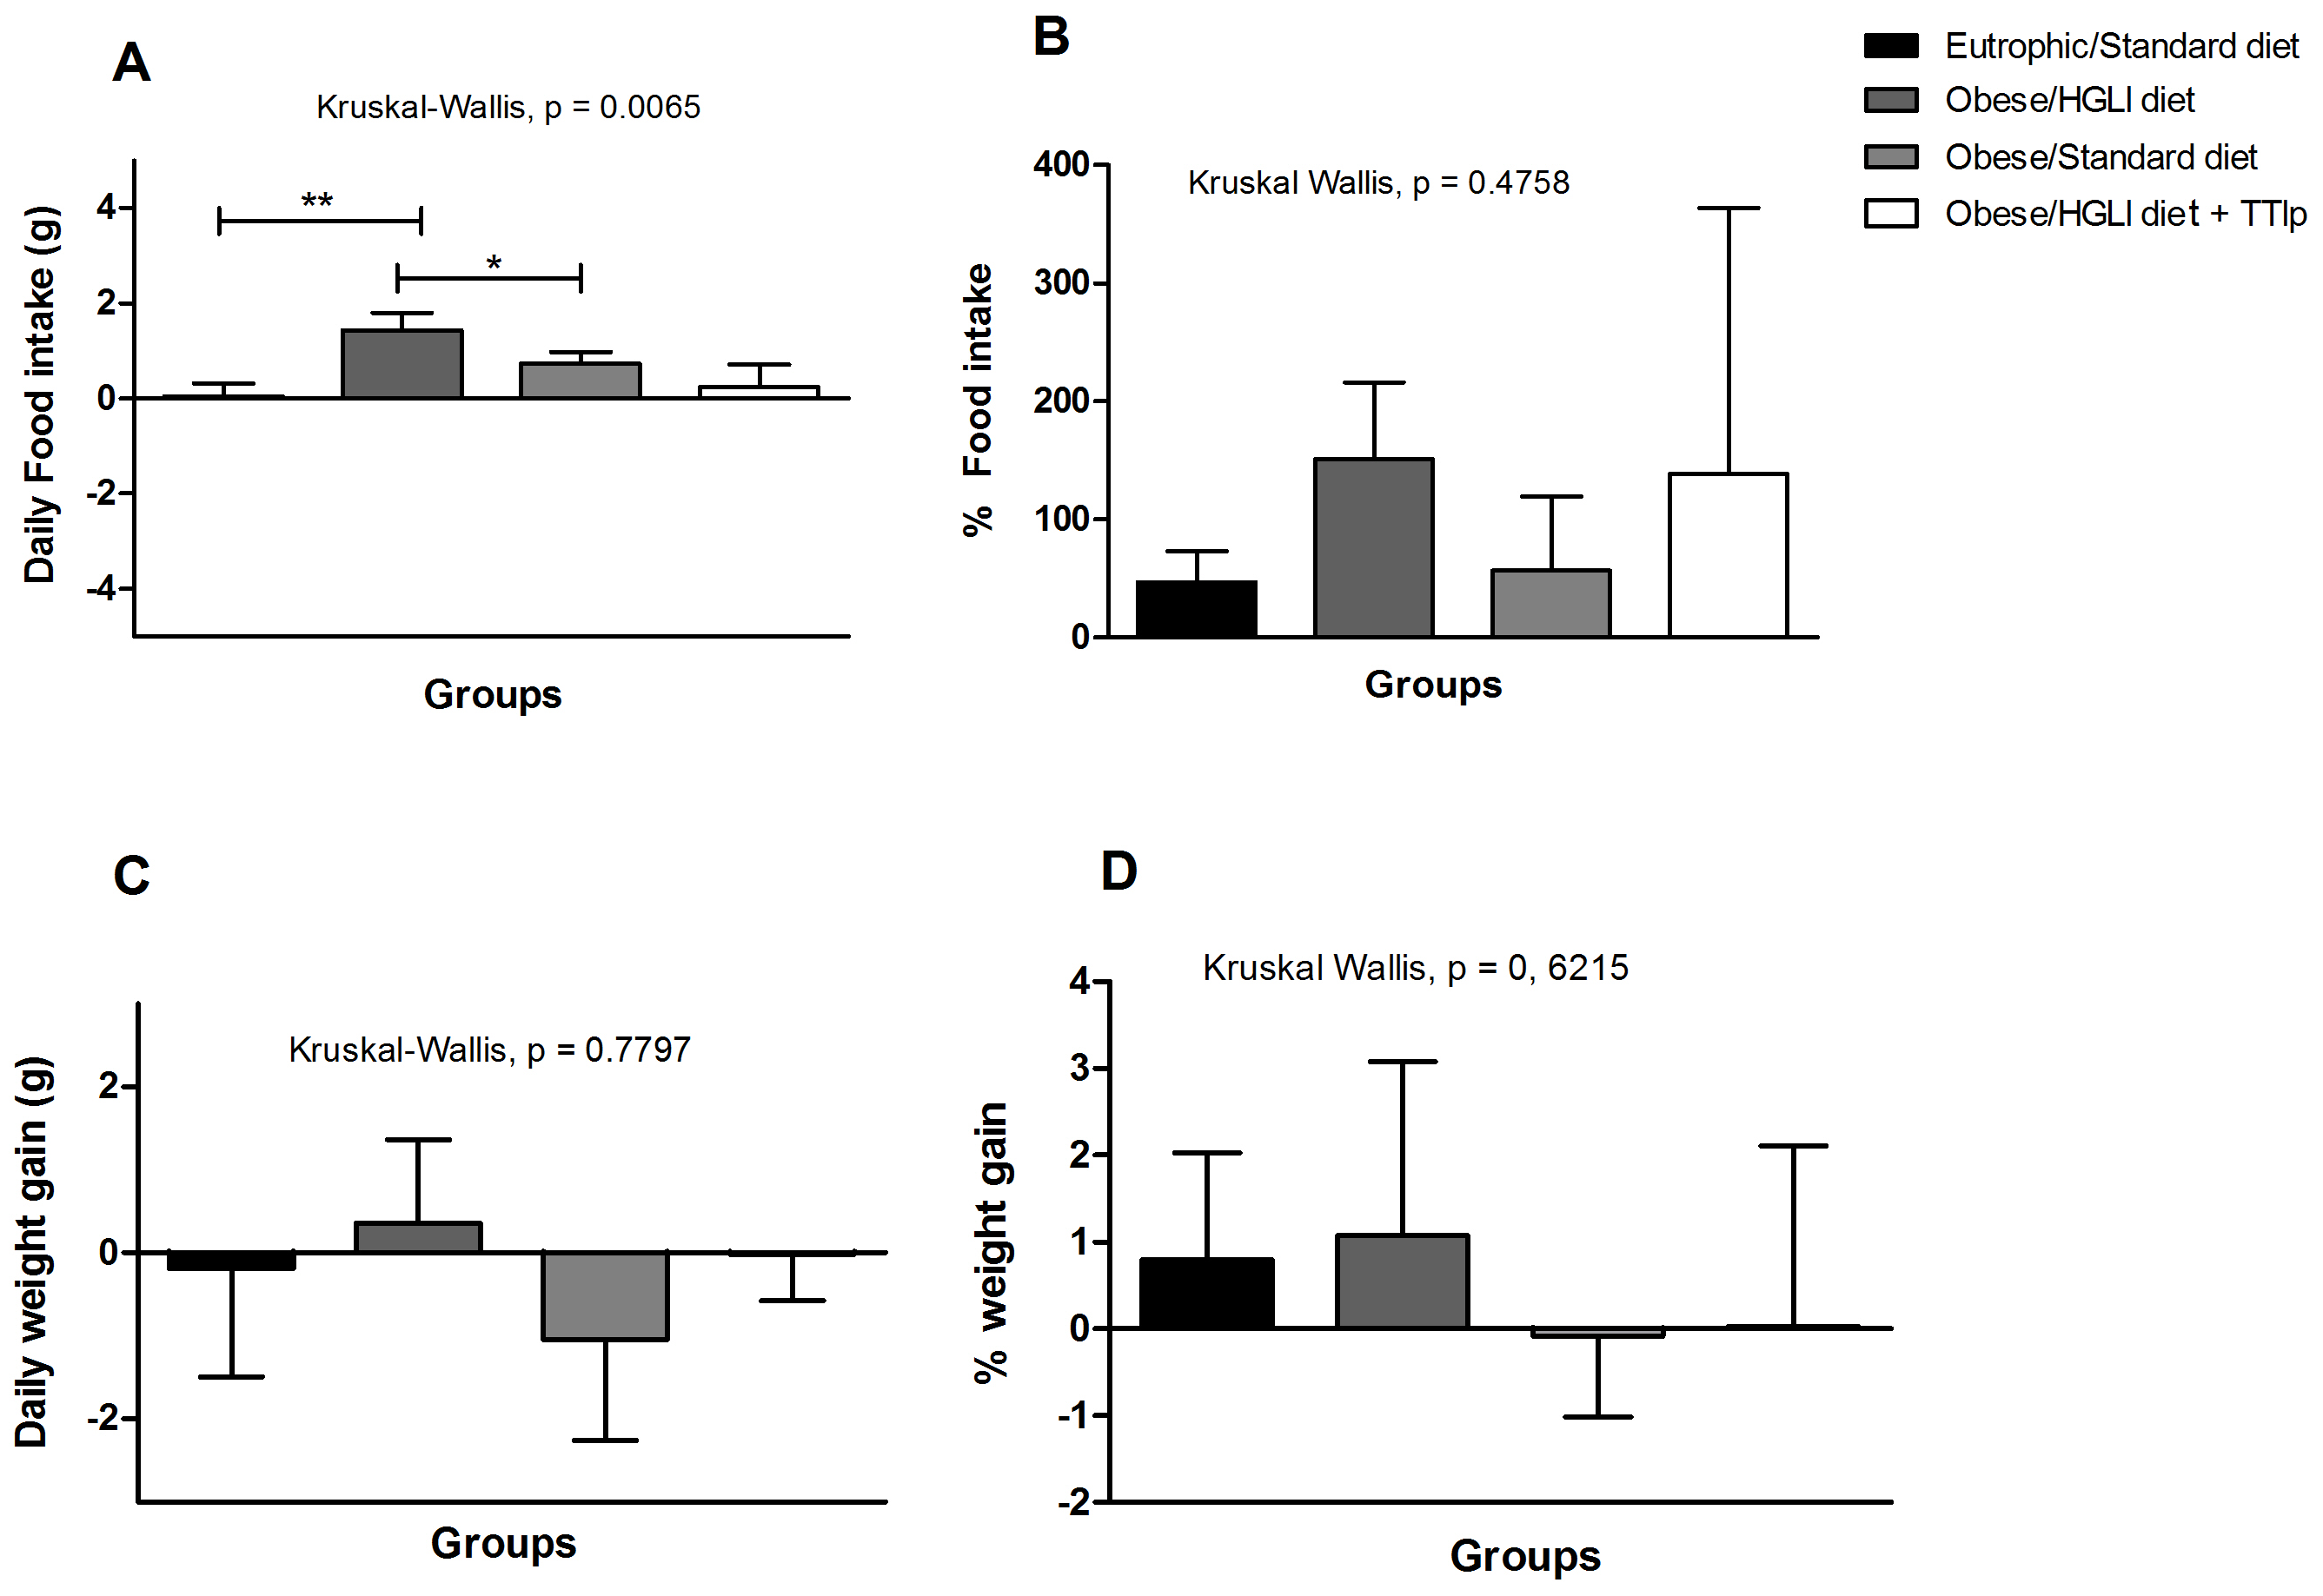
3.3. Glucose
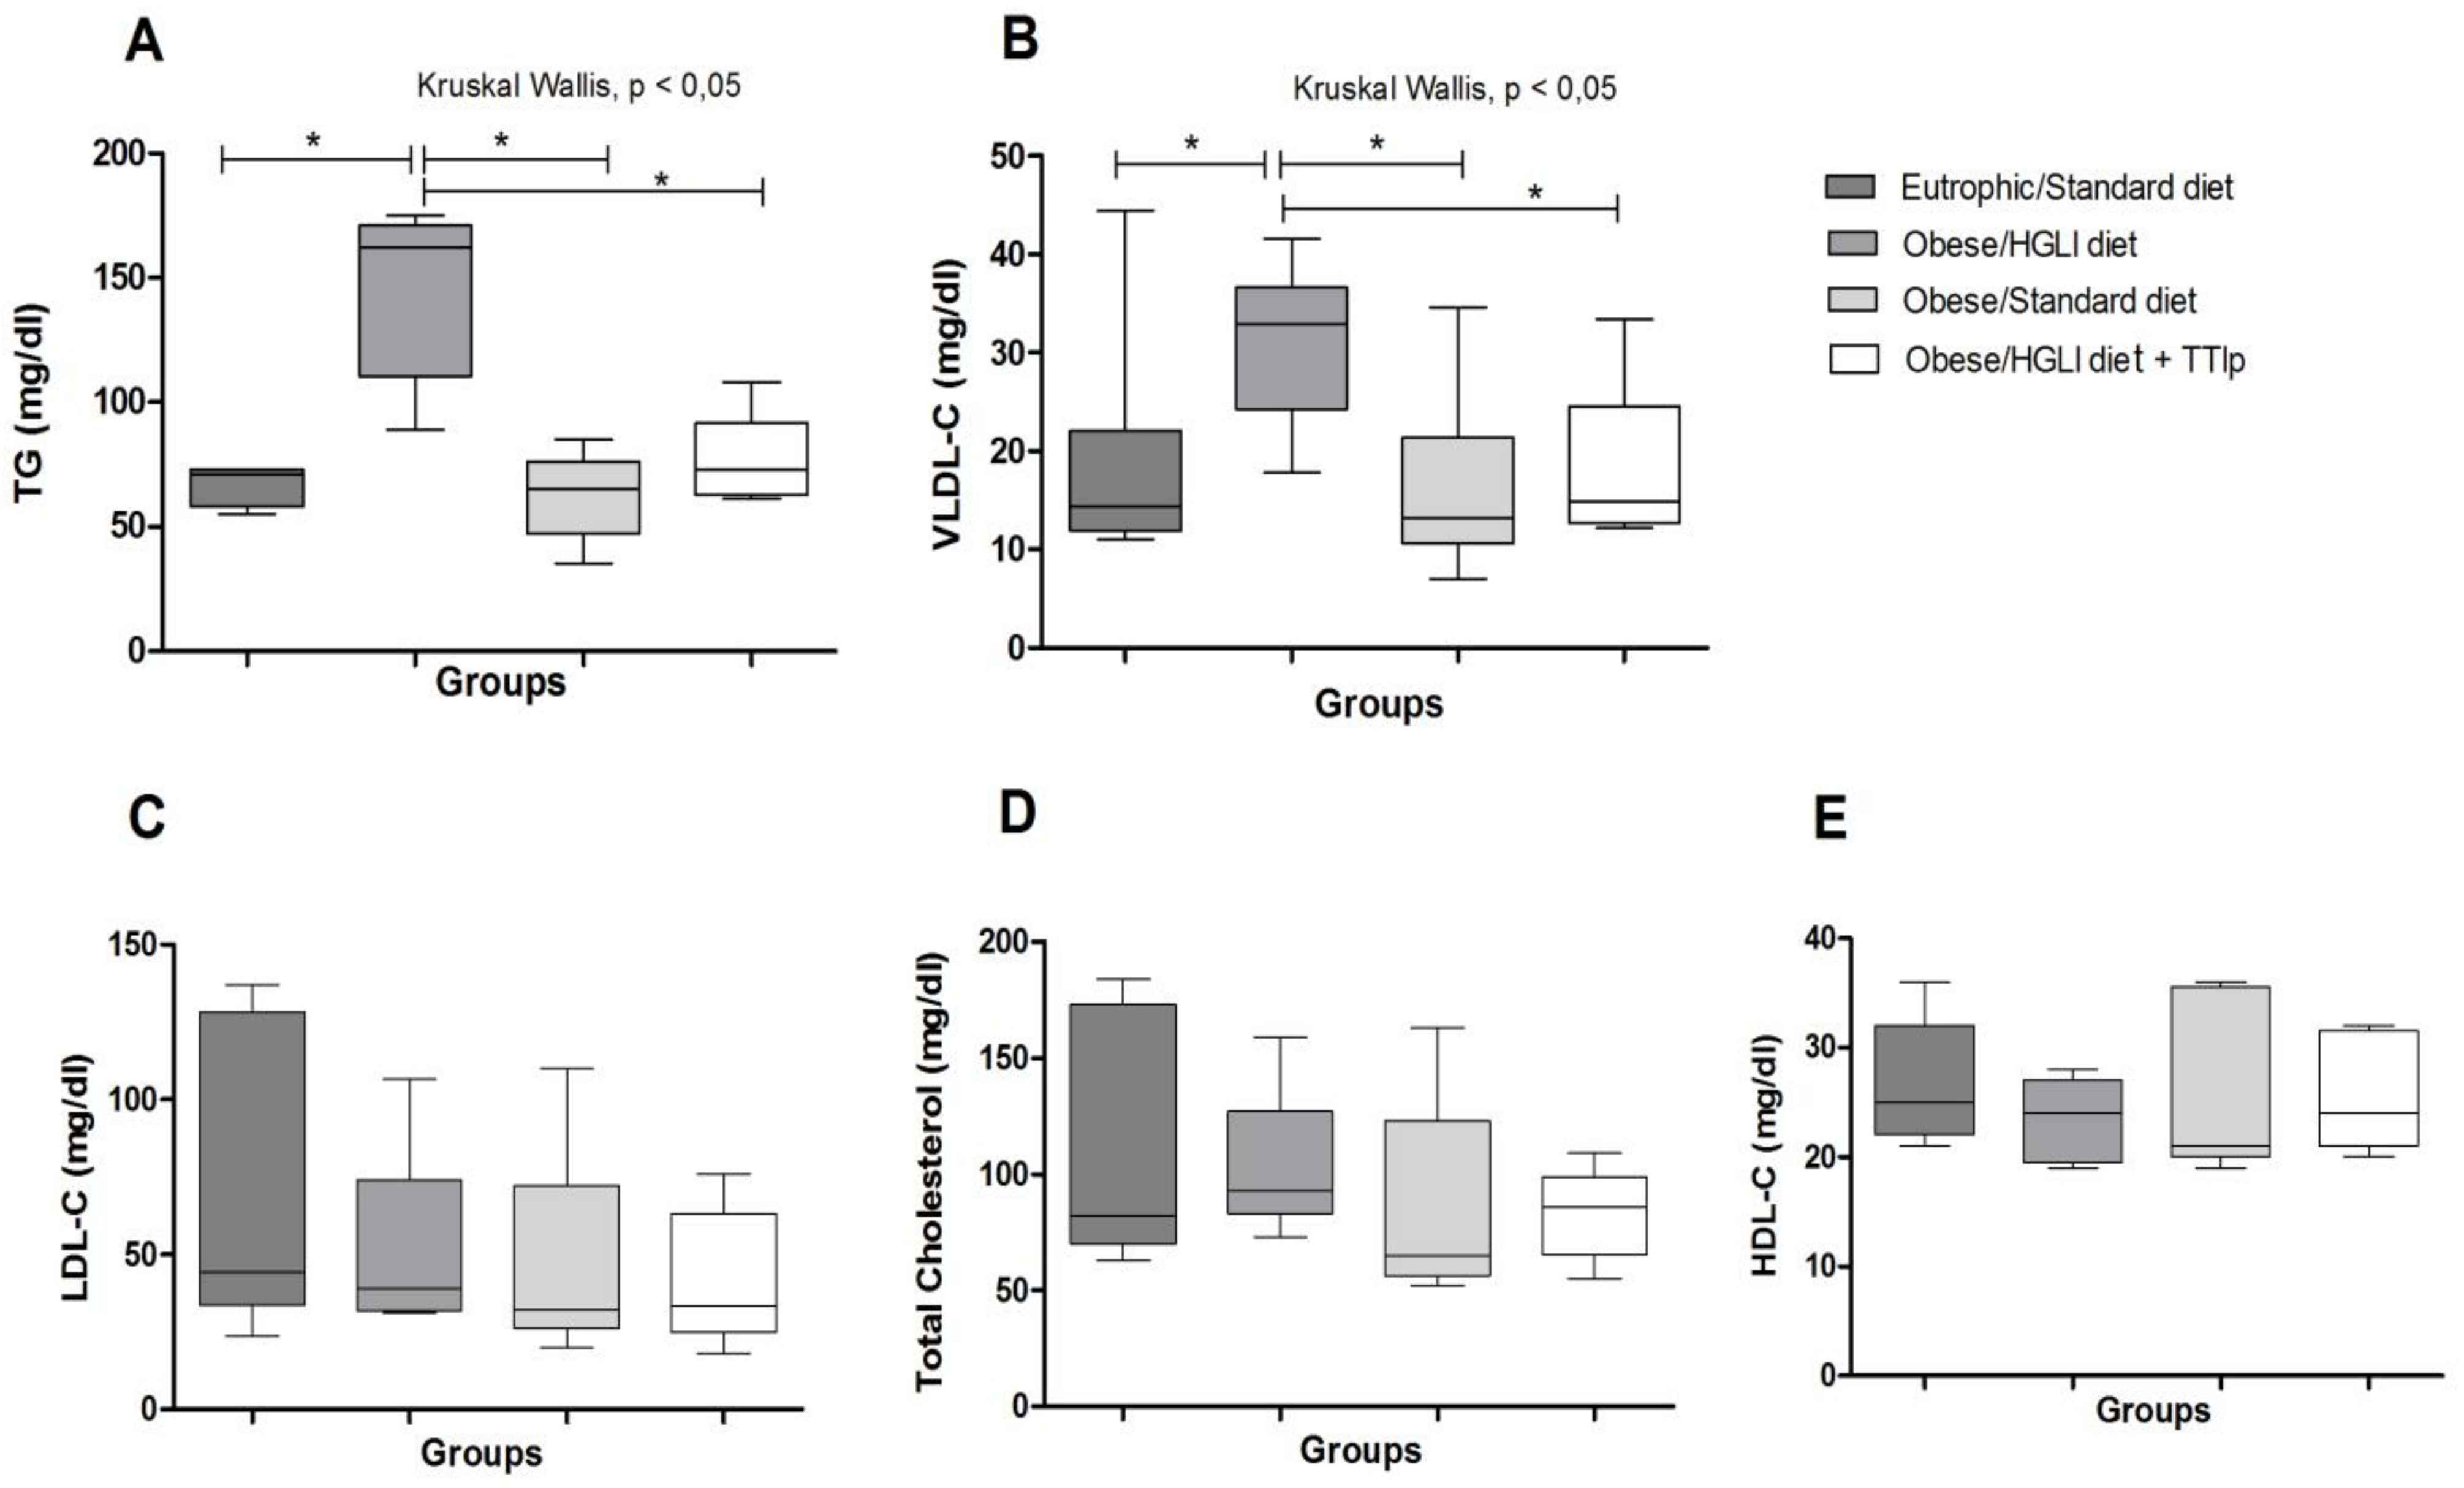
3.4. Lipid Profile
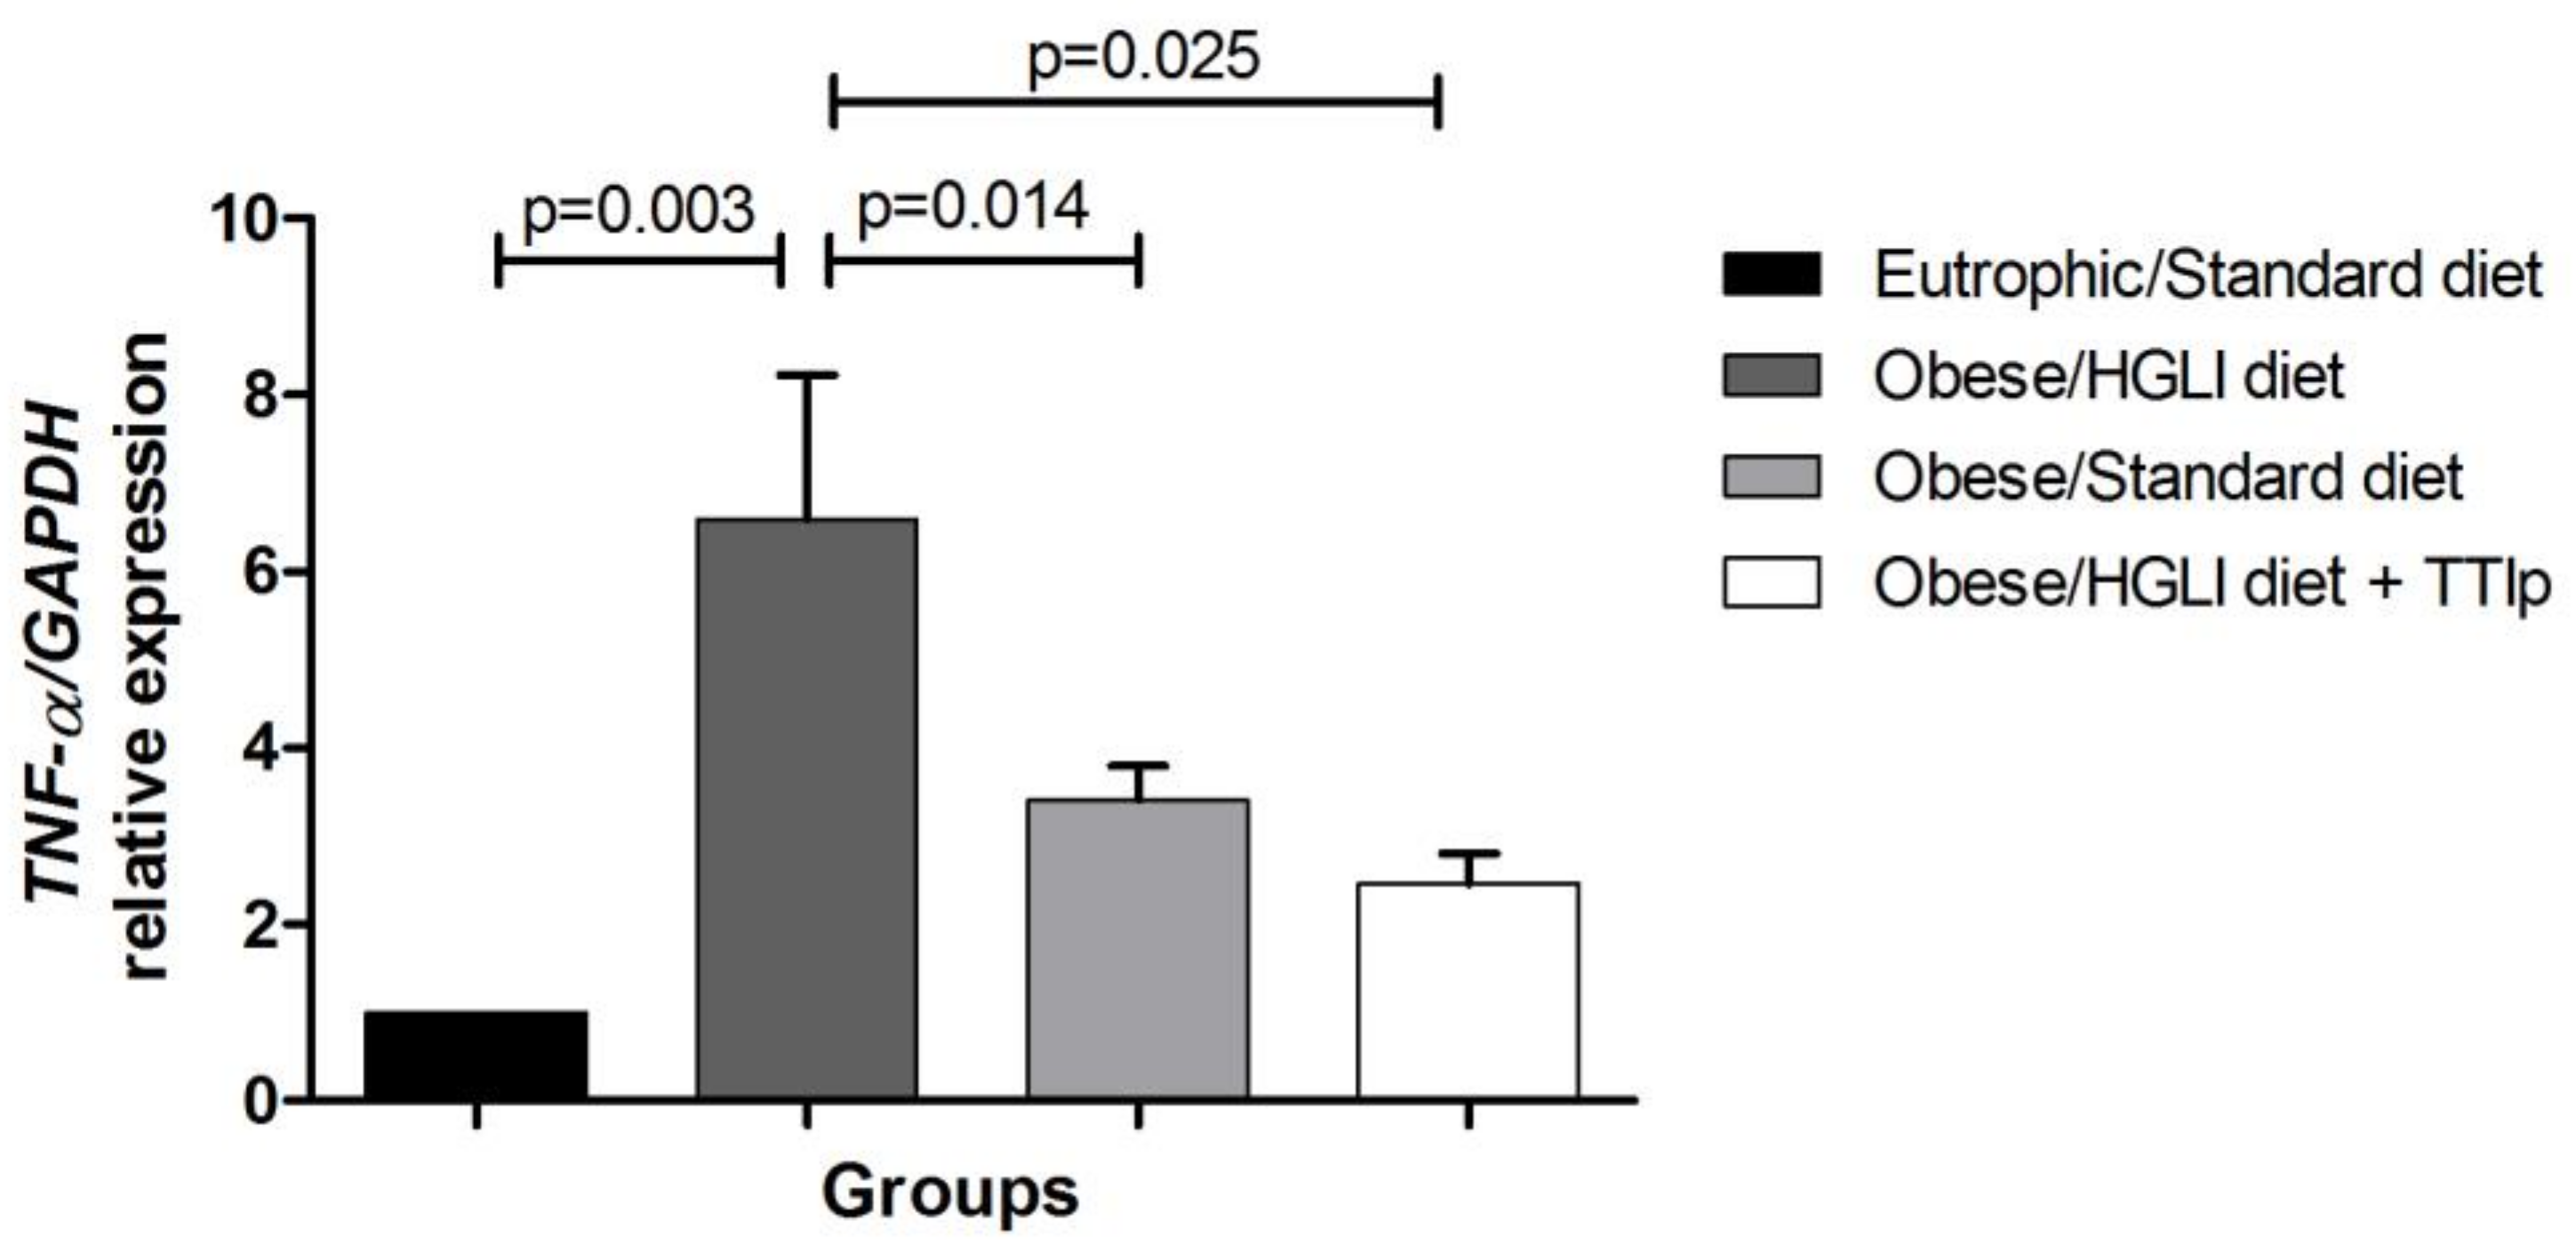
3.5. TNF-α
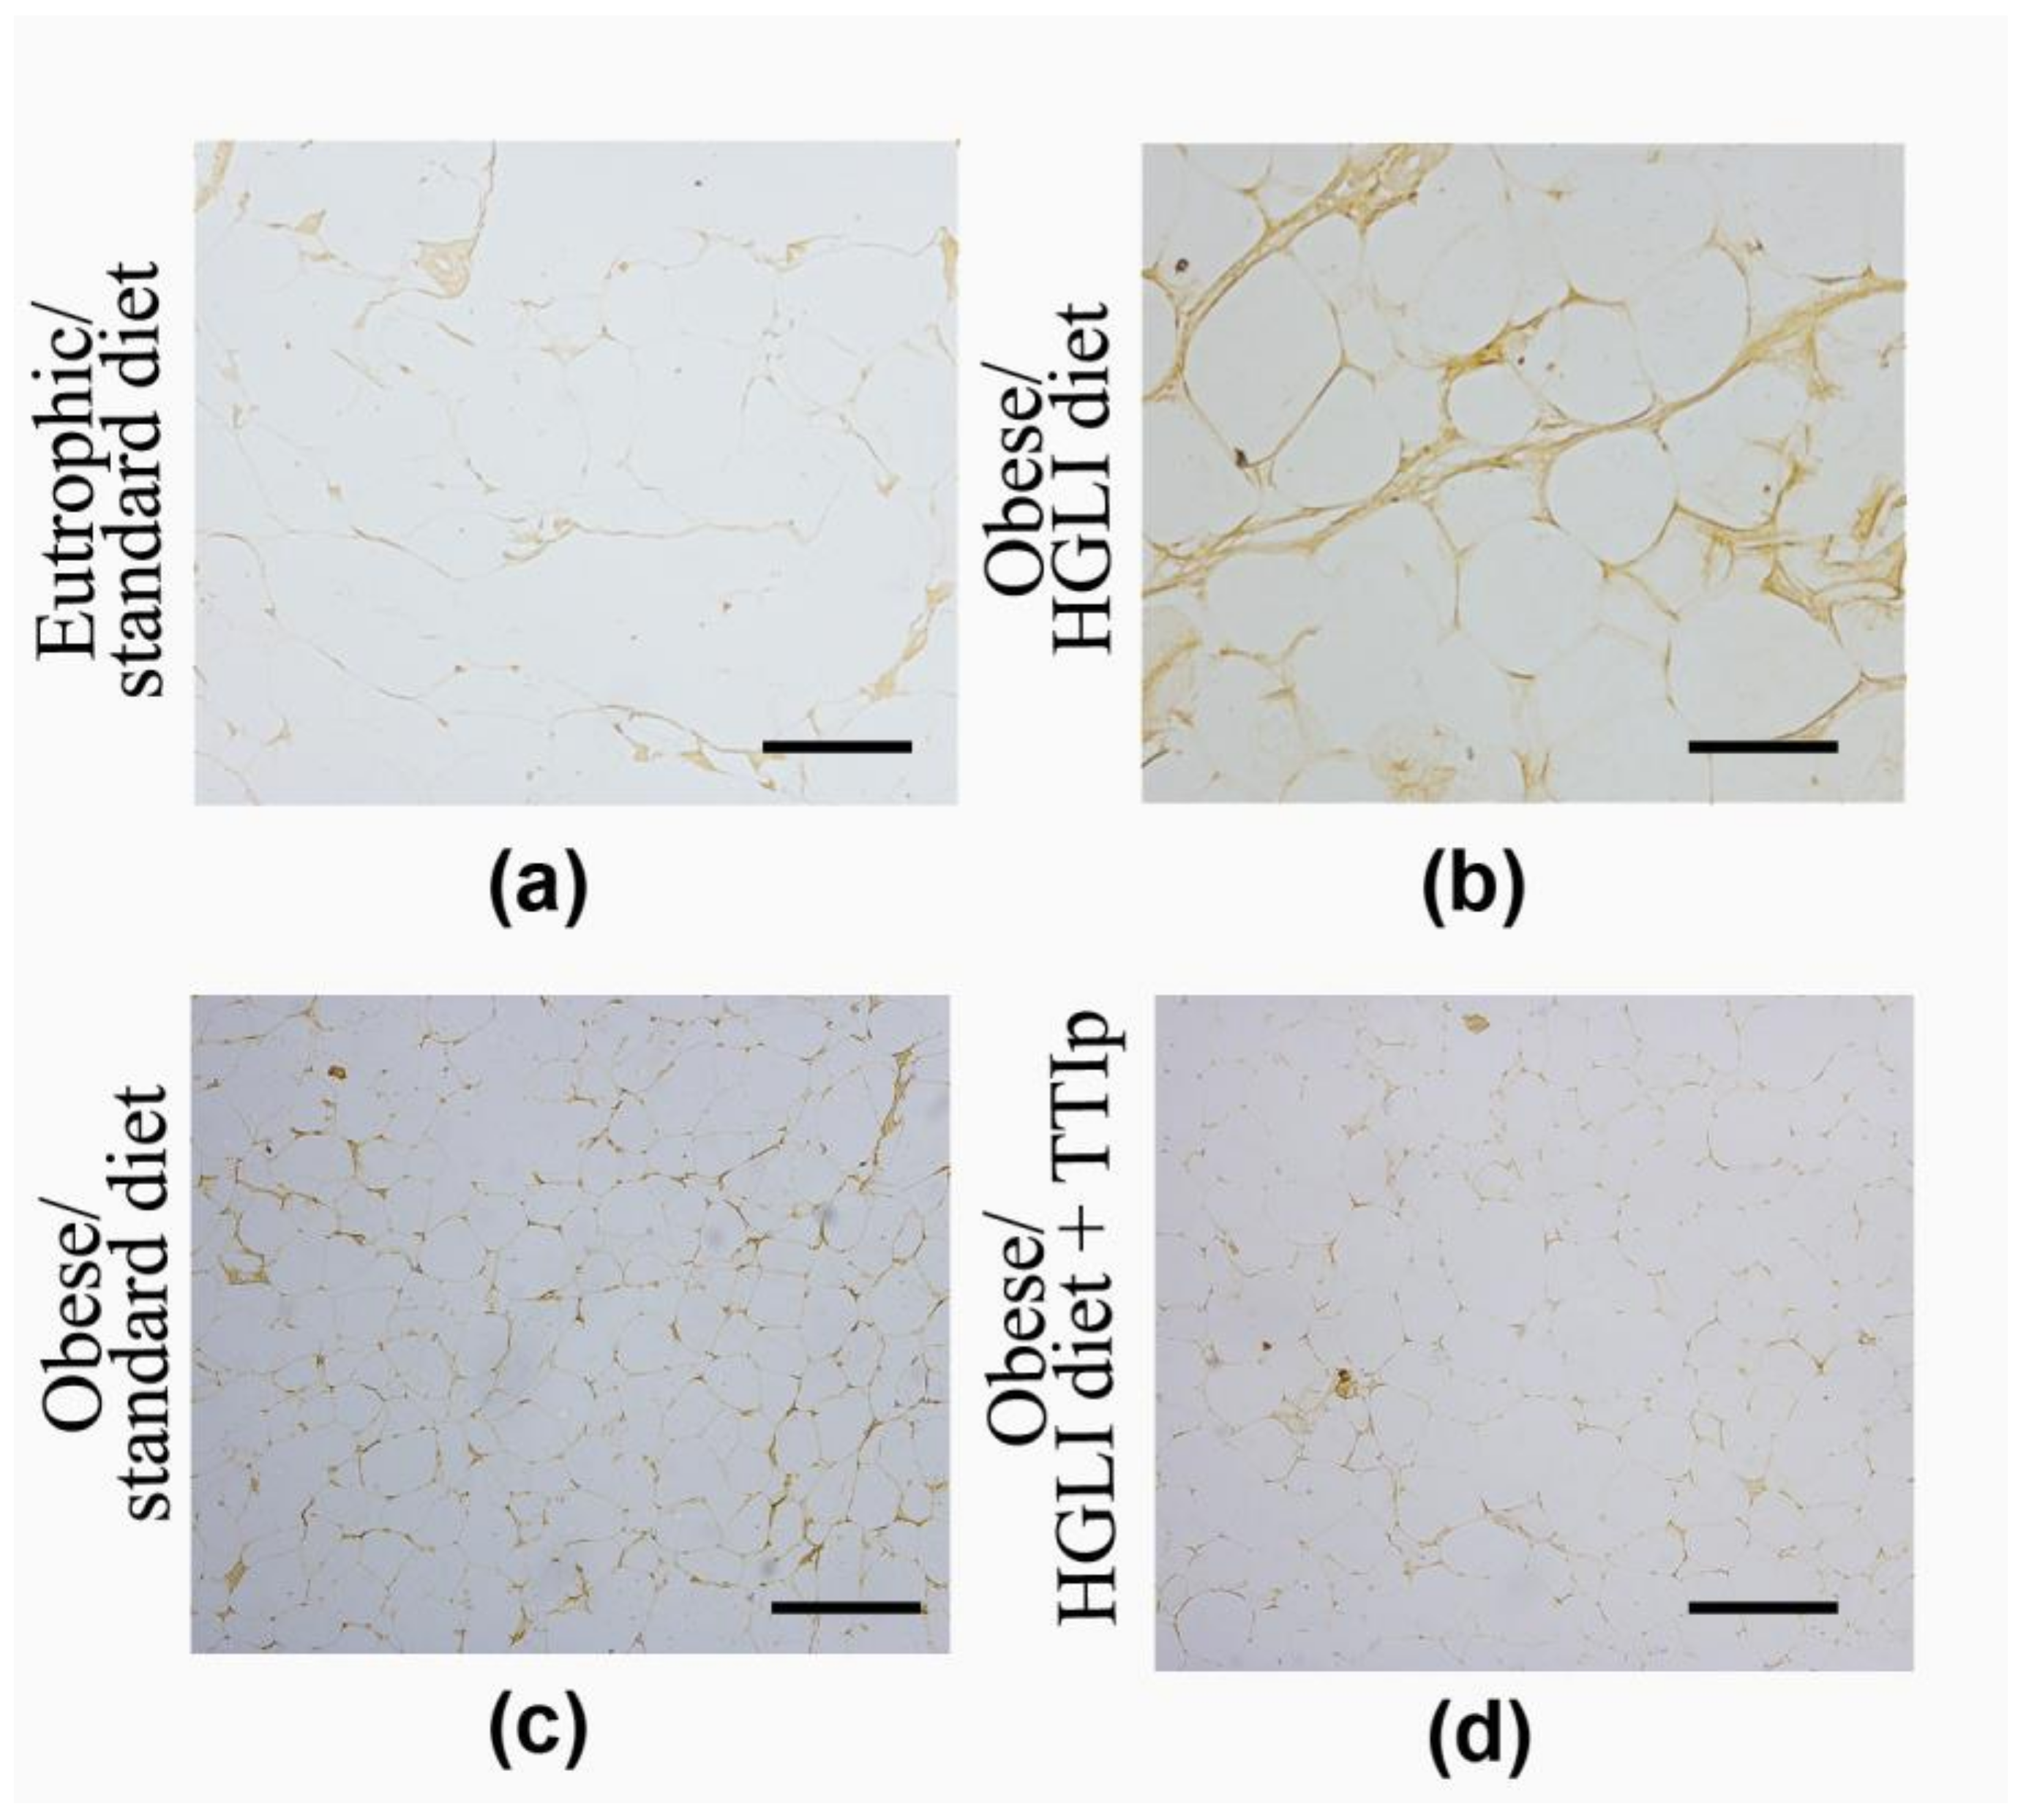
3.6. Immunohistochemistry of TNF-α
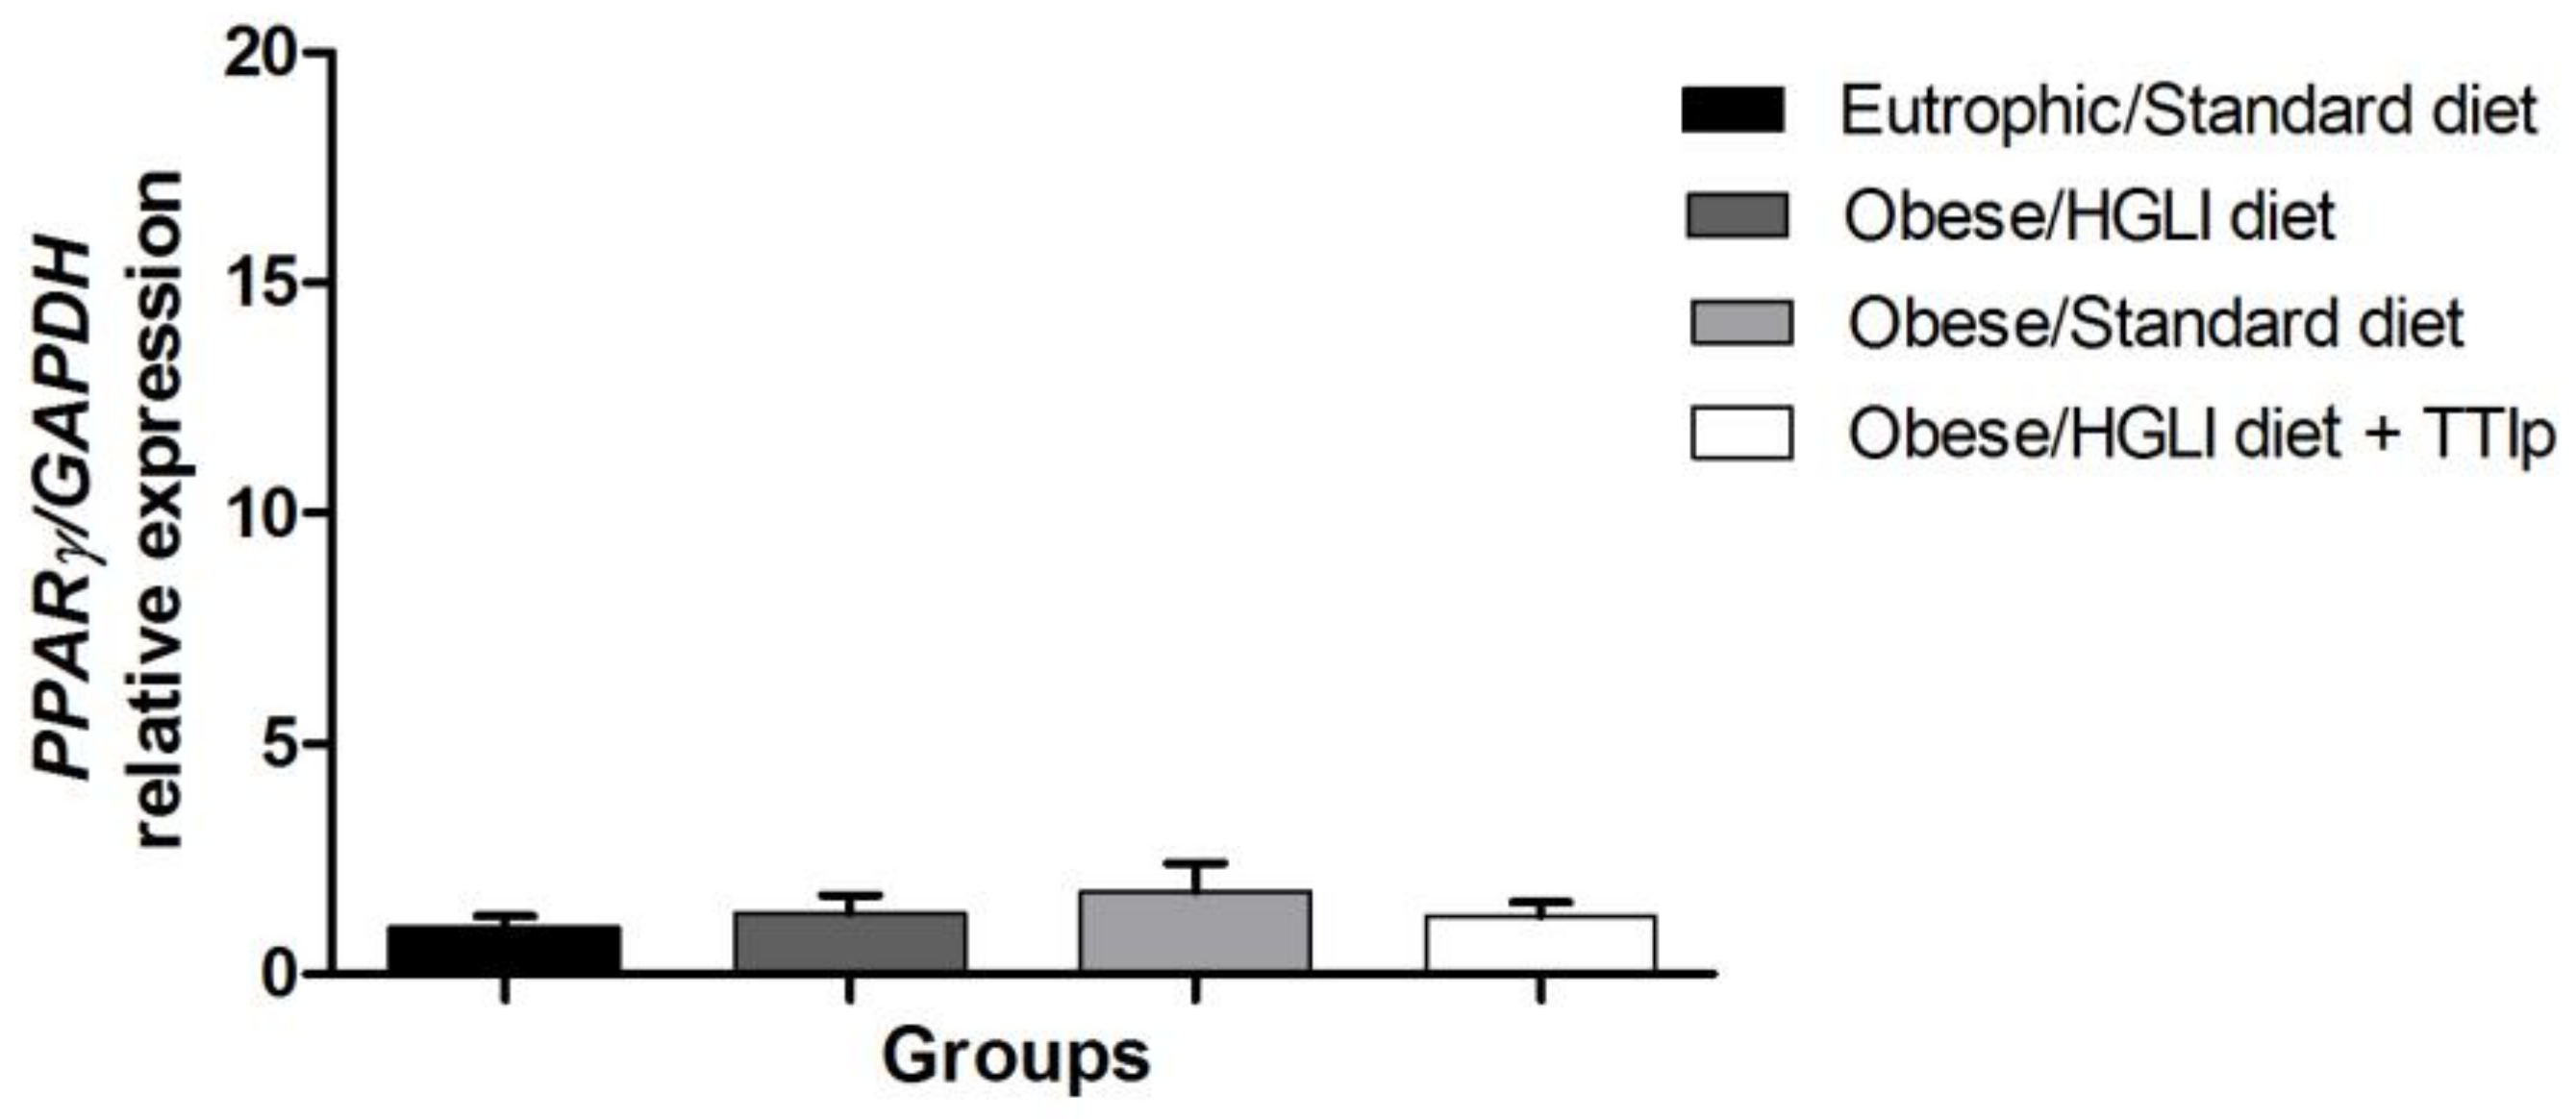
3.7. PPAR-γ
4. Discussion
5. Conclusions
Supplementary Materials
Author Contributions
Funding
Conflicts of Interest
References
- Uyeda, K.; Yamashita, H.; Kawaguchi, T. Carbohydrate responsive element-binding protein (ChREBP): A key regulator of glucose metabolism and fat storage. Biochem. Pharmacol. 2002, 63, 2075–2080. [Google Scholar] [CrossRef]
- Delzenne, N.; Ferré, P.; Beylot, M.; Daubioul, C.; Declercq, B.; Diraison, F.; Dugail, I.; Foufelle, F.; Foretz, M.; Mace, K.; et al. Study of the regulation by nutrients of the expression of genes involved in lipogenesis and obesity in humans and animals. Nutr. Metab. Cardiovasc. Dis. 2001, 11, 118–121. [Google Scholar] [PubMed]
- Stoeckman, A.K.; Towle, H.C. The role of SREBP-1c in nutritional regulation of lipogenic enzyme gene expression. J. Biol. Chem. 2002, 277, 27029–27035. [Google Scholar] [CrossRef] [PubMed]
- Kersten, S. Mechanisms of nutritional and hormonal regulation of lipogenesis. EMBO Rep. 2001, 21, 282–286. [Google Scholar] [CrossRef] [PubMed]
- Virdis, A.; Colucci, R.; Bernardini, N.; Blandizzi, C.; Taddei, S.; Masi, S. Microvascular endothelial dysfunction in human obesity: Role of TNF-α. J. Clin. Endocrinol. Metab. 2018, 104, 341–348. [Google Scholar] [CrossRef] [PubMed]
- World Health Organization. Global Action Plan for the Prevention and Control of NCDs 2013–2020. Available online: http://apps.who.int/gb/ebwha/pdf_files/WHA66/A66_R10-en.pdf (accessed on 1 May 2018).
- GBD. Health effects of overweight and obesity in 195 countries over 25 years. N. Engl. J. Med. 2017, 377, 13–27. [Google Scholar] [CrossRef] [PubMed]
- Guimarães, M.F.; Pinto, M.R.; Raid, R.G.; Andrade, M.V.M.; Kakehas, A.M. Which is the best cutoff of body mass index to identify obesity in female patients with rheumatoid arthritis? A study using dual energy X-ray absorptiometry body composition. Rev. Bras. Reumatol. 2016, 57, 279–285. [Google Scholar] [CrossRef] [PubMed]
- Tilg, H.; Moschen, A.R. Adipocytokines: Mediators linking adipose tissue, inflammation and immunity. Nat. Rev. Immunol. 2006, 6, 772–783. [Google Scholar] [CrossRef] [PubMed]
- Permana, P.A.; Zhang, W.; Wabitsch, M.; Fischer-Posovszky, P.; Duckworth, W.C.; Reaven, P.D. Pioglitazone reduces inflammatory responses of human adipocytes to factors secreted by monocytes/macrophages. Am. J. Physiol. Endocrinol. Metab. 2009, 296, E1076–E1084. [Google Scholar] [CrossRef] [PubMed]
- De Souza, C.T.; Araujo, E.P.; Bordin, S.; Ashimine, R.; Zollner, R.L.; Boschero, A.C.; Saad, M.J.; Velloso, L.A. Consumption of a fat-rich diet activates a proinflammatory response and induces insulin resistance in the hypothalamus. Endocrinology 2005, 146, 4192–4199. [Google Scholar] [CrossRef] [PubMed]
- Sethi, J.K.; Hotamisligil, G.S. The role of TNF alpha in adipocyte metabolism. Semin. Cell Dev. Biol. 1999, 10, 19–29. [Google Scholar] [CrossRef] [PubMed]
- Harwood, H.J., Jr. The adipocyte as an endocrine organ in the regulation of metabolic homeostasis. Neuropharmacology 2012, 63, 57–75. [Google Scholar] [CrossRef] [PubMed]
- Lyon, C.J.; Law, R.E.; Hsueh, W.A. Minireview: Adiposity, inflammation, and atherogenesis. Endocrinology 2003, 144, 2195–2200. [Google Scholar] [CrossRef] [PubMed]
- Shah, A.; Mehta, N.; Reilly, M.P. Adipose inflammation, insulin resistance, and cardiovascular disease. JPEN J. Parenter. Enteral. Nutr. 2008, 32, 638–644. [Google Scholar] [CrossRef] [PubMed]
- Brown, J.F.; Plutzky, J. Peroxisome proliferator-activated receptors as transcriptional nodal points and therapeutic targets. Circulation 2007, 115, 518–533. [Google Scholar] [CrossRef] [PubMed]
- Melo, F.J.; Magina, S. Clinical management of Anti-TNF-alpha-induced psoriasis or psoriasiform lesions in inflammatory bowel disease patients: A systematic review. Int. J. Dermatol. 2018, 57, 1521–1532. [Google Scholar] [CrossRef] [PubMed]
- Lim, H.; Lee, S.H.; Lee, H.T.; Lee, J.U.; Son, J.Y.; Shin, W.; Heo, Y.S. Structural biology of the TNFα antagonists used in the treatment of rheumatoid arthritis. Int. J. Mol. Sci. 2018, 19, 768. [Google Scholar] [CrossRef] [PubMed]
- Mitoma, H.; Horiuchi, T.; Tsukamoto, H.; Ueda, N. Molecular mechanisms of action of anti-TNF-α agents—Comparison among therapeutic TNF-α antagonists. Cytokine 2018, 101, 56–63. [Google Scholar] [CrossRef] [PubMed]
- Cacciapaglia, F.; Navarini, L.; Menna, P.; Salvatorelli, E.; Minotti, G.; Afeltra, A. Cardiovascular safety of anti-TNF-alpha therapies: Facts and unsettled issues. Autoimmun. Rev. 2011, 10, 631–635. [Google Scholar] [CrossRef] [PubMed]
- Li, Z.; Maglione, M.; Tu, W.; Mojica, W.; Arterburn, D.; Shugarman, L.R.; Hilton, L.; Suttorp, M.; Solomon, V.; Shekelle, P.G. Meta-analysis: Pharmacologic treatment of obesity. Ann. Intern. Med. 2005, 142, 532. [Google Scholar] [CrossRef] [PubMed]
- Yanovski, S.Z.; Yanovski, A. Obesity. N. Engl. J. Med. 2002, 346, 591–602. [Google Scholar] [CrossRef] [PubMed]
- Chen, W.; Hira, T.; Nakajima, S.; Tomozawa, H.; Tsubata, M.; Yamaguchi, K. Suppressive effect on food intake of a potato extract (Potein®) involving cholecystokinin release in rats. Biosci. Biotechinol. Biochem. 2012, 76, 1104–1109. [Google Scholar] [CrossRef] [PubMed]
- Lima, V.C.O.; Piuvezam, G.; Maciel, B.L.L.; Morais, A.H.A. Trypsin inhibitors: Promising candidate satietogenic proteins as complementary treatment for obesity and metabolic disorders? J. Enzyme Inhib. Med. Chem. 2019, 34, 405–419. [Google Scholar]
- Araújo, C.L.; Bezerra, I.W.L.; Oliveira, A.S.; Moura, F.T.; Macedo, L.L.P.; Gomes, C.E.M.; Barbosa, A.E.A.D.; Macedo, F.P.; Souza, T.M.S.; Franco, O.L.; et al. In vivo bioinsecticidal activity toward Ceratitis capitata (fruit fly) and Callosobruchus maculatus (cowpea weevil) and in vitro bioinsecticidal activity toward different orders of insect pests of a trypsin inhibitor purified from tamarind tree (Tamarindus indica) seeds. Agric. Food Chem. 2005, 53, 4381–4387. [Google Scholar]
- Fook, J.M.; Macedo, L.L.P.; Moura, G.E.; Teixeira, F.M.; Oliveira, A.S.; Queiroz, A.F.S. A serine proteinase inhibitor isolated from Tamarindus indica seeds and its effects on the release of human neutrophil elastase. Life Sci. J. 2005, 76, 2881–2891. [Google Scholar] [CrossRef] [PubMed]
- Ribeiro, J.A.; Serquiz, A.C.; Silva, P.F.; Barbosa, P.B.; Sampaio, T.B.; Araujo Junior, R.F.; Oliveira, A.S.; Machado, R.J.A.; Maciel, B.L.L.; Uchôa, A.F.; et al. Trypsin inhibitor from Tamarindus indica L. seeds reduces weight gain and food consumption and increases plasmatic cholecystokinin levels. Clinics 2015, 70, 136–143. [Google Scholar] [CrossRef]
- Carvalho, F.M.C.; Lima, V.C.O.; Costa, I.S.; Medeiros, A.F.; Serquiz, A.C.; Lima, M.C.J.S.; Serquiz, R.P.; Maciel, B.L.L.; Uchôa, A.F.; Santos, E.A.; et al. A trypsin inhibitor from tamarind reduces food intake and improves inflammatory status in rats with metabolic syndrome regardless of weight loss. Nutrients 2016, 8, 544. [Google Scholar] [CrossRef] [PubMed]
- Medeiros, A.F.; Costa, I.S.; Carvalho, F.M.C.; Kiyota, S.; Souza, B.B.P.; Sifuentes, D.N.; Serquiz, R.P.; Maciel, B.L.L.; Uchôa, A.F.; Santos, E.A.D.; et al. Biochemical characterisation of a Kunitz-type inhibitor from Tamarindus indica L. seeds and its efficacy in reducing plasma leptin in an experimental model of obesity. J. Enzyme Inhib. Med. Chem. 2018, 33, 334–348. [Google Scholar]
- Kakade, M.; Simons, N.; Liener, I. An evaluation of natural vs. synthetic substrates for measuring the antitryptic activity of soybean samples. Cereal Chem. 1969, 46, 518–526. [Google Scholar]
- Bradford, M.M. A rapid and sensitive method for the quantitation of microgram quantities of protein utilizing the principle of protein-dye binding. Anal. Biochem. 1976, 72, 248–254. [Google Scholar] [CrossRef]
- Laemmli, U.K. Cleavage of structural proteins during the assembly of the head of bacteriophage T4. Nature 1970, 227, 680–685. [Google Scholar] [CrossRef] [PubMed]
- Oakley, B.R.; Kirsch, D.R.; Morris, N.R. A simplified ultrasensitive silver stain for detecting proteins in polyacrylamide gels. Anal. Biochem. 1980, 105, 361–363. [Google Scholar] [CrossRef]
- Luz, A.B.S.; Figueredo, J.B.S.; Salviano, B.D.P.D.; Aguiar, A.J.F.C.; Pinheiro, L.G.S.D.; Krause, M.F.D.; Camillo, C.S.; Ladd, F.V.L.; Bortolin, R.H.; Silbiger, V.N.; et al. Adipocytes and intestinal epithelium dysfunctions linking obesity to inflammation induced by high glycemic index pellet-diet in Wistar rats. Biosci. Rep. 2018, 38, 1–15. [Google Scholar] [CrossRef] [PubMed]
- Bernardis, L.L.; Patterson, B.D. Correlation between Lee index and carcass fat content in weanling and adult female rats with hypothalamic lesions. J. Endocrinol. 1968, 40, 527–528. [Google Scholar] [CrossRef] [PubMed]
- Commttiee for the Update of the Guide for the Care and Use of Laboratory Animals; Institute for Laboratory Animal Research; Division on Earth and Life Studies. Guide for the Care and Use of Laboratory Animals, 8th ed.; The National Academies Press: Washington, DC, USA, 2011; p. 246. [Google Scholar]
- Carvalho, F.M.C.; Costa, I.S.; Santos, J.P.S.O.; Oliveira, G.S.; Santos, J.; Silva, F.K.B.; Bortolin, R.H.; Silbiger, V.N.; Neves, R.A.M.; Maciel, B.L.L.; et al. Directly measurement and calculation of the glycemic index and glycemic load in an experimental pellet-diet for obesity induction and its metabolic effects in Wistar rats. 2019; Unpublished work. [Google Scholar]
- Vendramea, S.; Daughertya, A.; Kristoa, A.S.; Risob, P.; Klimis-Zacasa, D. Wild blueberry (Vaccinium Angustifolium) consumption improves inflammatory status in the obese Zucker rat model of the metabolic syndrome. J. Nutr. Biochem. 2013, 24, 1508–1512. [Google Scholar] [CrossRef] [PubMed]
- Livak, K.J.; Schmittgen, T.D. Analysis of relative gene expression data using real time quantitative PCR and the 2−ΔΔCT method. Methods 2001, 25, 402–408. [Google Scholar] [CrossRef] [PubMed]
- Khan, H.A.; Ibrahim, K.E.; Khan, A.; Alrokayan, S.H.; Alhomida, A.S.; Lee, Y.K. Comparative evaluation of immunohistochemistry and real-time PCR for measuring proinflammatory cytokines gene expression in livers of rats treated with gold nanoparticles. Exp. Toxicol. Pathol. 2016, 68, 381–390. [Google Scholar] [CrossRef] [PubMed]
- Varghese, F.; Bukhari, A.B.; Malhotra, R.A. IHC profiler: An open source plugin for the quantitative evaluation and automated scoring of immunohistochemistry images of human tissue samples. PLoS ONE 2014, 9, e96801. [Google Scholar] [CrossRef] [PubMed]
- Costa, S.I.; Medeiros, A.F.; Carvalho, F.M.C.; Lima, V.C.O.; Serquiz, R.P.; Serquiz, A.C.; Silbiger, V.N.; Bortolin, R.H.; Maciel, B.L.L.; Santos, E.A.; et al. Satietogenic protein from tamarind seeds decreases food intake, leptin plasma and CCK-1R gene expression in obese Wistar rats. Obes. Facts 2018, 11, 440–453. [Google Scholar] [CrossRef] [PubMed]
- Cox, M.M.; Nelson, D.L. Lehninger Principles of Biochemistry; WH Freeman & Co.: New York, NY, USA, 2008. [Google Scholar]
- Lima, V.C.O.; Machado, R.J.A.; Monteiro, N.K.V.; Lyra, I.L.; Camilo, C.S.; Serquiz, A.C.; Oliveira, A.S.; Rufino, F.P.S.; Maciel, B.L.L.; Uchôa, A.F.; et al. Gastroprotective and antielastase effect of protein inhibitors from Erythrina velutina seeds in na experimental ulcer model. Biochem. Cell Biol. 2016, 95, 243–250. [Google Scholar] [CrossRef] [PubMed]
- Machado, R.J.A.; Monteiro, N.K.V.; Migliolo, L.; Silva, O.N.; Pinto, M.F.S.; Oliveira, A.S.; Franco, O.L.; Kiyota, S.; Bemquerer, M.P.; Santos, E.A.; et al. Characterization and pharmacological properties of a novel multifunctional kunitz inhibitor from Erythrina velutina seeds. PLoS ONE 2013, 8, e63571. [Google Scholar] [CrossRef] [PubMed]
- Nakajima, S.; Hira, T.; Tsubata, M.; Takagaki, K.; Hara, H. Potato extract (Potein) suppresses food intake in rats through inhibition of luminal trypsin activity and direct stimulation of cholecystokinin secretion from enteroendocrine cells. J. Agric. Food Chem. 2011, 59, 9491–9496. [Google Scholar] [CrossRef] [PubMed]
- Komarnytsky, S.; Cook, A.; Raskin, I. Potato protease inhibitors inhibit food intake and increase circulating cholecystokinin levels by a trypsindependent mechanism. Int. J. Obes. 2011, 35, 236–243. [Google Scholar] [CrossRef] [PubMed]
- Serquiz, A.C.; Machado, R.J.A.; Serquiz, R.P.; Lima, V.C.O.; Carvalho, F.M.C.; Carneiro, M.A.A.; Maciel, B.L.L.; Uchôa, A.F.; Santos, E.A.; Morais, A.H.A. Supplementation with a new trypsin inhibitor from peanut is associated with reduced fasting glucose, weight control, and increased plasma CCK secretion in an animal model. J. Enzyme Inhib. Med. Chem. 2016, 29, 1–9. [Google Scholar] [CrossRef] [PubMed]
- Stoeckel, L.E.; Weller, R.E.; Cook, E.W.; Twieg, D.B.; Knowlton, R.C.; Cox, J.E. Widespread reward-system activation in obese women in response to pictures of high-calorie foods. Neuroimage 2008, 41, 636–647. [Google Scholar] [CrossRef] [PubMed]
- Duca, F.A.; Zhong, L.; Covasa, M. Reduced CCK signaling in obese-prone rats fed a high fat diet. Horm. Behav. 2013, 64, 812–817. [Google Scholar] [CrossRef] [PubMed]
- Matson, C.A.; Reid, D.F.; Cannon, T.A.; Ritter, R.C. Cholecystokinin and leptin act synergistically to reduce body weight. Am. J. Physiol. Regul. Integr. Comp. Physiol. 2000, 278, 882–890. [Google Scholar] [CrossRef] [PubMed]
- Barrachina, M.D.; Martínez, V.; Wang, L.; Wei, J.Y.; Taché, Y. Synergistic interaction between leptin and cholecystokinin to reduce short-time food intake in lean mice. Proc. Natl. Acad. Sci. USA 1997, 94, 10455–10460. [Google Scholar] [CrossRef] [PubMed]
- Gomez, G.; Englander, E.W.; Greeley, G.H., Jr. Nutrient inhibition of ghrelin secretion in the fasted rat. Regul. Pept. 2004, 117, 33–36. [Google Scholar] [CrossRef] [PubMed]
- Pawlak, D.B.; Bryson, J.M.; Denyer, G.S.; Brand-Miller, J.C. High glycemic index starch promotes hypersercretion of insulinand higher body fat in rats without affecting insulin sensitivity. J. Nutr. 2001, 131, 99–104. [Google Scholar] [CrossRef] [PubMed]
- Graham, T.E.; Adamo, K.B. Dietary carbohydrate and its effects on metabolism and substrate stores in sedentary and active individuals. Can. J. Appl. Physiol. 1999, 24, 393–415. [Google Scholar] [CrossRef] [PubMed]
- Brand-Miller, J.C.; Holt, S.H.A.; Pawlak, D.B.; McMillan, J. Glycemic index and obesity. Am. J. Clin. Nutr. 2002, 76, 281S–285S. [Google Scholar] [CrossRef] [PubMed]
- Pawlak, D.; Denyer, G.S.; Brand-Miller, J.C. Long-term feeding with high glycemic index starch leads to obesity in maturerats. Proc. Nutr. Soc. Aust. 2000, 24, 215. [Google Scholar]
- Katan, M.B. Effect of low-fat diets on plasma high-density lipoprotein concentrations. Am. J. Clin. Nutr. 1998, 67, 573–576. [Google Scholar] [CrossRef] [PubMed]
- Krauss, R.M.; Eckel, R.H.; Howard, B.; Appel, L.J.; Daniels, S.R.; Deckelbaum, R.J.; Erdman, J.W., Jr.; Kris-Etherton, P.; Goldberg, I.J.; Kotchen, T.A.; et al. AHA dietary guidelines: Revision 2000: A statement for healthcare professionals from the nutrition committee of the American heart association. Circulation 2000, 102, 2284–2299. [Google Scholar] [CrossRef] [PubMed]
- Parks, E.J. Effect of dietary carbohydrate on triglyceride metabolism in humans. J. Nutr. 2001, 131, 2772S–2774S. [Google Scholar] [CrossRef] [PubMed]
- Parks, E.J.; Krauss, R.M.; Christiansen, M.P.; Neese, R.A.; Hellerstein, M.K. Effects of a low-fat, high-carbohydrate diet on VLDL, triglyceride assembly, production and clearance. J. Clin. Investig. 1999, 104, 1087–1096. [Google Scholar] [CrossRef] [PubMed]
- Mittendorfer, B.; Sidossis, L.S. Mechanism for the increase in plasma triacylglycerol concentrations after consumption ofshort-term, high carbohydrate diets. Am. J. Clin. Nutr. 2001, 73, 892–899. [Google Scholar] [CrossRef] [PubMed]
- Liu, S.; Willett, W.C. Dietary Carbohydrates (2017). Available online: https://www.uptodate.com/contents/dietary-carbohydrates (accessed on 1 May 2018).
- Sampaio, H.A.C.; Silva, B.Y.C.; Sabry, M.O.D.; Almeida, P.C. Índice glicêmico e carga glicêmica de dietas consumidas por indivíduos obesos. Rev. Nutr. 2007, 20, 615–624. [Google Scholar] [CrossRef]
- Tontonoz, P.; Hu, E.; Spiegelman, B.M. Stimulation of adipogenesis in fibroblasts by PPARg2, a lipid activated transcription factor. Cell 1994, 79, 11147–11156. [Google Scholar] [CrossRef]
- Schoonjans, K.; Watanabe, M.; Suzuki, H. Induction of the acyl-coenzyme A synthetase gene by fibrates and fatty acids is mediated by a peroxisome proliferators response element in the C promoter. J. Biol. Chem. 1995, 270, 19269–19276. [Google Scholar] [CrossRef] [PubMed]
- Schoonjans, K.; Staels, B.; Auwerx, J. Role of the peroxisome proliferators activated receptor (PPAR) in mediating effects of fibrates and fatty acids on gene expression. J. Lipid Res. 1996, 37, 907–925. [Google Scholar] [PubMed]
- Ren, D.; Collingwood, T.N.; Rebar, E.J.; Wolffe, A.P.; Camp, H.S. PPARg knockdown by engineered transcription factors: Exogenous PPARg2 but not PPARg1 reactivates adipogenesis. Genes Dev. 2002, 16, 27–32. [Google Scholar] [CrossRef] [PubMed]
- Barroso, I.; Gurnell, M.; Crowley, V.E.; Agostini, M.; Schwabe, J.W.; Soos, M.A.; Maslen, G.L.; Williams, T.D.; Lewis, H.; Schafer, A.J.; et al. Dominant negative mutations in human PPARg associated with severe insulin resistance, diabetes mellitus and hypertension. Nature 1999, 402, 880–883. [Google Scholar] [CrossRef] [PubMed]
- Tavares, V.; Hirata, M.H.; Hirata, R.D.C. Peroxisome proliferator-activated receptor gamma (PPARg): Molecular study in glucose homeostasis, lipid metabolism and therapeutic approach. Arq. Bras. Endocrinol. Metab. 2007, 51, 526–533. [Google Scholar] [CrossRef]
- Fonseca, F.A.H. Farmacocin etica das estatinas. Arq. Bras. Cardiol. 2005, 85, 9–14. [Google Scholar] [CrossRef] [PubMed]
- Li, X.-Q.; Andersson, T.B.; Ahlström, M.; Weidolf, L. Comparison of inhibitory effects of the proton pump-inhibiting drugs omeprazole, esomeprazole, lansoprazole, pantoprazole and rabeprazole on human cytochrome P450 activities. Drug Metab. Dispos. 2004, 32, 821–827. [Google Scholar] [CrossRef] [PubMed]
- Ouchi, N.; Parker, J.L.; Lugus, J.J.; Walsh, K. Adipokines in inflammation and metabolic disease. Nat. Rev. Immunol. 2011, 11, 85–97. [Google Scholar] [CrossRef] [PubMed]
- Kanneganti, T.D.; Dixit, V.D. Immunological complications of obesity. Nat. Immunol. 2012, 13, 707–712. [Google Scholar] [CrossRef] [PubMed]
- Weisberg, S.P.; McCann, D.; Desai, M.; Rosenbaum, M.; Leibel, R.L.; Ferrante, A.W., Jr. Obesity is associated with macrophage accumulation in adipose tissue. J. Clin. Investig. 2013, 112, 1796–1808. [Google Scholar] [CrossRef]
- Petros, W.P.; Peters, W.P. Cytokines. In Therapeutic Immunology, 1st ed.; Austen, K.F., Burakoff, S.J., Strom, T.B., Rosen, F.S., Eds.; Blackwell Science, Inc.: Malden, MA, USA, 1996; pp. 229–279. [Google Scholar]
- Durum, S.K.; Muegge, K. Cytokines linking the immune and inflammatory systems. In Clinical Immunology, 1st ed.; Rich, R., Ed.; Mosby-Year Book: Maryland Heights, MO, USA, 1996; pp. 350–362. [Google Scholar]
- Arner, P. Differences in lipolysis between human subcutaneous and omental adipose tissues. Ann. Med. 1995, 27, 435–438. [Google Scholar] [CrossRef] [PubMed]
- Carter, A.M. Inflammation, thrombosis and acute coronary syndromes. Diabetes Vasc. Dis. Res. 2005, 2, 113–121. [Google Scholar] [CrossRef] [PubMed]
- Lozano, L.; Van der Werf, R.; Bietiger, W.; Seyfritz, E.; Peronet, C.; Pinget, M.; Jeandidier, N.; Maillard, E.; Marchioni, E.; Sigrist, S.; et al. High-fructose and high-fat diet-induced disorders in rats: Impact on diabetes risk, hepatic and vascular complications. Nutr. Metab. 2016, 13, 1. [Google Scholar] [CrossRef] [PubMed]
- Tay, J.; Thompson, C.H.; Brinkworth, G.D. Glycemic Variability: Assessing Glycemia Differently and the Implications for Dietary Management of Diabetes. Ann. Rev. Nutr. 2015, 35, 389–424. [Google Scholar] [CrossRef] [PubMed]
- Silva, R.G.; Vannucci, A.B.; Latorre, L.C.; Zerbini, C.A.F. Como diagnosticar e tratar artrite reumatóide. Rev. Bras. Med. 2003, 60, 554–577. [Google Scholar]
- Uehbe, A.I.; Pimenta, M.E.; Giorgi, R.D. DMARDs (fármacos anti-artrite reumatóide modificadores da doença ou drogas anti-reumáticas modificadoras da doença). Rev. Temas Reumatol. Clin. São Paulo 2006, 7, 57–61. [Google Scholar]
- Monteiro, R.D.C.; Zanini, A.C. Análise de custo do tratamento medicamentoso da artrite reumatóide. Rev. Bras. Cienc. Farm. 2008, 44, 25–33. [Google Scholar] [CrossRef]
- Bertolo, M.B. Como diagnosticar e tratar artrite reumatóide. Rev. Bras. Med. 2008, 65, 64–72. [Google Scholar]
- Ciconelli, R.M. Artrite reumatóide—tratamento. Rev. Sinopse 2005, 3, 1–17. [Google Scholar]


| Diets | |||
|---|---|---|---|
| Experimental | Standard | Labina’s® Label | |
| Kcal (Calories) | 315.26 ± 19.27 (100%) | 265.45 ± 7.99 (100%) | - |
| Moisture | 4.54 ± 0.03 (5%) | 7.47 ± 0.30 (7%) | Maximum: 13.0% |
| Ashes | 9.22 ± 0.09 (9%) | 9.84 ± 0.04 (10%) | - |
| Proteins | 20.72 ± 1.08 (21%) | 28.59 ± 0.25 (29%) | Minimum: 23.0% |
| Lipids | 4.34 ± 0.17 (4%) | 3.74 ± 0.06 (4%) | Minimum: 2.5% |
| Carbohydrates * | 48.33 ± 5.38 (48%) | 29.35 ± 2.08 (29%) | - |
| Crude fiber | 12.85 ± 4.68 (13%) | 21.00 ± 1.68 (21%) | Maximum: 9.0% |
| Parameter | Eutrophic/Standard Diet | Obese/HGLI Diet | Obese/Standard Diet | Obese/HGLI Diet + TTIp |
|---|---|---|---|---|
| TNF-alpha | Indetectable | 5.86 ± 0.43 | 6.53 ± 0.96 | Indetectable |
| Eutrophic/Standard diet a | Obese/HGLI diet b | Obese/Standard diet | Obese/HGLI + TTIp diet c | |
|---|---|---|---|---|
| Negative (0) | 4 | - | - | 5 |
| Low positive (+1) | 1 | 1 | 3 | - |
| Positive (+2) | - | 4 | 1 | - |
| High positive (+3) | - | - | 1 | - |
© 2019 by the authors. Licensee MDPI, Basel, Switzerland. This article is an open access article distributed under the terms and conditions of the Creative Commons Attribution (CC BY) license (http://creativecommons.org/licenses/by/4.0/).
Share and Cite
Carvalho, F.M.C.; Lima, V.C.O.; Costa, I.S.; Luz, A.B.S.; Ladd, F.V.L.; Serquiz, A.C.; Bortolin, R.H.; Silbiger, V.N.; Maciel, B.L.L.; Santos, E.A.; et al. Anti-TNF-α Agent Tamarind Kunitz Trypsin Inhibitor Improves Lipid Profile of Wistar Rats Presenting Dyslipidemia and Diet-induced Obesity Regardless of PPAR-γ Induction. Nutrients 2019, 11, 512. https://doi.org/10.3390/nu11030512
Carvalho FMC, Lima VCO, Costa IS, Luz ABS, Ladd FVL, Serquiz AC, Bortolin RH, Silbiger VN, Maciel BLL, Santos EA, et al. Anti-TNF-α Agent Tamarind Kunitz Trypsin Inhibitor Improves Lipid Profile of Wistar Rats Presenting Dyslipidemia and Diet-induced Obesity Regardless of PPAR-γ Induction. Nutrients. 2019; 11(3):512. https://doi.org/10.3390/nu11030512
Chicago/Turabian StyleCarvalho, Fabiana M. C., Vanessa C. O. Lima, Izael S. Costa, Anna B. S. Luz, Fernando V. L. Ladd, Alexandre C. Serquiz, Raul H. Bortolin, Vivian N. Silbiger, Bruna L. L. Maciel, Elizeu A. Santos, and et al. 2019. "Anti-TNF-α Agent Tamarind Kunitz Trypsin Inhibitor Improves Lipid Profile of Wistar Rats Presenting Dyslipidemia and Diet-induced Obesity Regardless of PPAR-γ Induction" Nutrients 11, no. 3: 512. https://doi.org/10.3390/nu11030512