Impaired Skeletal Muscle Branched-Chain Amino Acids Catabolism Contributes to Their Increased Circulating Levels in a Non-Obese Insulin-Resistant Fructose-Fed Rat Model


Abstract
:1. Introduction
2. Materials and Methods
2.1. Animals
2.2. Experimental Procedure
2.3. Analytical Procedures
3. Results
4. Discussion
Author Contributions
Funding
Acknowledgments
Conflicts of Interest
References
- Lynch, C.J.; Adams, S.H. Branched-chain amino acids in metabolic signalling and insulin resistance. Nat. Rev. Endocrinol. 2014, 10, 723–736. [Google Scholar] [CrossRef] [PubMed]
- Wurtz, P.; Soininen, P.; Kangas, A.J.; Ronnemaa, T.; Lehtimaki, T.; Kahonen, M.; Viikari, J.S.; Raitakari, O.T.; Ala-Korpela, M. Branched-chain and aromatic amino acids are predictors of insulin resistance in young adults. Diabetes Care 2013, 36, 648–655. [Google Scholar] [CrossRef] [PubMed]
- Wang, X.; Zhang, S.; Zhang, A.; Yan, G.; Wu, X.; Han, Y.; Sun, H. Metabolomics study of type 2 diabetes and therapeutic effects of tianqijiangtang-capsule using ultra-performance liquid chromatography/electrospray ionization quadruple time-of-flight mass spectrometry. Anal. Methods 2013, 5, 2218–2226. [Google Scholar] [CrossRef]
- She, P.; Reid, T.M.; Bronson, S.K.; Vary, T.C.; Hajnal, A.; Lynch, C.J.; Hutson, S.M. Disruption of bcatm in mice leads to increased energy expenditure associated with the activation of a futile protein turnover cycle. Cell Metab. 2007, 6, 181–194. [Google Scholar] [CrossRef] [PubMed]
- She, P.; Van Horn, C.; Reid, T.; Hutson, S.M.; Cooney, R.N.; Lynch, C.J. Obesity-related elevations in plasma leucine are associated with alterations in enzymes involved in branched-chain amino acid metabolism. Am. J. Physiol. Endocrinol. Metab. 2007, 293, E1552–E1563. [Google Scholar] [CrossRef] [PubMed] [Green Version]
- Herman, M.A.; She, P.; Peroni, O.D.; Lynch, C.J.; Kahn, B.B. Adipose tissue branched chain amino acid (bcaa) metabolism modulates circulating bcaa levels. J. Biol. Chem. 2010, 285, 11348–11356. [Google Scholar] [CrossRef] [PubMed]
- Lackey, D.E.; Lynch, C.J.; Olson, K.C.; Mostaedi, R.; Ali, M.; Smith, W.H.; Karpe, F.; Humphreys, S.; Bedinger, D.H.; Dunn, T.N.; et al. Regulation of adipose branched-chain amino acid catabolism enzyme expression and cross-adipose amino acid flux in human obesity. Am. J. Physiol. Endocrinol. Metab. 2013, 304, E1175–E1187. [Google Scholar] [CrossRef] [PubMed] [Green Version]
- Yoon, M.S. The emerging role of branched-chain amino acids in insulin resistance and metabolism. Nutrients 2016, 8, 405. [Google Scholar] [CrossRef]
- Tremblay, F.; Marette, A. Amino acid and insulin signaling via the mtor/p70 s6 kinase pathway. A negative feedback mechanism leading to insulin resistance in skeletal muscle cells. J. Biol. Chem. 2001, 276, 38052–38060. [Google Scholar]
- Newgard, C.B.; An, J.; Bain, J.R.; Muehlbauer, M.J.; Stevens, R.D.; Lien, L.F.; Haqq, A.M.; Shah, S.H.; Arlotto, M.; Slentz, C.A.; et al. A branched-chain amino acid-related metabolic signature that differentiates obese and lean humans and contributes to insulin resistance. Cell Metab. 2009, 9, 311–326. [Google Scholar] [CrossRef]
- Bremer, A.A.; Mietus-Snyder, M.; Lustig, R.H. Toward a unifying hypothesis of metabolic syndrome. Pediatrics 2012, 129, 557–570. [Google Scholar] [CrossRef] [PubMed]
- Shin, A.C.; Fasshauer, M.; Filatova, N.; Grundell, L.A.; Zielinski, E.; Zhou, J.Y.; Scherer, T.; Lindtner, C.; White, P.J.; Lapworth, A.L.; et al. Brain insulin lowers circulating bcaa levels by inducing hepatic bcaa catabolism. Cell Metab. 2014, 20, 898–909. [Google Scholar] [CrossRef] [PubMed]
- Kadota, Y.; Toyoda, T.; Kitaura, Y.; Adams, S.H.; Shimomura, Y. Regulation of hepatic branched-chain alpha-ketoacid dehydrogenase complex in rats fed a high-fat diet. Obes. Res. Clin. Pract. 2013, 7, e439–e444. [Google Scholar] [CrossRef]
- Lerin, C.; Goldfine, A.B.; Boes, T.; Liu, M.; Kasif, S.; Dreyfuss, J.M.; De Sousa-Coelho, A.L.; Daher, G.; Manoli, I.; Sysol, J.R.; et al. , et al. Defects in muscle branched-chain amino acid oxidation contribute to impaired lipid metabolism. Mol. Metab. 2016, 5, 926–936. [Google Scholar] [CrossRef] [PubMed]
- Lee, S.; Gulseth, H.L.; Refsum, H.; Langleite, T.M.; Holen, T.; Jensen, J.; Drevon, C.A.; Birkeland, K.I. Branched-chain amino acid (bcaa) metabolism, insulin sensitivity (is), and liver fat response to exercise training in sedentary prediabetic and normoglycemic men. Diabetes 2018, 67. [Google Scholar] [CrossRef]
- Tappy, L.; Le, K.A. Does fructose consumption contribute to non-alcoholic fatty liver disease? Clin. Res. Hepatol. Gastroenterol. 2012, 36, 554–560. [Google Scholar] [CrossRef] [PubMed]
- Basaranoglu, M.; Basaranoglu, G.; Bugianesi, E. Carbohydrate intake and nonalcoholic fatty liver disease: Fructose as a weapon of mass destruction. Hepatobiliary Surg. Nutr. 2015, 4, 109–116. [Google Scholar]
- Polakof, S.; Sebedio, J.L.; Comte, B. Sweet dreams or bitter nightmare: Can we trust on fructose? Bioenergetics 2012, 1, e108. [Google Scholar] [CrossRef]
- Levy, J.C.; Matthews, D.R.; Hermans, M.P. Correct homeostasis model assessment (homa) evaluation uses the computer program. Diabetes Care 1998, 21, 2191–2192. [Google Scholar] [CrossRef]
- Livesey, G.; Lund, P. Enzymic determination of branched-chain amino acids and 2-oxoacids in rat tissues. Transfer of 2-oxoacids from skeletal muscle to liver in vivo. Biochem. J. 1980, 188, 705–713. [Google Scholar] [CrossRef]
- Polakof, S.; Remond, D.; David, J.; Dardevet, D.; Savary-Auzeloux, I. Time-course changes in circulating branched-chain amino acid levels and metabolism in obese yucatan minipig. Nutrition 2017, 50, 66–73. [Google Scholar] [CrossRef] [PubMed]
- Schadewaldt, P.; Adelmeyer, F. Coupled enzymatic assay for estimation of branched-chain l-amino acid aminotransferase activity with 2-oxo acid substrates. Anal. Biochem. 1996, 238, 65–71. [Google Scholar] [CrossRef] [PubMed]
- Folch, J.; Lees, M.; Sloane-Stanley, G. A simple method for the isolation and purification of total lipids from animal tissues. J. Biol. Chem. 1957, 226, 497–509. [Google Scholar] [PubMed]
- Mazur, A.; Remesy, C.; Gueux, E.; Levrat, M.A.; Demigne, C. Effects of diets rich in fermentable carbohydrates on plasma lipoprotein levels and on lipoprotein catabolism in rats. J. Nutr. 1990, 120, 1037–1045. [Google Scholar] [CrossRef] [PubMed]
- Zeitler, A.F.; Gerrer, K.H.; Haas, R.; Jimenez-Soto, L.F. Optimized semi-quantitative blot analysis in infection assays using the stain-free technology. J. Microbiol. Methods 2016, 126, 38–41. [Google Scholar] [CrossRef] [PubMed]
- Polakof, S.; Rémond, D.; Rambeau, M.; Pujos-Guillot, E.; Sébédio, J.-L.; Dardevet, D.; Comte, B.; Savary-Auzeloux, I. Postprandial metabolic events in mini-pigs: New insights from a combined approach using plasma metabolomics, tissue gene expression, and enzyme activity. Metabolomics 2014, 11, 1–16. [Google Scholar] [CrossRef]
- Gannon, N.P.; Schnuck, J.K.; Vaughan, R.A. Bcaa metabolism and insulin sensitivity - dysregulated by metabolic status? Mol. Nutr. Food Res. 2018, 62, e1700756. [Google Scholar] [CrossRef]
- Wang, T.J.; Larson, M.G.; Vasan, R.S.; Cheng, S.; Rhee, E.P.; McCabe, E.; Lewis, G.D.; Fox, C.S.; Jacques, P.F.; Fernandez, C. Metabolite profiles and the risk of developing diabetes. Nat. Med. 2011, 17, 448–453. [Google Scholar] [CrossRef] [Green Version]
- Kalavalapalli, S.; Bril, F.; Koelmel, J.P.; Abdo, K.; Guingab, J.; Andrews, P.; Li, W.-Y.; Jose, D.; Yost, R.A.; Frye, R.F.; et al. Pioglitazone improves hepatic mitochondrial function in a mouse model of nonalcoholic steatohepatitis. Am. J. Physiol. Endoc. Metab. 2018, 315, E163–E173. [Google Scholar] [CrossRef]
- Polakof, S.; Dardevet, D.; Lyan, B.; Mosoni, L.; Gatineau, E.; Martin, J.F.; Pujos-Guillot, E.; Mazur, A.; Comte, B. Time course of molecular and metabolic events in the development of insulin resistance in fructose-fed rats. J. Proteome Res. 2016, 15, 1862–1874. [Google Scholar] [CrossRef]
- Jegatheesan, P.; Beutheu, S.; Ventura, G.; Sarfati, G.; Nubret, E.; Kapel, N.; Waligora-Dupriet, A.J.; Bergheim, I.; Cynober, L.; De-Bandt, J.P. Effect of specific amino acids on hepatic lipid metabolism in fructose-induced non-alcoholic fatty liver disease. Clin. Nutr. 2016, 35, 175–182. [Google Scholar] [CrossRef] [PubMed]
- Jegatheesan, P.; Beutheu, S.; Ventura, G.; Nubret, E.; Sarfati, G.; Bergheim, I.; De Bandt, J.-P. Citrulline and nonessential amino acids prevent fructose-induced nonalcoholic fatty liver disease in rats. J. Nutr. 2015, 145, 2273–2279. [Google Scholar] [CrossRef] [PubMed]
- Magkos, F.; Wang, X.; Mittendorfer, B. Metabolic actions of insulin in men and women. Nutrition 2010, 26, 686–693. [Google Scholar] [CrossRef] [PubMed] [Green Version]
- Gelfand, R.A.; Sherwin, R.S. Nitrogen conservation in starvation revisited: Protein sparing with intravenous fructose. Metabolism 1986, 35, 37–44. [Google Scholar] [CrossRef]
- Brozinick, J.T.; Hawkins, E.; Hoang Bui, H.; Kuo, M.S.; Tan, B.; Kievit, P.; Grove, K. Plasma sphingolipids are biomarkers of metabolic syndrome in non-human primates maintained on a western-style diet. Int. J. Obes. 2013, 37, 1064–1070. [Google Scholar] [CrossRef] [PubMed]
- White, P.J.; McGarrah, R.W.; Grimsrud, P.A.; Tso, S.C.; Yang, W.H.; Haldeman, J.M.; Grenier-Larouche, T.; An, J.; Lapworth, A.L.; Astapova, I.; et al. The bckdh kinase and phosphatase integrate bcaa and lipid metabolism via regulation of atp-citrate lyase. Cell Metab. 2018, 27, 1281–1293. [Google Scholar] [CrossRef] [PubMed]
- She, P.; Olson, K.C.; Kadota, Y.; Inukai, A.; Shimomura, Y.; Hoppel, C.L.; Adams, S.H.; Kawamata, Y.; Matsumoto, H.; Sakai, R.; et al. Leucine and protein metabolism in obese zucker rats. PLoS ONE 2013, 8, e59443. [Google Scholar] [CrossRef]
- Hatazawa, Y.; Tadaishi, M.; Nagaike, Y.; Morita, A.; Ogawa, Y.; Ezaki, O.; Takai-Igarashi, T.; Kitaura, Y.; Shimomura, Y.; Kamei, Y.; et al. Pgc-1α-mediated branched-chain amino acid metabolism in the skeletal muscle. PLoS ONE 2014, 9, e91006. [Google Scholar] [CrossRef]
- Koo, H.-Y.; Wallig, M.A.; Chung, B.H.; Nara, T.Y.; Cho, B.H.S.; Nakamura, M.T. Dietary fructose induces a wide range of genes with distinct shift in carbohydrate and lipid metabolism in fed and fasted rat liver. BBA—Mol. Basis Dis. 2008, 1782, 341–348. [Google Scholar] [CrossRef] [Green Version]
- Zhang, D.; Tong, X.; VanDommelen, K.; Gupta, N.; Stamper, K.; Brady, G.F.; Meng, Z.; Lin, J.; Rui, L.; Omary, M.B.; et al. Lipogenic transcription factor chrebp mediates fructose-induced metabolic adaptations to prevent hepatotoxicity. J. Clin. Invest. 2017, 127, 2855–2867. [Google Scholar] [CrossRef]
- Erion, D.M.; Popov, V.; Hsiao, J.J.; Vatner, D.; Mitchell, K.; Yonemitsu, S.; Nagai, Y.; Kahn, M.; Gillum, M.P.; Dong, J.; et al. The role of the carbohydrate response element-binding protein in male fructose-fed rats. Endocrinology 2013, 154, 36–44. [Google Scholar] [CrossRef] [PubMed]
- White, P.J.; Lapworth, A.L.; An, J.; Wang, L.; McGarrah, R.W.; Stevens, R.D.; Ilkayeva, O.; George, T.; Muehlbauer, M.J.; Bain, J.R.; et al. Branched-chain amino acid restriction in zucker-fatty rats improves muscle insulin sensitivity by enhancing efficiency of fatty acid oxidation and acyl-glycine export. Mol. Metab. 2016, 5, 538–551. [Google Scholar] [CrossRef] [PubMed]


| 0d | 5d | 12d | 30d | 45d | p-Value | ||
|---|---|---|---|---|---|---|---|
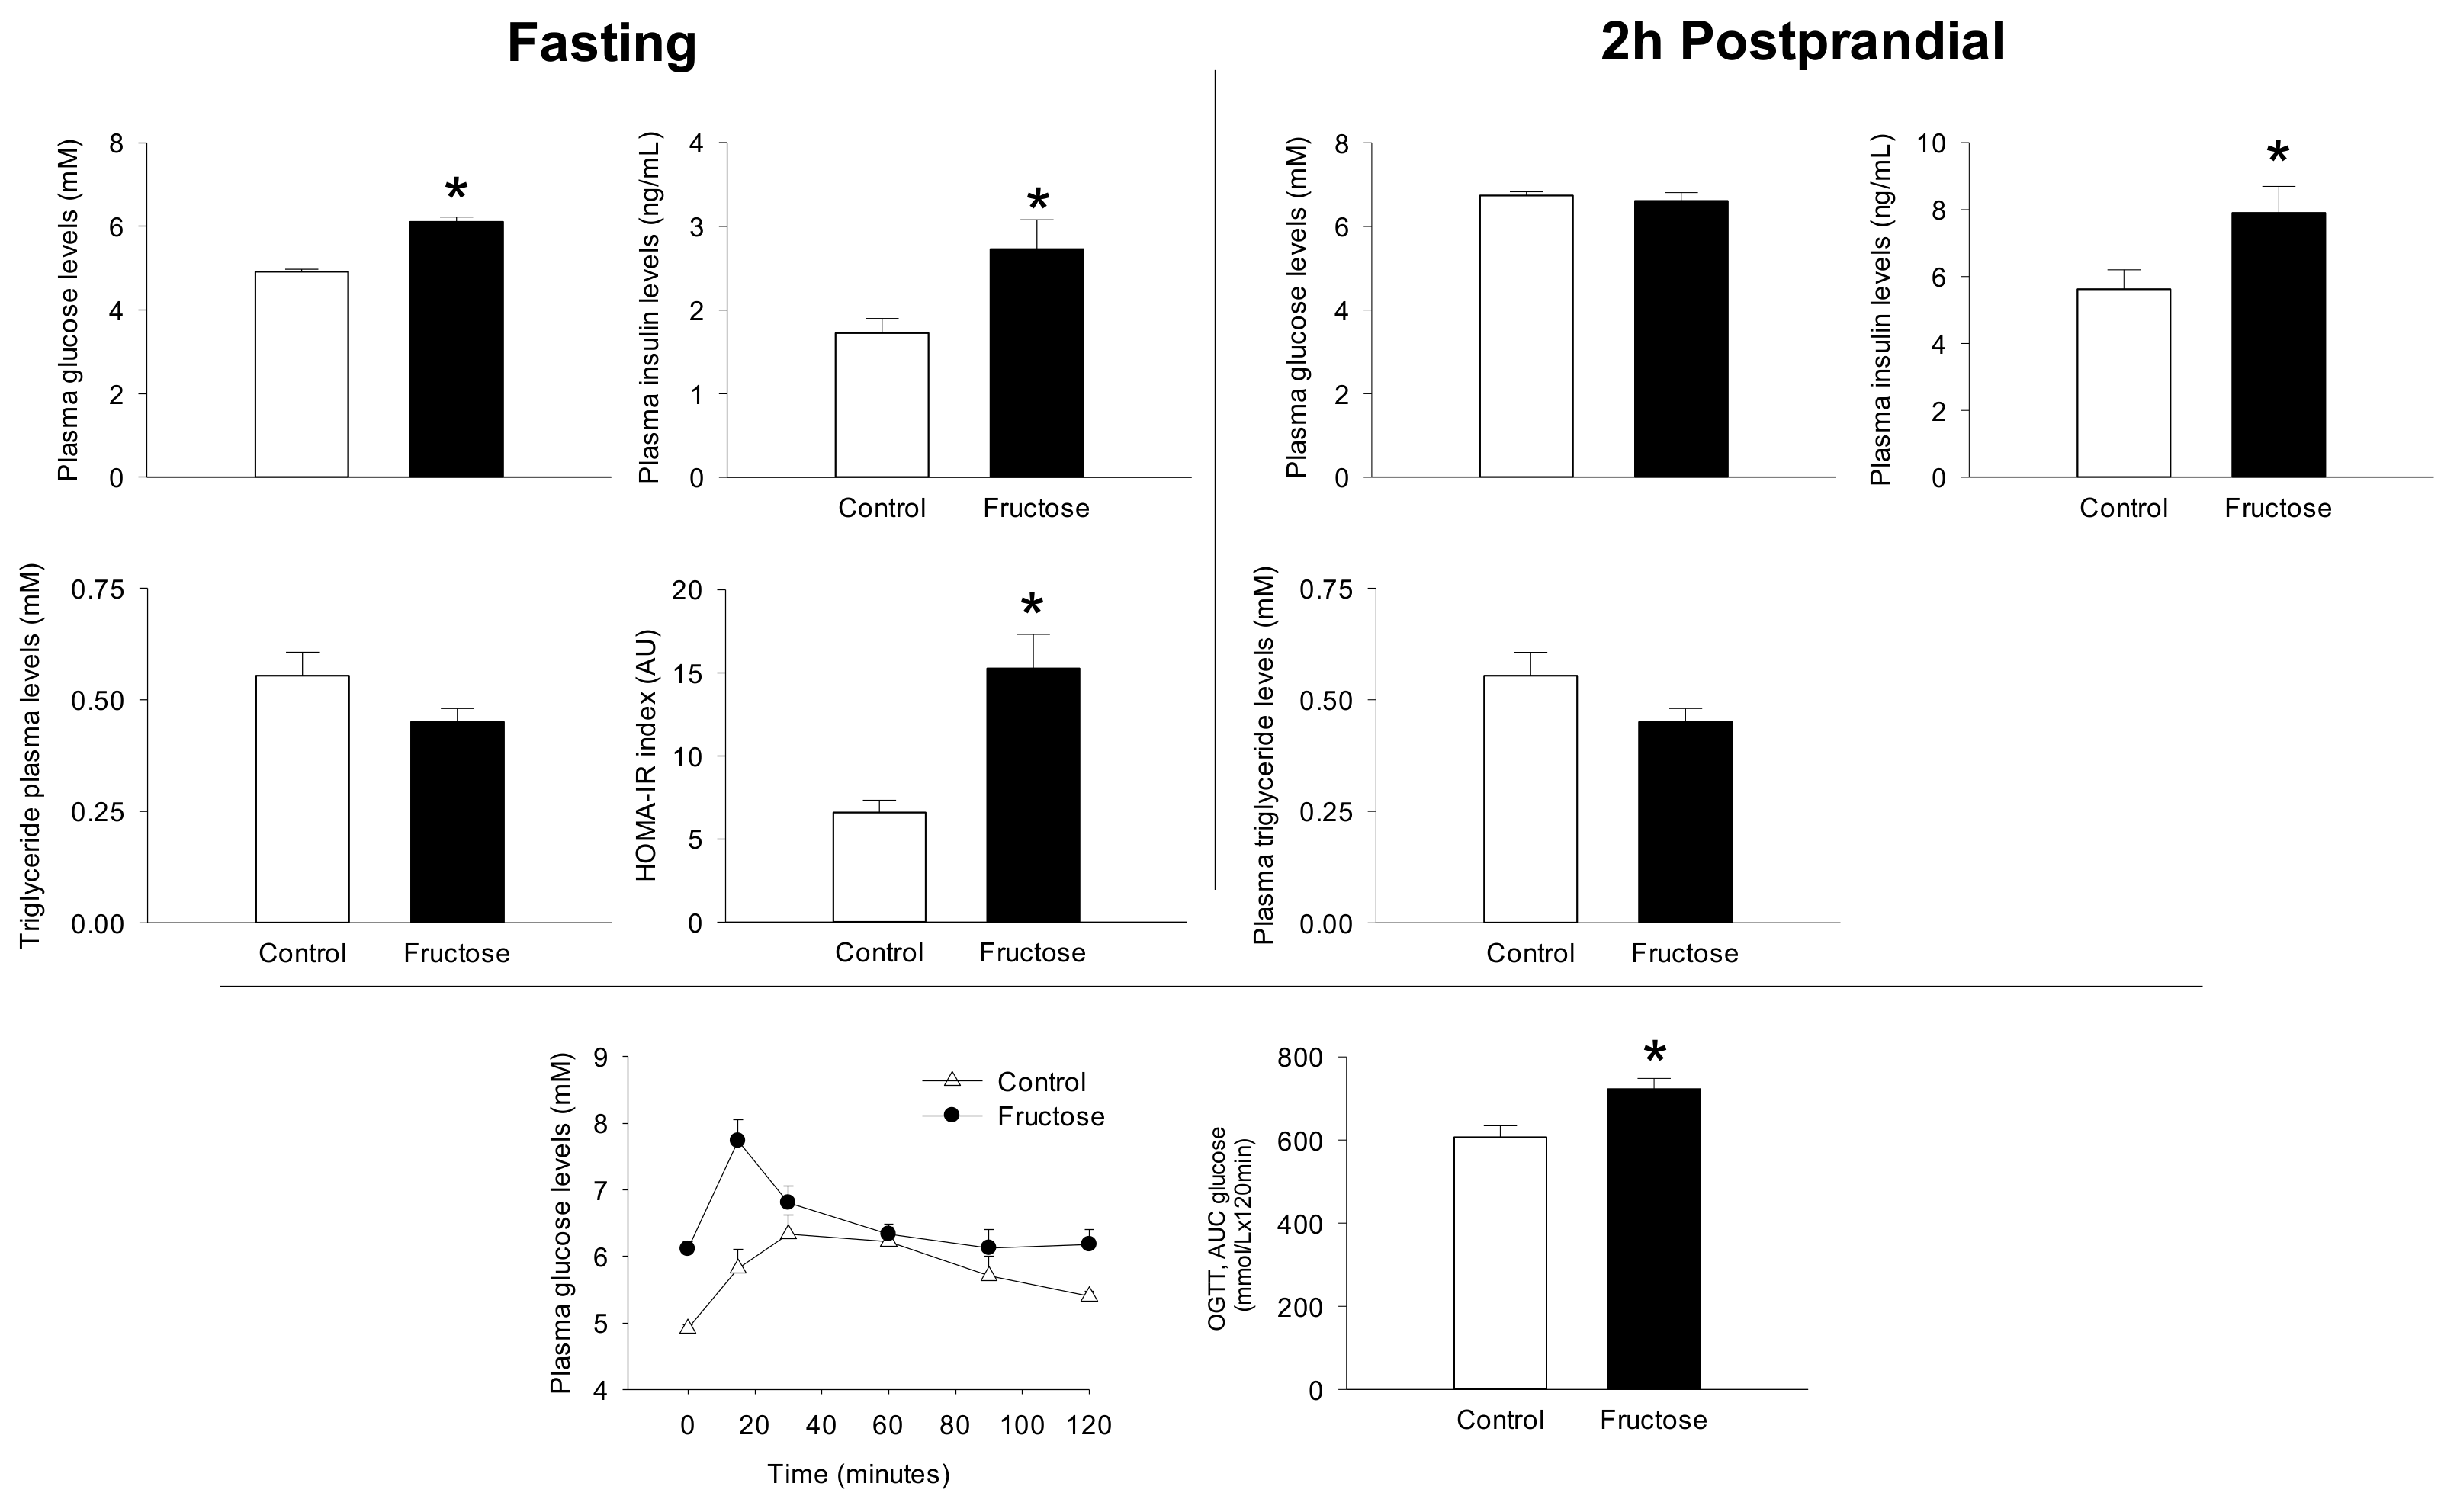
| Glucose (mM) | Con | 4.20 ± 0.14 | 4.43 ± 0.18 | 4.22 ± 0.30 | 4.87 ± 0.13 | 5.28 ± 0.23 | Diet <0.001 Time <0.001 Diet × Time 0.214 |
| Fru | 4.55 ± 0.33 | 4.49 ± 0.20 | 4.86 ± 0.26* | 5.23 ± 0.10* | 6.10 ± 0.11 * | ||
| Insulin (ng/mL) | Con | 0.77 ± 0.18 | 1.06 ± 0.13 | 1.46 ± 0.26 | 1.02 ± 0.18 | 1.72 ± 0.22 | Diet 0.100 Time 0.004 Diet × Time 0.164 |
| Fru | 1.09 ± 0.31 | 0.91 ± 0.15 | 1.34 ± 0.32 | 1.40 ± 0.37 | 2.58 ± 0.26* | ||
| HOMA2-IR | Con | 3.18 ± 0.75 | 4.60 ± 0.54 | 6.27 ± 1.26 | 5.67 ± 0.85 | 6.83 ± 0.49 | Diet 0.010 Time <0.001 Diet × Time 0.042 |
| Fru | 5.31 ± 1.92 | 4.04 ± 0.75 | 6.49 ± 1.57 | 7.75 ± 2.52 | 15.66 ± 1.90 * |
| Liver | ||
|---|---|---|
| Control | Fructose | |
| ppargc1a | 1.24 ± 0.38 | 1.10 ± 0.16 |
| pparg | 0.84 ± 0.05 | 0.96 ± 0.17 |
| mlxipl | 0.99 ± 0.09 | 1.27 ± 0.11 * |
| Skeletal muscle | ||
| ppargc1a | 1.05 ± 0.20 | 0.76 ± 0.06 * |
| sirt1 | 1.06 ± 0.23 | 0.72 ± 0.07 * |
| mlxipl | 1.17 ± 0.42 | 0.80 ± 0.15 * |
© 2019 by the authors. Licensee MDPI, Basel, Switzerland. This article is an open access article distributed under the terms and conditions of the Creative Commons Attribution (CC BY) license (http://creativecommons.org/licenses/by/4.0/).
Share and Cite
David, J.; Dardevet, D.; Mosoni, L.; Savary-Auzeloux, I.; Polakof, S. Impaired Skeletal Muscle Branched-Chain Amino Acids Catabolism Contributes to Their Increased Circulating Levels in a Non-Obese Insulin-Resistant Fructose-Fed Rat Model. Nutrients 2019, 11, 355. https://doi.org/10.3390/nu11020355
David J, Dardevet D, Mosoni L, Savary-Auzeloux I, Polakof S. Impaired Skeletal Muscle Branched-Chain Amino Acids Catabolism Contributes to Their Increased Circulating Levels in a Non-Obese Insulin-Resistant Fructose-Fed Rat Model. Nutrients. 2019; 11(2):355. https://doi.org/10.3390/nu11020355
Chicago/Turabian StyleDavid, Jérémie, Dominique Dardevet, Laurent Mosoni, Isabelle Savary-Auzeloux, and Sergio Polakof. 2019. "Impaired Skeletal Muscle Branched-Chain Amino Acids Catabolism Contributes to Their Increased Circulating Levels in a Non-Obese Insulin-Resistant Fructose-Fed Rat Model" Nutrients 11, no. 2: 355. https://doi.org/10.3390/nu11020355