Maternal High-Protein Diet during Pregnancy Modifies Rat Offspring Body Weight and Insulin Signalling but Not Macronutrient Preference in Adulthood

 ,
,
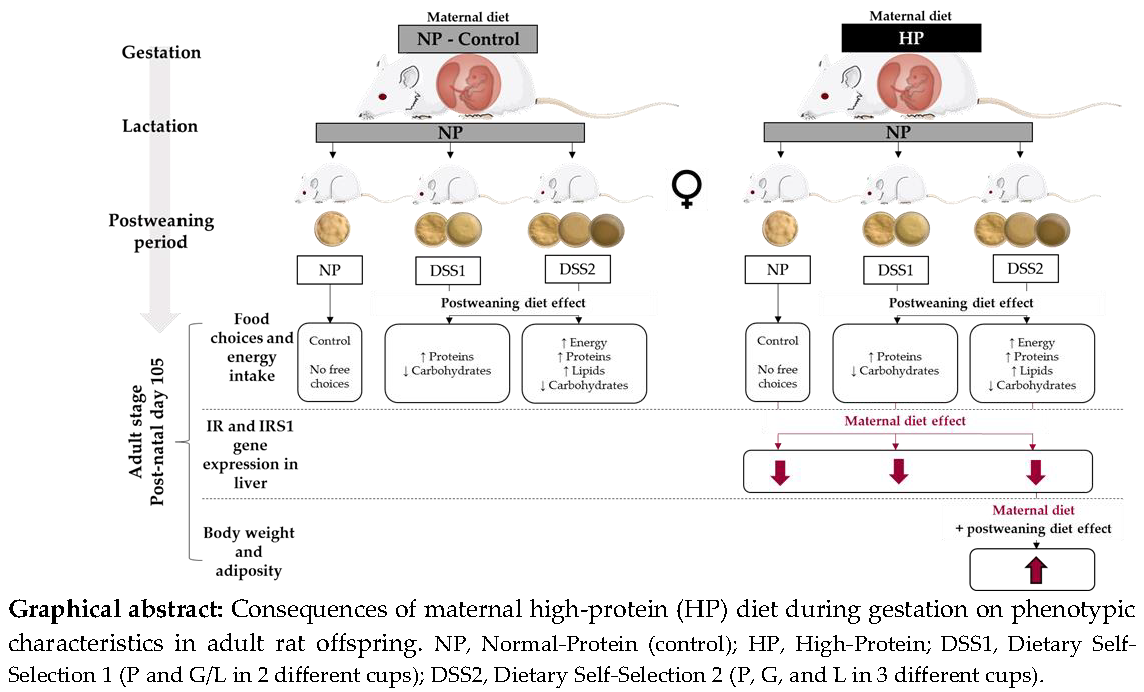
Abstract
:
1. Introduction
2. Materials and Methods
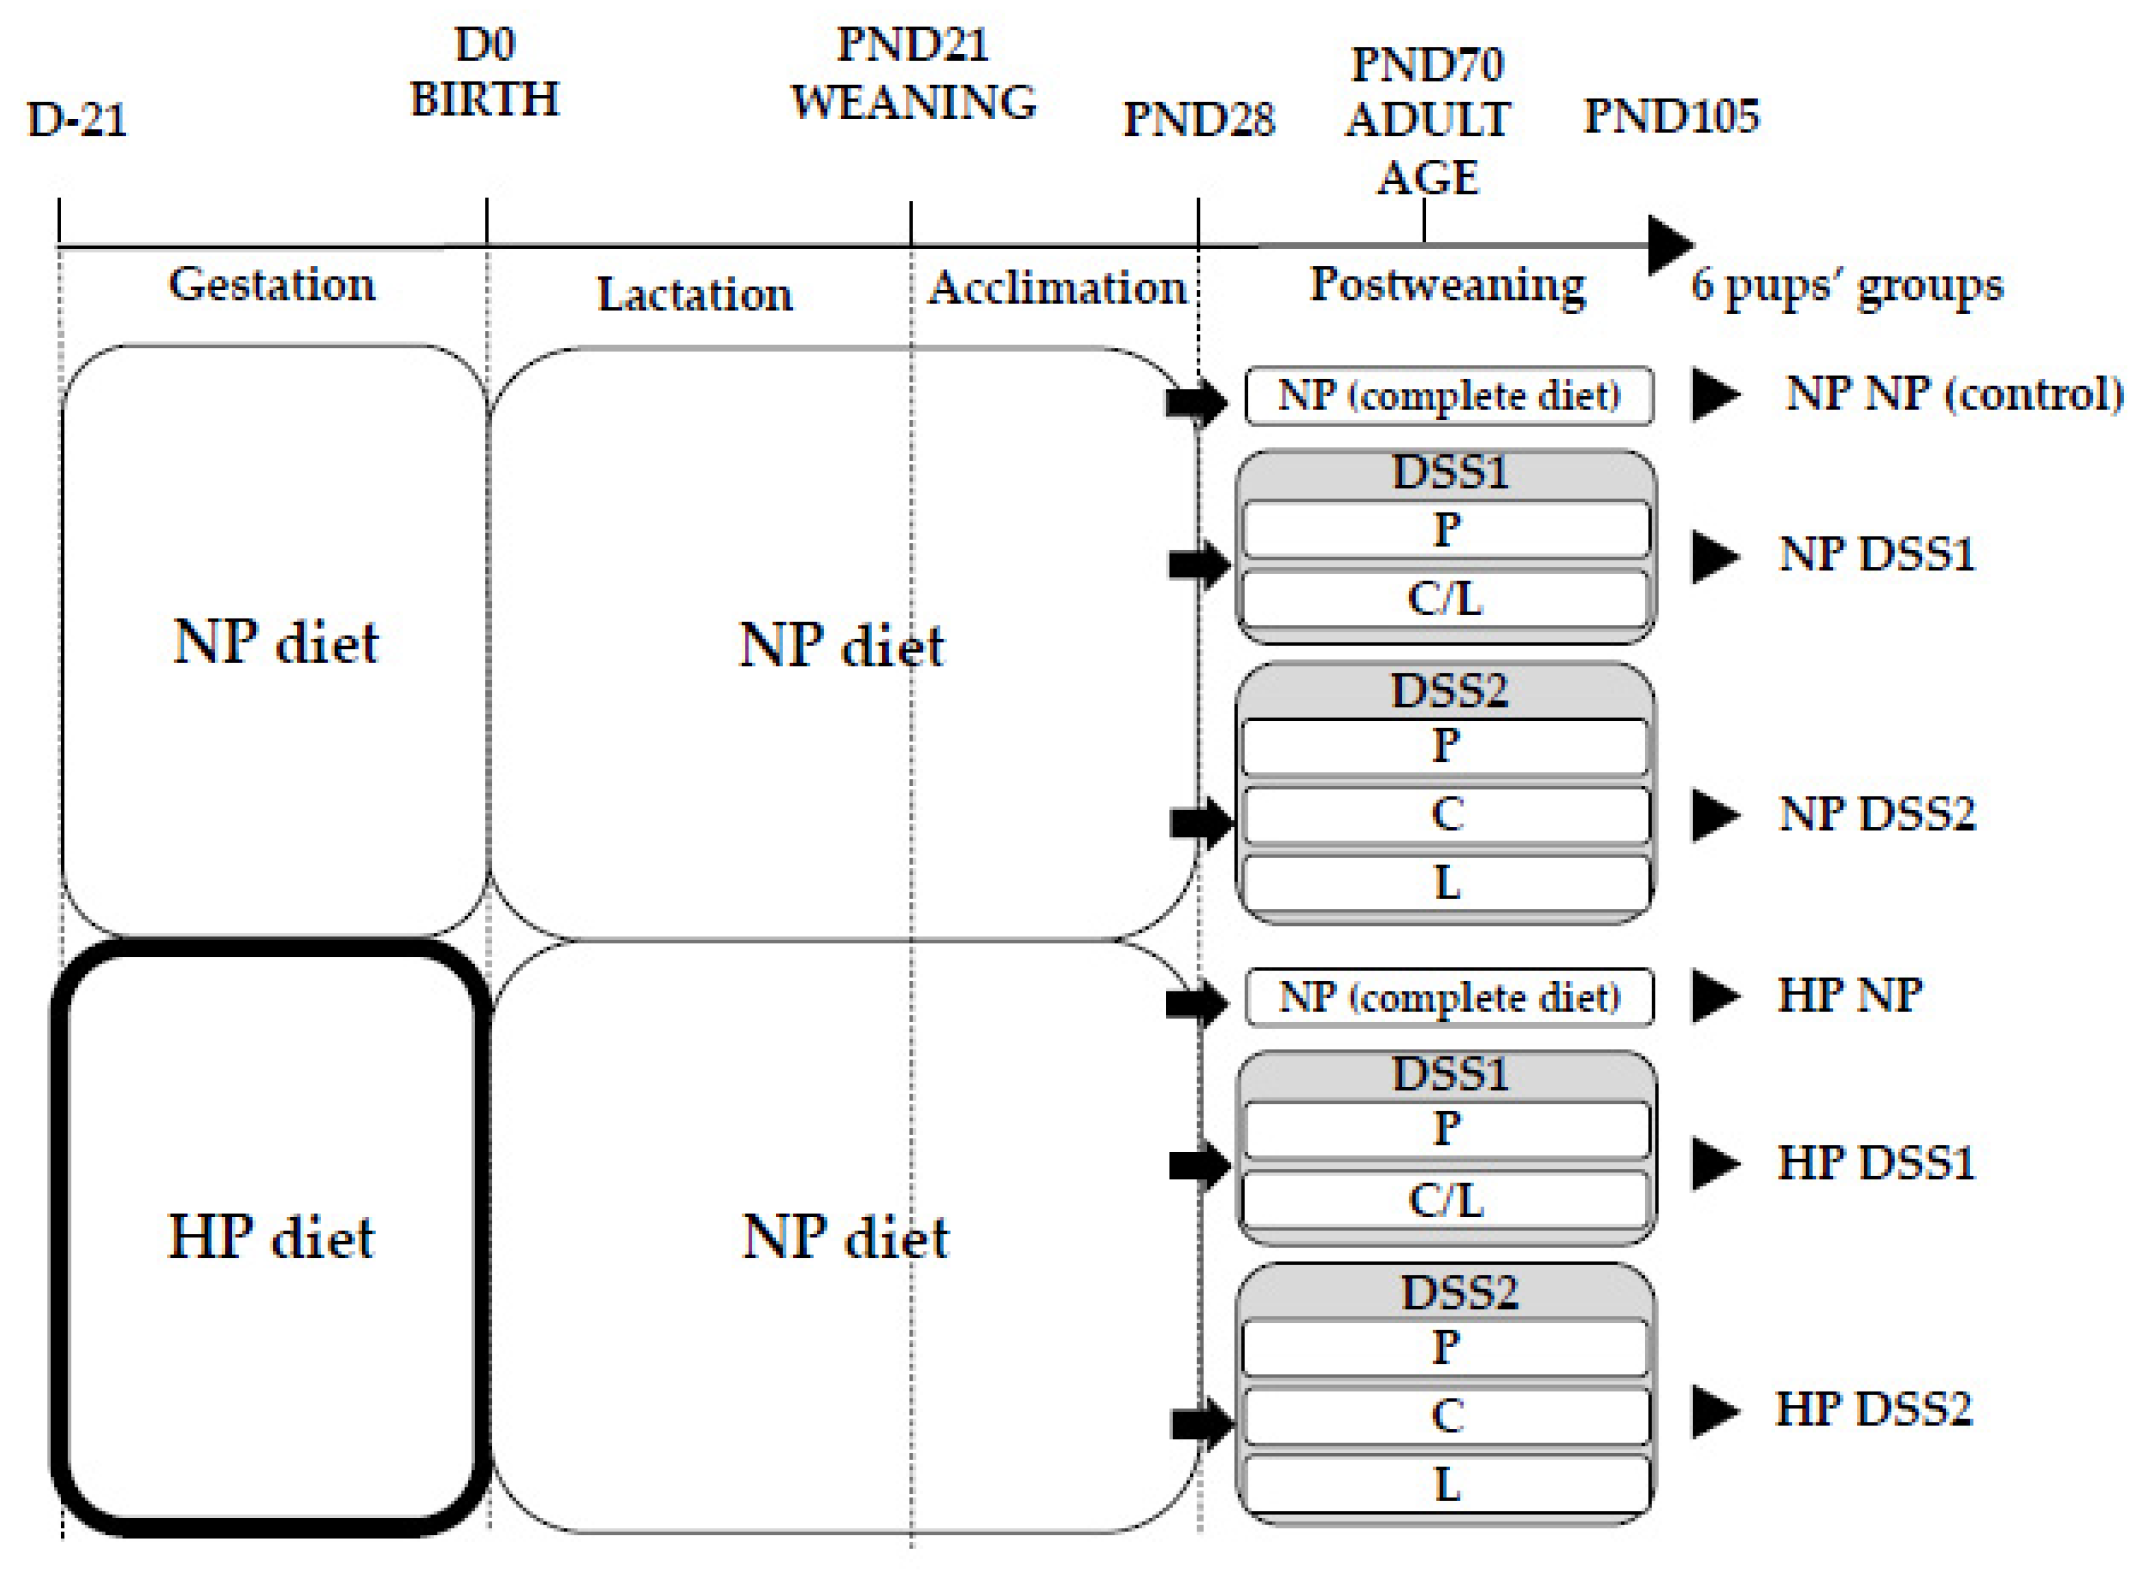
2.1. Experimental Design and Diets
2.2. Body Composition Measurement by Magnetic Resonance Imaging (MRI)
2.3. Sampling
2.4. Biochemical Assays
2.5. Gene Expression by Quantitative PCR
2.6. Statistical Analysis
3. Results
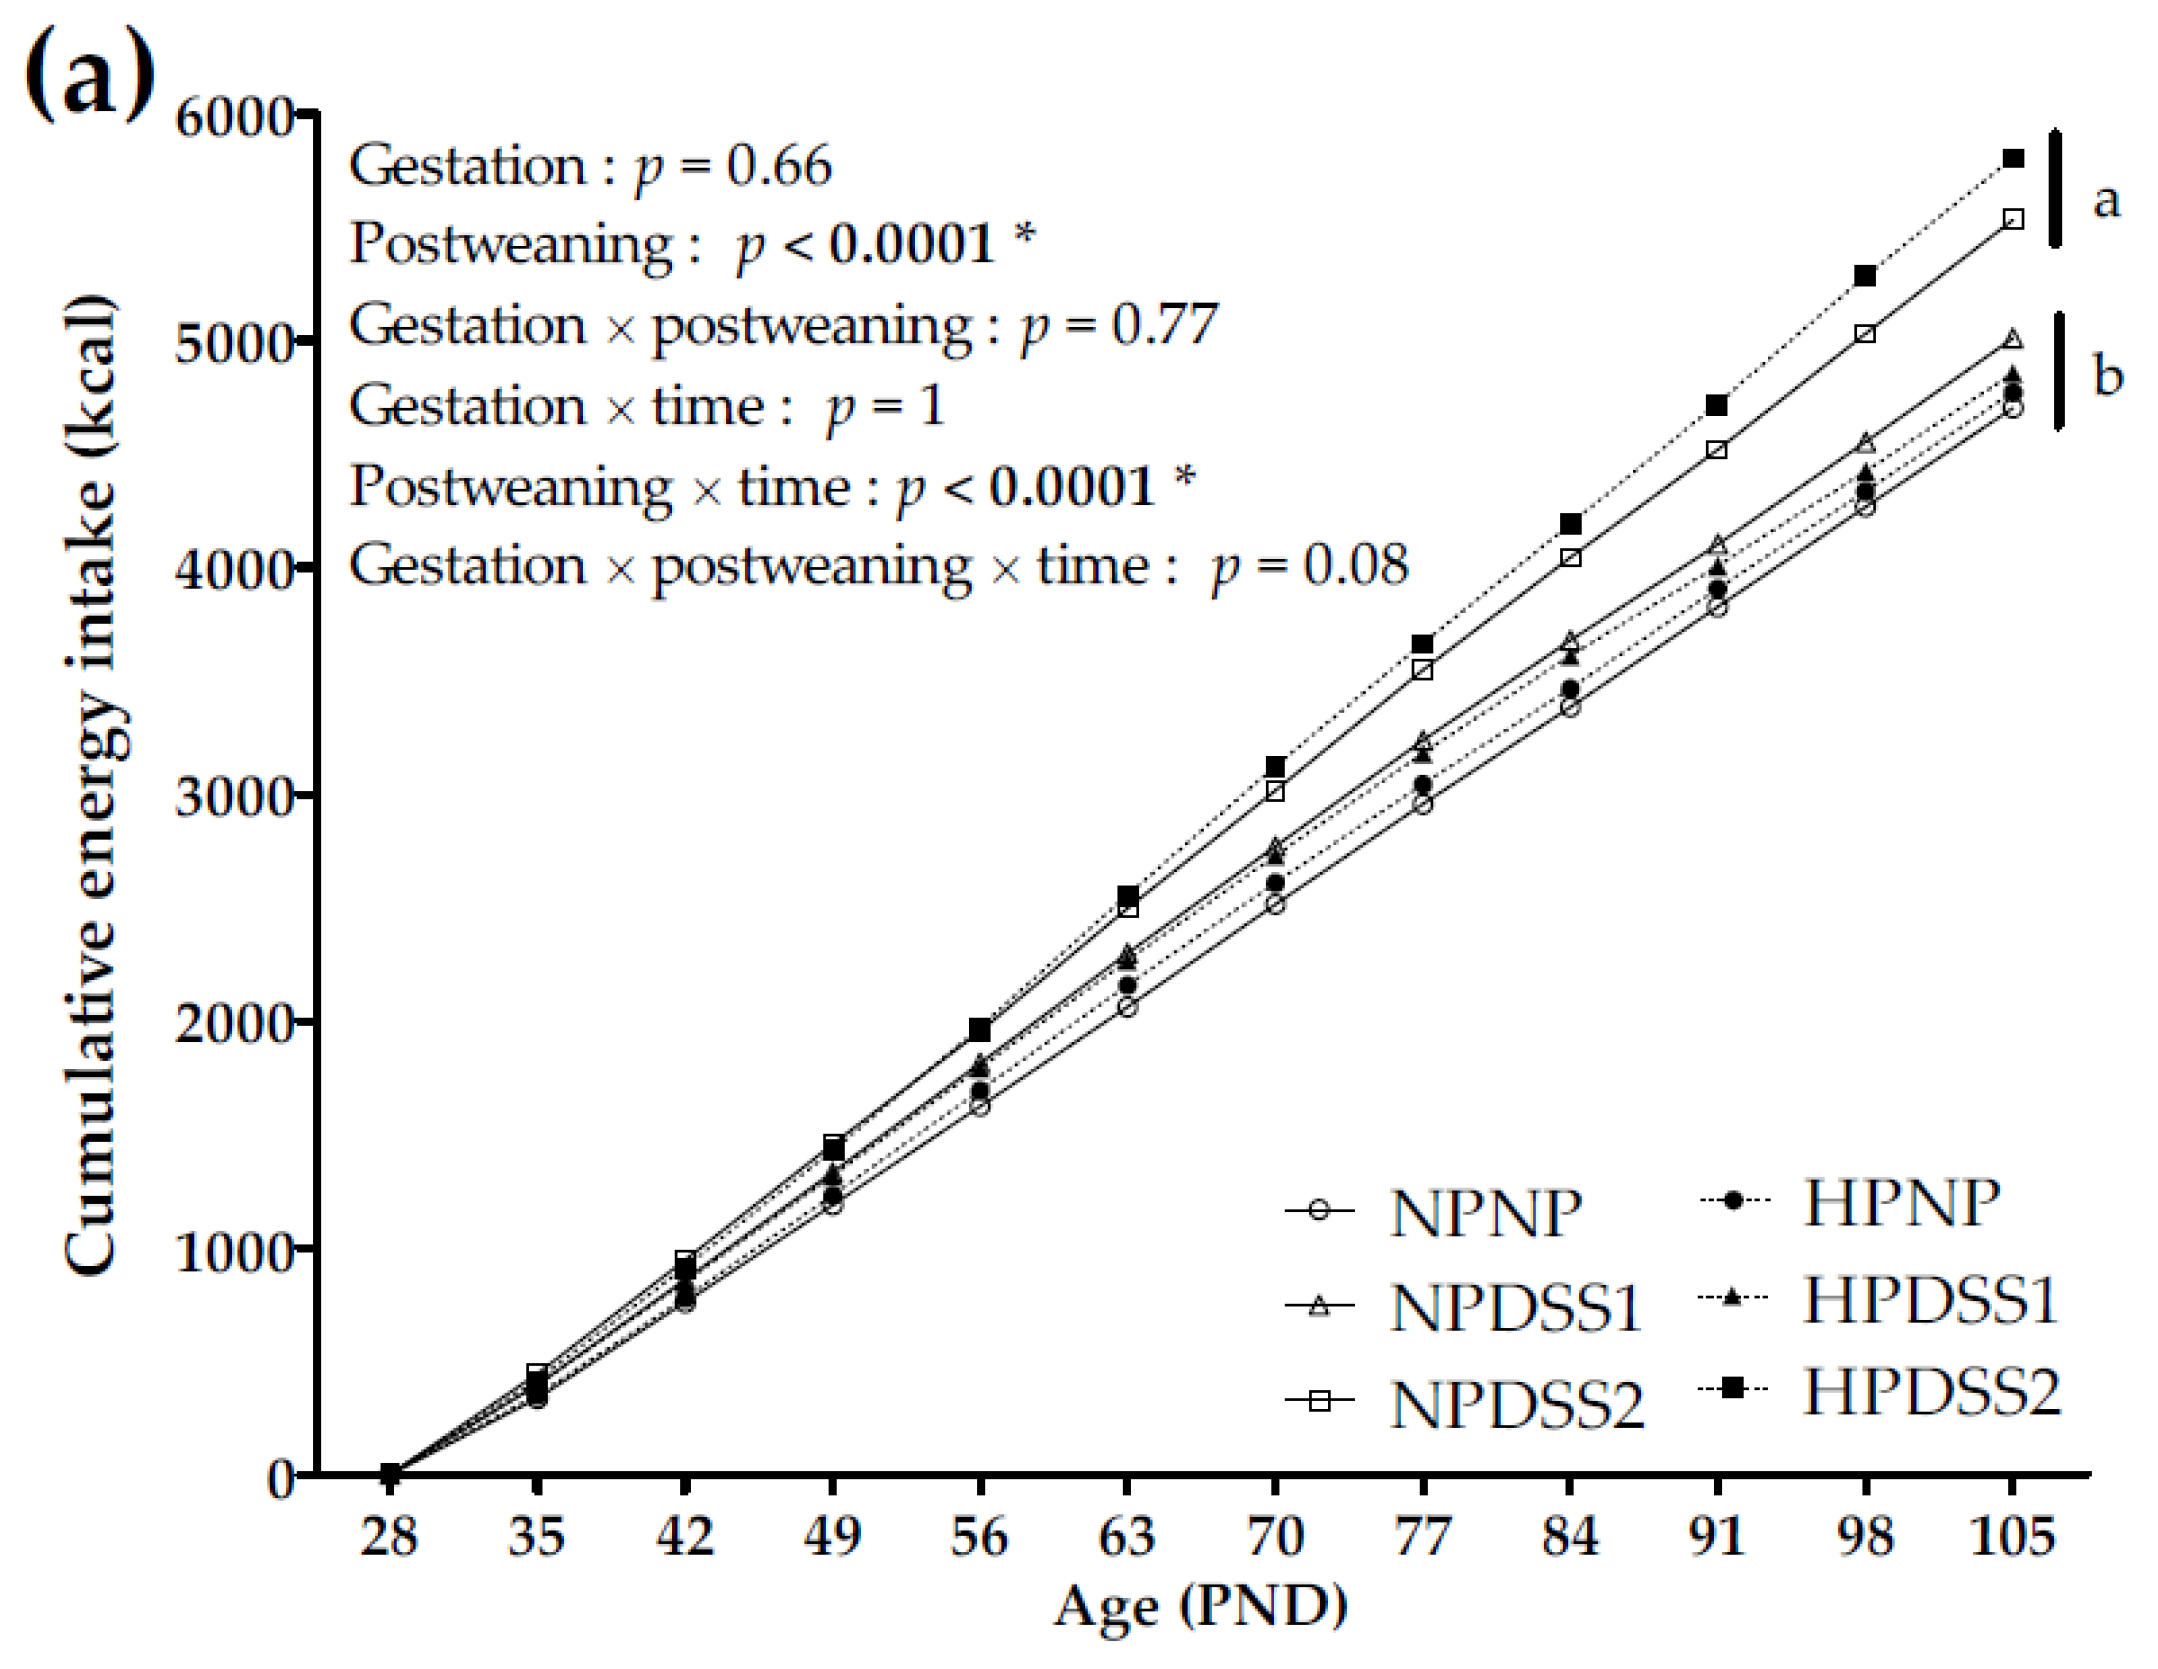
3.1. Offspring Energy Intake and Macronutrient Self-Selection
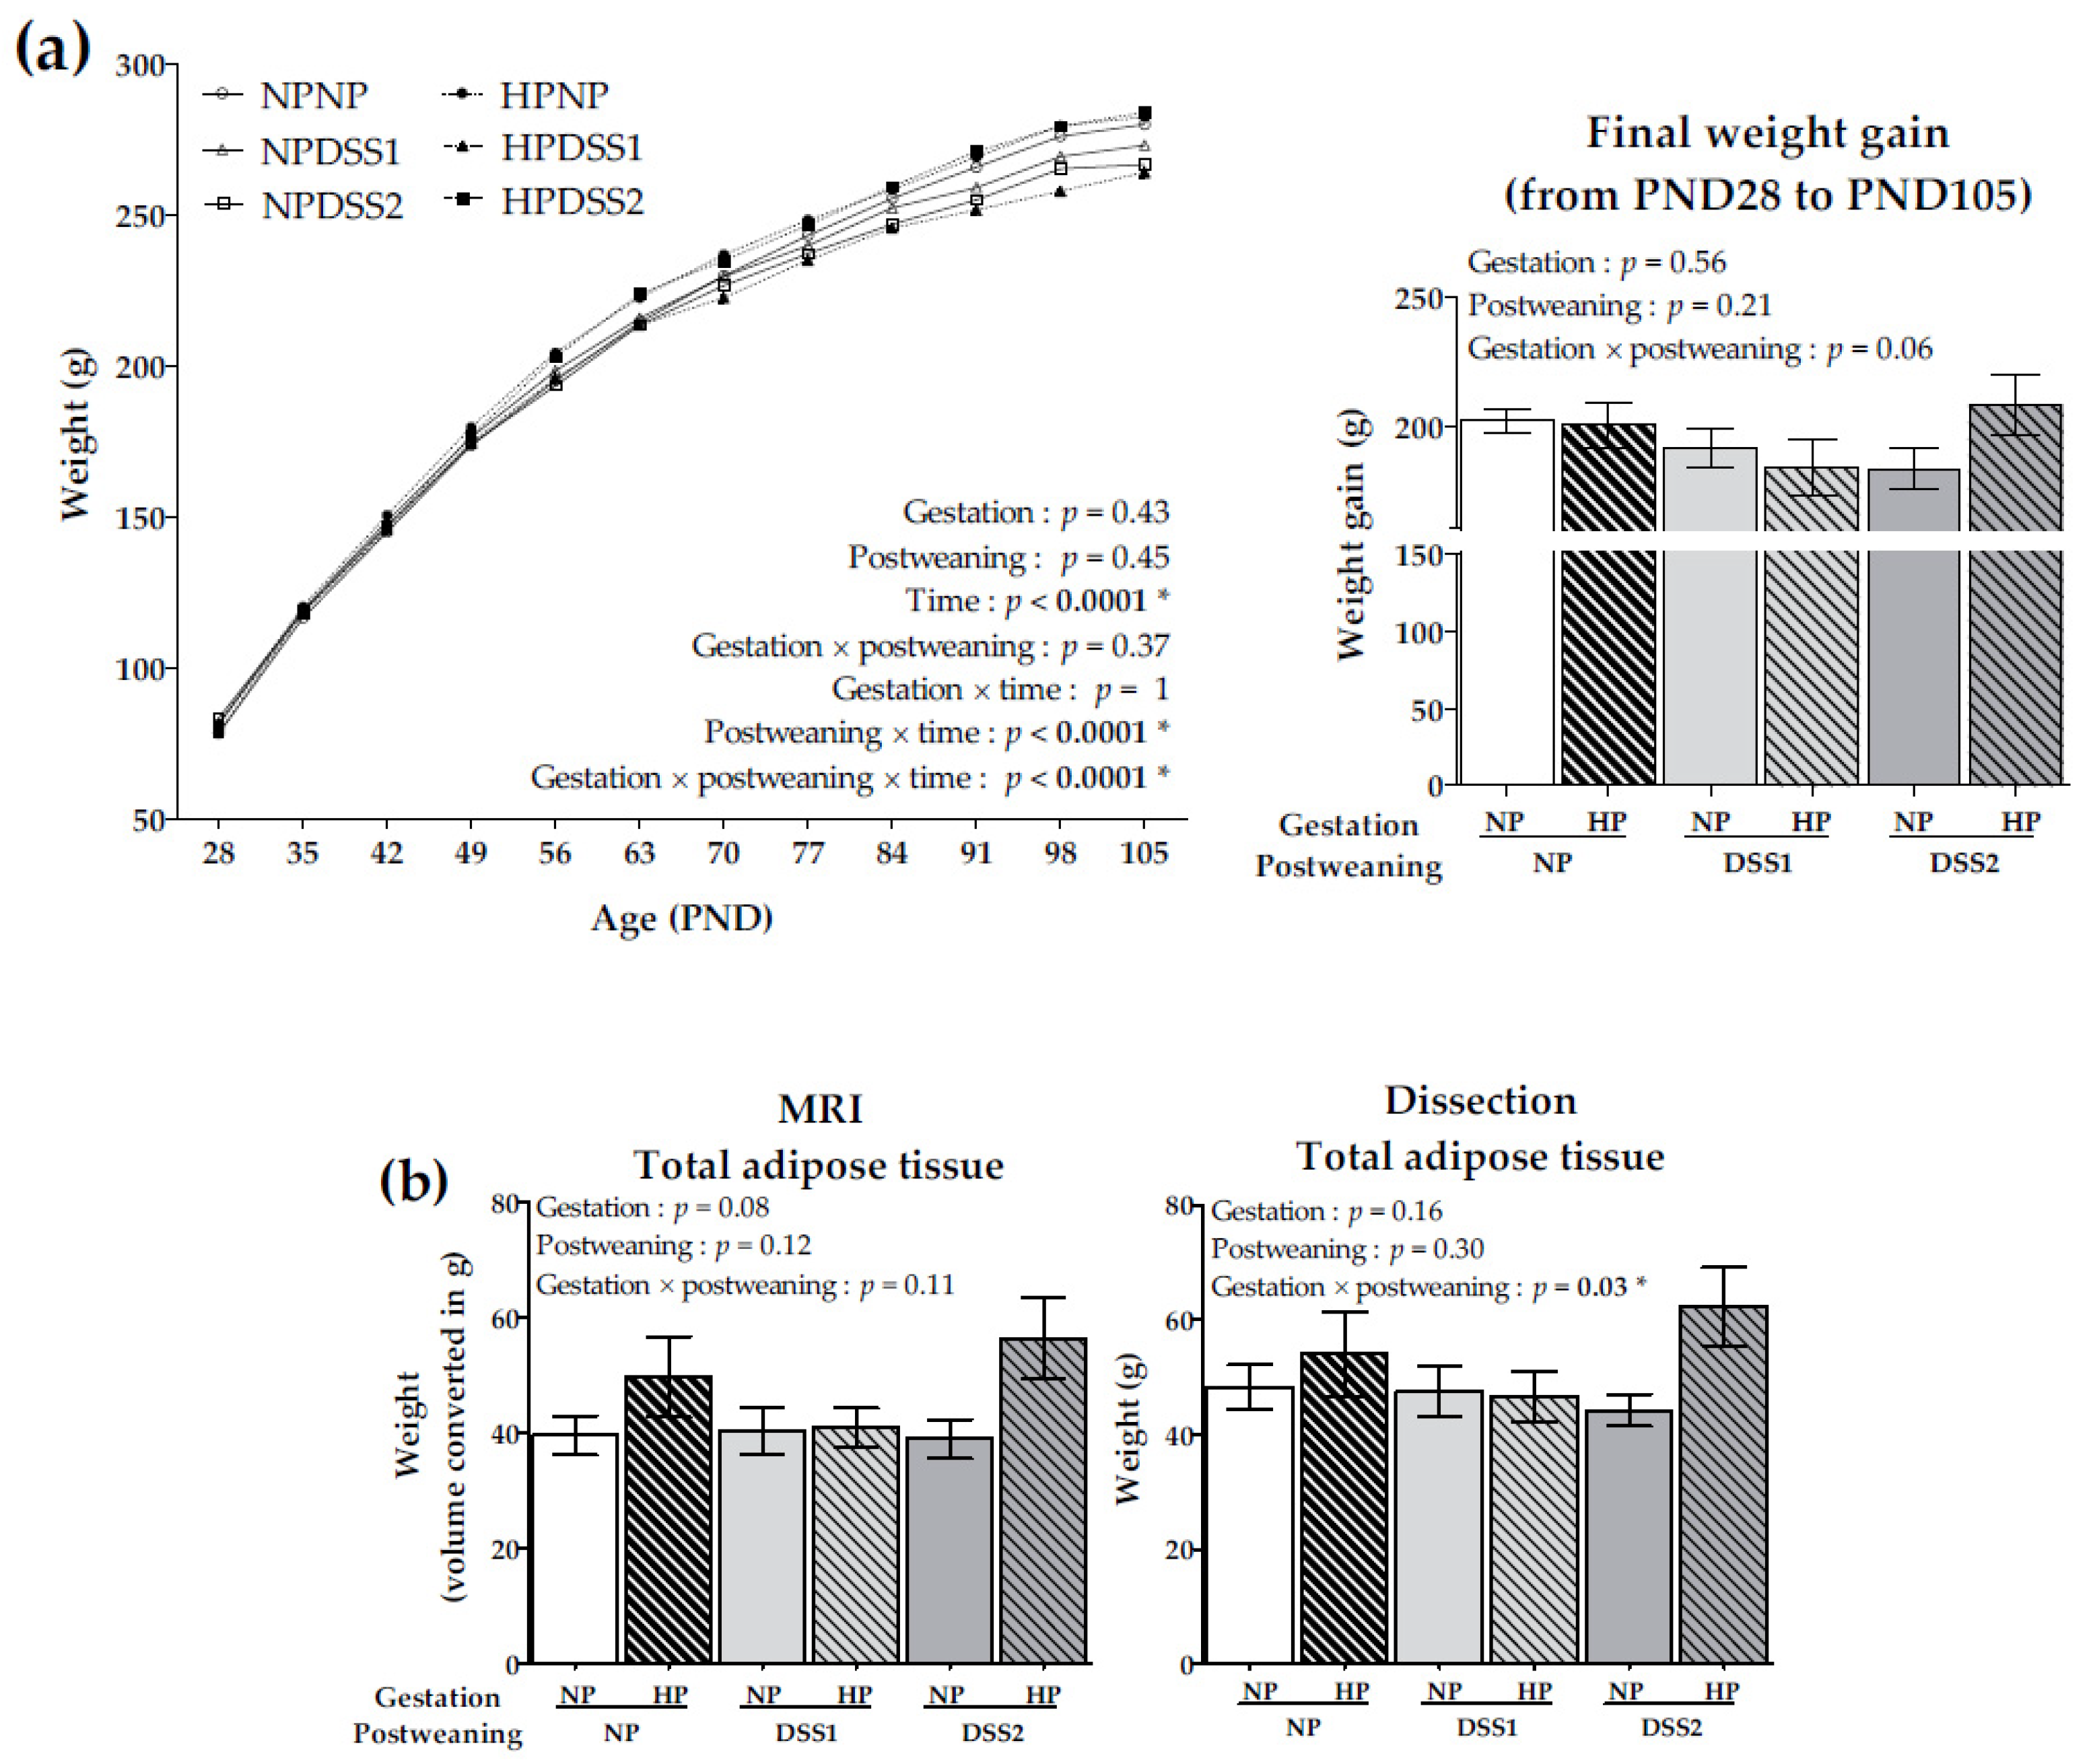
3.2. Offspring Body Weight Gain and Adiposity Development
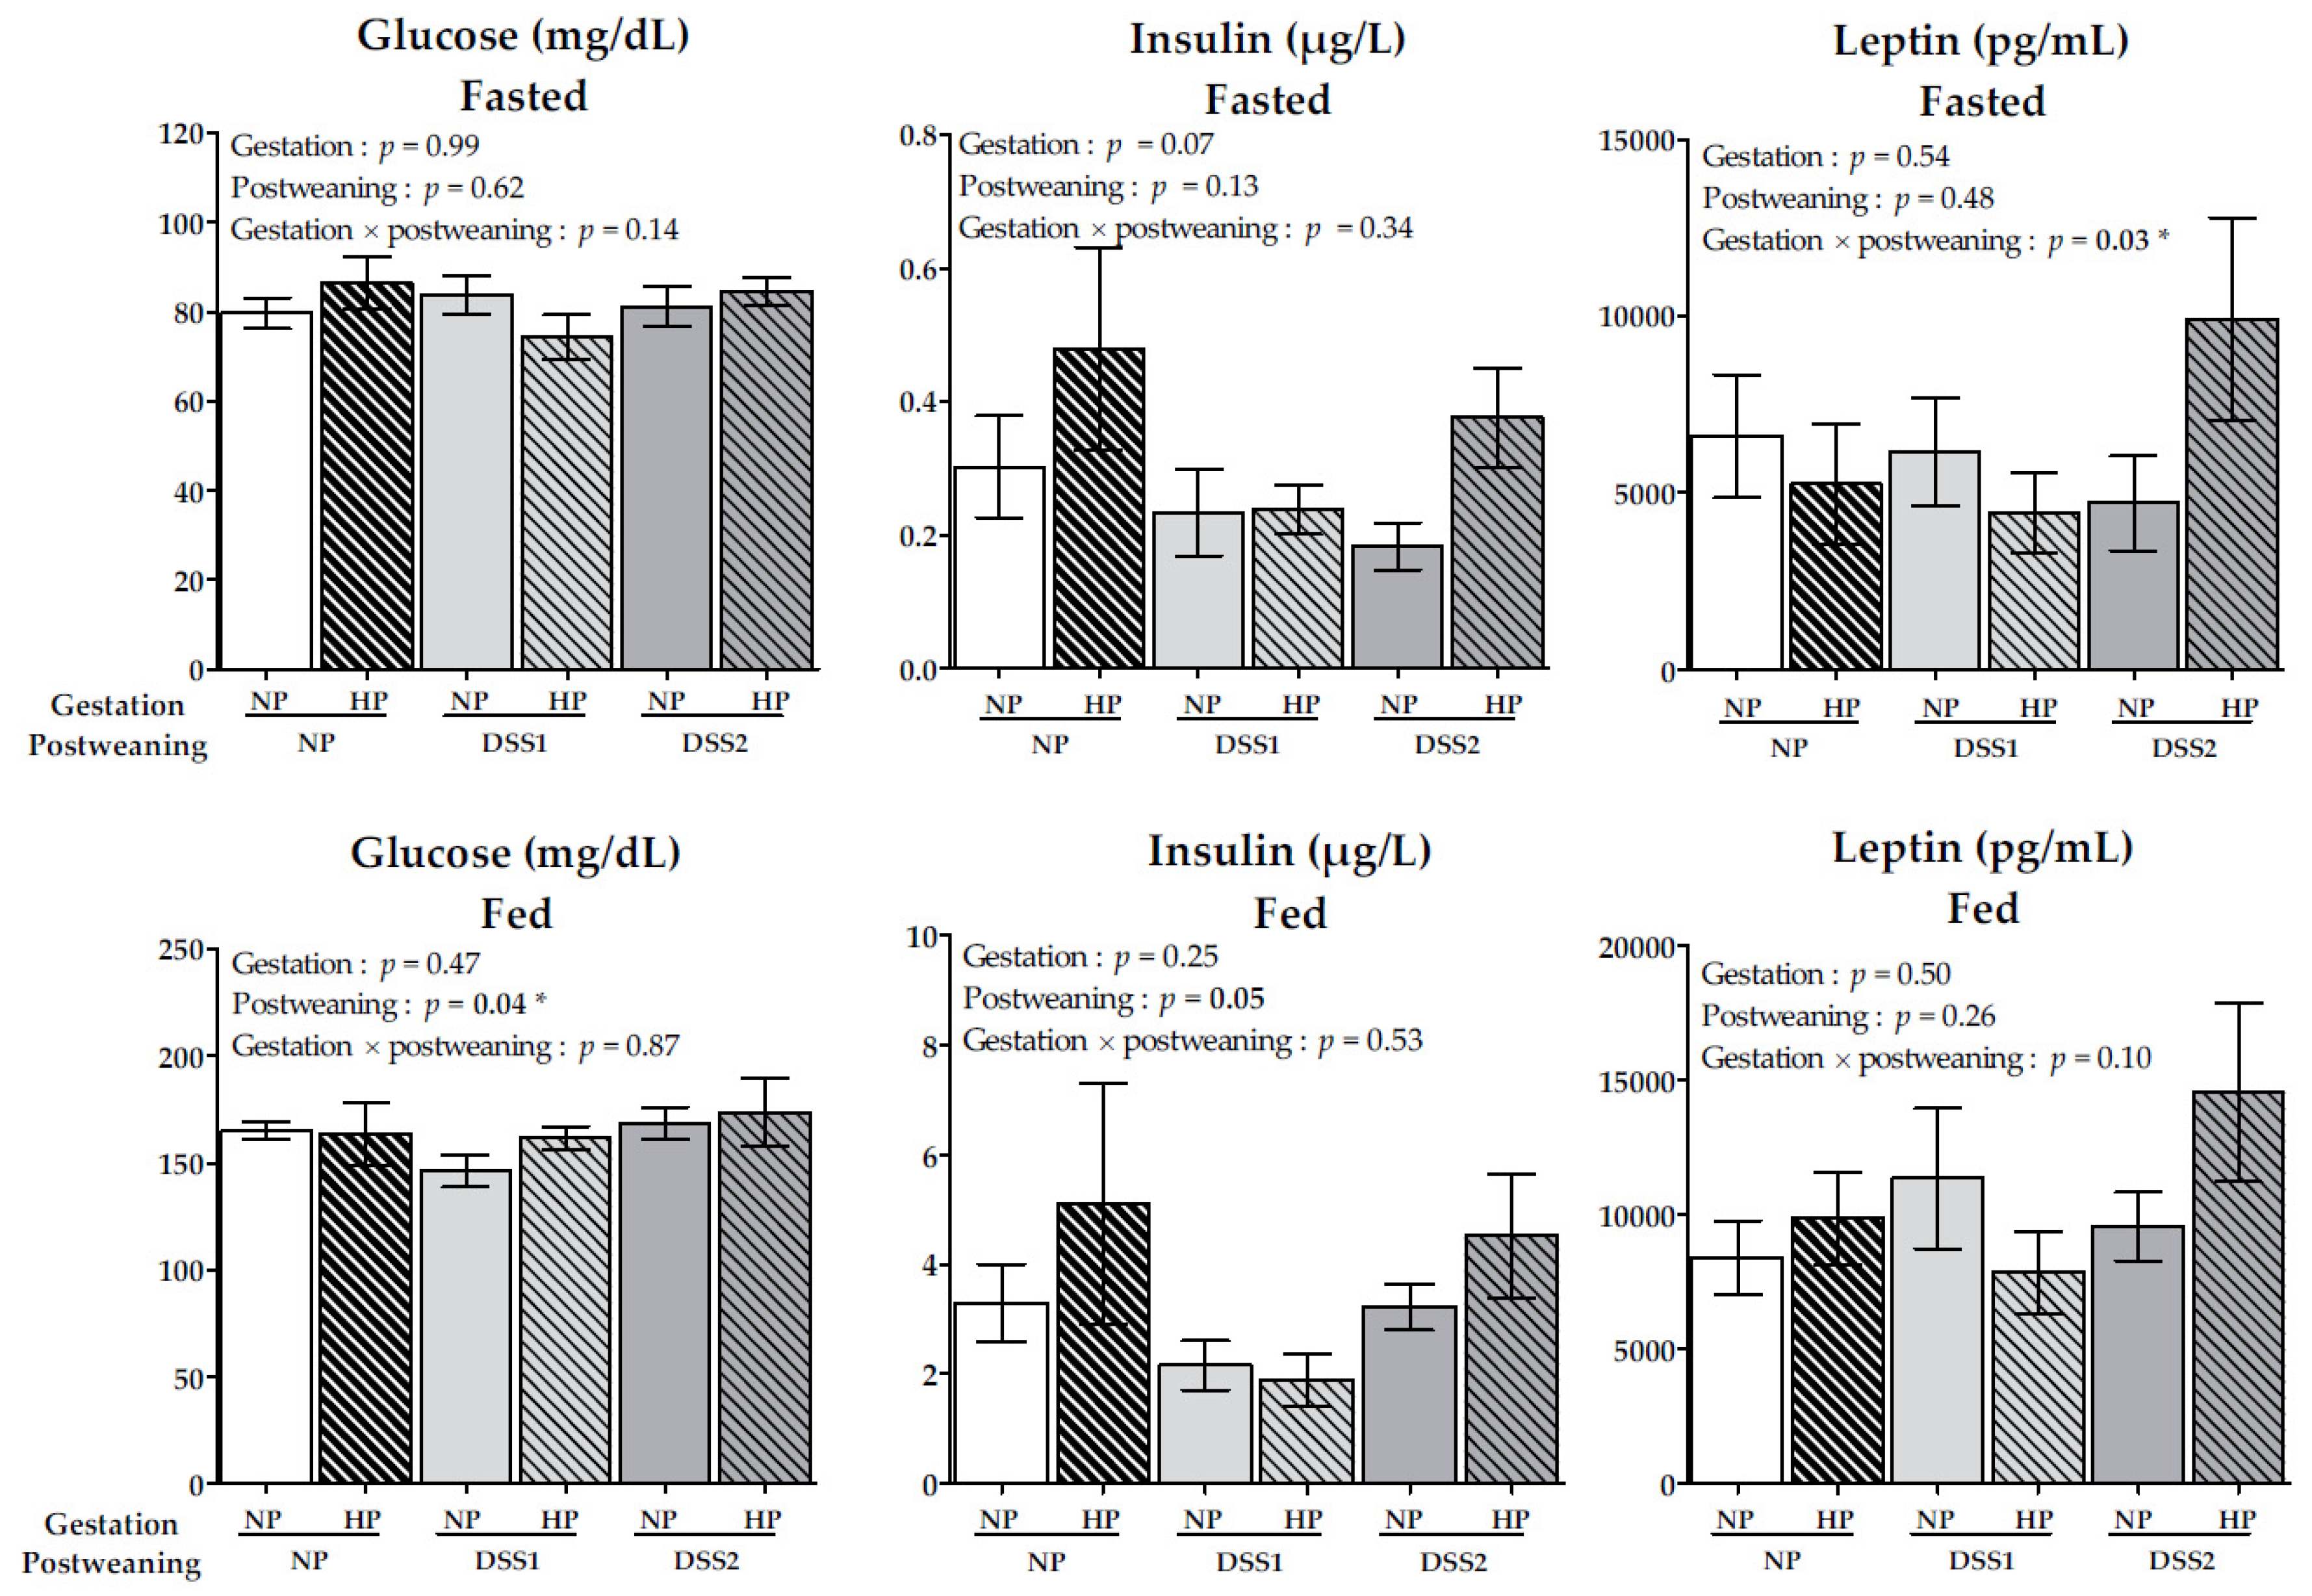
3.3. Maternal HP Diet during Gestation Affects Fasting Leptin Levels
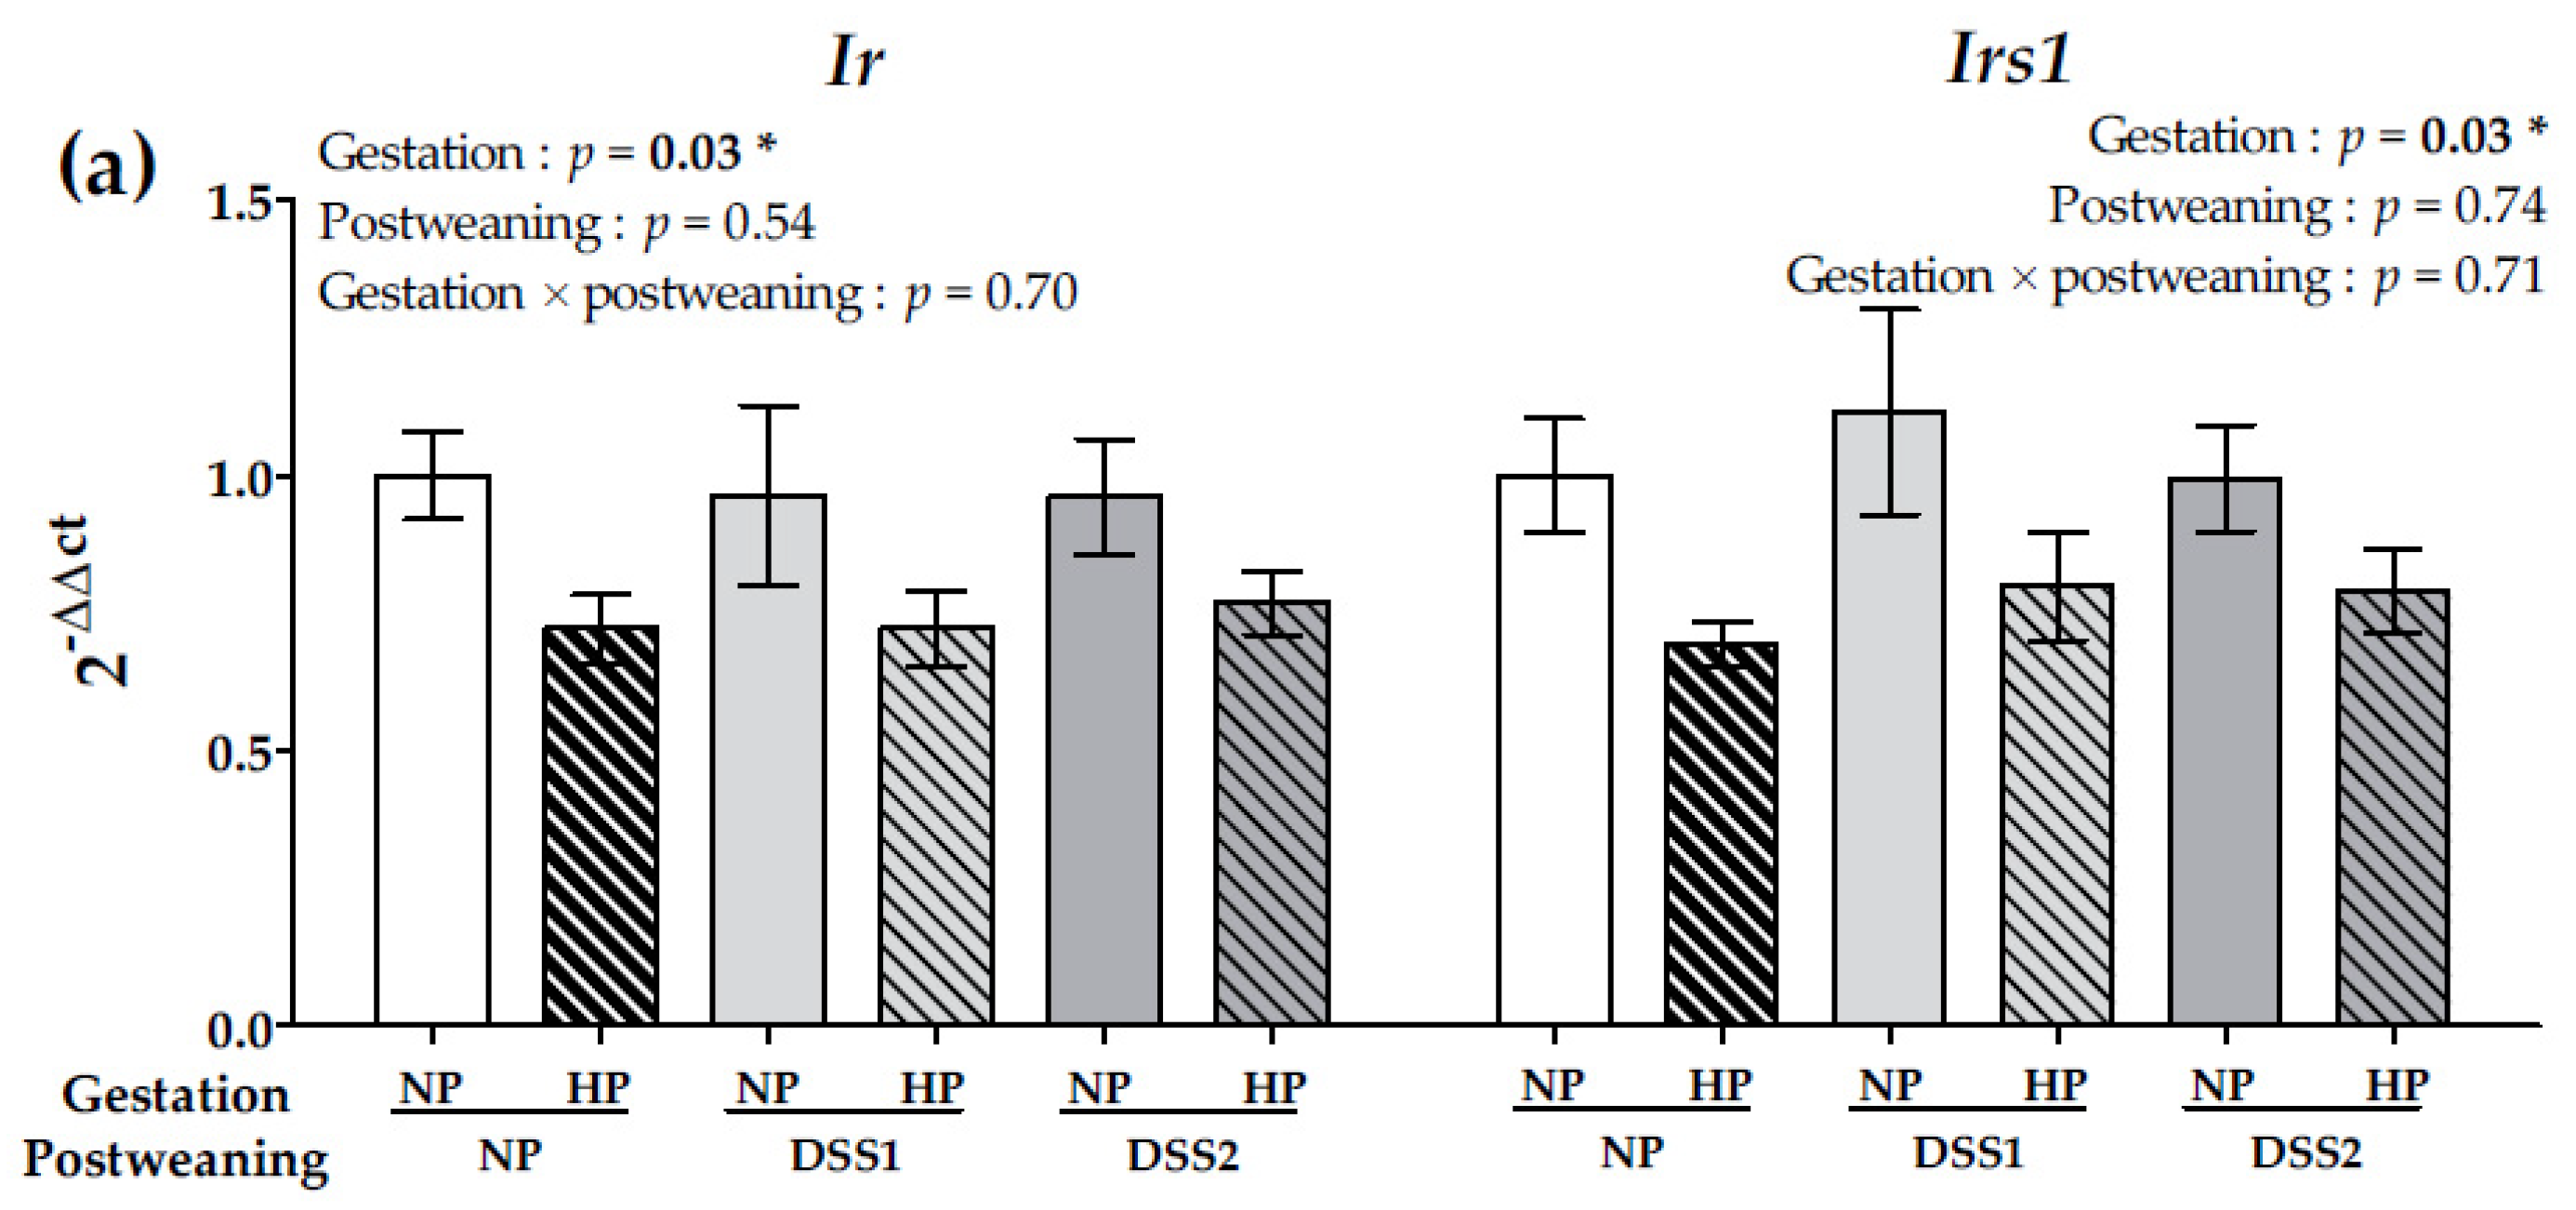
3.4. Maternal HP Diet during Gestation Impacts Liver Insulin Signalling But Not Central Markers of Food Intake Regulation
4. Discussion
5. Conclusions
Supplementary Materials
Author Contributions
Funding
Acknowledgments
Conflicts of Interest
References
- Langley-Evans, S.C. Nutritional programming of disease: Unravelling the mechanism. J. Anat. 2009, 215, 36–51. [Google Scholar] [CrossRef] [PubMed]
- Duque-Guimarães, D.E.; Ozanne, S.E. Nutritional programming of insulin resistance: Causes and consequences. Trends Endocrinol. Metab. 2013, 24, 525–535. [Google Scholar] [CrossRef] [PubMed]
- Ravelli, A.C.; van der Meulen, J.H.; Osmond, C.; Barker, D.J.; Bleker, O.P. Obesity at the age of 50 y in men and women exposed to famine prenatally. Am. J. Clin. Nutr. 1999, 70, 811–816. [Google Scholar] [CrossRef] [PubMed] [Green Version]
- Gluckman, P.D.; Hanson, M.A.; Cooper, C.; Thornburg, K.L. Effect of in utero and early-life conditions on adult health and disease. New Engl. J. Med. 2008, 358, 6173. [Google Scholar] [CrossRef]
- Godfrey, K.M.; Gluckman, P.D.; Hanson, M.A. Developmental origins of metabolic disease: Life course and intergenerational perspectives. Trends Endocrinol. Metab. 2010, 21, 199–205. [Google Scholar] [CrossRef] [PubMed]
- Brenseke, B.; Prater, M.R.; Bahamonde, J.; Gutierrez, J.C. Current Thoughts on Maternal Nutrition and Fetal Programming of the Metabolic Syndrome. J. Preg. 2013, 2013, 1–13. [Google Scholar] [CrossRef] [Green Version]
- Sookoian, S.; Gianotti, T.F.; Burgueño, A.L.; Pirola, C.J. Fetal metabolic programming and epigenetic modifications: A systems biology approach. Pediat. Res. 2013, 73, 531–542. [Google Scholar] [CrossRef]
- Cripps, R.; Martin-gronert, M.; Ozanne, S. Fetal and perinatal programming of appetite. Clin. Sci. 2005, 109, 1–12. [Google Scholar] [CrossRef]
- Langley-Evans, S.C.; Bellinger, L.; McMullen, S. Animal models of programming: Early life influences on appetite and feeding behaviour. Mater. Child Nutr. 2005, 1, 142–148. [Google Scholar] [CrossRef]
- McMillen, I.C.; Adam, C.L.; Mühlhäusler, B.S. Early origins of obesity: Programming the appetite regulatory system: Early origins of obesity. J. Physiol. 2005, 565, 9–17. [Google Scholar] [CrossRef]
- Cooke, L.; Fildes, A. The impact of flavour exposure in utero and during milk feeding on food acceptance at weaning and beyond. Appetite 2011, 57, 808–811. [Google Scholar] [CrossRef] [PubMed]
- Symonds, M.E.; Budge, H.; Stephenson, T.; McMillen, I.C. Fetal endocrinology and development—Manipulation and adaptation to long-term nutritional and environmental challenges. Reproduction 2001, 853–862. [Google Scholar] [CrossRef]
- Jahan-Mihan, A.; Rodriguez, J.; Christie, C.; Sadeghi, M.; Zerbe, T. The Role of Maternal Dietary Proteins in Development of Metabolic Syndrome in Offspring. Nutrients 2015, 7, 9185–9217. [Google Scholar] [CrossRef] [PubMed] [Green Version]
- Bellinger, L.; Langley-Evans, S.C. Fetal programming of appetite by exposure to a maternal low-protein diet in the rat. Clin. Sci. 2005, 109, 413. [Google Scholar] [CrossRef] [PubMed] [Green Version]
- Breton, C.; Lukaszewski, M.-A.; Risold, P.-Y.; Enache, M.; Guillemot, J.; Riviere, G.; Delahaye, F.; Lesage, J.; Dutriez-Casteloot, I.; Laborie, C.; et al. Maternal prenatal undernutrition alters the response of POMC neurons to energy status variation in adult male rat offspring. AJP Endocrinol. Metab. 2008, 296, E462–E472. [Google Scholar] [CrossRef]
- Coupe, B.; Grit, I.; Darmaun, D.; Parnet, P. The timing of “catch-up growth” affects metabolism and appetite regulation in male rats born with intrauterine growth restriction. AJP Regul. Integr. Comp. Physiol. 2009, 297, R813–R824. [Google Scholar] [CrossRef]
- Remacle, C.; Bieswal, F.; Bol, V.; Reusens, B. Developmental programming of adult obesity and cardiovascular disease in rodents by maternal nutrition imbalance. Am. J. Clin. Nutr. 2011, 94, 1846S–1852S. [Google Scholar] [CrossRef]
- Bellinger, L.; Lilley, C.; Langley-Evans, S.C. Prenatal exposure to a maternal low-protein diet programmes a preference for high-fat foods in the young adult rat. Br. J. Nutr. 2004, 92, 513. [Google Scholar] [CrossRef]
- Metges, C.C.; Görs, S.; Lang, I.S.; Hammon, H.M.; Brüssow, K.-P.; Weitzel, J.M.; Nürnberg, G.; Rehfeldt, C.; Otten, W. Low and high dietary protein: Carbohydrate ratios during pregnancy affect materno-fetal glucose metabolism in pigs. J. Nutr. 2014, 144, 155–163. [Google Scholar] [CrossRef]
- Desclee de Maredsous, C.; Oozeer, R.; Barbillon, P.; Mary-Huard, T.; Delteil, C.; Blachier, F.; Tome, D.; van der Beek, E.M.; Davila, A.-M. High-Protein Exposure during Gestation or Lactation or after Weaning Has a Period-Specific Signature on Rat Pup Weight, Adiposity, Food Intake and Glucose Homeostasis up to 6 Weeks of Age. J. Nutr. 2016, 146, 21–29. [Google Scholar] [CrossRef]
- Daenzer, M.; Ortmann, S.; Klaus, S.; Metges, C.C. Prenatal high protein exposure decreases energy expenditure and increases adiposity in young rats. J. Nutr. 2002, 132, 142–144. [Google Scholar] [CrossRef] [PubMed]
- Hallam, M.C.; Reimer, R.A. A maternal high-protein diet predisposes female offspring to increased fat mass in adulthood whereas a prebiotic fibre diet decreases fat mass in rats. Br. J. Nutr. 2013, 110, 1732–1741. [Google Scholar] [CrossRef] [Green Version]
- Maslova, E.; Rytter, D.; Bech, B.H.; Henriksen, T.B.; Rasmussen, M.A.; Olsen, S.F.; Halldorsson, T.I. Maternal protein intake during pregnancy and offspring overweight 20 y later. Am. J. Clin. Nutr. 2014, 100, 1139–1148. [Google Scholar] [CrossRef] [PubMed] [Green Version]
- Pimpin, L.; Jebb, S.; Johnson, L.; Wardle, J.; Ambrosini, G.L. Dietary protein intake is associated with body mass index and weight up to 5 y of age in a prospective cohort of twins. Am. J. Clin. Nutr. 2016, 103, 389–397. [Google Scholar] [CrossRef]
- Kalisch-Smith, J.I.; Simmons, D.G.; Dickinson, H.; Moritz, K.M. Review: Sexual dimorphism in the formation, function and adaptation of the placenta. Placenta 2017, 54, 10–16. [Google Scholar] [CrossRef] [PubMed]
- Makarios-Lahham, L.; Roseau, S.M.; Fromentin, G.; Tome, D.; Even, P.C. Rats free to select between pure protein and a fat-carbohydrate mix ingest high-protein mixed meals during the dark period and protein meals during the light period. J. Nutr. 2004, 134, 618–624. [Google Scholar] [CrossRef] [PubMed]
- Jean, C.; Fromentin, G.; Tomé, D.; Larue-Achagiotis, C. Wistar rats allowed to self-select macronutrients from weaning to maturity choose a high-protein, high-lipid diet. Physiol. Behav. 2002, 76, 65–73. [Google Scholar] [CrossRef]
- Reeves, P.G.; Nielsen, F.H.; Fahey, G.C. AIN-93 Purified Diets for Laboratory Rodents: Final Report of the American Institute of Nutrition Ad Hoc Writing Committee on the Reformulation of the AIN-76A Rodent Diet. J. Nutr. 1993, 123, 1939–1951. [Google Scholar] [CrossRef]
- Chaumontet, C.; Recio, I.; Fromentin, G.; Benoit, S.; Piedcoq, J.; Darcel, N.; Tomé, D. The Protein Status of Rats Affects the Rewarding Value of Meals Due to their Protein Content. J. Nutr. 2018, 148, 989–998. [Google Scholar] [CrossRef]
- Chaumontet, C.; Even, P.C.; Schwarz, J.; Simonin-Foucault, A.; Piedcoq, J.; Fromentin, G.; Azzout-Marniche, D.; Tomé, D. High dietary protein decreases fat deposition induced by high-fat and high-sucrose diet in rats. Br. J. Nutr. 2015, 114, 1132–1142. [Google Scholar] [CrossRef]
- Spiegelman, B.M.; Flier, J.S. Obesity and the regulation of energy balance. Cell 2001, 104, 531–543. [Google Scholar] [CrossRef]
- Leibowitz, S.F.; Lucas, D.J.; Leibowitz, K.L.; Jhanwar, Y.S. Developmental Patterns of Macronutrient Intake in Female and Male Rats from Weaning to Maturity. Physiol. Behav. 1991, 50, 1167–1174. [Google Scholar] [CrossRef]
- Cambraia, R.P.; Vannucchi, H.; Almeida, S.S.; De-Oliveira, L.M. Effects of malnutrition during early lactation on development and feeding behaviour under the self-selection paradigm. Nutrition 2001, 17, 455–461. [Google Scholar] [CrossRef]
- Rolls, B.J.; Van Duijvenvoorde, P.M.; Rowe, E.A. Variety in the diet enhances intake in a meal and contributes to the development of obesity in the rat. Physiol. Behav. 1983, 31, 21–27. [Google Scholar] [CrossRef]
- Tordoff, M.G. Obesity by choice: The powerful influence of nutrient availability on nutrient intake. Am. J. Physiol. Regul. Integr. Comp. Physiol. 2002, 282, R1536–R1539. [Google Scholar] [CrossRef] [PubMed]
- la Fleur, S.E.; Luijendijk, M.C.M.; van der Zwaal, E.M.; Brans, M.A.D.; Adan, R.A.H. The snacking rat as model of human obesity: Effects of a free-choice high-fat high-sugar diet on meal patterns. Int. J. Obes. 2014, 38, 643–649. [Google Scholar] [CrossRef] [PubMed]
- Capeau, J. Voies de signalisation de l’insuline: Mécanismes affectés dans l’insulino-résistance. Méd. Sci. 2003, 19, 834–839. [Google Scholar] [CrossRef]
- Shanik, M.H.; Xu, Y.; Skrha, J.; Dankner, R.; Zick, Y.; Roth, J. Insulin Resistance and Hyperinsulinemia: Is hyperinsulinemia the cart or the horse? Diabetes Care 2008, 31, S262–S268. [Google Scholar] [CrossRef] [Green Version]
- Vanselow, J.; Kucia, M.; Langhammer, M.; Koczan, D.; Metges, C.C. Maternal high-protein diet during pregnancy but not during suckling, induced altered expression of an increasing number of hepatic genes in adult mouse offspring. Eur. J. Nutr. 2015, 55, 917–930. [Google Scholar] [CrossRef]
- Duckworth, W.C.; Bennett, R.G.; Hamel, F.G. Insulin degradation: Progress and potential. Endocr. Rev. 1998, 19, 608–624. [Google Scholar] [CrossRef]
- Michael, M.D.; Kulkarni, R.N.; Postic, C.; Previs, S.F.; Shulman, G.I.; Magnuson, M.A.; Kahn, C.R. Loss of insulin signalling in hepatocytes leads to severe insulin resistance and progressive hepatic dysfunction. Mol. Cell 2000, 6, 87–97. [Google Scholar] [CrossRef]
- Saltiel, A.R.; Kahn, C.R. Insulin signalling and the regulation of glucose and lipid metabolism. Nature 2001, 414, 799–806. [Google Scholar] [CrossRef] [PubMed]
- Metges, C.C.; Lang, I.S.; Hennig, U.; Brüssow, K.-P.; Kanitz, E.; Tuchscherer, M.; Schneider, F.; Weitzel, J.M.; Steinhoff-Ooster, A.; Sauerwein, H.; et al. Intrauterine Growth Retarded Progeny of Pregnant Sows Fed High Protein:Low Carbohydrate Diet Is Related to Metabolic Energy Deficit. PLoS ONE 2012, 7, e31390. [Google Scholar] [CrossRef] [PubMed]
- Sahu, A. Leptin signaling in the hypothalamus: Emphasis on energy homeostasis and leptin resistance. Front. Neuroendocrinol. 2003, 24, 225–253. [Google Scholar] [CrossRef] [PubMed]
- Ahima, R.S.; Antwi, D.A. Brain Regulation of Appetite and Satiety. Endocrinol. Metab. Clin. N. Am. 2008, 37, 811–823. [Google Scholar] [CrossRef] [PubMed] [Green Version]
- Schwartz, M.W.; Woods, S.C.; Porte, D.; Seeley, R.J.; Baskin, D.G. Central nervous system control of food intake. Nature 2000, 404, 661–671. [Google Scholar] [CrossRef] [PubMed]
- Coelho, M.; Oliveira, T.; Fernandes, R. State of the art paper Biochemistry of adipose tissue: An endocrine organ. Arch. Med. Sci. 2013, 2, 191–200. [Google Scholar] [CrossRef] [PubMed]
- Enriori, P.J.; Evans, A.E.; Sinnayah, P.; Cowley, M.A. Leptin Resistance and Obesity. Obesity 2006, 14, 254S–258S. [Google Scholar] [CrossRef] [Green Version]
- Myers, M.G.; Leibel, R.L.; Seeley, R.J.; Schwartz, M.W. Obesity and leptin resistance: Distinguishing cause from effect. Trends Endocrinol. Metab. 2010, 21, 643–651. [Google Scholar] [CrossRef]
- Fulton, S. Appetite and reward. Front. Neuroendocrinol. 2010, 31, 85–103. [Google Scholar] [CrossRef]
- Kenny, P.J. Reward Mechanisms in Obesity: New Insights and Future Directions. Neuron 2011, 69, 664–679. [Google Scholar] [CrossRef] [PubMed] [Green Version]
- Johnson, P.M.; Kenny, P.J. Dopamine D2 receptors in addiction-like reward dysfunction and compulsive eating in obese rats. Nature Neurosci. 2010, 13, 635–641. [Google Scholar] [CrossRef] [PubMed] [Green Version]
- Alsiö, J.; Olszewski, P.K.; Norbäck, A.H.; Gunnarsson, Z.E.A.; Levine, A.S.; Pickering, C.; Schiöth, H.B. Dopamine D1 receptor gene expression decreases in the nucleus accumbens upon long-term exposure to palatable food and differs depending on diet-induced obesity phenotype in rats. Neuroscience 2010, 171, 779–787. [Google Scholar] [CrossRef] [PubMed]
- Vucetic, Z.; Carlin, J.L.; Totoki, K.; Reyes, T.M. Epigenetic dysregulation of the dopamine system in diet-induced obesity: Chronic high-fat diet and CNS DNA methylation. J. Neurochem. 2012, 120, 891–898. [Google Scholar] [CrossRef] [PubMed]
- Vucetic, Z.; Kimmel, J.; Totoki, K.; Hollenbeck, E.; Reyes, T.M. Maternal High-Fat Diet Alters Methylation and Gene Expression of Dopamine and Opioid-Related Genes. Endocrinology 2010, 151, 4756–4764. [Google Scholar] [CrossRef] [PubMed] [Green Version]
- Naef, L.; Moquin, L.; Dal Bo, G.; Giros, B.; Gratton, A.; Walker, C.-D. Maternal high-fat intake alters presynaptic regulation of dopamine in the nucleus accumbens and increases motivation for fat rewards in the offspring. Neuroscience 2011, 176, 225–236. [Google Scholar] [CrossRef] [PubMed]
- Mcmillen, I.C.; Robinson, J.S. Developmental Origins of the Metabolic Syndrome: Prediction, Plasticity and Programming. Physiol. Rev. 2005, 85, 571–633. [Google Scholar] [CrossRef]
- Correia-Branco, A.; Keating, E.; Martel, F. Maternal Undernutrition and Fetal Developmental Programming of Obesity: The Glucocorticoid Connection. Reprod. Sci. 2015, 22, 138–145. [Google Scholar] [CrossRef]


| NP | HP | P | C/L | C | L | |
|---|---|---|---|---|---|---|
| Composition | ||||||
| Metabolizable energy (kcal/g) | 3.8 | 3.8 | 3.6 | 3.9 | 3.6 | 8.1 |
| Proteins (% energy) | 20 | 55 | 100 | - | - | - |
| Carbohydrates (% energy) | 70 | 35 | - | 88 | 100 | - |
| Lipids (% energy) | 10 | 10 | - | 12 | - | 100 |
| Ingredients (g/kg) | ||||||
| Cow milk protein | 200 | 530 | 902.7 | - | - | - |
| Corn starch | 570 | 287 | - | 732.3 | 776.4 | - |
| Sucrose | 92.7 | 45.7 | - | 119.1 | 126.3 | - |
| Soybean oil | 40 | 40 | - | 51.3 | - | 902.7 |
| Mineral mix (AIN-93-MX) | 35 | 35 | 35 | 35 | 35 | 35 |
| Vitamin mix (AIN-93-VX) | 10 | 10 | 10 | 10 | 10 | 10 |
| Cellulose | 50 | 50 | 50 | 50 | 50 | 50 |
| Choline | 2.3 | 2.3 | 2.3 | 2.3 | 2.3 | 2.3 |
| Ratios (g/g) | ||||||
| Carbohydrates/lipids | 16.6 | 8.3 | - | 16.6 | - | - |
| Corn starch/sucrose | 6.2 | 6.3 | - | 6.2 | 6.2 | - |
| Gestation Diet | NP | HP | P | |||||||
|---|---|---|---|---|---|---|---|---|---|---|
| Postweaning Diet | NP (n = 8) | DSS1 (n = 8) | DSS2 (n = 8) | NP (n = 7) | DSS1 (n = 8) | DSS2 (n = 8) | Gestation | Postweaning | Gestation × Postweaning | |
| PND28 | ||||||||||
| MRI | TAT | 6.5 ± 0.4 | 6.5 ± 0.5 | 6.7 ± 0.5 | 6.9 ± 0.3 | 7.2 ± 0.3 | 7.0 ± 0.5 | 0.21 | 0.80 | 0.39 |
| VAT | 4.5 ± 0.3 | 4.5 ± 0.3 | 4.7 ± 0.4 | 4.8 ± 0.3 | 5.1 ± 0.2 | 4.9 ± 0.4 | 0.34 | 0.96 | 0.66 | |
| SAT | 2.0 ± 0.2 | 2.0 ± 0.2 | 2.0 ± 0.2 | 2.1 ± 0.1 | 2.1 ± 0.1 | 2.1 ± 0.2 | 0.23 | 0.75 | 0.31 | |
| PND70 | ||||||||||
| MRI | TAT | 27.3 ± 2.5 | 28.3 ± 2.5 | 26.5 ± 2.9 | 33.5 ± 5.2 | 30.4 ± 1.9 | 36.7 ± 4.5 | 0.06 | 0.34 | <0.10 |
| VAT | 19.4 ± 1.9 | 19.0 ± 2.2 | 16.7 ± 1.9 | 23.2 ± 2.5 | 19.9 ± 1.7 | 23.7 ± 2.4 | 0.07 | 0.46 | <0.10 | |
| SAT | 7.9 ± 0.7 a,b | 9.4 ± 0.7 a,b | 10.2 ± 1.1 a,b | 10.3 ± 3.3 a | 10.6 ± 0.8 a,b | 15.0 ± 2.5 b | 0.18 | 0.003 * | 0.25 | |
| PND105 | ||||||||||
| MRI | VAT | 30.1 ± 2.5 a,b | 29.4 ± 3.2 a,b | 27.8 ± 2.3 a,b | 35.0 ± 3.9 a,b | 29.6 ± 3.1 a | 40.8 ± 4.8 b | 0.09 | 0.09 | 0.02 * |
| SAT | 9.4 ± 1.1 | 10.9 ± 1.1 | 11.1 ± 1.3 | 14.6 ± 3.4 | 11.3 ± 0.6 | 15.6 ± 2.5 | <0.10 | 0.32 | 0.70 | |
| Dissection | VAT | 29.0 ± 2.3 a,b | 28.2 ± 3.0 a,b | 26.0 ± 1.9 a,b | 33.3 ± 4.5 a,b | 28.5 ± 3.1 a | 39.4 ± 4.5 b | 0.09 | 0.18 | 0.008 * |
| SAT | 18.6 ± 1.6 | 18.4 ± 1.4 | 17.5 ± 1.0 | 20.0 ± 3.0 | 17.3 ± 1.6 | 22.2 ± 2.5 | 0.37 | 0.54 | 0.24 | |
| Gestation Diet | NP | HP | P | |||||||
|---|---|---|---|---|---|---|---|---|---|---|
| Postweaning Diet | NP (n = 8) | DSS1 (n = 8) | DSS2 (n = 8) | NP (n = 7) | DSS1 (n = 8) | DSS2 (n = 8) | Gestation | Post-weaning | Gestation × postweaning | |
| Triglycerides (mmol/L) | Fasted | 0.81 ± 0.13 | 0.72 ± 0.18 | 0.54 ± 0.06 | 0.71 ± 0.07 | 0.64 ± 0.11 | 0.48 ± 0.09 | 0.64 | 0.03 * | 0.91 |
| fed | 1.14 ± 0.14 | 1.17 ± 0.22 | 1.16 ± 0.22 | 1.81 ± 0.38 | 1.23 ± 0.19 | 1.18 ± 0.19 | 0.30 | 0.34 | 0.19 | |
| Cholesterol (mmol/L) | Fasted | 1.19 ± 0.09 | 1.11 ± 0.09 | 1.19 ± 0.13 | 1.12 ± 0.15 | 0.87 ± 0.04 | 1.09 ± 0.09 | 0.10 | 0.19 | 0.68 |
| fed | 1.74 ± 0.11 | 1.49 ± 0.13 | 1.65 ± 0.09 | 1.82 ± 0.23 | 1.40 ± 0.09 | 1.54 ± 0.10 | 0.67 | 0.04 * | 0.72 | |
| Proteins (g/L) | Fasted | 59.7 ± 1.8 | 58.2 ± 2.6 | 56.8 ± 1.5 | 57.5 ± 3.8 | 53.2 ± 1.6 | 54.7 ± 1.2 | 0.08 | 0.32 | 0.74 |
| fed | 58.5 ± 1.4 a,b | 53.2 ± 3.3 a | 57.3 ± 0.8 a,b | 61.6 ± 1.3 b | 56.1 ± 1.0 a,b | 55.4 ± 1.1 a,b | 0.36 | 0.009 * | 0.27 | |
| Gestation Diet | NP | HP | P | ||||||
|---|---|---|---|---|---|---|---|---|---|
| Postweaning Diet | NP (n = 8) | DSS1 (n = 8) | DSS2 (n = 8) | NP (n = 7) | DSS1 (n = 8) | DSS2 (n = 8) | Gestation | Postweaning | Gestation × Postweaning |
| Gck | 1.00 ± 0.20 | 0.79 ± 0.19 | 0.60 ± 0.10 | 0.91 ± 0.29 | 0.62 ± 0.19 | 0.30 ± 0.06 | 0.20 | 0.02 * | 0.86 |
| Pklr | 1.00 ± 0.13 | 0.90 ± 0.10 | 0.75 ± 0.04 | 0.88 ± 0.09 | 0.71 ± 0.10 | 0.73 ± 0.06 | 0.20 | 0.06 | 0.62 |
| Fas | 1.00 ± 0.24 | 0.95 ± 0.14 | 0.58 ± 0.07 | 1.01 ± 0.17 | 0.77 ± 0.15 | 0.64 ± 0.09 | 0.76 | 0.03 * | 0.69 |
| Acc | 1.00 ± 0.22 | 0.91 ± 0.17 | 0.65 ± 0.10 | 0.73 ± 0.10 | 0.69 ± 0.10 | 0.61 ± 0.08 | 0.16 | 0.17 | 0.66 |
| Scd1 | 1.00 ± 0.25 | 0.88 ± 0.10 | 0.40 ± 0.12 | 0.62 ± 0.13 | 0.75 ± 0.22 | 0.43 ± 0.15 | 0.45 | 0.002 * | 0.62 |
| Screbf1c | 1.00 ± 0.13 | 1.14 ± 0.21 | 0.710 ± 0.18 | 0.96 ± 0.14 | 0.78 ± 0.10 | 0.61 ± 0.09 | 0.29 | 0.009 * | 0.52 |
| Pepck | 1.00 ± 0.12 a | 1.74 ± 0.44 a | 2.26 ± 0.19 a,b | 1.70 ± 0.80 a | 2.29 ± 0.66 a,b | 4.58 ± 0.77 b | 0.09 | <0.0001 * | 0.09 |
© 2019 by the authors. Licensee MDPI, Basel, Switzerland. This article is an open access article distributed under the terms and conditions of the Creative Commons Attribution (CC BY) license (http://creativecommons.org/licenses/by/4.0/).
Share and Cite
Carlin, G.; Chaumontet, C.; Blachier, F.; Barbillon, P.; Darcel, N.; Blais, A.; Delteil, C.; Guillin, F.M.; Blat, S.; Van der Beek, E.M.; et al. Maternal High-Protein Diet during Pregnancy Modifies Rat Offspring Body Weight and Insulin Signalling but Not Macronutrient Preference in Adulthood. Nutrients 2019, 11, 96. https://doi.org/10.3390/nu11010096
Carlin G, Chaumontet C, Blachier F, Barbillon P, Darcel N, Blais A, Delteil C, Guillin FM, Blat S, Van der Beek EM, et al. Maternal High-Protein Diet during Pregnancy Modifies Rat Offspring Body Weight and Insulin Signalling but Not Macronutrient Preference in Adulthood. Nutrients. 2019; 11(1):96. https://doi.org/10.3390/nu11010096
Chicago/Turabian StyleCarlin, Gabrielle, Catherine Chaumontet, François Blachier, Pierre Barbillon, Nicolas Darcel, Anne Blais, Corine Delteil, Florence M. Guillin, Sophie Blat, Eline M. Van der Beek, and et al. 2019. "Maternal High-Protein Diet during Pregnancy Modifies Rat Offspring Body Weight and Insulin Signalling but Not Macronutrient Preference in Adulthood" Nutrients 11, no. 1: 96. https://doi.org/10.3390/nu11010096