Altered Dairy Protein Intake Does Not Alter Circulatory Branched Chain Amino Acids in Healthy Adults: A Randomized Controlled Trial

 , ,
, ,  ,
, 
Abstract
:1. Introduction
2. Materials and Methods
2.1. Subject Selection
2.2. Study Design and Treatments
2.3. Biochemical Analysis
2.4. Statistical Analysis
3. Results
4. Discussion
5. Conclusions
Supplementary Materials
Author Contributions
Funding
Acknowledgments
Conflicts of Interest
References
- WHO/FAO/UNU Expert Consultation. Protein and Amino Acid Requirements in Human Nutrition: Report of a Joint FAO/WHO/UNU Expert Consultation; Technical Report Series 935; World Health Organization: Geneva, Switzerland, 2007; Available online: http://www.who.int/iris/handle/10665/43411 (accessed on 11 July 2017).
- Rodriguez, N.R.; Garlick, P.J. Introduction to Protein Summit 2007: Exploring the impact of high-quality protein on optimal health. Am. J. Clin. Nutr. 2008, 87, 1551S–1553S. [Google Scholar] [CrossRef] [PubMed]
- Wang, E.T.; de Koning, L.; Kanaya, A.M. Higher protein intake is associated with diabetes risk in South Asian Indians: The Metabolic Syndrome and Atherosclerosis in South Asians Living in America (MASALA) study. J. Am. Coll. Nutr. 2010, 29, 130–135. [Google Scholar] [CrossRef] [PubMed]
- Levine, M.E.; Suarez, J.A.; Brandhorst, S.; Balasubramanian, P.; Cheng, C.-W.; Madia, F.; Fontana, L.; Mirisola, M.G.; Guevara-Aguirre, J.; Wan, J.; et al. Low protein intake is associated with a major reduction in IGF-1, cancer, and overall mortality in the 65 and younger but not older population. Cell Metab. 2014, 19, 407–417. [Google Scholar] [CrossRef] [PubMed]
- Sukumar, D.; Ambia-Sobhan, H.; Zurfluh, R.; Schlussel, Y.; Stahl, T.J.; Gordon, C.L.; Shapses, S.A. Areal and volumetric bone mineral density and geometry at two levels of protein intake during caloric restriction: A randomized, controlled trial. J. Bone Miner. Res. 2011, 26, 1339–1348. [Google Scholar] [CrossRef] [PubMed] [Green Version]
- Zhang, S.; Zeng, X.; Ren, M.; Mao, X.; Qiao, S. Novel metabolic and physiological functions of branched chain amino acids: A review. J. Anim. Sci. Biotechnol. 2017, 8, 10. [Google Scholar] [CrossRef] [PubMed]
- Lynch, C.J.; Adams, S.H. Branched-chain amino acids in metabolic signalling and insulin resistance. Nat. Rev. Endocrinol. 2014, 10, 723–736. [Google Scholar] [CrossRef] [PubMed]
- Würtz, P.; Mäkinen, V.-P.; Soininen, P.; Kangas, A.J.; Tukiainen, T.; Kettunen, J.; Savolainen, M.J.; Tammelin, T.; Viikari, J.S.; Rönnemaa, T.; et al. Metabolic signatures of insulin resistance in 7098 young adults. Diabetes 2012, 61, 1372–1380. [Google Scholar] [CrossRef] [PubMed]
- Würtz, P.; Soininen, P.; Kangas, A.J.; Rönnemaa, T.; Lehtimäki, T.; Kähönen, M.; Viikari, J.S.; Raitakari, O.T.; Ala-Korpela, M. Branched-chain and aromatic amino acids are predictors of insulin resistance in young adults. Diabetes Care 2013, 36, 648–655. [Google Scholar] [CrossRef] [PubMed]
- Wang, T.J.; Larson, M.G.; Vasan, R.S.; Cheng, S.; Rhee, E.P.; McCabe, E.; Lewis, G.D.; Fox, C.S.; Jacques, P.F.; Fernandez, C.; et al. Metabolite profiles and the risk of developing diabetes. Nat. Med. 2011, 17, 448–453. [Google Scholar] [CrossRef] [PubMed] [Green Version]
- Yamakado, M.; Nagao, K.; Imaizumi, A.; Tani, M.; Toda, A.; Tanaka, T.; Jinzu, H.; Miyano, H.; Yamamoto, H.; Daimon, T.; et al. Plasma Free Amino Acid Profiles Predict Four-Year Risk of Developing Diabetes, Metabolic Syndrome, Dyslipidemia, and Hypertension in Japanese Population. Sci. Rep. 2015, 5, 11918. [Google Scholar] [CrossRef] [PubMed]
- Guh, D.P.; Zhang, W.; Bansback, N.; Amarsi, Z.; Birmingham, C.L.; Anis, A.H. The incidence of co-morbidities related to obesity and overweight: A systematic review and meta-analysis. BMC Public Health 2009, 9, 1–20. [Google Scholar] [CrossRef] [PubMed]
- Ruiz-Canela, M.; Toledo, E.; Clish, C.B.; Hruby, A.; Liang, L.; Salas-Salvado, J.; Razquin, C.; Corella, D.; Estruch, R.; Ros, E.; et al. Plasma branched-chain amino acids and incident cardiovascular disease in the PREDIMED Trial. Clin. Chem. 2016, 62, 582–592. [Google Scholar] [CrossRef] [PubMed]
- Cole, J.T. Metabolism of BCAAs. In Branched Chain Amino Acids in Clinical Nutrition; Rajkumar, R., Preedy, V.R., Patel, V.B., Eds.; Humana Press: New York, NY, USA, 2015; Volume 1, pp. 13–25. ISBN 978-1-4939-1922-2. [Google Scholar]
- Layman, D.K.; Shiue, H.; Sather, C.; Erickson, D.J.; Baum, J. Increased Dietary Protein Modifies Glucose and Insulin Homeostasis in Adult Women during Weight Loss. J. Nutr. 2003, 133, 405–410. [Google Scholar] [CrossRef] [PubMed] [Green Version]
- López, A.M.; Noriega, L.G.; Diaz, M.; Torres, N.; Tovar, A.R. Plasma branched-chain and aromatic amino acid concentration after ingestion of an urban or rural diet in rural Mexican women. BMC Obes. 2015, 2, 8. [Google Scholar] [CrossRef] [PubMed]
- Rice, B.H.; Quann, E.E.; Miller, G.D. Meeting and exceeding dairy recommendations: Effects of dairy consumption on nutrient intakes and risk of chronic disease. Nutr. Rev. 2013, 71, 209–223. [Google Scholar] [CrossRef] [PubMed]
- Australian Government Department of Health and Ageing, New Zealand Ministry of Health. Nutrient Reference Values for Australia and New Zealand Including Recommended Dietary Intakes; National Health and Medical Research Council, NHMRC: Canberra, Australia, 2006. Available online: https://www.nhmrc.gov.au/guidelines-publications/n35-n36-n37 (accessed on 10 November 2017).
- Pasiakos, S.M.; Agarwal, S.; Lieberman, H.R.; Fulgoni Iii, V.L. Sources and Amounts of Animal, Dairy, and Plant Protein Intake of US Adults in 2007–2010. Nutrients 2015, 7, 7058–7069. [Google Scholar] [CrossRef] [PubMed] [Green Version]
- Fekete, Á.A.; Givens, D.I.; Lovegrove, J.A. Can milk proteins be a useful tool in the management of cardiometabolic health? An updated review of human intervention trials. Proc. Nutr. Soc. 2016, 75, 328–341. [Google Scholar] [CrossRef] [PubMed] [Green Version]
- Layman, D.K.; Boileau, R.A.; Erickson, D.J.; Painter, J.E.; Shiue, H.; Sather, C.; Christou, D.D. A reduced ratio of dietary carbohydrate to protein improves body composition and blood lipid profiles during weight loss in adult women. J. Nutr. 2003, 133, 411–417. [Google Scholar] [CrossRef] [PubMed]
- Benatar, J.R.; Jones, E.; White, H.; Stewart, R.A.H. A randomized trial evaluating the effects of change in dairy food consumption on cardio-metabolic risk factors. Eur. J. Prev. Cardiol. 2014, 21, 1376–1386. [Google Scholar] [CrossRef] [PubMed]
- Benatar, J.R.; Stewart, R.A.H. The effects of changing dairy intake on trans and saturated fatty acid levels—Results from a randomized controlled study. Nutr. J. 2014, 13, 1–10. [Google Scholar] [CrossRef] [PubMed]
- International Society for the Advancement of Kinanthropometry. International Standards for Anthropometric Assessment; ISAK: Underdale, Australia, 2001; Available online: http://www.ceap.br/material/MAT17032011184632.pdf (accessed on 15 November 2017).
- National Cancer Institute. Diet History Questionnaire II and Canadian Diet History Questionnaire II (C-DHQII). 2010. Available online: https://epi.grants.cancer.gov/dhq2/ (accessed on 13 November 2017).
- Food Standards Australia New Zealand. Nutrient Tables for Use in Australia: NUTTAB 2010—Online Searchable Database; FSANZ: Canberra, Australia, 2015. Available online: http://www.foodstandards.gov.au/science/monitoringnutrients/nutrientables/nuttab/Pages/default.aspx (accessed on 20 November 2017).
- Gebhardt, S.E.; Thomas, R.G. Nutritive Value of Foods; U.S. Department of Agriculture, Agricultural Research Service: Beltsville, MD, USA, 2002. Available online: https://www.ars.usda.gov/is/np/NutritiveValueofFoods/NutritiveValueofFoods.pdf (accessed on 14 November 2017).
- Brevik, A.; Veierød, M.B.; Drevon, C.A.; Andersen, L.F. Evaluation of the odd fatty acids 15:0 and 17:0 in serum and adipose tissue as markers of intake of milk and dairy fat. Eur. J. Clin. Nutr. 2005, 59, 1417–1422. [Google Scholar] [CrossRef] [PubMed] [Green Version]
- Matthews, D.R.; Hosker, J.P.; Rudenski, A.S.; Naylor, B.A.; Treacher, D.F.; Turner, R.C. Homeostasis model assessment: Insulin resistance and β-cell function from fasting plasma glucose and insulin concentrations in man. Diabetologia 1985, 28, 412–419. [Google Scholar] [CrossRef] [PubMed]
- Milan, A.M.; D’Souza, R.F.; Pundir, S.; Pileggi, C.A.; Barnett, M.P.G.; Markworth, J.F.; Cameron-Smith, D.; Mitchell, C. Older adults have delayed amino acid absorption after a high protein mixed breakfast meal. J. Nutr. Health Aging 2015, 19, 839–845. [Google Scholar] [CrossRef] [PubMed]
- McGregor, R.A.; Poppitt, S.D.; Gleeson, B.; Beelen, M.; Meijer, K.; Savelberg, H. Milk protein for improved metabolic health: A review of the evidence. Nutr. Metab. (Lond.) 2013, 10, 46. [Google Scholar] [CrossRef] [PubMed]
- Newgard, C.B.; An, J.; Bain, J.R.; Muehlbauer, M.J.; Stevens, R.D.; Lien, L.F.; Haqq, A.M.; Shah, S.H.; Arlotto, M.; Slentz, C.A.; et al. A branched-chain amino acid-related metabolic signature that differentiates obese and lean humans and contributes to insulin resistance. Cell Metab. 2009, 9, 311–326. [Google Scholar] [CrossRef] [PubMed]
- Nagao, K.; Yamakado, M. The role of amino acid profiles in diabetes risk assessment. Curr. Opin. Clin. Nutr. Metab. Care 2016, 19, 328–335. [Google Scholar] [CrossRef] [PubMed]
- Sun, L.; Tan, K.W.J.; Siow, P.C.; Henry, C.J. Soya milk exerts different effects on plasma amino acid responses and incretin hormone secretion compared with cows’ milk in healthy, young men. Br. J. Nutr. 2016, 116, 1216–1221. [Google Scholar] [CrossRef] [PubMed]
- Dangin, M.; Boirie, Y.; Garcia-rodenas, C.; Gachon, P.; Fauquant, J.; Callier, P.; Ball Vre, O.; Beaufr, B.R.; Garcia-Rodenas, C. The digestion rate of protein is an independent regulating factor of postprandial protein retention. Am. J. Physiol. Endocrinol. Metab. 2001, 280, E340–E348. [Google Scholar] [CrossRef] [PubMed]
- Hoppe, C.; Mølgaard, C.; Vaag, A.; Barkholt, V.; Michaelsen, K.F. High intakes of milk, but not meat, increase s-insulin and insulin resistance in 8-year-old boys. Eur. J. Clin. Nutr. 2005, 59, 393–398. [Google Scholar] [CrossRef] [PubMed]
- Piccolo, B.D.; Comerford, K.B.; Karakas, S.E.; Knotts, T.A.; Fiehn, O.; Adams, S.H. Whey protein supplementation does not alter plasma branched-chained amino acid profiles but results in unique metabolomics patterns in obese women enrolled in an 8-week weight loss trial. J. Nutr. 2015, 145, 691–700. [Google Scholar] [CrossRef] [PubMed]
- Gannon, N.P.; Schnuck, J.K.; Vaughan, R.A. BCAA Metabolism and Insulin Sensitivity—Dysregulated by Metabolic Status? Mol. Nutr. Food Res. 2018, 1700756. [Google Scholar] [CrossRef] [PubMed]
- Michèle Boulet, M.; Chevrier, G.; Grenier-Larouche, T.; Pelletier, M.; Nadeau, M.; Scarpa, J.; Prehn, C.; Marette, A.; Adamski, J.; Tchernof, A. Alterations of plasma metabolite profiles related to adipose tissue distribution and cardiometabolic risk. Am. J. Physiol. Endocrinol. Metab. 2015, 309, 736–746. [Google Scholar] [CrossRef] [PubMed]
- Haufe, S.; Witt, H.; Engeli, S.; Kaminski, J.; Utz, W.; Fuhrmann, J.C.; Rein, D.; Schulz-Menger, J.; Luft, F.C.; Boschmann, M.; et al. Branched-chain and aromatic amino acids, insulin resistance and liver specific ectopic fat storage in overweight to obese subjects. Nutr. Metab. Cardiovasc. Dis. 2016, 26, 637–642. [Google Scholar] [CrossRef] [PubMed]
- Jennings, A.; MacGregor, A.; Pallister, T.; Spector, T.; Cassidy, A. Associations between branched chain amino acid intake and biomarkers of adiposity and cardiometabolic health independent of genetic factors: A twin study. Int. J. Cardiol. 2016, 223, 992–998. [Google Scholar] [CrossRef] [PubMed]
- Greco, E.; Andrew, W.; Lee, T.J.; Collins, S.; Lebovic, Z.; Zerbe-Kessinger, T.; Alireza, J.M. The role of source of protein in regulation of food intake, satiety, body weight and body composition. J. Nutr. Health Food Eng. 2017, 6. [Google Scholar] [CrossRef]
- Jahan-Mihan, A.; Luhovyy, B.L.; El Khoury, D.; Anderson, G.H. Dietary proteins as determinants of metabolic and physiologic functions of the gastrointestinal tract. Nutrients 2011, 3, 574–603. [Google Scholar] [CrossRef] [PubMed]
- Madsen, L.; Myrmel, L.S.; Fjære, E.; Liaset, B.; Kristiansen, K. Links between dietary protein sources, the gut microbiota, and obesity. Front. Physiol. 2017, 8, 1047. [Google Scholar] [CrossRef] [PubMed]
- Schmidt, J.A.; Rinaldi, S.; Scalbert, A.; Ferrari, P.; Achaintre, D.; Gunter, M.J.; Appleby, P.N.; Key, T.J.; Travis, R.C. Plasma concentrations and intakes of amino acids in male meat-eaters, fish-eaters, vegetarians and vegans: A cross-sectional analysis in the EPIC-Oxford cohort. Eur. J. Clin. Nutr. 2016, 70, 306–312. [Google Scholar] [CrossRef] [PubMed]
- Kristal, A.R.; Peters, U.; Potter, J.D. Is it time to abandon the food frequency questionnaire? Cancer Epidemiol. Biomark. Prev. 2005, 14, 2826–2828. [Google Scholar] [CrossRef] [PubMed]

 : Reduced,
  : Maintained, and
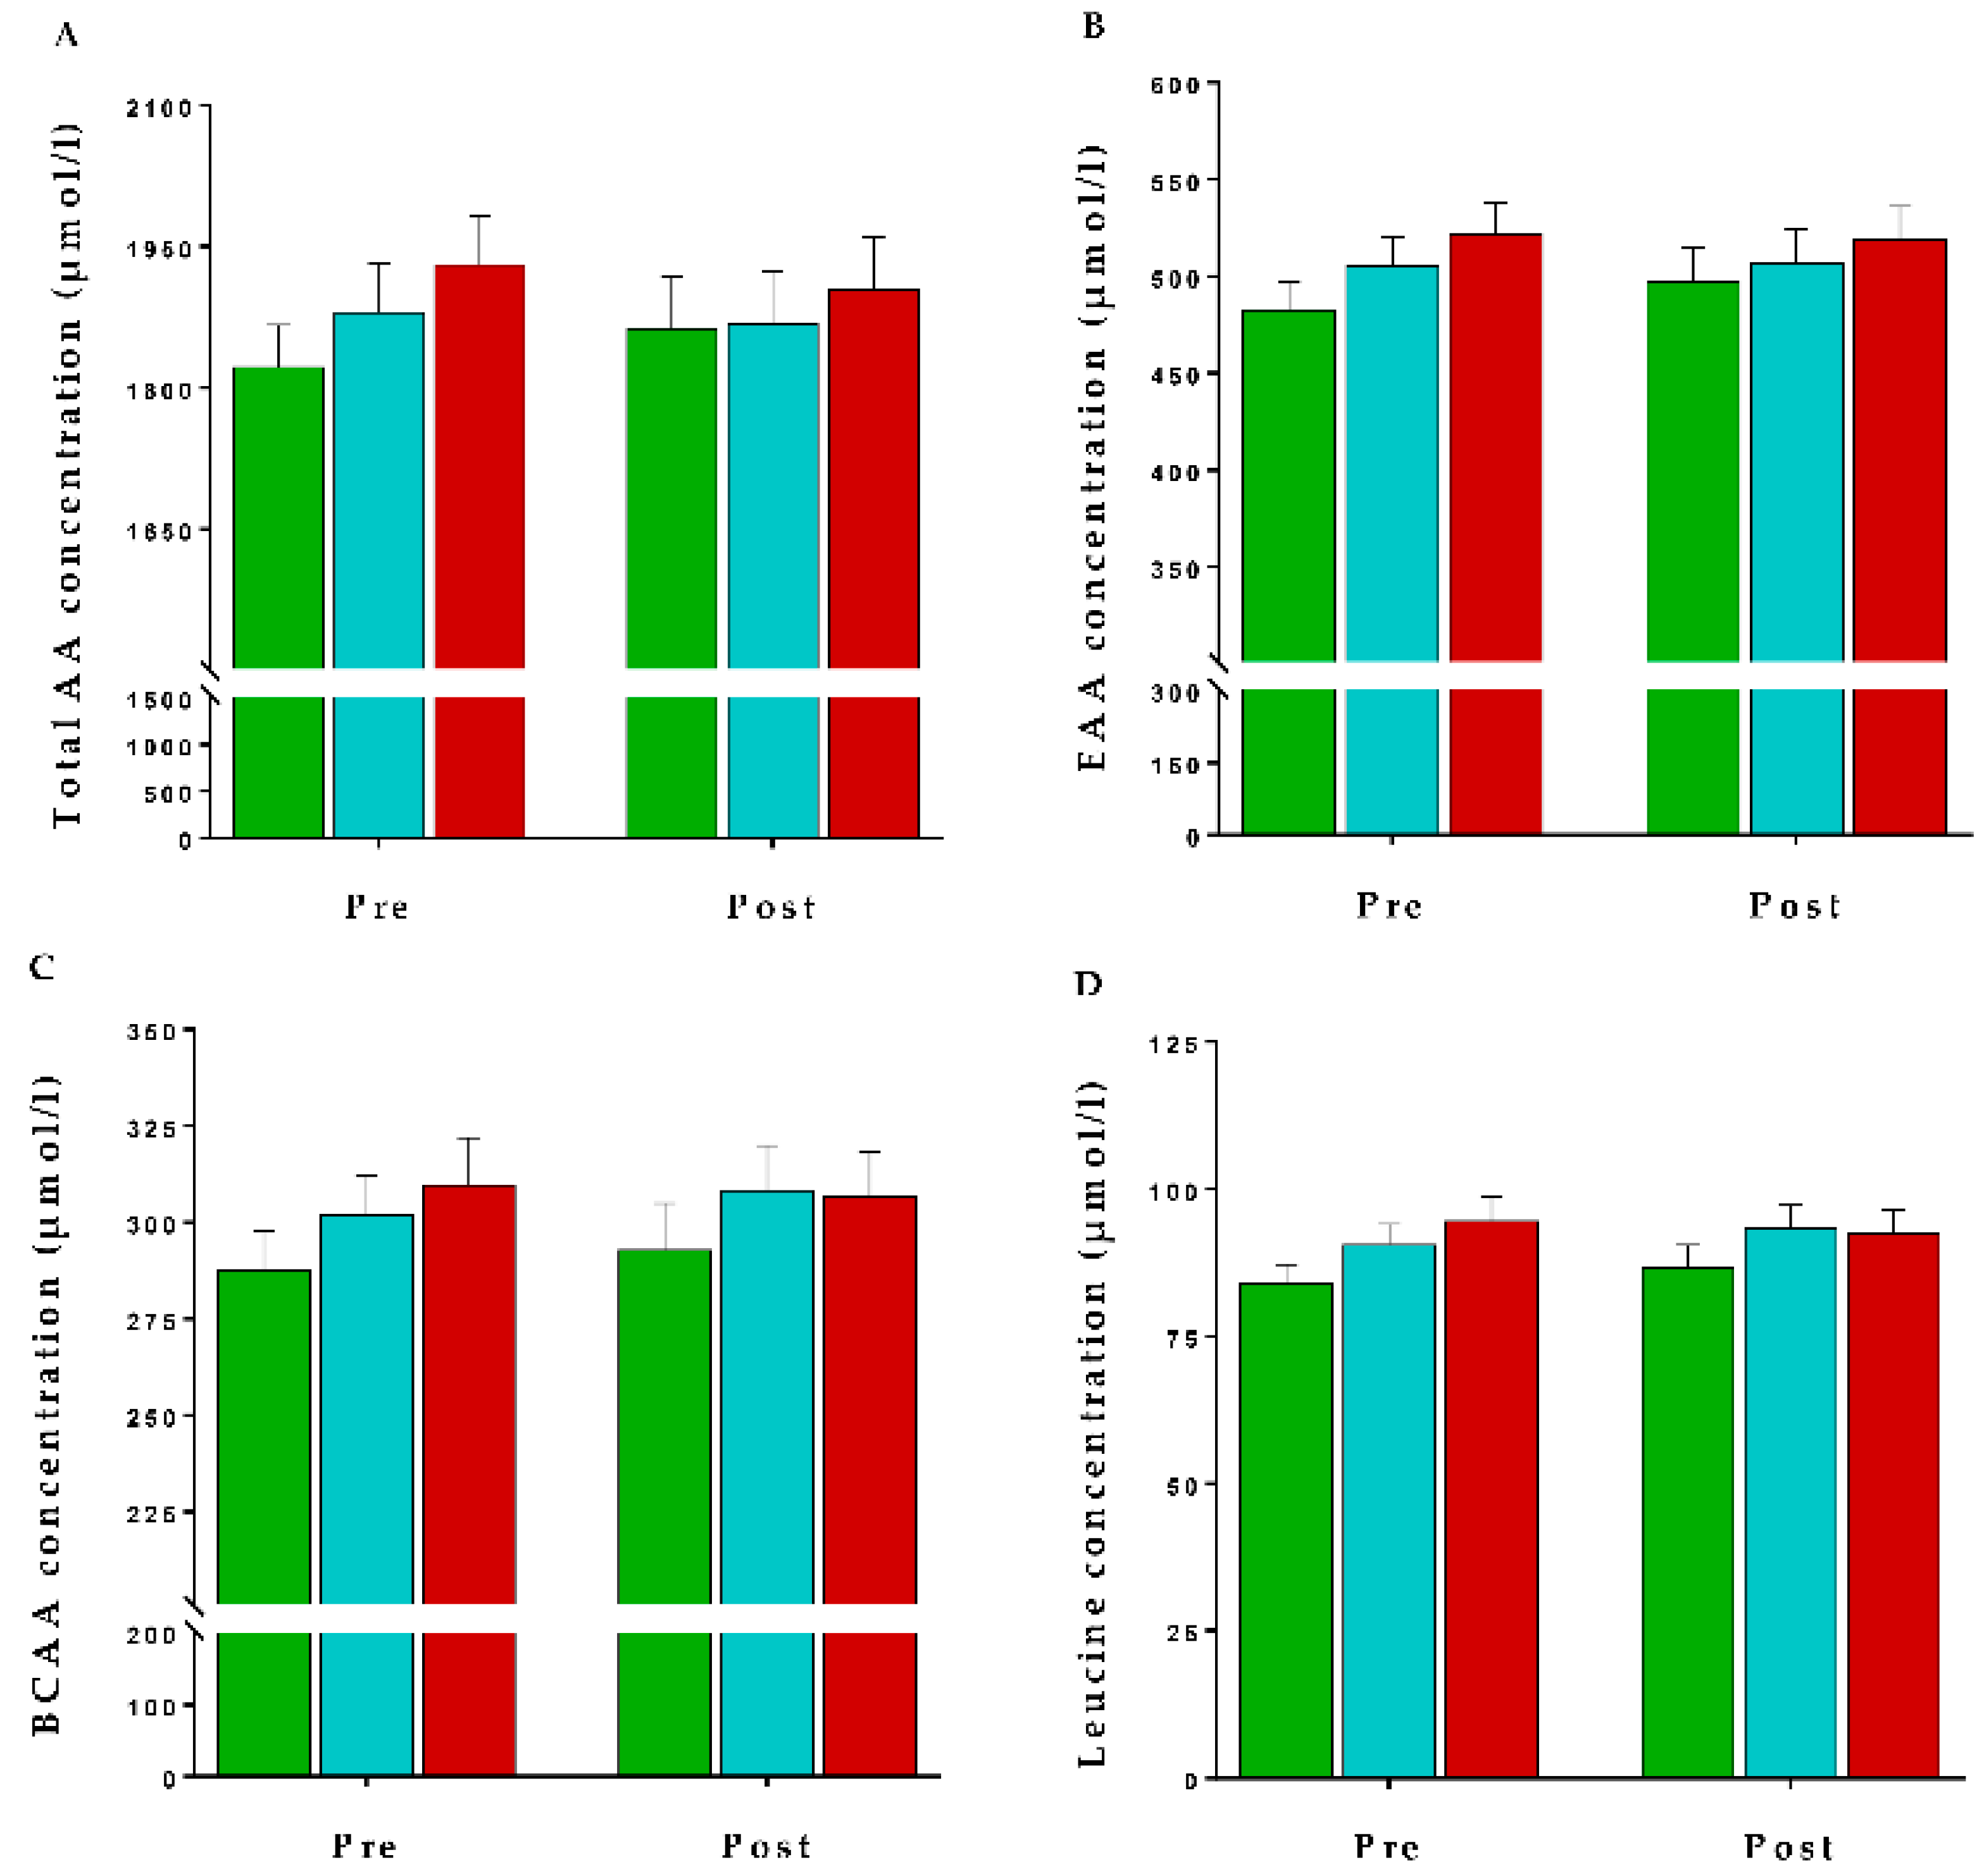
  : Increased) across the intervention period. Values are presented as mean ± SEM of (A) total amino acids (TAA), (B) essential amino acids (EAA), (C) branched chain amino acids (BCAA) and (D) leucine concentrations (µmol/L). Comparisons between dairy intake groups and interactions (time x dietary intervention group) analyzed by two-factor repeated-measures ANOVA. None of the changes were significant (p > 0.05).
: Reduced, : Maintained, and : Increased) across the intervention period. Values are presented as mean ± SEM of (A) total amino acids (TAA), (B) essential amino acids (EAA), (C) branched chain amino acids (BCAA) and (D) leucine concentrations (µmol/L). Comparisons between dairy intake groups and interactions (time x dietary intervention group) analyzed by two-factor repeated-measures ANOVA. None of the changes were significant (p > 0.05).
: Increased) across the intervention period. Values are presented as mean ± SEM of (A) total amino acids (TAA), (B) essential amino acids (EAA), (C) branched chain amino acids (BCAA) and (D) leucine concentrations (µmol/L). Comparisons between dairy intake groups and interactions (time x dietary intervention group) analyzed by two-factor repeated-measures ANOVA. None of the changes were significant (p > 0.05).
: Reduced, : Maintained, and : Increased) across the intervention period. Values are presented as mean ± SEM of (A) total amino acids (TAA), (B) essential amino acids (EAA), (C) branched chain amino acids (BCAA) and (D) leucine concentrations (µmol/L). Comparisons between dairy intake groups and interactions (time x dietary intervention group) analyzed by two-factor repeated-measures ANOVA. None of the changes were significant (p > 0.05).


| Reduced Dairy Intake | Maintained Dairy Intake | Increased Dairy Intake | |
|---|---|---|---|
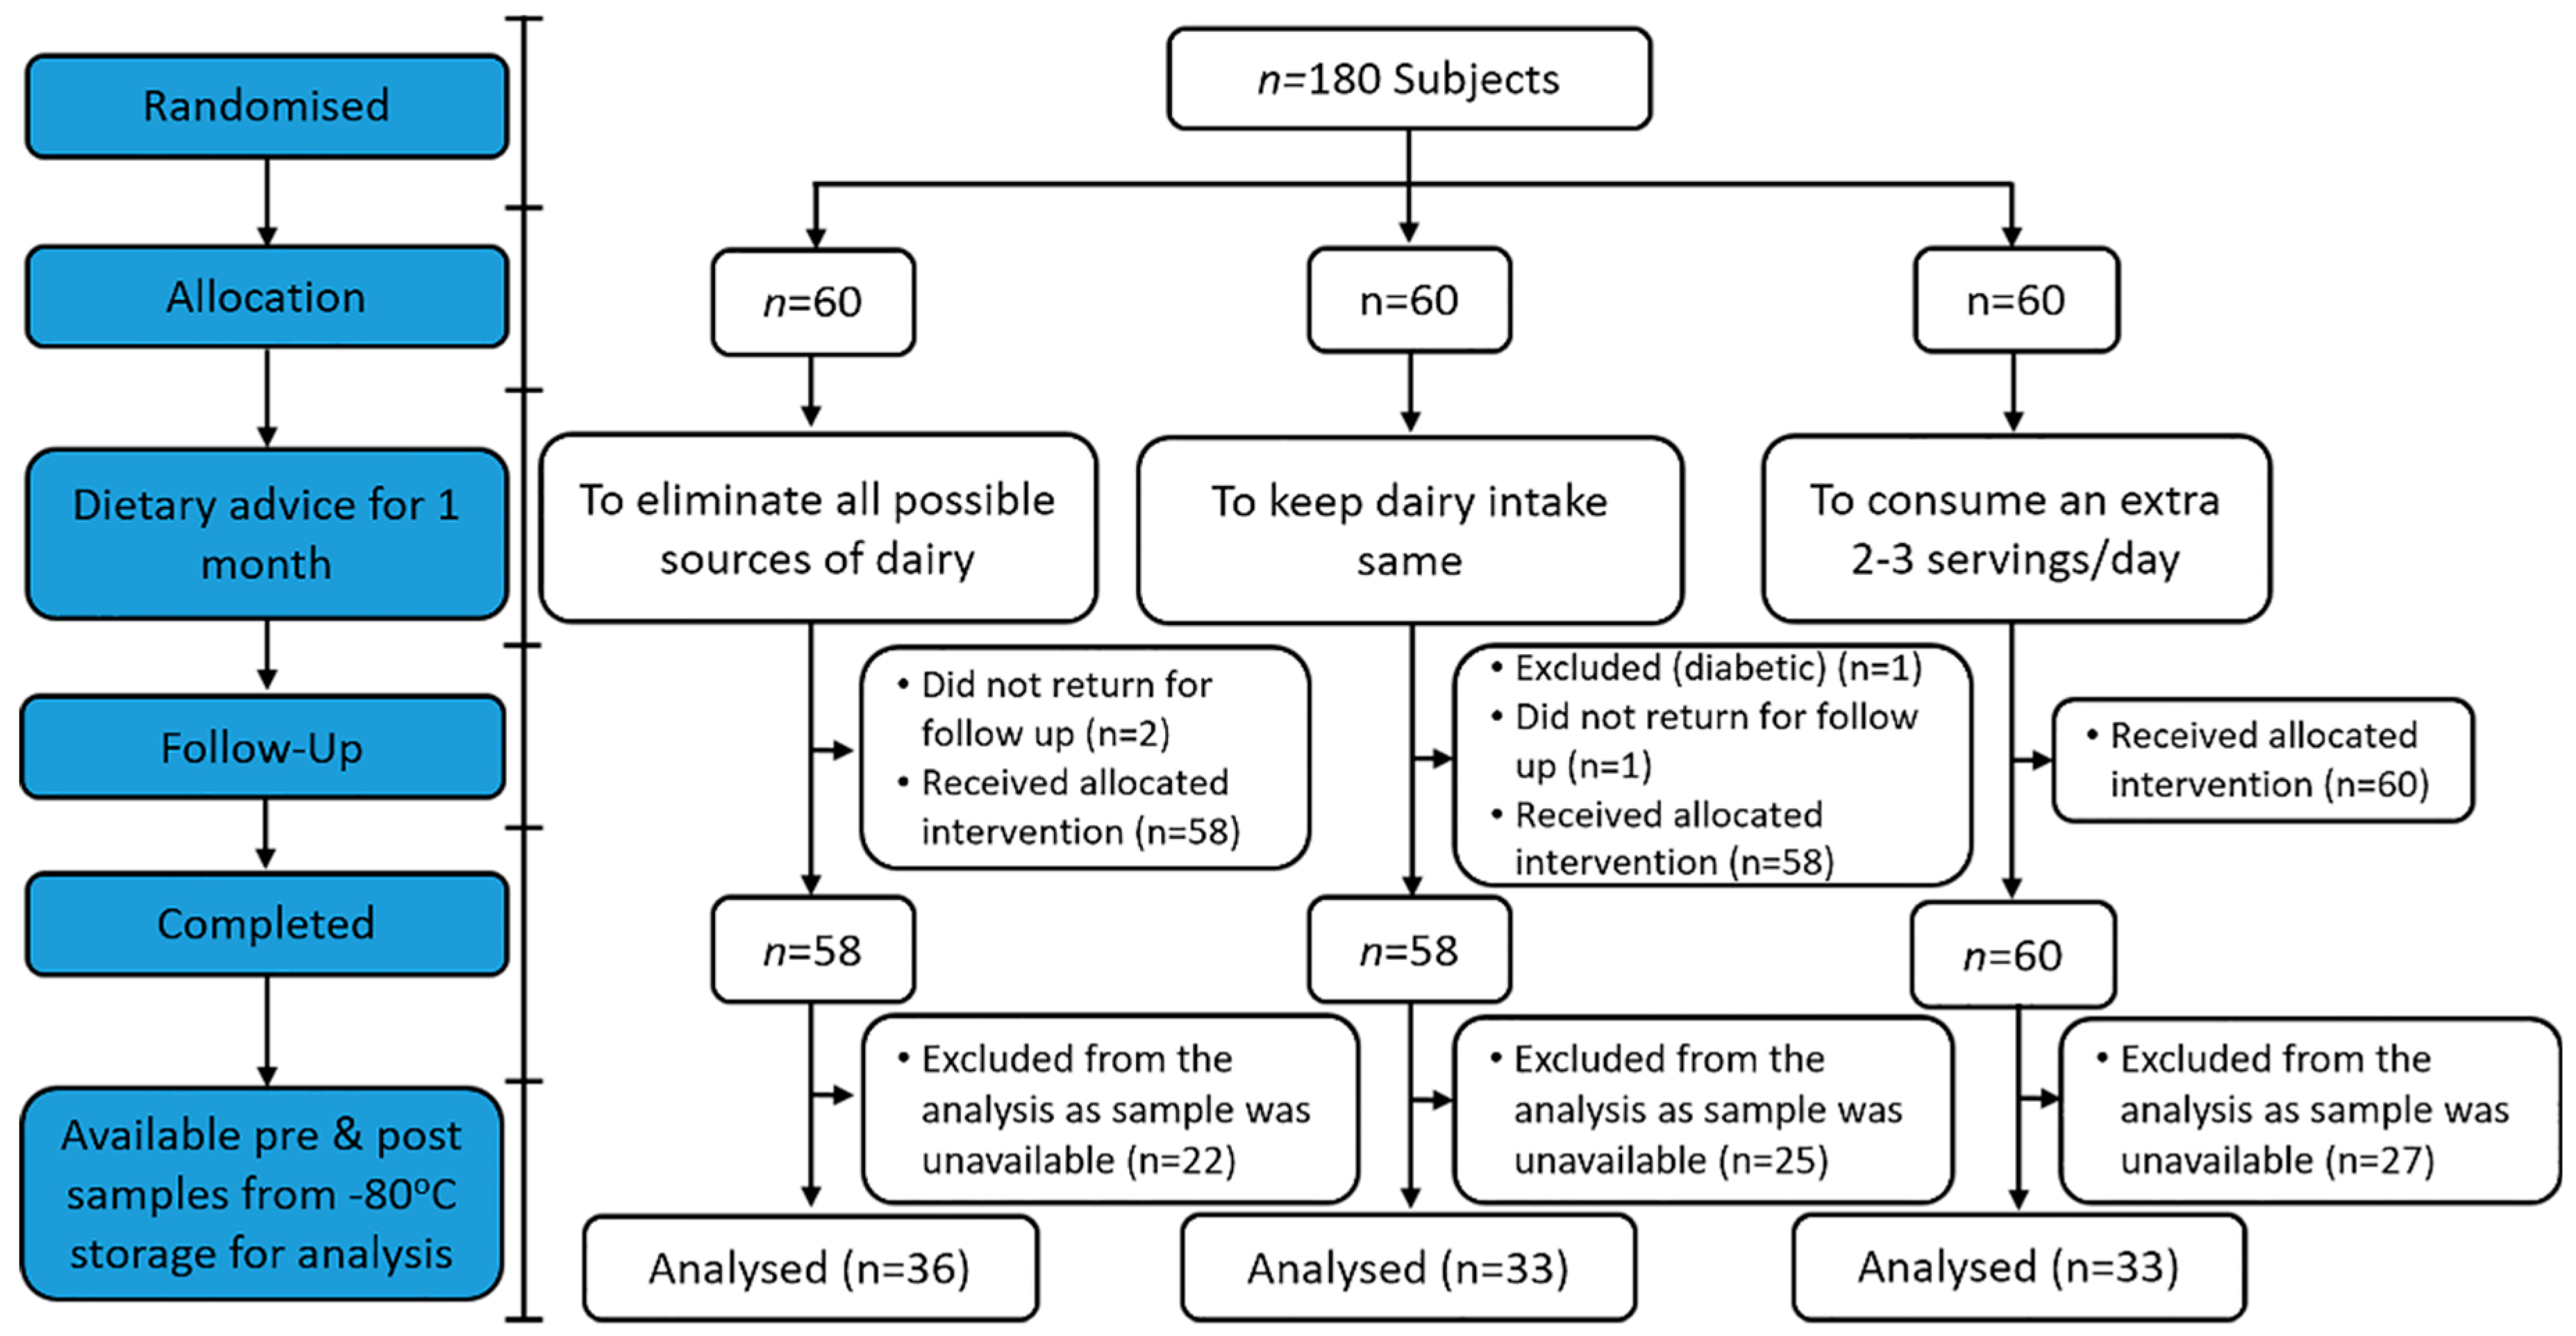
| N | 36 | 33 | 33 |
| Female (%) | 75 | 72 | 64 |
| Age (Years) | 47 ± 2 | 46 ± 2 | 47 ± 2 |
| Systolic Blood Pressure (mmHg) | 116 ± 2 | 115 ± 2 | 114 ± 3 |
| Diastolic Blood Pressure (mmHg) | 70 ± 2 | 70 ± 2 | 72 ± 2 |
| BMI | 24.4 ± 0.9 | 23.3 ± 0.9 | 25.5 ± 0.9 |
| TC (mmol/L) | 5.43 ± 0.17 | 5.24 ± 0.17 | 5.18 ± 0.17 |
| HDL (mmol/L) | 1.79 ± 0.08 | 1.71 ± 0.09 | 1.69 ± 0.09 |
| LDL (mmol/L) | 3.08 ± 0.15 | 3.04 ± 0.16 | 2.98 ± 0.16 |
| TG (mmol/L) | 1.09 ± 0.13 | 1.11 ± 0.13 | 1.12 ± 0.13 |
| Glucose (mmol/L) | 5.34 ± 0.08 | 5.29 ± 0.08 | 5.32 ± 0.09 |
| Insulin (mU/L) | 5.7 ± 0.8 | 5.9 ± 0.7 | 6.6 ± 0.8 |
| Reduced Dairy Intake | Maintained Dairy Intake | Increased Dairy Intake | p-Value | |
|---|---|---|---|---|
| Dairy intake (servings/day) | ||||
| Baseline | 3.0 ± 0.4 | 2.6 ± 0.3 | 2.1 ± 0.2 | 0.218 a |
| Post intervention | 1.2 ± 0.4 † | 2.1 ± 0.2 | 4.4 ± 0.8 *† | <0.001 b |
| Change | −1.6 ± 0.4 | −0.5 ± 0.2 | +2.3 ± 0.8 # | <0.001 c |
| Dairy protein intake (g/day) | ||||
| Baseline | 24.6 ± 3.3 | 22.0 ± 2.3 | 18.0 ± 1.9 | 0.208 a |
| Post intervention | 9.9 ± 3.1 † | 18.0 ± 1.9 | 31.8 ± 3.9 *† | <0.001 b |
| Change | −14.6 ± 3.0 ф | −4.0 ± 2.0 | +13.8 ± 4.1 # | <0.001 c |
| Reduced Dairy Intake | Maintained Dairy Intake | Increased Dairy Intake | p-Value | |
|---|---|---|---|---|
| Insulin Resistance (HOMA-IR) | ||||
| Baseline | 1.36 ± 0.14 | 1.41 ± 0.18 | 1.57 ± 0.21 | 0.734 a |
| Post intervention | 1.38 ± 0.14 | 1.62 ± 0.16 | 1.58 ± 0.18 | 0.390 b |
| Change | −0.14 ± 0.10 | +0.17 ± 0.14 | −0.02 ± 0.22 | 0.398 c |
© 2018 by the authors. Licensee MDPI, Basel, Switzerland. This article is an open access article distributed under the terms and conditions of the Creative Commons Attribution (CC BY) license (http://creativecommons.org/licenses/by/4.0/).
Share and Cite
Prodhan, U.K.; Milan, A.M.; Thorstensen, E.B.; Barnett, M.P.G.; Stewart, R.A.H.; Benatar, J.R.; Cameron-Smith, D. Altered Dairy Protein Intake Does Not Alter Circulatory Branched Chain Amino Acids in Healthy Adults: A Randomized Controlled Trial. Nutrients 2018, 10, 1510. https://doi.org/10.3390/nu10101510
Prodhan UK, Milan AM, Thorstensen EB, Barnett MPG, Stewart RAH, Benatar JR, Cameron-Smith D. Altered Dairy Protein Intake Does Not Alter Circulatory Branched Chain Amino Acids in Healthy Adults: A Randomized Controlled Trial. Nutrients. 2018; 10(10):1510. https://doi.org/10.3390/nu10101510
Chicago/Turabian StyleProdhan, Utpal K., Amber M. Milan, Eric B. Thorstensen, Matthew P. G. Barnett, Ralph A. H. Stewart, Jocelyn R. Benatar, and David Cameron-Smith. 2018. "Altered Dairy Protein Intake Does Not Alter Circulatory Branched Chain Amino Acids in Healthy Adults: A Randomized Controlled Trial" Nutrients 10, no. 10: 1510. https://doi.org/10.3390/nu10101510