Article

Thermal Calcination-Based Production of SnO2 Nanopowder: An Analysis of SnO2 Nanoparticle Characteristics and Antibacterial Activities

by
Naif Mohammed Al-Hada
1,*,
Halimah Mohamed Kamari
1,*,
Anwar Ali Baqer
1,2,
Abdul H. Shaari
1,3 and
Elias Saion
1
1
Department of Physics, Faculty of Science, Universiti Putra Malaysia, Serdang 43400, Selangor, Malaysia
2
Department of Physics, Faculty of Science for Women, University of Baghdad, Baghdad 10071, Iraq
3
Iinstitute for Mathematical Research (INSPEM), Universiti Putra Malaysia, Serdang 43400, Selangor, Malaysia
*
Authors to whom correspondence should be addressed.
Nanomaterials 2018, 8(4), 250; https://doi.org/10.3390/nano8040250
Submission received: 19 March 2018 / Revised: 5 April 2018 / Accepted: 10 April 2018 / Published: 17 April 2018

Abstract

:
SnO2 nanoparticle production using thermal treatment with tin(II) chloride dihydrate and polyvinylpyrrolidone capping agent precursor materials for calcination was investigated. Samples were analyzed using X-ray diffraction (XRD), Scanning Electron Microscopy (SEM), energy dispersive X-ray (EDX), transmission electron microscopy (TEM), Fourier Transform Infrared Spectroscopy (FT-IR), X-ray photoelectron spectroscopy (XPS), diffuse UV-vis reflectance spectra, photoluminescence (PL) spectra and the electron spin resonance (ESR). XRD analysis found tetragonal crystalline structures in the SnO2 nanoparticles generated through calcination. EDX and FT-IR spectroscopy phase analysis verified the derivation of the Sn and O in the SnO2 nanoparticle samples from the precursor materials. An average nanoparticle size of 4–15.5 nm was achieved by increasing calcination temperature from 500 °C to 800 °C, as confirmed through TEM. The valence state and surface composition of the resulting nanoparticle were analyzed using XPS. Diffuse UV-vis reflectance spectra were used to evaluate the optical energy gap using the Kubelka-Munk equation. Greater calcination temperature resulted in the energy band gap falling from 3.90 eV to 3.64 eV. PL spectra indicated a positive relationship between particle size and photoluminescence. Magnetic features were investigated through ESR, which revealed the presence of unpaired electrons. The magnetic field resonance decreases along with an increase of the g-factor value as the calcination temperature increased from 500 °C to 800 °C. Finally, Escherichia coli ATCC 25922 Gram (–ve) and Bacillus subtilis UPMC 1175 Gram (+ve) were used for in vitro evaluation of the tin oxide nanoparticle’s antibacterial activity. This work indicated that the zone of inhibition of 22 mm has good antibacterial activity toward the Gram-positive B. subtilis UPMC 1175.

1. Introduction

Nanoscience is playing a major role in the research and development of devices, nanoplatforms, systems and structures across numerous areas [1,2,3], with an increasing number of studies exploring the utilization of functionalized, biodegradable and biocompatible nonmaterial [3,4]. Due to its specific attributes, tin oxide (SnO2) has been applied as a semiconductor nanomaterial in several different studies. Tin oxide (or cassiterite) is classified as a II–VI composite semiconductor on account of its Groups II and VI Periodic Table components, with 3.60 eV and 3.75 eV direct and indirect energy band gaps [5,6,7,8,9]. The structural attributes of nanoparticles provide numerous benefits across a great number of applications [10,11,12], with a unique tetragonal crystalline structure and metal n-type oxide demonstrating 3.8 eV and 4.1 eV direct and indirect energy band gaps [13].
Given the above points, SnO2 nanomaterials can be used with positive effect in a range of applications [14,15,16], with the pellucidity shown in the observable solar spectrum having been utilized in optoelectronic devices such as solar photovoltaics [17,18,19]. Other attributes of the SnO2 nanostructure have been utilized for diodes, gas sensors, catalysis, antibacterial activities, and biomedical purposes [12,20,21,22,23,24,25,26,27].
SnO2 nanostructure preparation can be achieved using several different techniques. These include the co-precipitation [26], sol-gel [28,29], solvothermal decomposition [30,31], microwave hydrothermal synthesis [32,33] and precipitation [34], techniques, as well as hydrothermal synthesis [35,36], and the polyol [37], solvothermal [38], and by microwave [39,40,41] methods. However, issues related to the complexity of the synthetic process, including the creation of effluent by-product, reagent toxicity, and longer reaction times, have made industrial SnO2 nanopowder generation difficult to achieve, with the creation of a pure powder product having been entirely unachievable through the aforementioned techniques [42]. A deep literature on the currently investigated research topic has been reviewed. There has been no published research study to come up with such a thermal treatment of SnO2 nanoparticles related tandem analysis of antibacterial activity.
The novelty of the present method is to introduce several benefits e.g., flexible, easy to handle and permits reproducible quality. It enables the production of nanoparticles with the desired properties because it can regulate particle size with high purity nanoparticles. In addition, it makes a limited use of chemicals with non-toxic effluences into the drainage system and therefore it does not cause damage to the environment [43,44,45,46,47,48,49,50,51]. Furthermore, it has the potential product to be employed on a large scale in industrial and biological applications. This study addresses the gap in the literature by using basic thermal treatment techniques to produce an SnO2 nanopowder without waste production, which has environmental advantages [52,53].
This paper discusses and explores the use of a novel thermal technique, wherein a precursor chloride metallic ion is used with a polyvinylpyrrolidone (PVP) capping agent before calcination for SnO2 nanoparticle synthesis and the production of a pure nanopowder. This study also analyzes the impact of temperature changes on the SnO2 nanopowder’s morphological, structural, and optical characteristics. The structure of the resulting product is investigated using various analyses, with antimicrobial activity also analyzed.

2. Materials and Methods

2.1. Materials

No additional purification treatment was applied to any of the materials prior to the experiment, with all materials being standard research-grade chemicals provided by Sigma-Aldrich, St. Louis, MO, USA. The specific materials included tin(II) chloride dihydrate SnCl2·2H2O (MW = 225.65 g/mol), 0.1 HCl, polyvinylpyrrolidone (PVP) (C6H9NO)n (Mw = 58,000 g/mol), and deionized water.

2.2. Methodology

The initial solutions were created with 4 g of PVP in 100 mL of deionized water, with the solutions then incubated at 70 °C while being vigorously stirred for 2 h. At the 2 h mark, 0.2 mmol of tin(II) chloride dihydrate was introduced and mixed into the solution. The resulting solutions were poured using a glass plate before being placed in the oven at a temperature of 80 °C for 24 h. The dried solution was then ground into a powder using a pestle and mortar for 30 min. Calcination at various temperatures was then conducted in a box furnace over the course of 3 h, producing the tin oxide nanoparticles for analysis.

2.3. Analysis of Nanoparticle Characteristics

Several methods were used to characterize the tin oxide nanoparticles’ morphological, structural, and optical attributes. For structural characterization, X-ray diffractometer (XRD Shimadzu 6000, Lelyweg1, Almelo, The Netherlands) was used with Cu Kα radiation at a 0.154 nm wavelength at the 2θ range of 4° and 80°. Fourier-transform infrared (FT-IR) spectroscopy analysis was also performed at the 280–4000 cm−1 range. An accelerated voltage of 200 kV was used to obtain transmission electron microscopy (TEM) images, with an energy-dispersive X-ray (EDX) spectrometer (7533, Oxford Instruments, Oxford, UK) used to conduct EDX spectroscopy. The X-ray source was obtained using monochromatic Al-Kα (hv = 1486.6 eV) at 25.6 W with a 100 µm beam diameter for X-ray photoelectron spectroscopy (XPS) (ULVAC-PHI Quantera II, Ulvac-PHI, Inc., Tokyo, Japan). Additionally, wide scan analysis was conducted with a pass energy of 280 eV with 1 eV for each step, with narrow scan/chemical states analysis carried out with a pass energy of 112 eV with 0.1 eV for each step. Modification of binding energies C–C and C–H to 284.8 eV was performed to correct the charge at C 1s before deconvolution. The optical attributes of the nanoparticle were analyzed using a UV-vis spectrophotometer (Shimadzu UV-3600, Kyoto, Japan) at a 200–800 nm wavelength at room temperature. Photoluminescence (PL) was analyzed using Perkin Elmer spectrofluorometer LS-55, Waltham, MA, USA with a Xenon lamp at room temperature. Finally, analysis of colony-forming units was conducted using an agar plate after incubation to assess the antimicrobial activity of the SnO2 nanoparticle.

2.4. Examination of Antibacterial Activity

An in vitro antimicrobial analysis was performed using the disc diffusion technique to explore the antibiotic capabilities of the SnO2 nanoparticles in the event of bacterial attack. This allows for a comparison of the resistance to antimicrobial compounds. The prepared nanoparticles were also tested with Escherichia coli ATCC 25922 Gram (−ve) and Bacillus subtilis UPMC 1175 Gram (+ve). Here, a paper disc with a 6 mm diameter was suspended in 100 mg of each nanoparticle with 10 mL of deionized water before being subjected to incubation for drying. Microbe growth was then permitted by placing papers onto plates, with a 108-cell standardized microbe culture in accordance with the 0.5 McFarland standard. The plates were subject to 30–37 °C inversion, with a 48-h incubation period to encourage bacteria growth. Following incubation, the plates were analyzed with inhibition zone diameters recorded (mm). Each test went through three iterations with the average value taken as the result. Muller Hinton agar media has been used as nutrient, Streptomycin (100 mg/mL) standard and distilled water have been used for each bacterium as a positive and as negative controls, respectively. In addition, the antibacterial test for bulk tin oxide has been compared with prepared tin oxide nanoparticles.

3. Results and Discussion

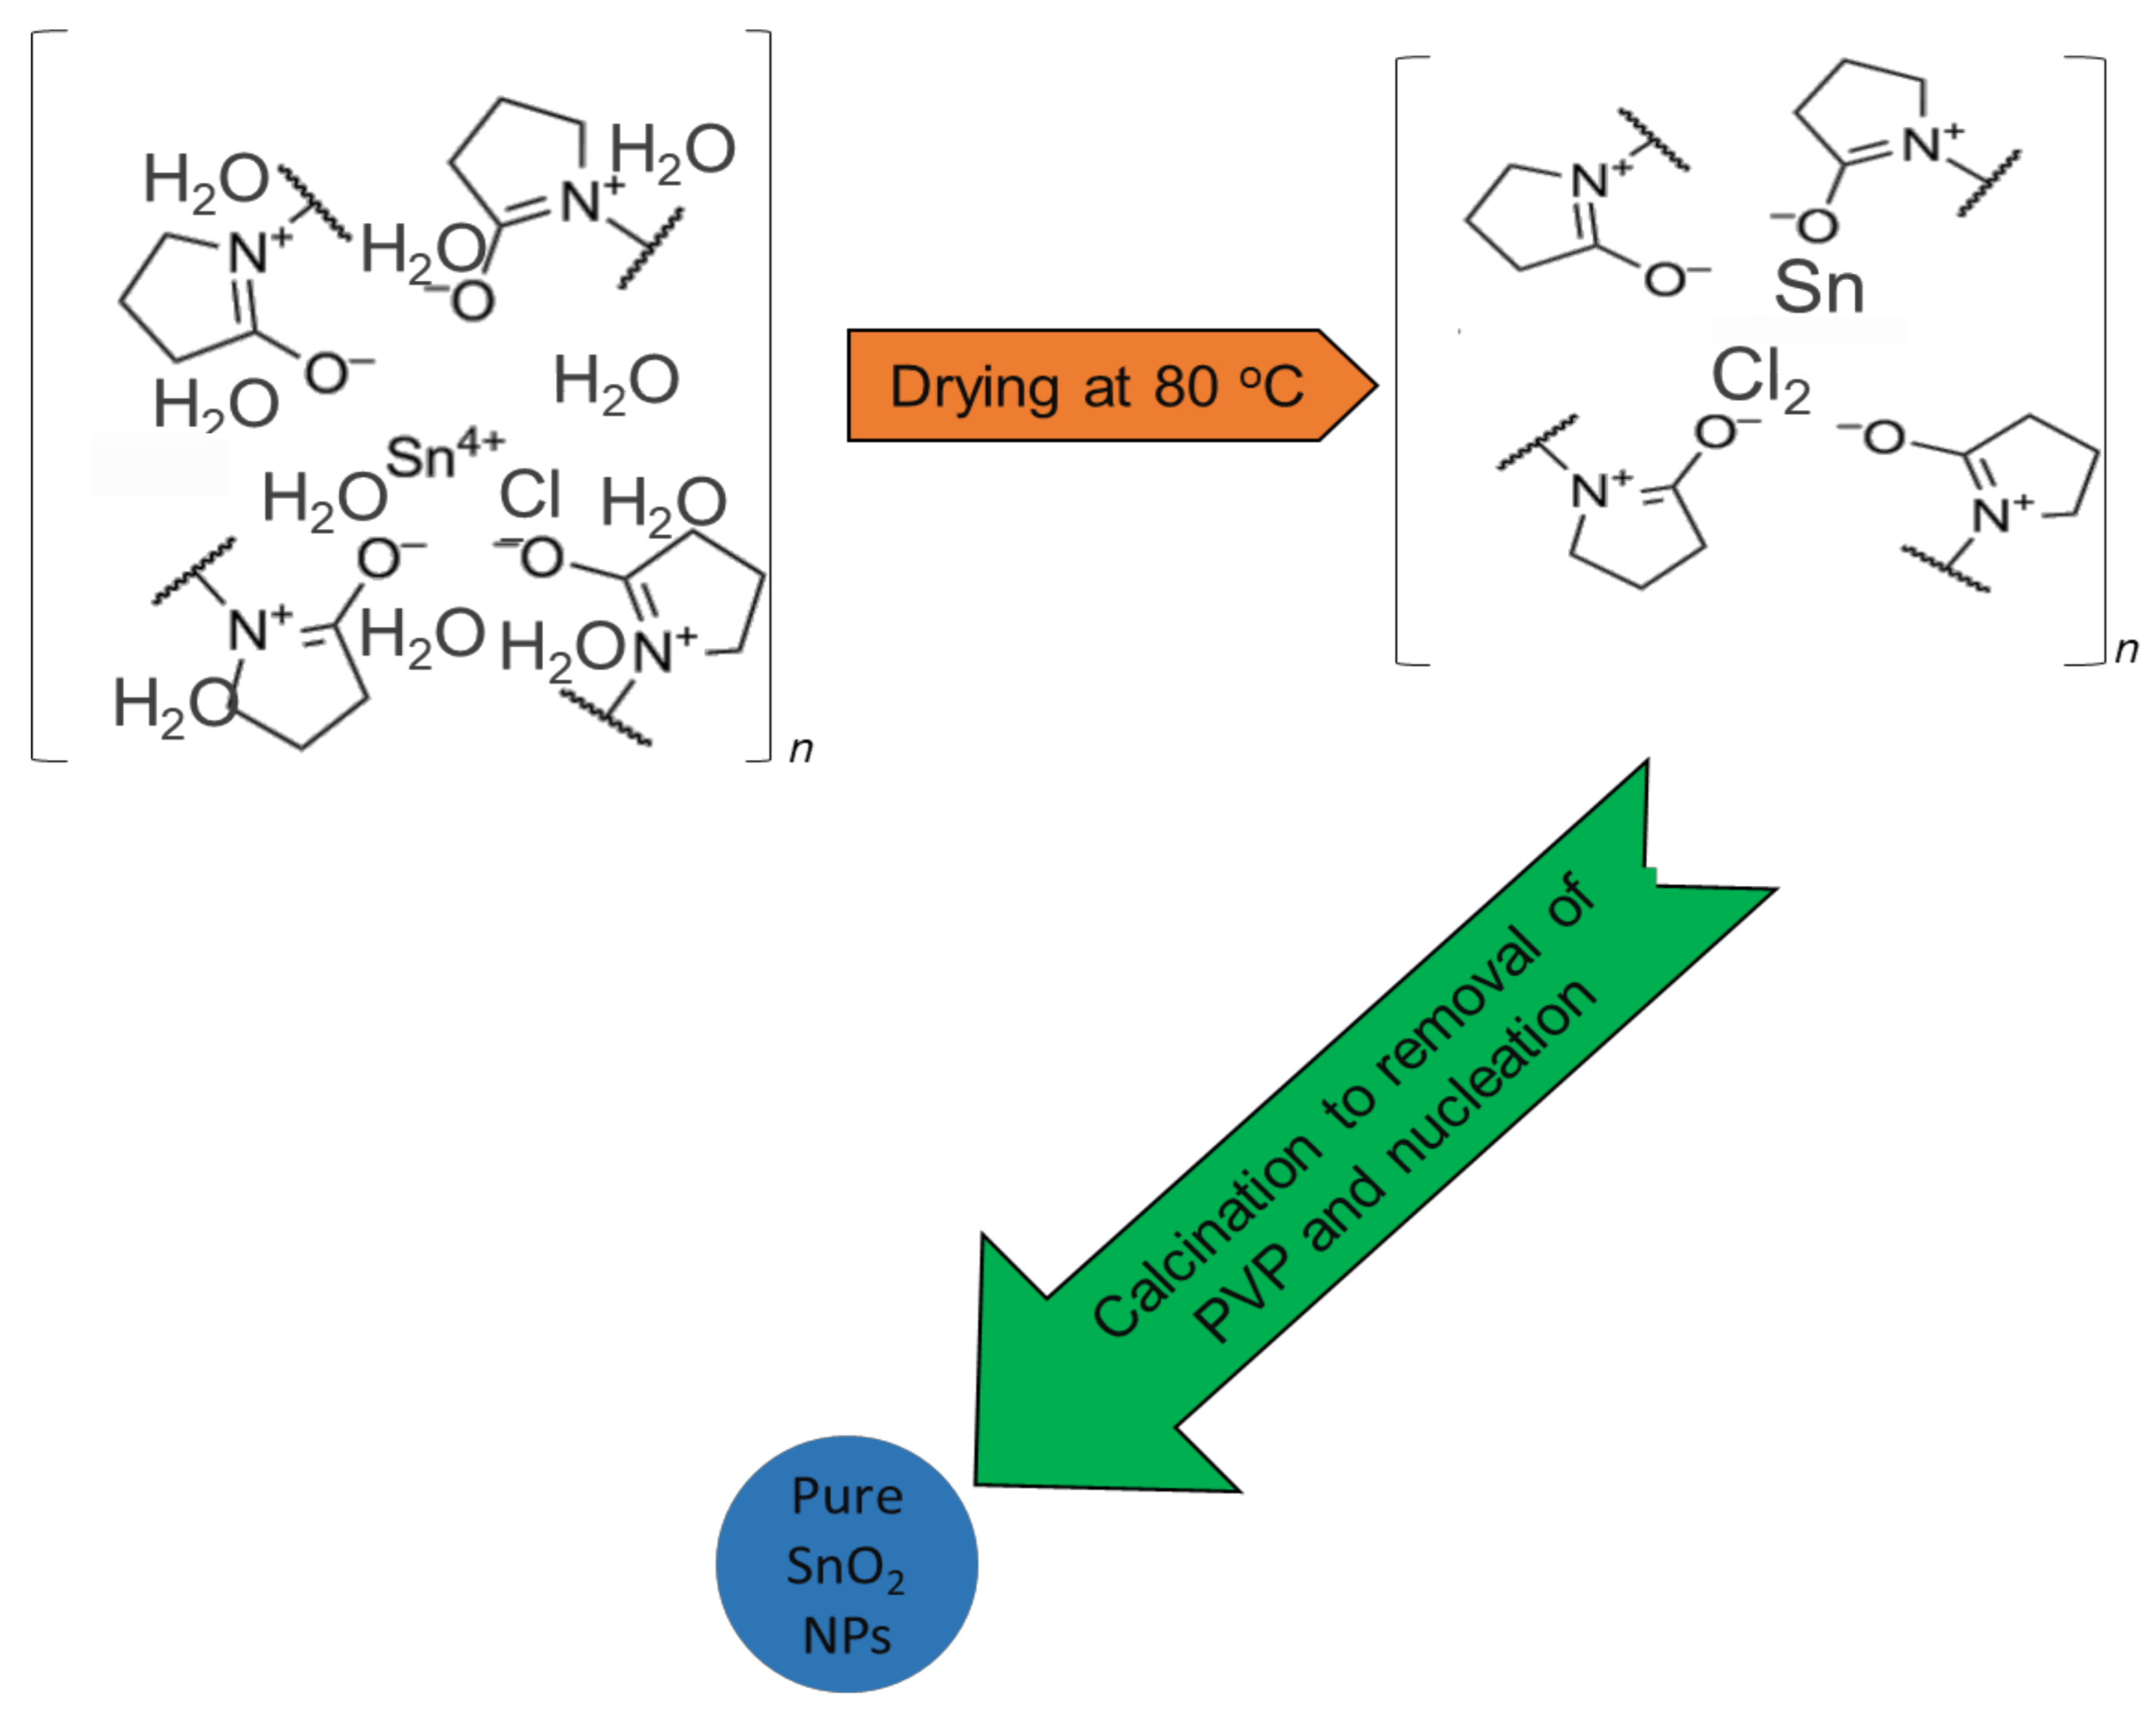
3.1. Mechanism of Nanoparticles

Nanoparticle growth, behavior and mechanisms during calcination are illustrated in Figure 1. PVP was originally applied to complex metallic salts as a stability agent, and it is frequently used with amide groups of pyrrolidone rings as well as methylene groups for steric and electrostatic stabilization. Metallic ions were suppressed during the mixing stage to capture them with the amine group through ionic-dipole interaction within the polymeric chains. Due to the removal of H2O during the drying process, the metallic cations become immobile inside the polymer cavity. Organic materials are converted into gases (e.g., N2, NO, CO, CO2) during calcination (from 500 °C to 800 °C), at which point PVP also influences the tin oxide nanoparticle nuclei formation. The Ostwald ripening phenomenon would arise without PVP, causing the nanoparticle to expand and demonstrate greater surface energy. In this case, steric hindrance has been deactivated by PVP, preventing the accumulation of nanoparticles [54,55]. Therefore, the use of PVP as a preventative agent in the breakdown of the metal ions on the nanoparticle surface renders PVP an effective technique for minimizing nanoparticle gain [56,57,58].

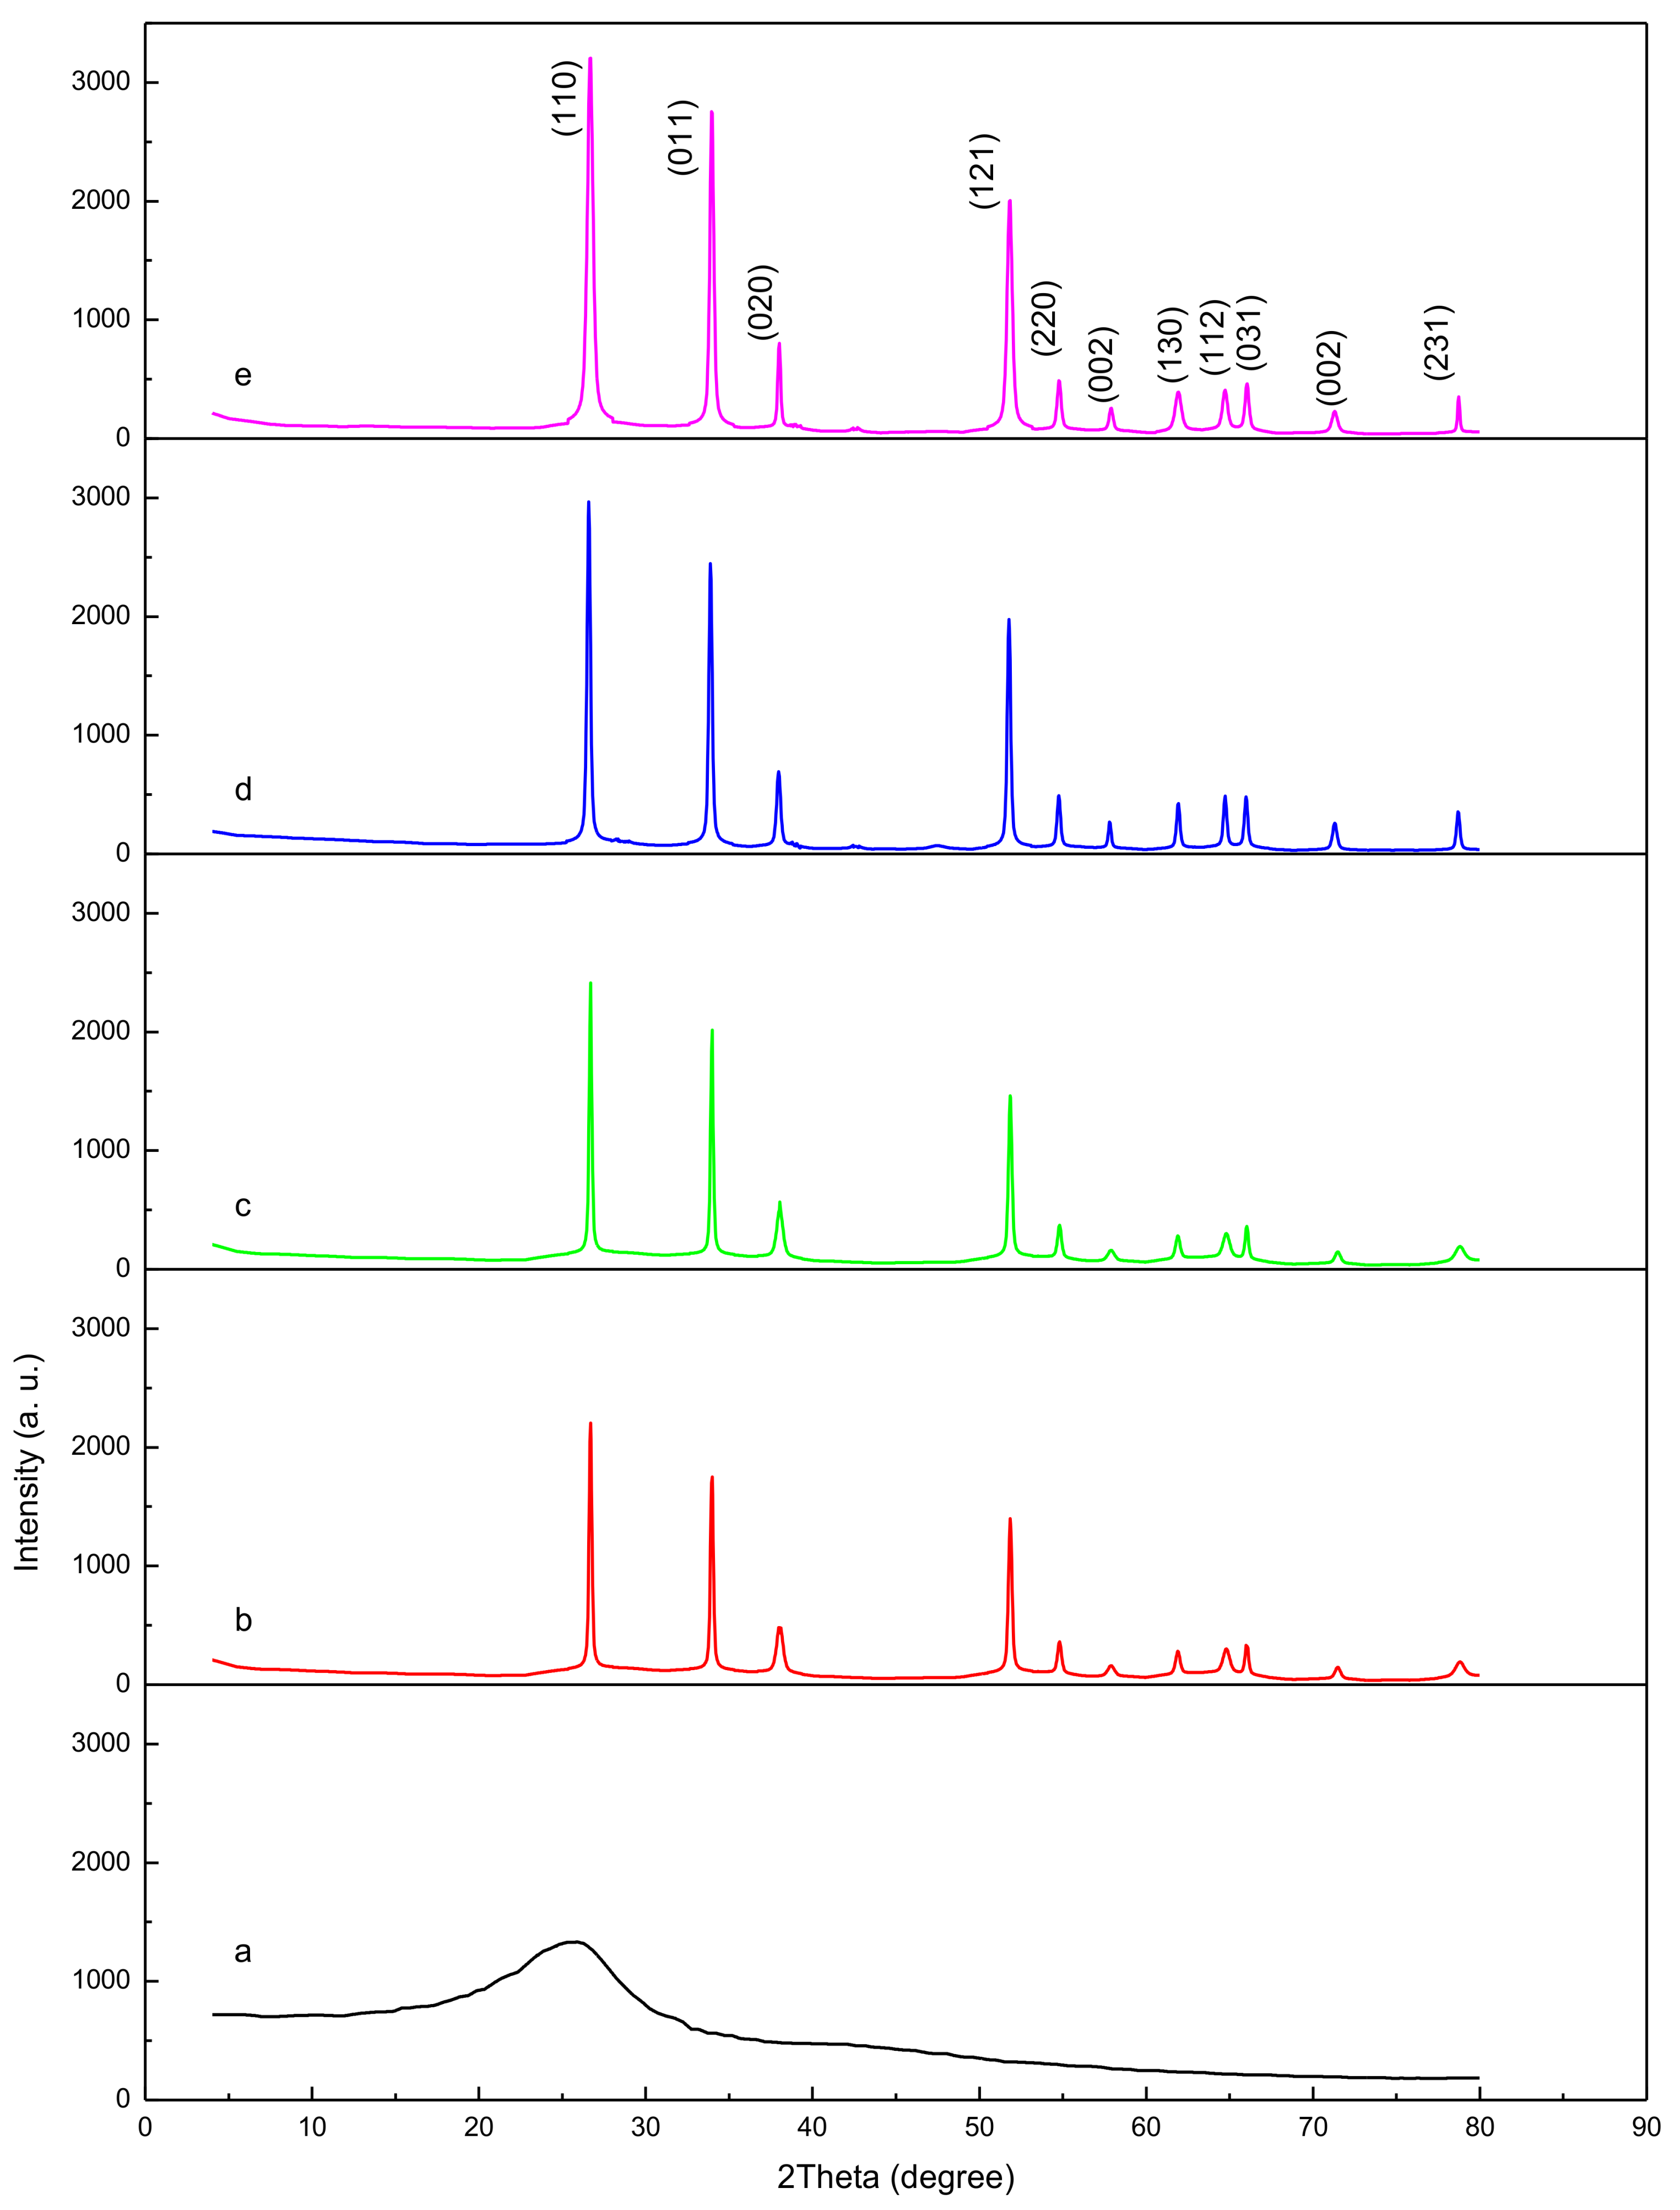
3.2. XRD Analysis Structural Analysis
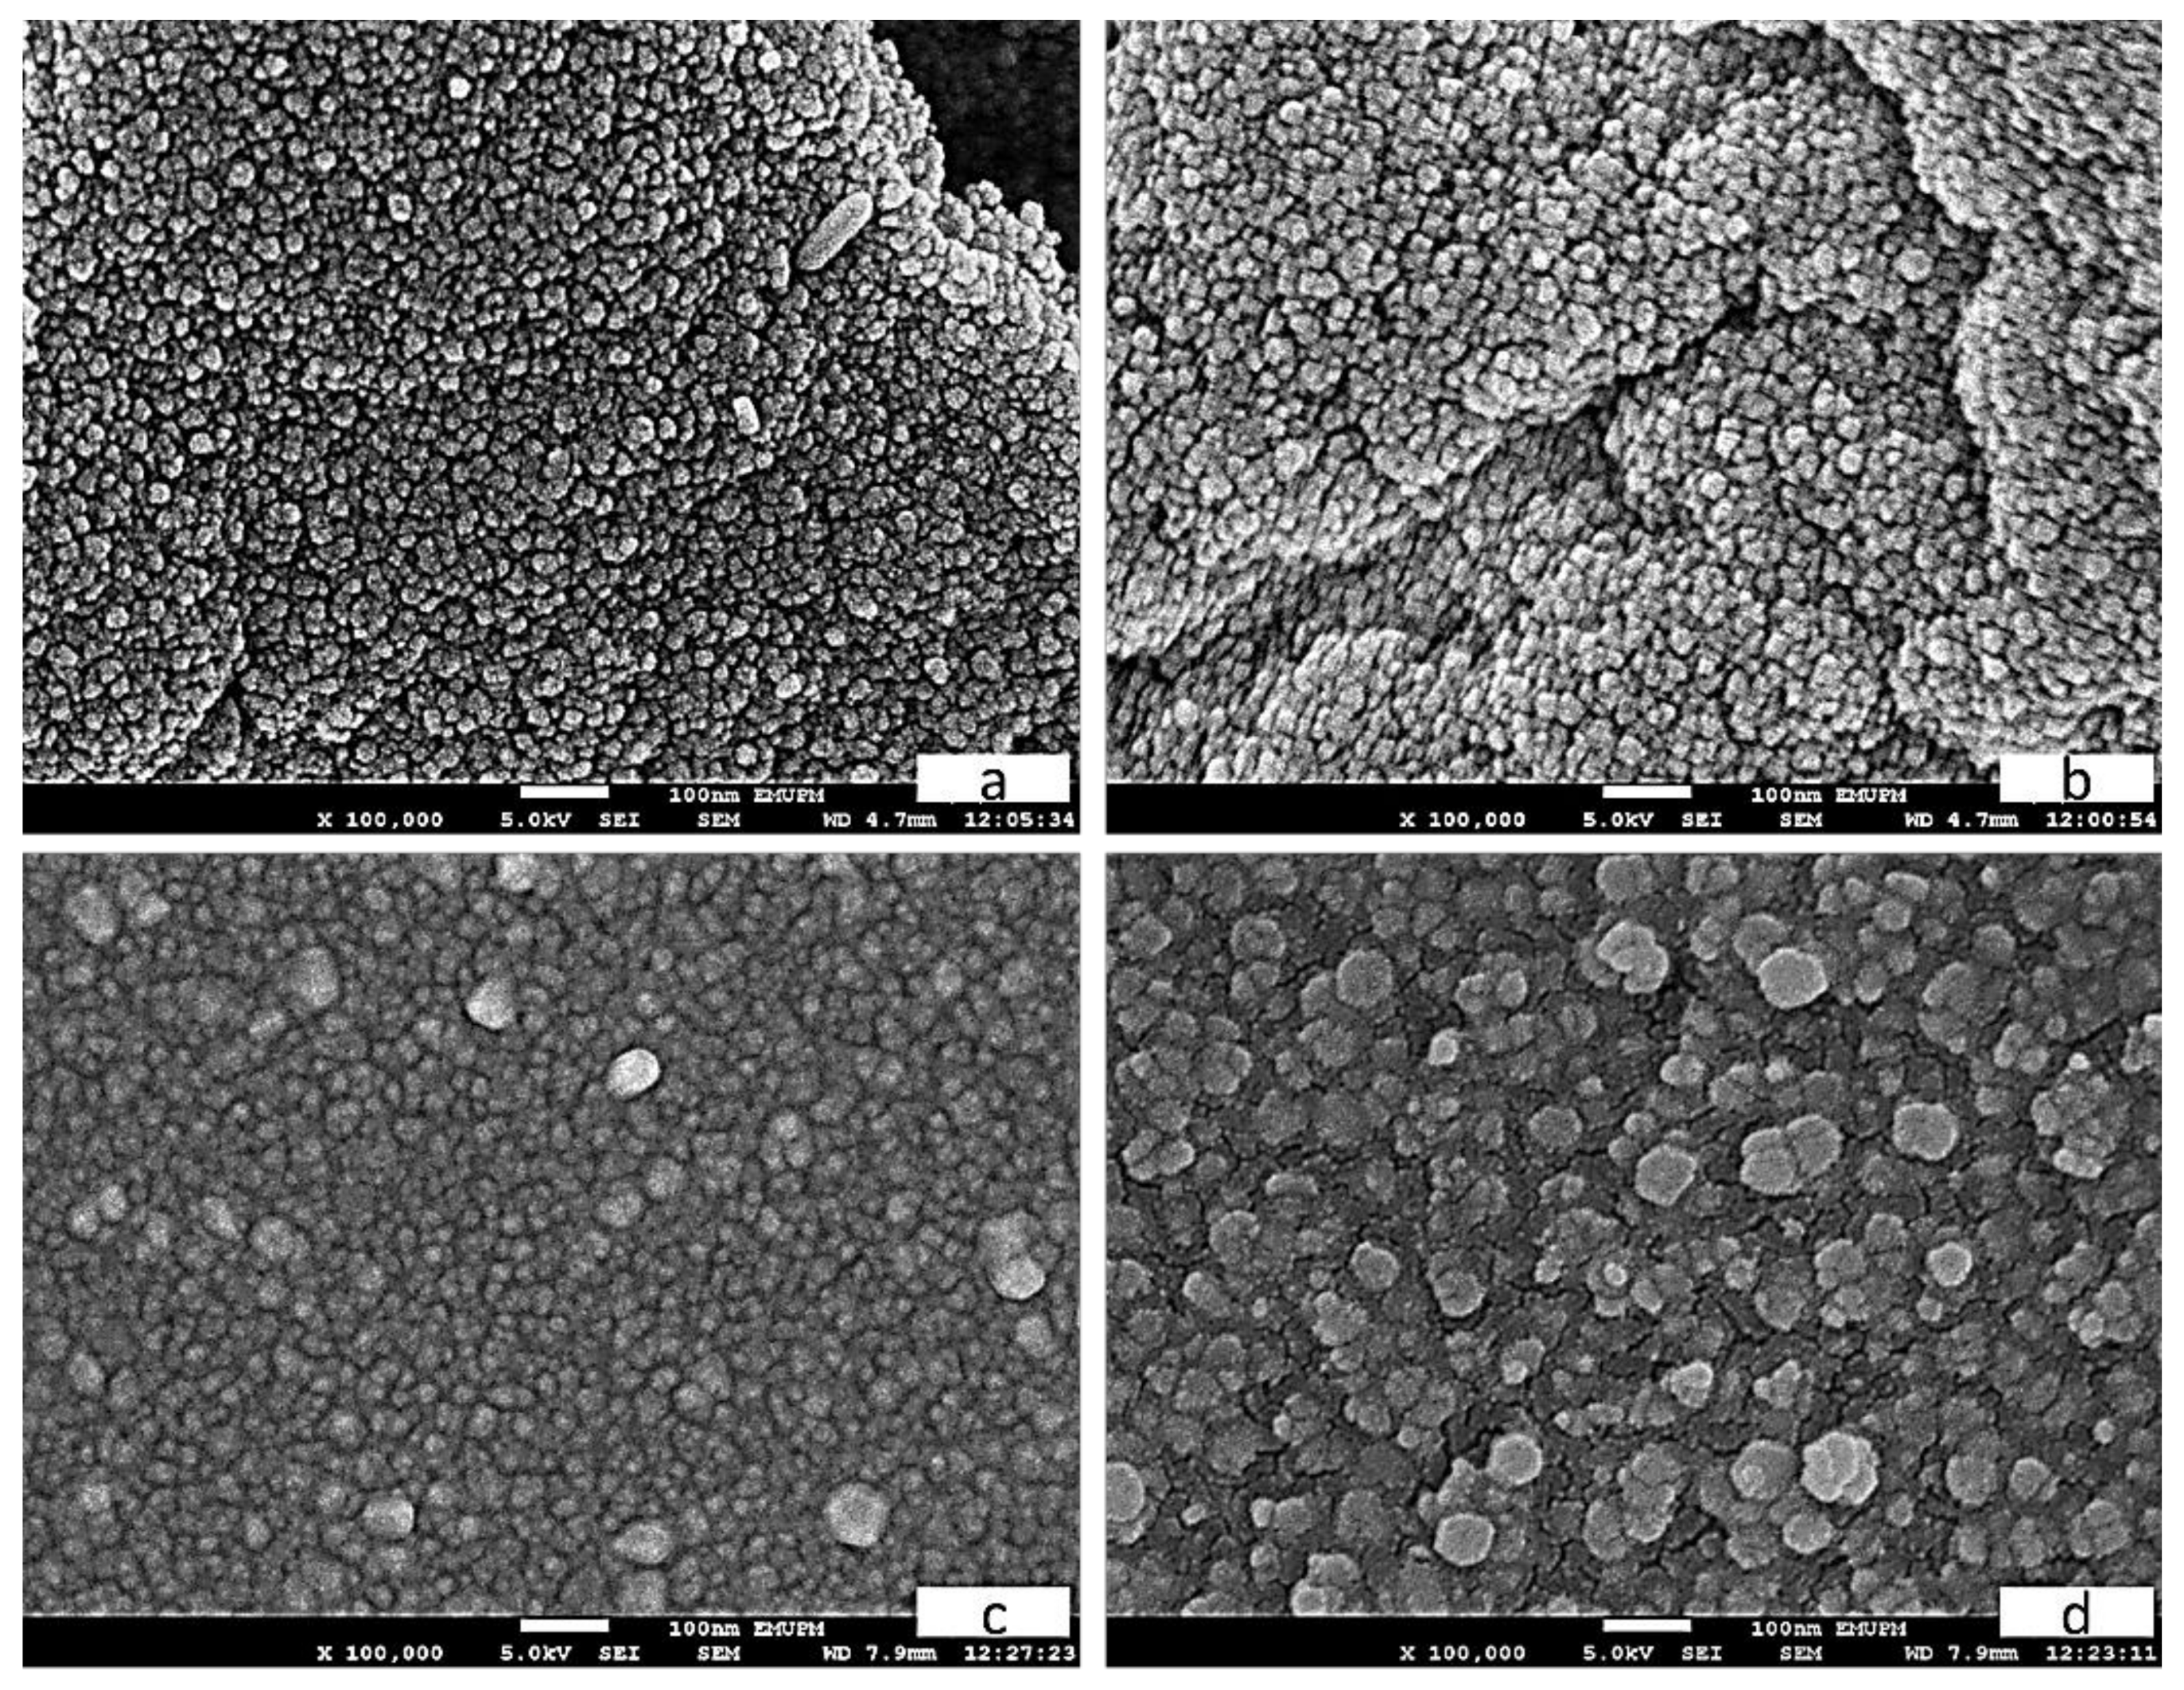
The results of the XRD analysis are illustrated in Figure 2, demonstrating the pre- and post-calcination attributes of the SnO2 nanoparticles. As illustrated in Figure 2a, the broad spectrum of the pre-calcination nanoparticles indicates the product’s amorphous-like behavior, as well as the non-development of the nanoparticles. The peaks shown in Figure 2b–e, on the other hand, demonstrate nanoparticle formation following calcination at 500 °C. The figures further illustrate the positive association between calcination and the height, sharpness, and narrowness of the peaks, indicating that the nanoparticles crystalize as the temperature increases. As illustrated in the TEM images, this is due to the gradual increase of the crystalline volume to surface ratio due to the growth in particle size. The correlation between temperature and crystalline size is illustrated in Table 1.
Crystallite size was analyzed using Bragg’s law. The SnO2 nanoparticles were found to have a standard tetragonal structure (JCPDS 00-041-1445) [59,60], based on the diffraction peaks (110), (011), (020), (121), (220), (002), (130), (112), (031), (022) and (231) in the diffraction patterns. A range of 3–14 mm in crystallite size was determined for peak (110) (the peak with the greatest intensity) based on the following Scherrer equation:
D = Kλ/βcosθ
where K is the Scherrer constant (0.9), λ is the X-ray irradiation wavelength (1.5418 Å), and β is the XRD peak width (FWHM).

3.3. SEM Analysis

The tin oxide nanoparticles’ surface morphology was analyzed using SEM, with the micrographs for each calcination temperature illustrated in Figure 3. As shown, the structure of the nanoparticles is grain-shaped and spherical, which echoes the results of previous work [61,62]. It is evident from the analysis that the nanoparticles take the shape of a large, near-spherical grain with regularities at high temperatures (Figure 3a,b). It appears that temperatures of 500–800 °C during calcination lead to greater nucleation and growth rates, as shown in Figure 3b–d.

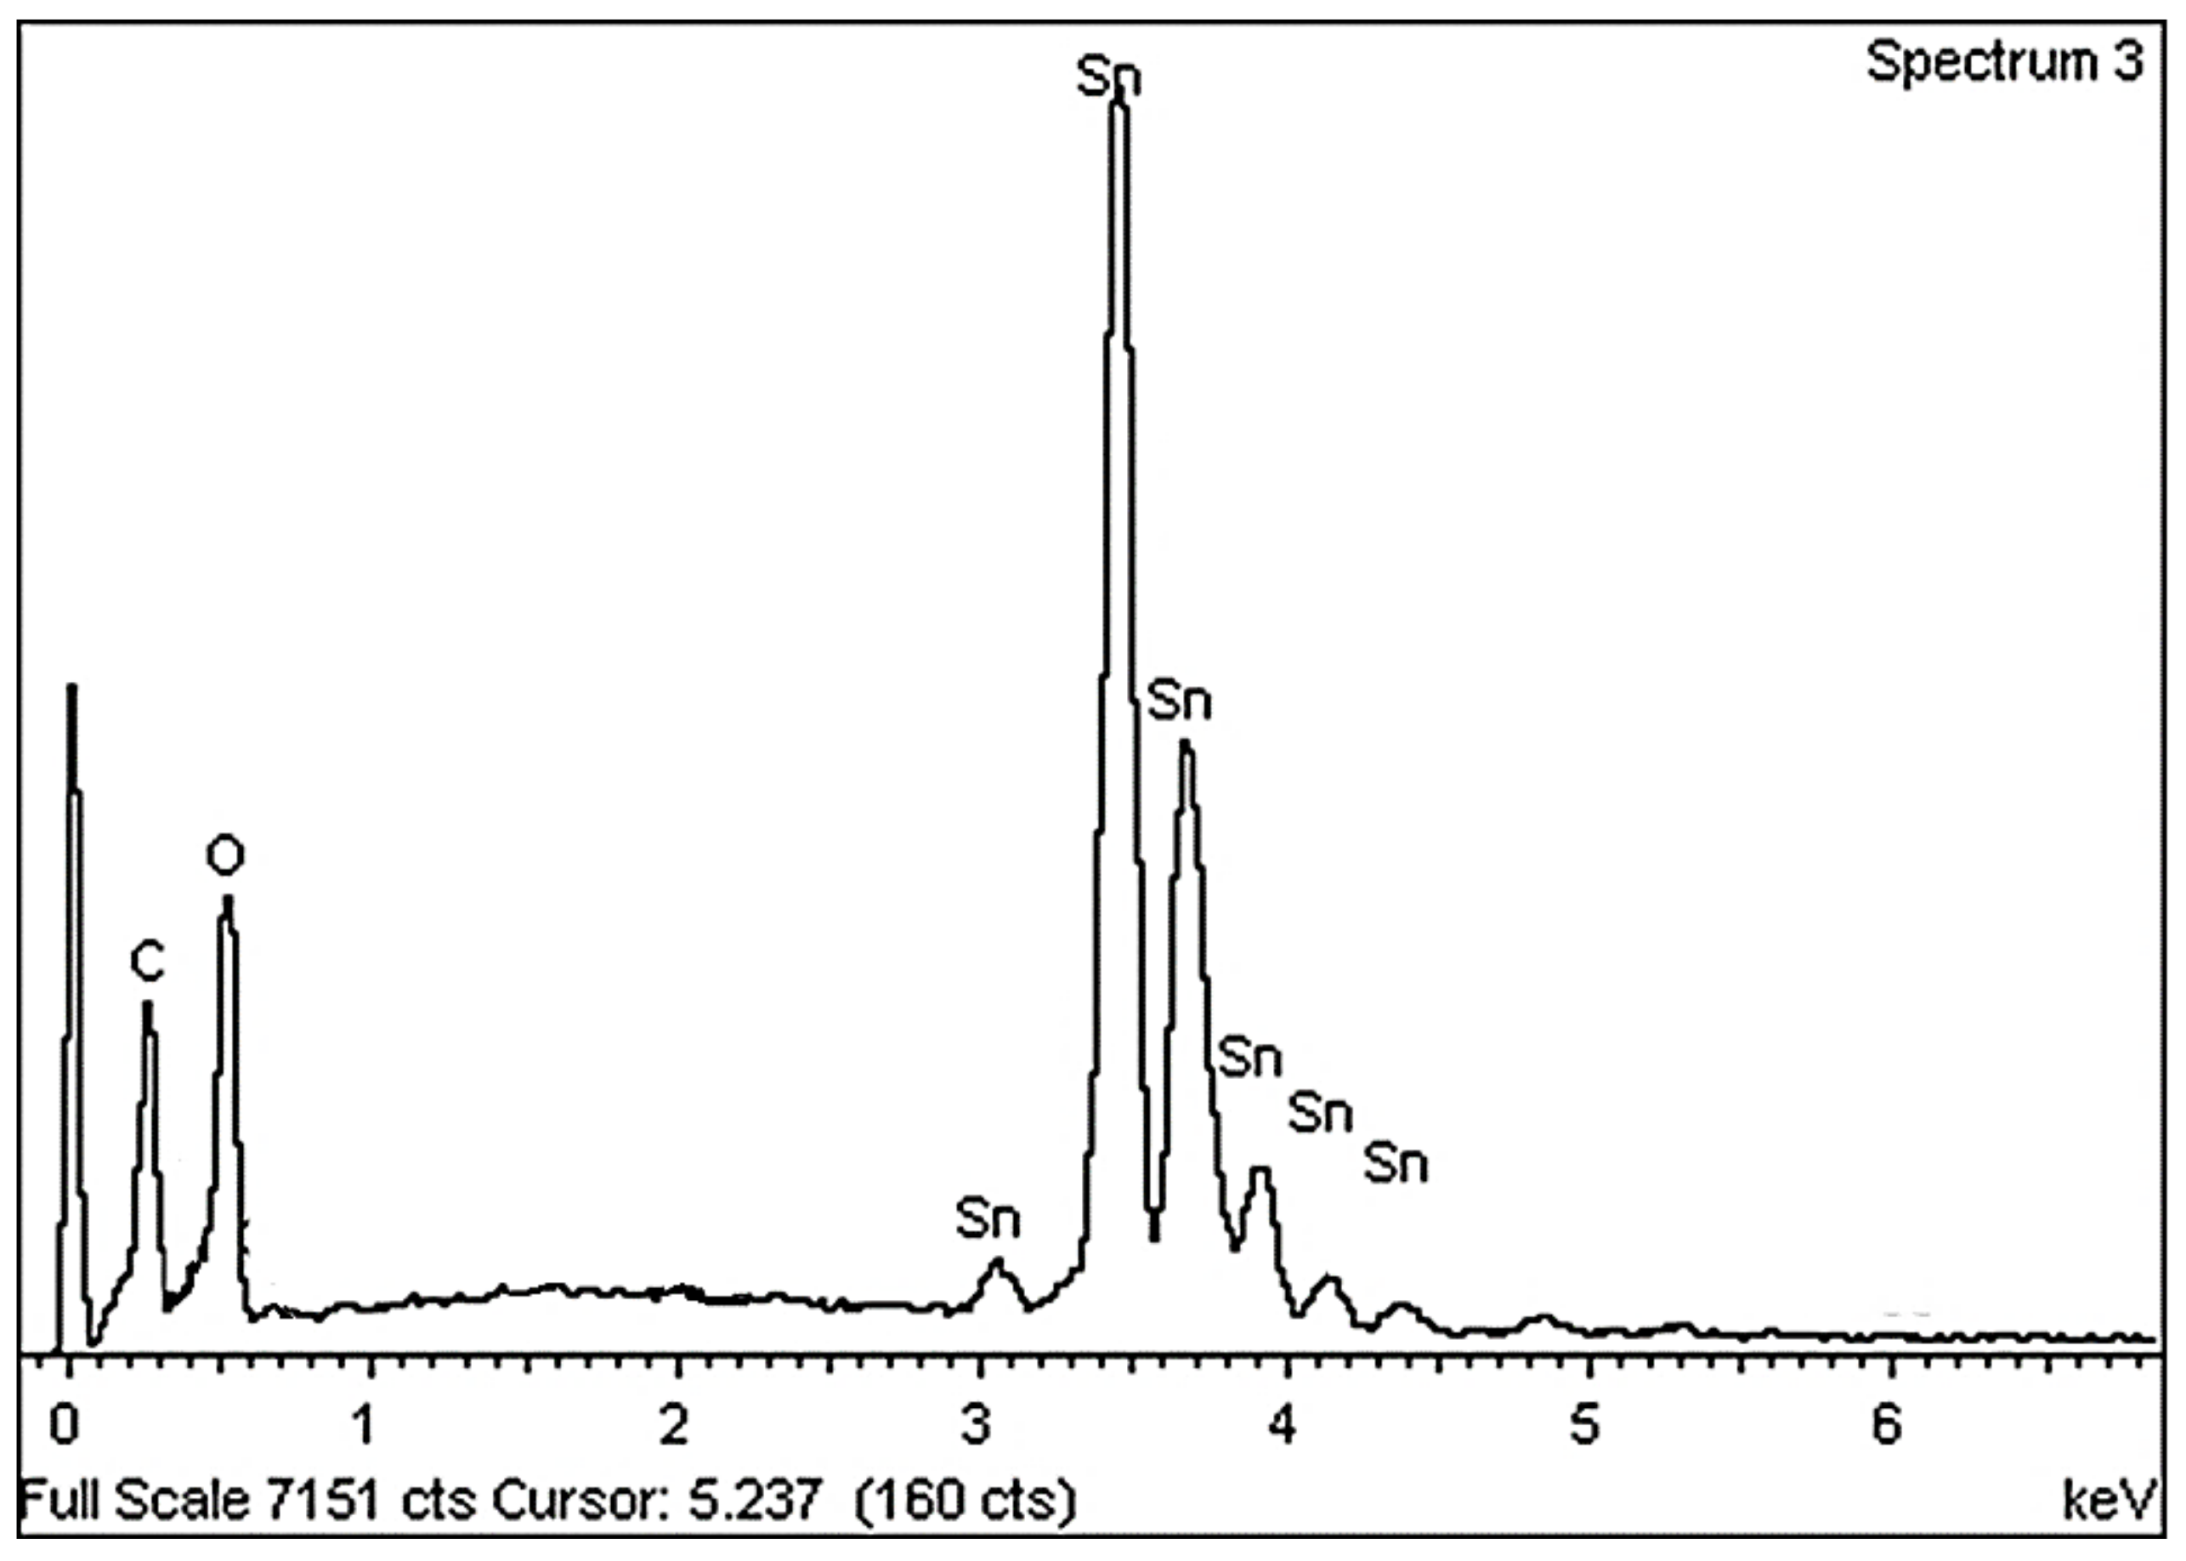
3.4. EDX Spectrum Analysis
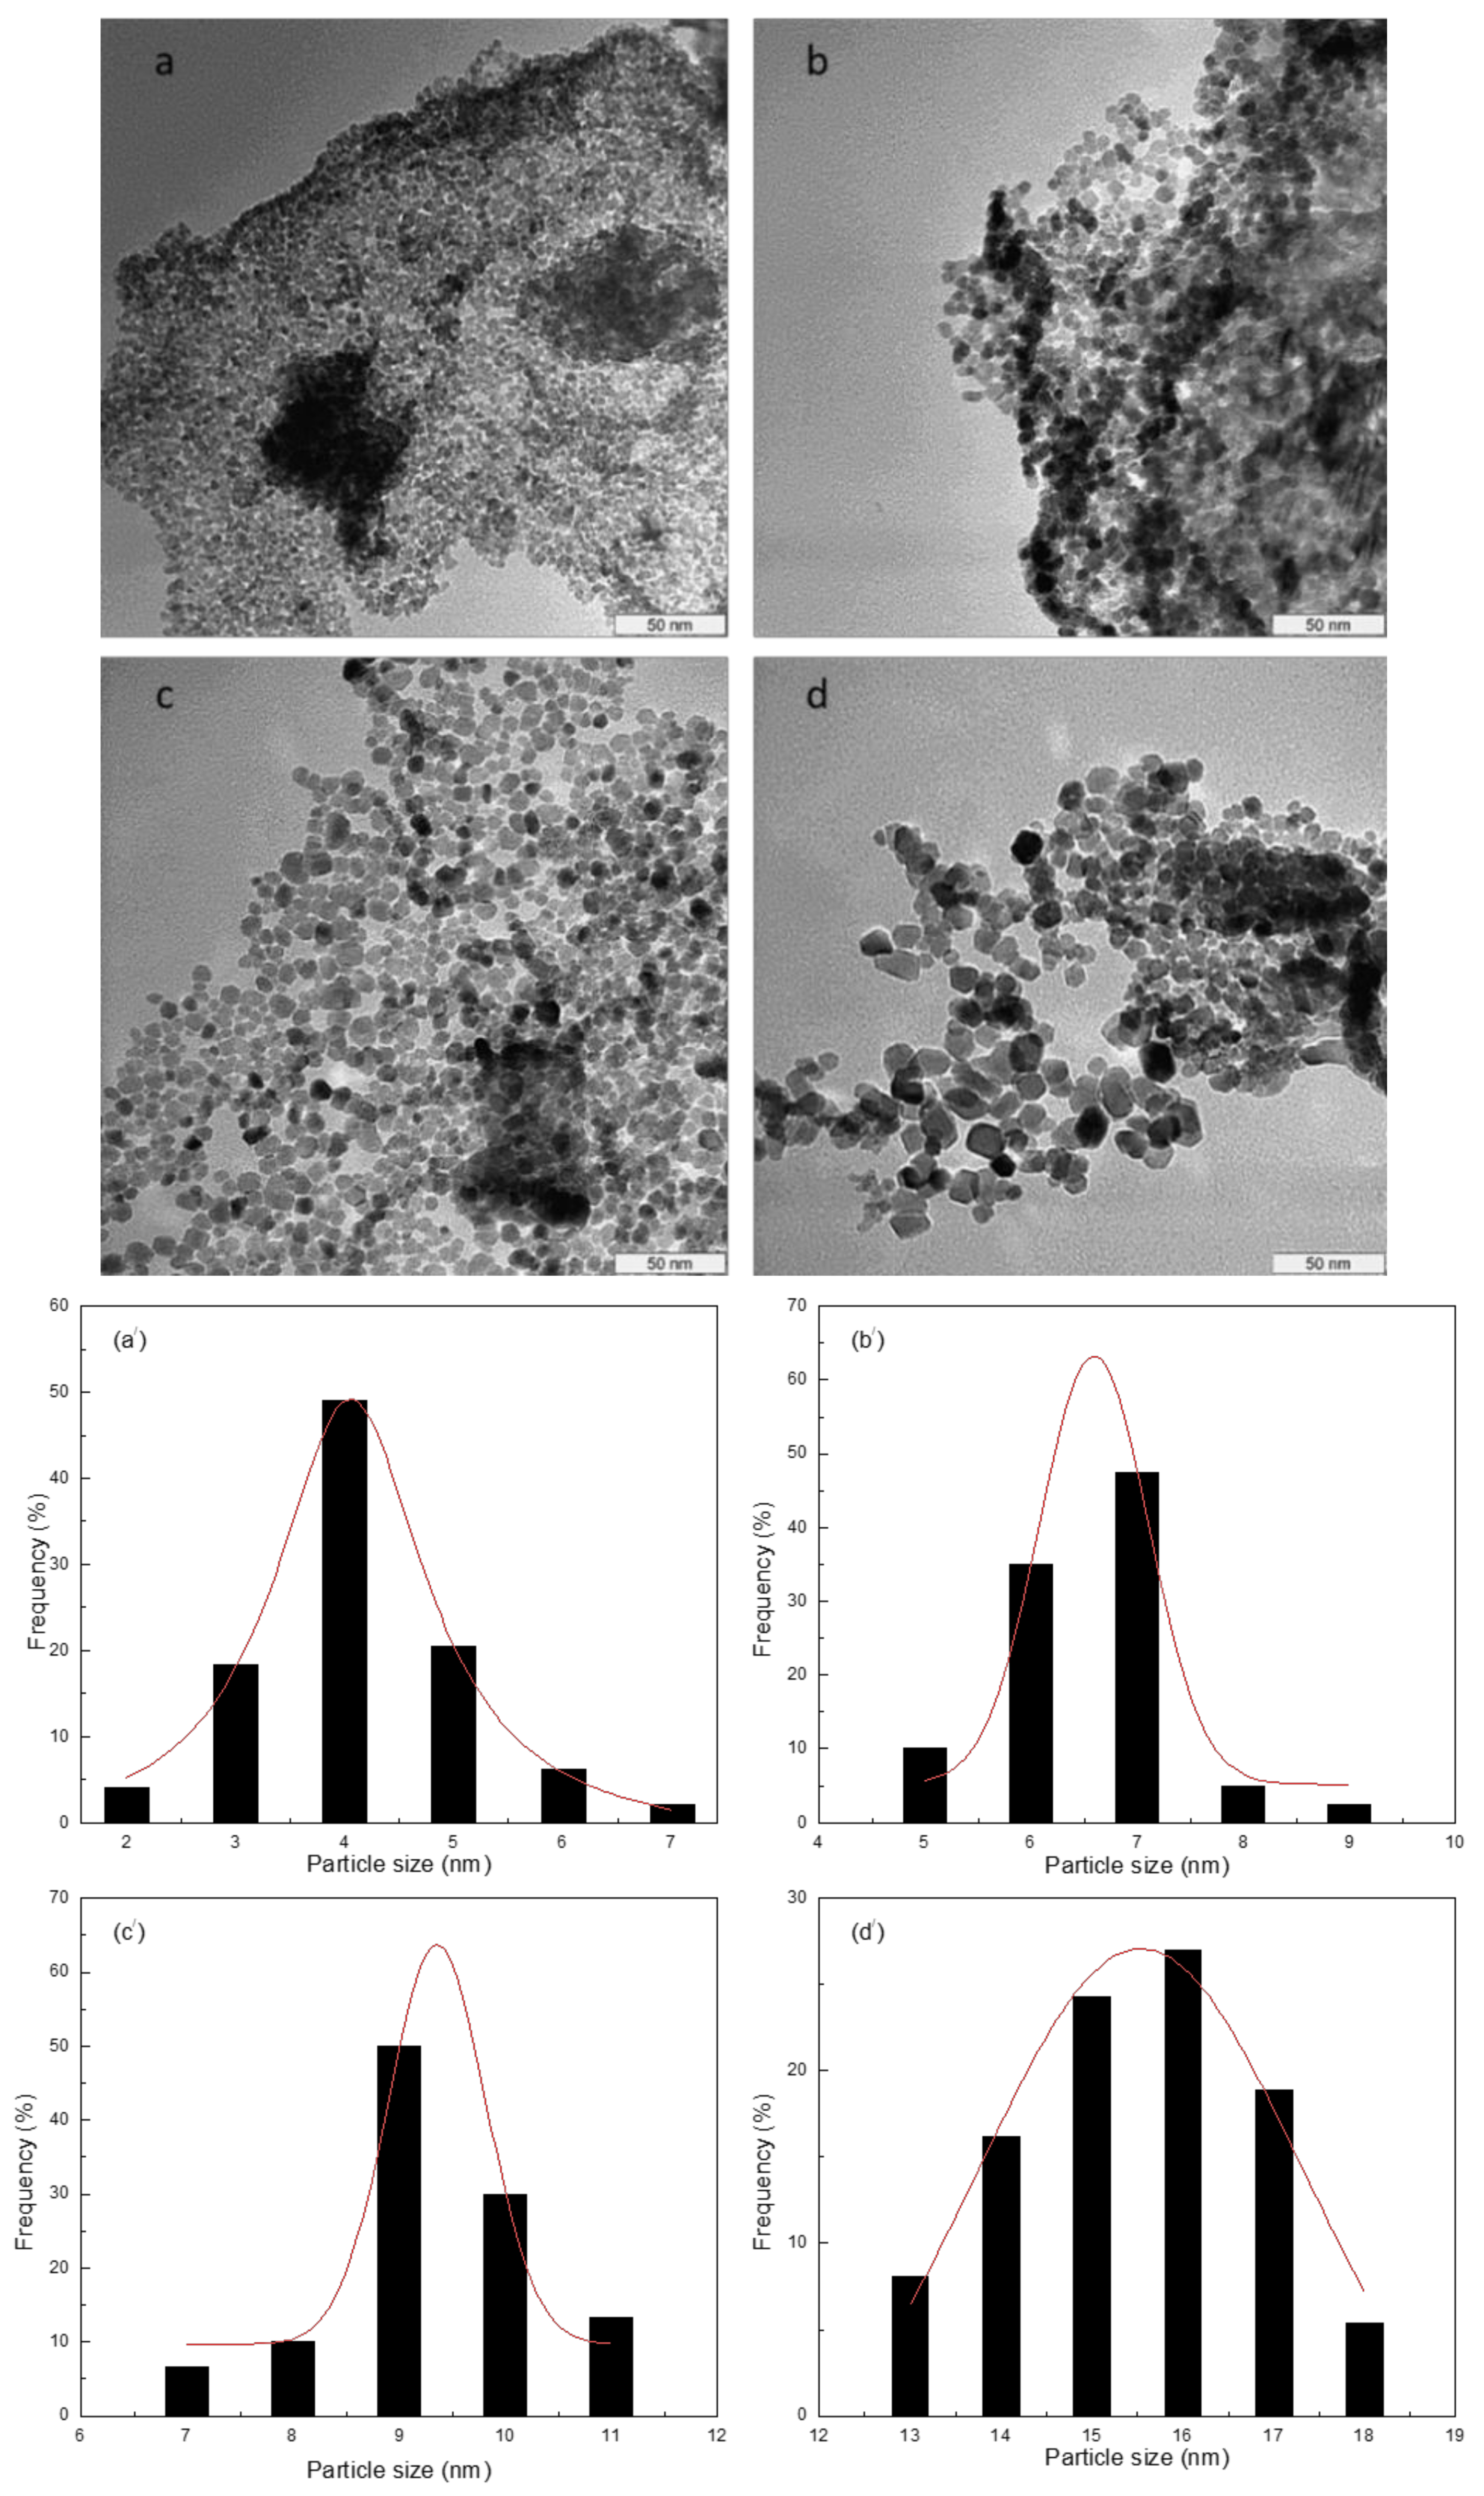
To analyze nanoparticle composition at various calcination temperatures EDX spectroscopy was conducted on the sample, with the results presented in Figure 4. Here, Sn: O peaks indicate the existence of Sn: O elements, with Table 2 illustrating their atomic percentages. The peak of 0.3 keV represents the carbon film holder used for the analysis. The results confirm that the final nanopowder is comprised of pure tin oxide, with the Sn: O atomic percentage only determined in the final sample.

3.5. TEM Analysis

Nanoparticle microstructure analysis was performed using the TEM technique. As illustrated in Figure 5, the nanoparticles were found to have a regular morphology, with nanoparticle characteristics then analyzed at various calcination temperatures (Figure 5a–d). The results confirm that the product morphology is spherical and homogeneous. The correlation between particle size and calcination temperature, as noted previously, is caused by the accrual of nearby particles as the surface melts at the highest temperatures [63,64,65]. The use of this method for nanoparticle formation has been shown to be effective, with PVP impacting particle size due to its suppressive function on particle accumulation. Thus, PVP is shown to be a stabilizer of particle size, supporting nucleation, particle size growth, and particle regularity. PVP has been used previously to control particle size and prevent nanoparticle accretion [55,56,57,58,66,67,68]. The results illustrated in Table 1 allow for a comparison of the XRD and TEM analyses, further highlighting the relationship between calcination temperature and particle size (4–15.5 mm).

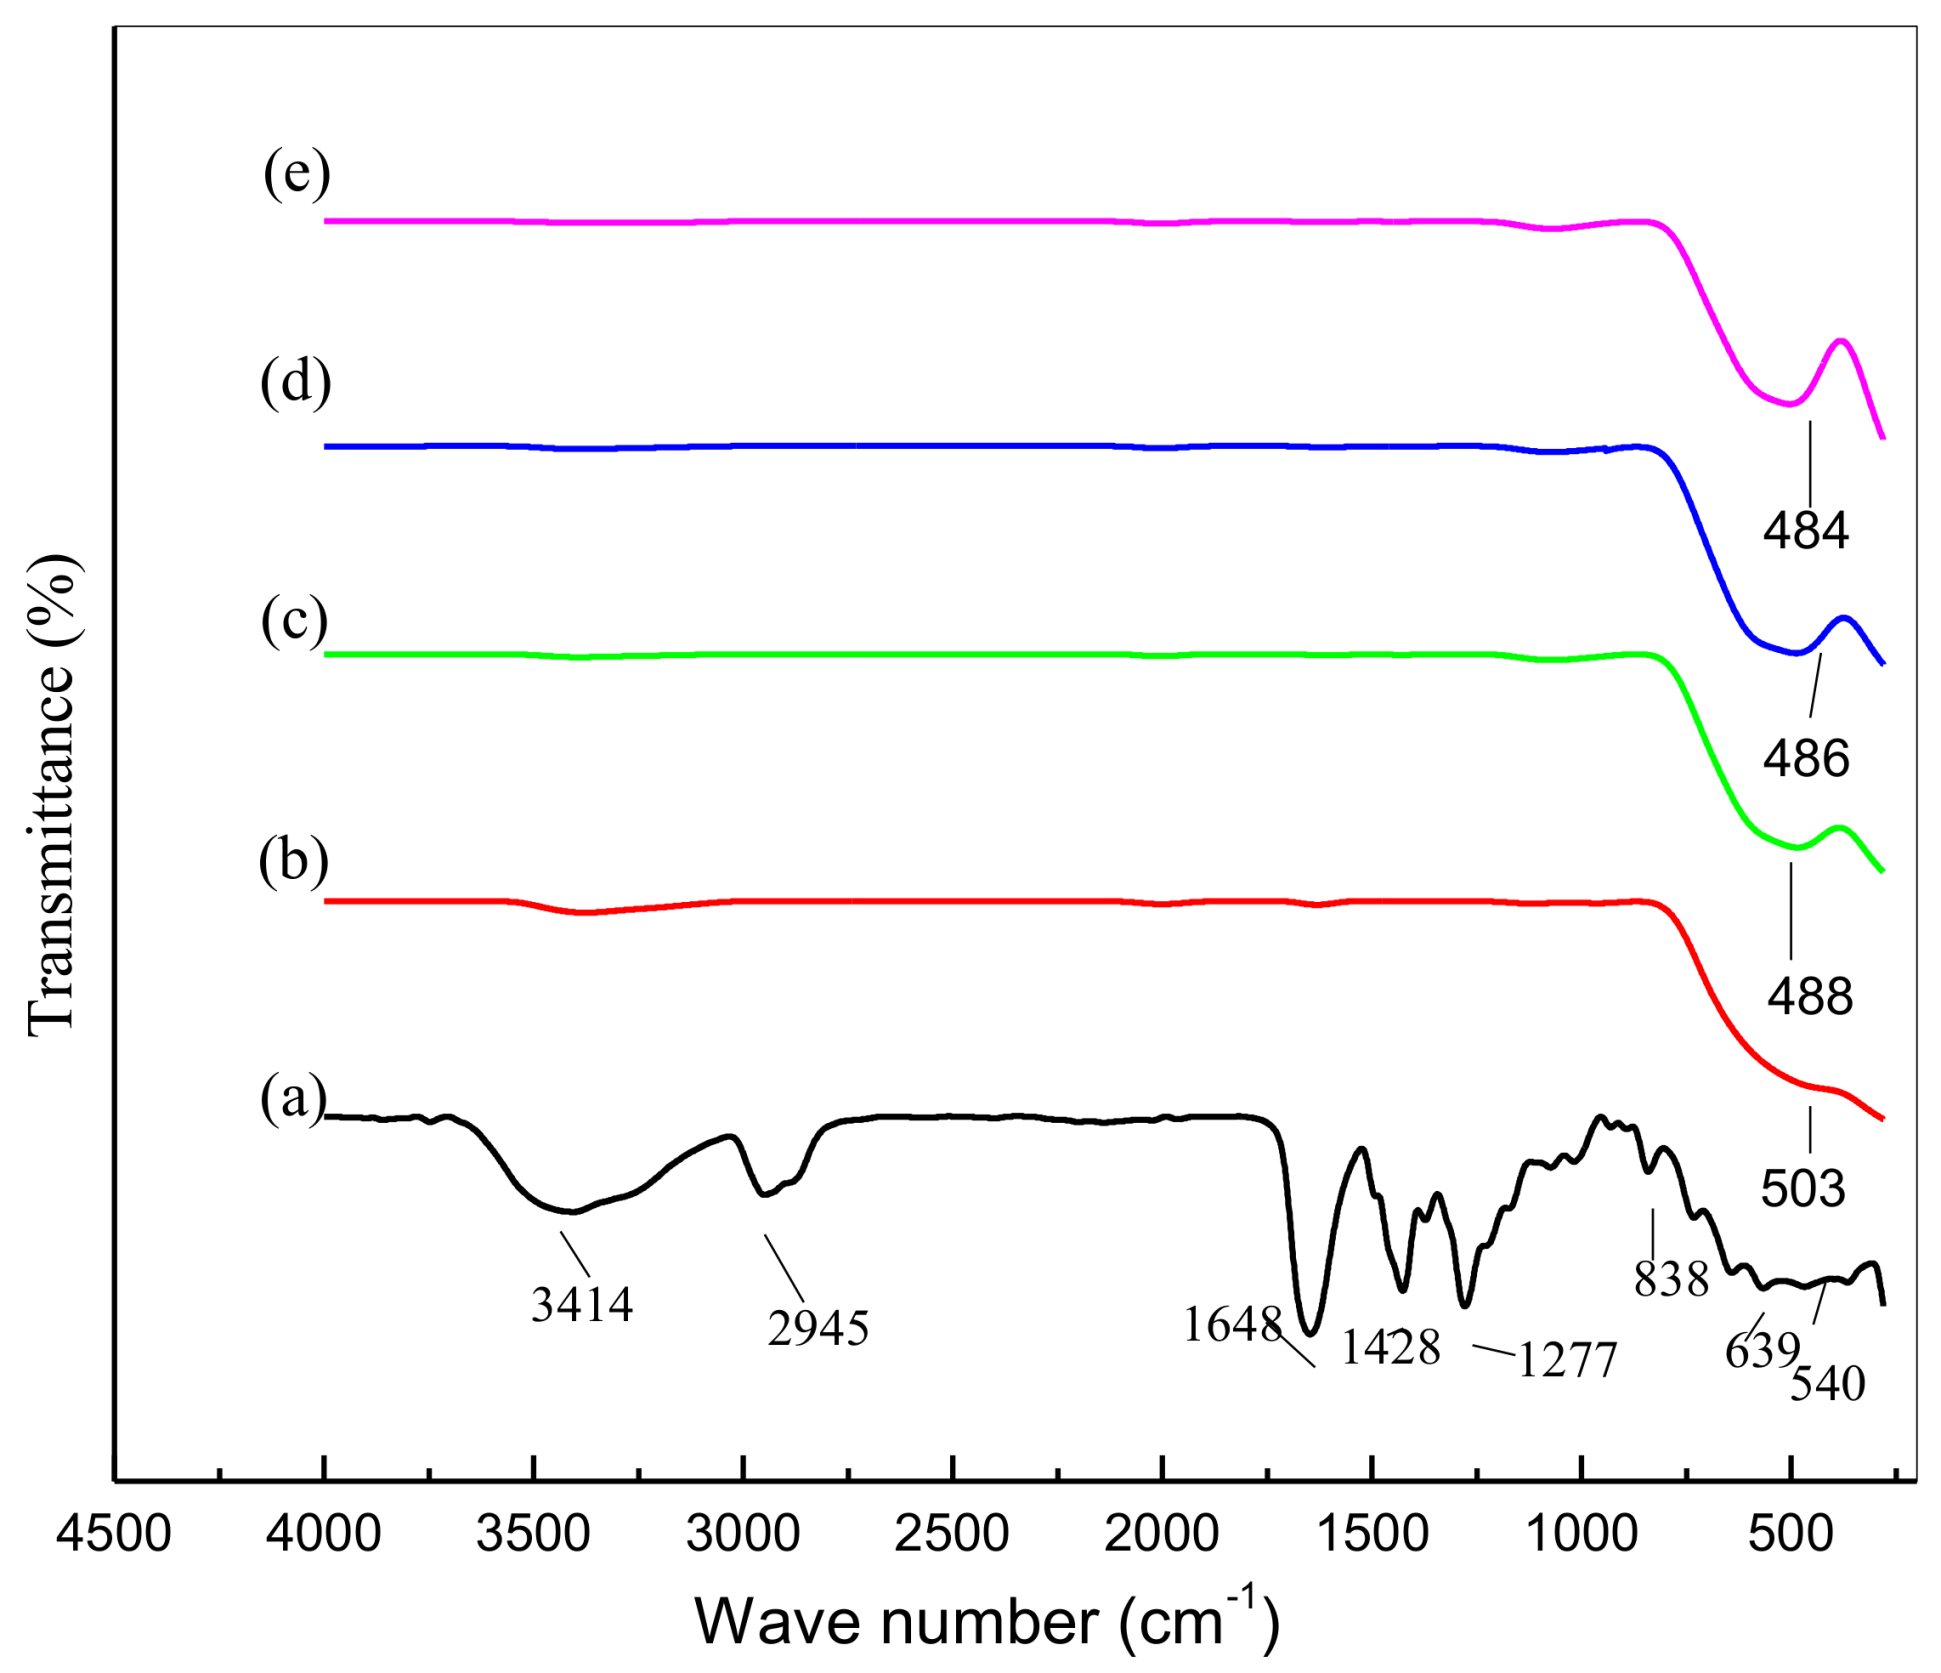
3.6. Functional Analysis

Figure 6 illustrates the FTIR spectrum at 280–4000 cm−1 for the thermal calcination-generated SnO2 nanoparticles. The nanoparticles and organic compounds are reflected in the absorption peaks shown in Figure 6a, with wave numbers of 3414 cm−1 assigned to N–H stretching vibration, 2945 cm−1 to C–H and 1646 cm−1 to C=O. The 1428 cm−1 absorption peak was assigned to the C–H bending vibration (methylene group), with the 1277 cm−1 peak assigned to the C–N stretching vibration [64]. The 839 cm−1 absorption peak relates to the C–C ring vibration, the 639 cm−1 peaks to the C–N=O bending vibration [63], and the 540 cm−1 to the O–Sn–O vibration. It is believed that the purity of the tin oxide nanoparticles is the cause of the single absorption peak, as well as the SnO2 nanoparticle wave number fluctuation based on calcination temperature. The enhanced crystallinity of the nanoparticles supports this point regarding the impact of calcination. The sharper peaks, representing increased calcination, are illustrated in Figure 6, with these peaks suggesting that the tin oxide product becomes more crystalline in structure because of increased calcination.

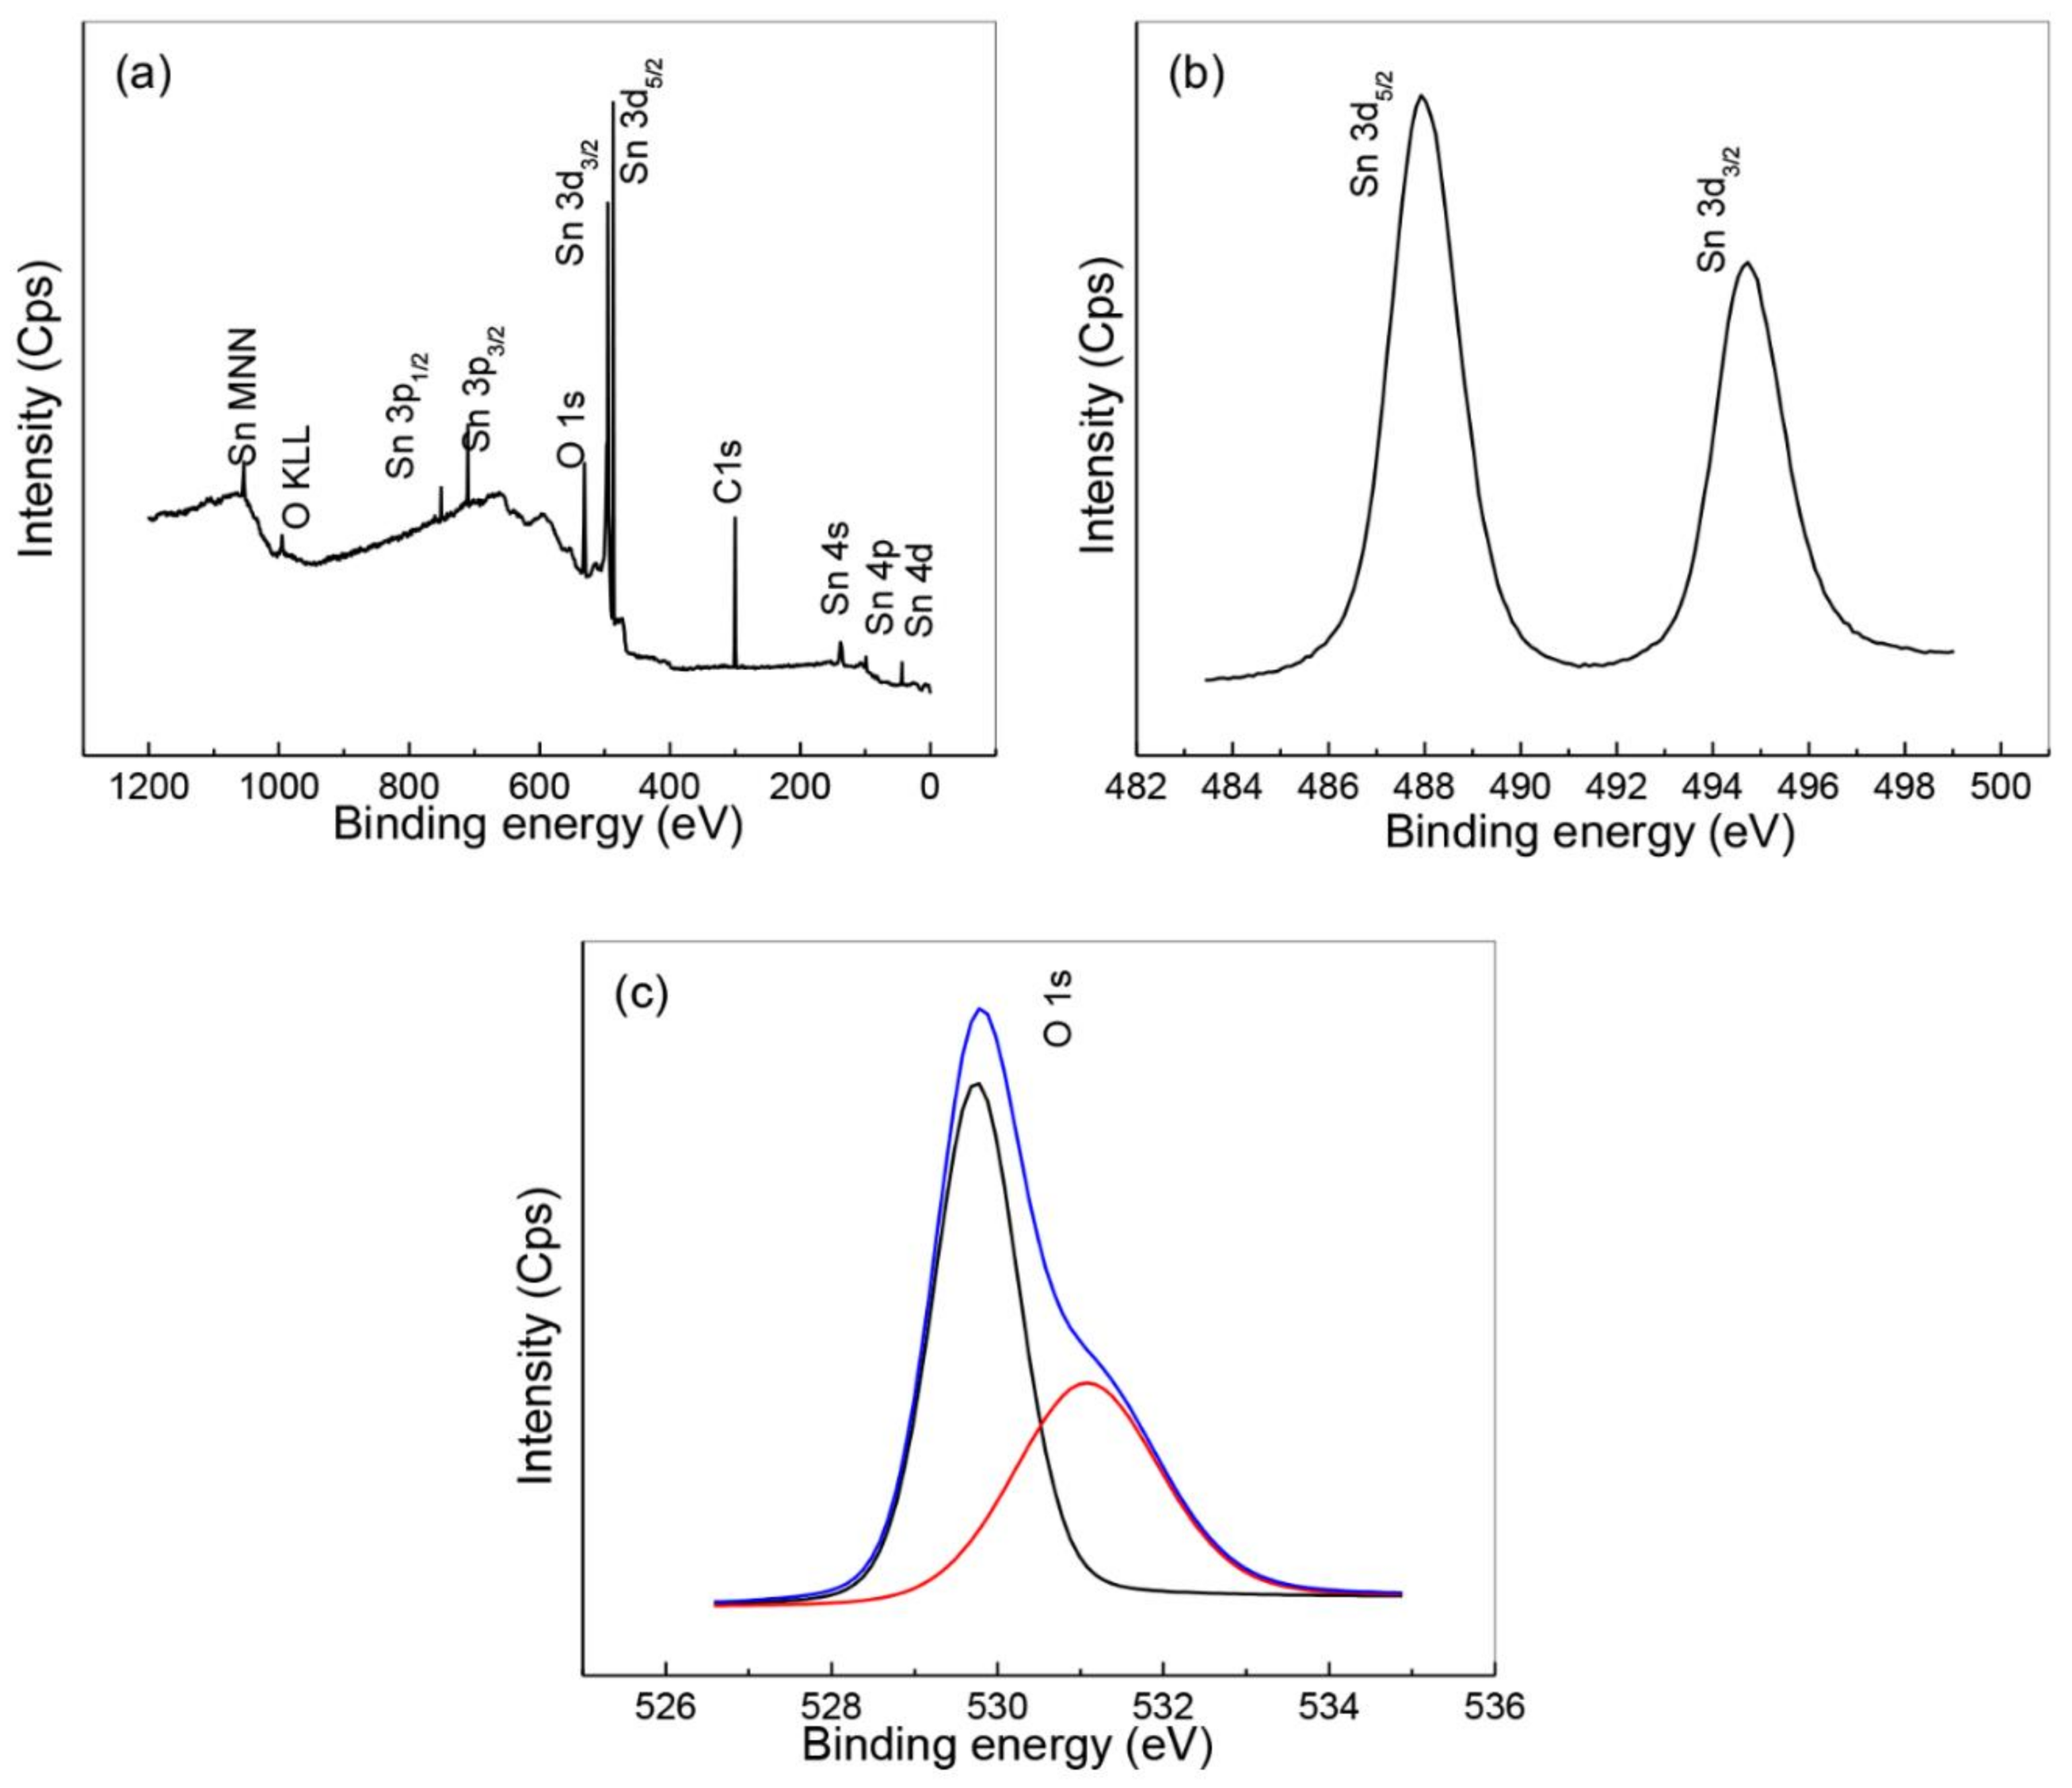
3.7. Compositional Analysis

The Sn and O elements’ compositions phase and chemical state were analyzed using X-ray photoelectron spectroscopy (XPS). The existence of Sn, O and C elements is confirmed in the XPS results shown in Figure 7a, with high-res XPS spectra for Sn 3d3/2 and Sn 3d5/2 shown in Figure 7b. The binding energies of 487.8 eV for Sn 3d5/2 peak and 494.9 eV for the Sn 3d3/2 peak are in line with the results presented in earlier research [19,27,69]. The deconvoluted O 1s spectrum demonstrates binding energies of 529.7 eV and 531.1 eV for two forms of oxygen (Figure 7c), which have been found to be correlated with SnO2 [70,71]. The results appear to verify the purity of the nanoparticle elements’ oxidation states.

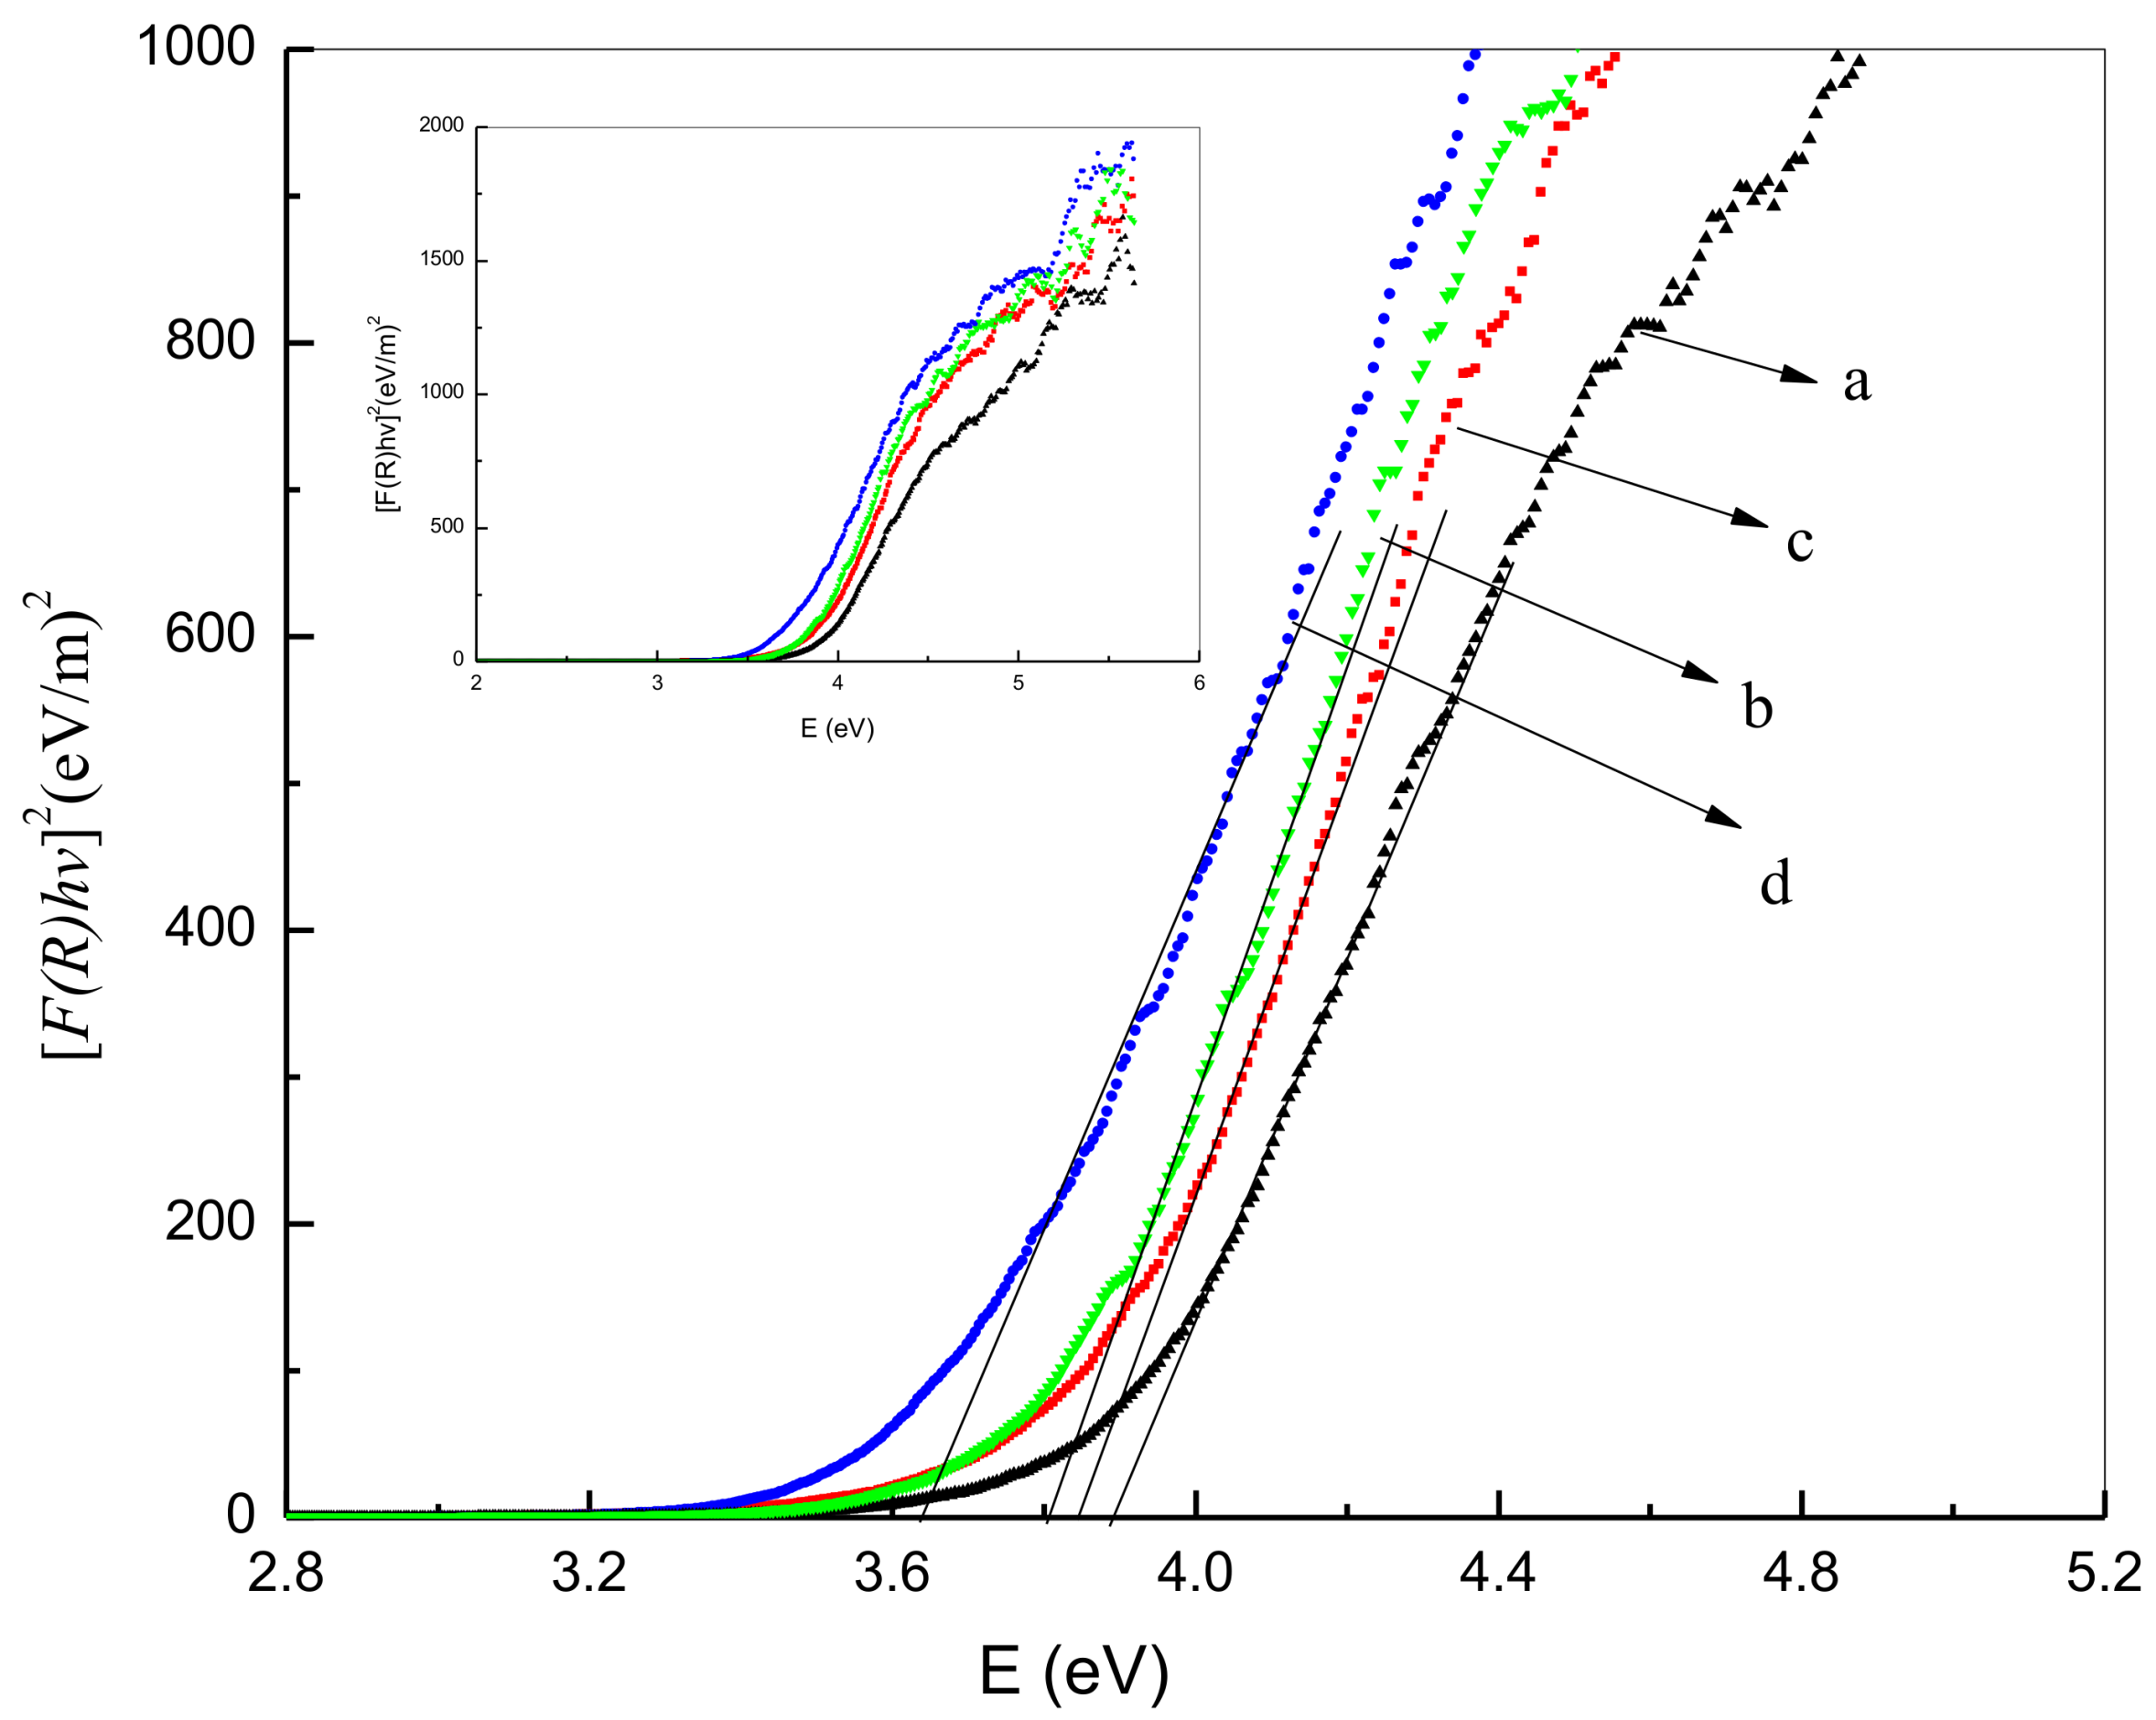
3.8. UV-Vis Diffuse Reflectance Spectra (DRS) Analysis

To identify the nanoparticles’ energy band gaps from diffuse reflectance spectra for nanoparticle samples produced at various calcination temperatures, the Kubelka-Munk method was used. This entailed plotting the square of the Kubelka-Munk function F(R)2 vs. energy and extending the linear part of the curve to F(R)2 = 0. This is demonstrated in Figure 8a–d with the process denoting the generation of tin oxide nanoparticles’ direct band gap energy. The results indicate that an increase in calcination temperature is associated with a decrease in energy band gap value, likely due to a quantum size effect. It is suggested that the decrease in band gap could be due to transitions between Sn2+ ion d-shell electrons’ valance and conduction bands [72]. Given this, it is difficult to eradicate the particle size effect on the band gap. It is possible to change the band structure and material attributes due to the reduction in the size of the particle with a reduction in band gap similarly resulting in greater particle size. Thus, the presence of smaller particle sizes can be associated with overlap, with s-electron and p-electron conduction bands separating in higher energy conditions. Research indicates low nuclear potential for electron conduction at a Fermi level distance far from the center of the particle, meaning that absorption energy and conduction band energy will be the same in the case of transitions within the chosen quantum numbers. Higher calcination temperatures were associated with lower band gap values (Table 1), and it is suggested that the rise in temperature may cause an incremental increase in the absorption coefficient because of an increase of defected states. Electron-hole pairs are produced through photon absorption, generating a field that could change the optical attributes and electronic structure of nanoparticle products.

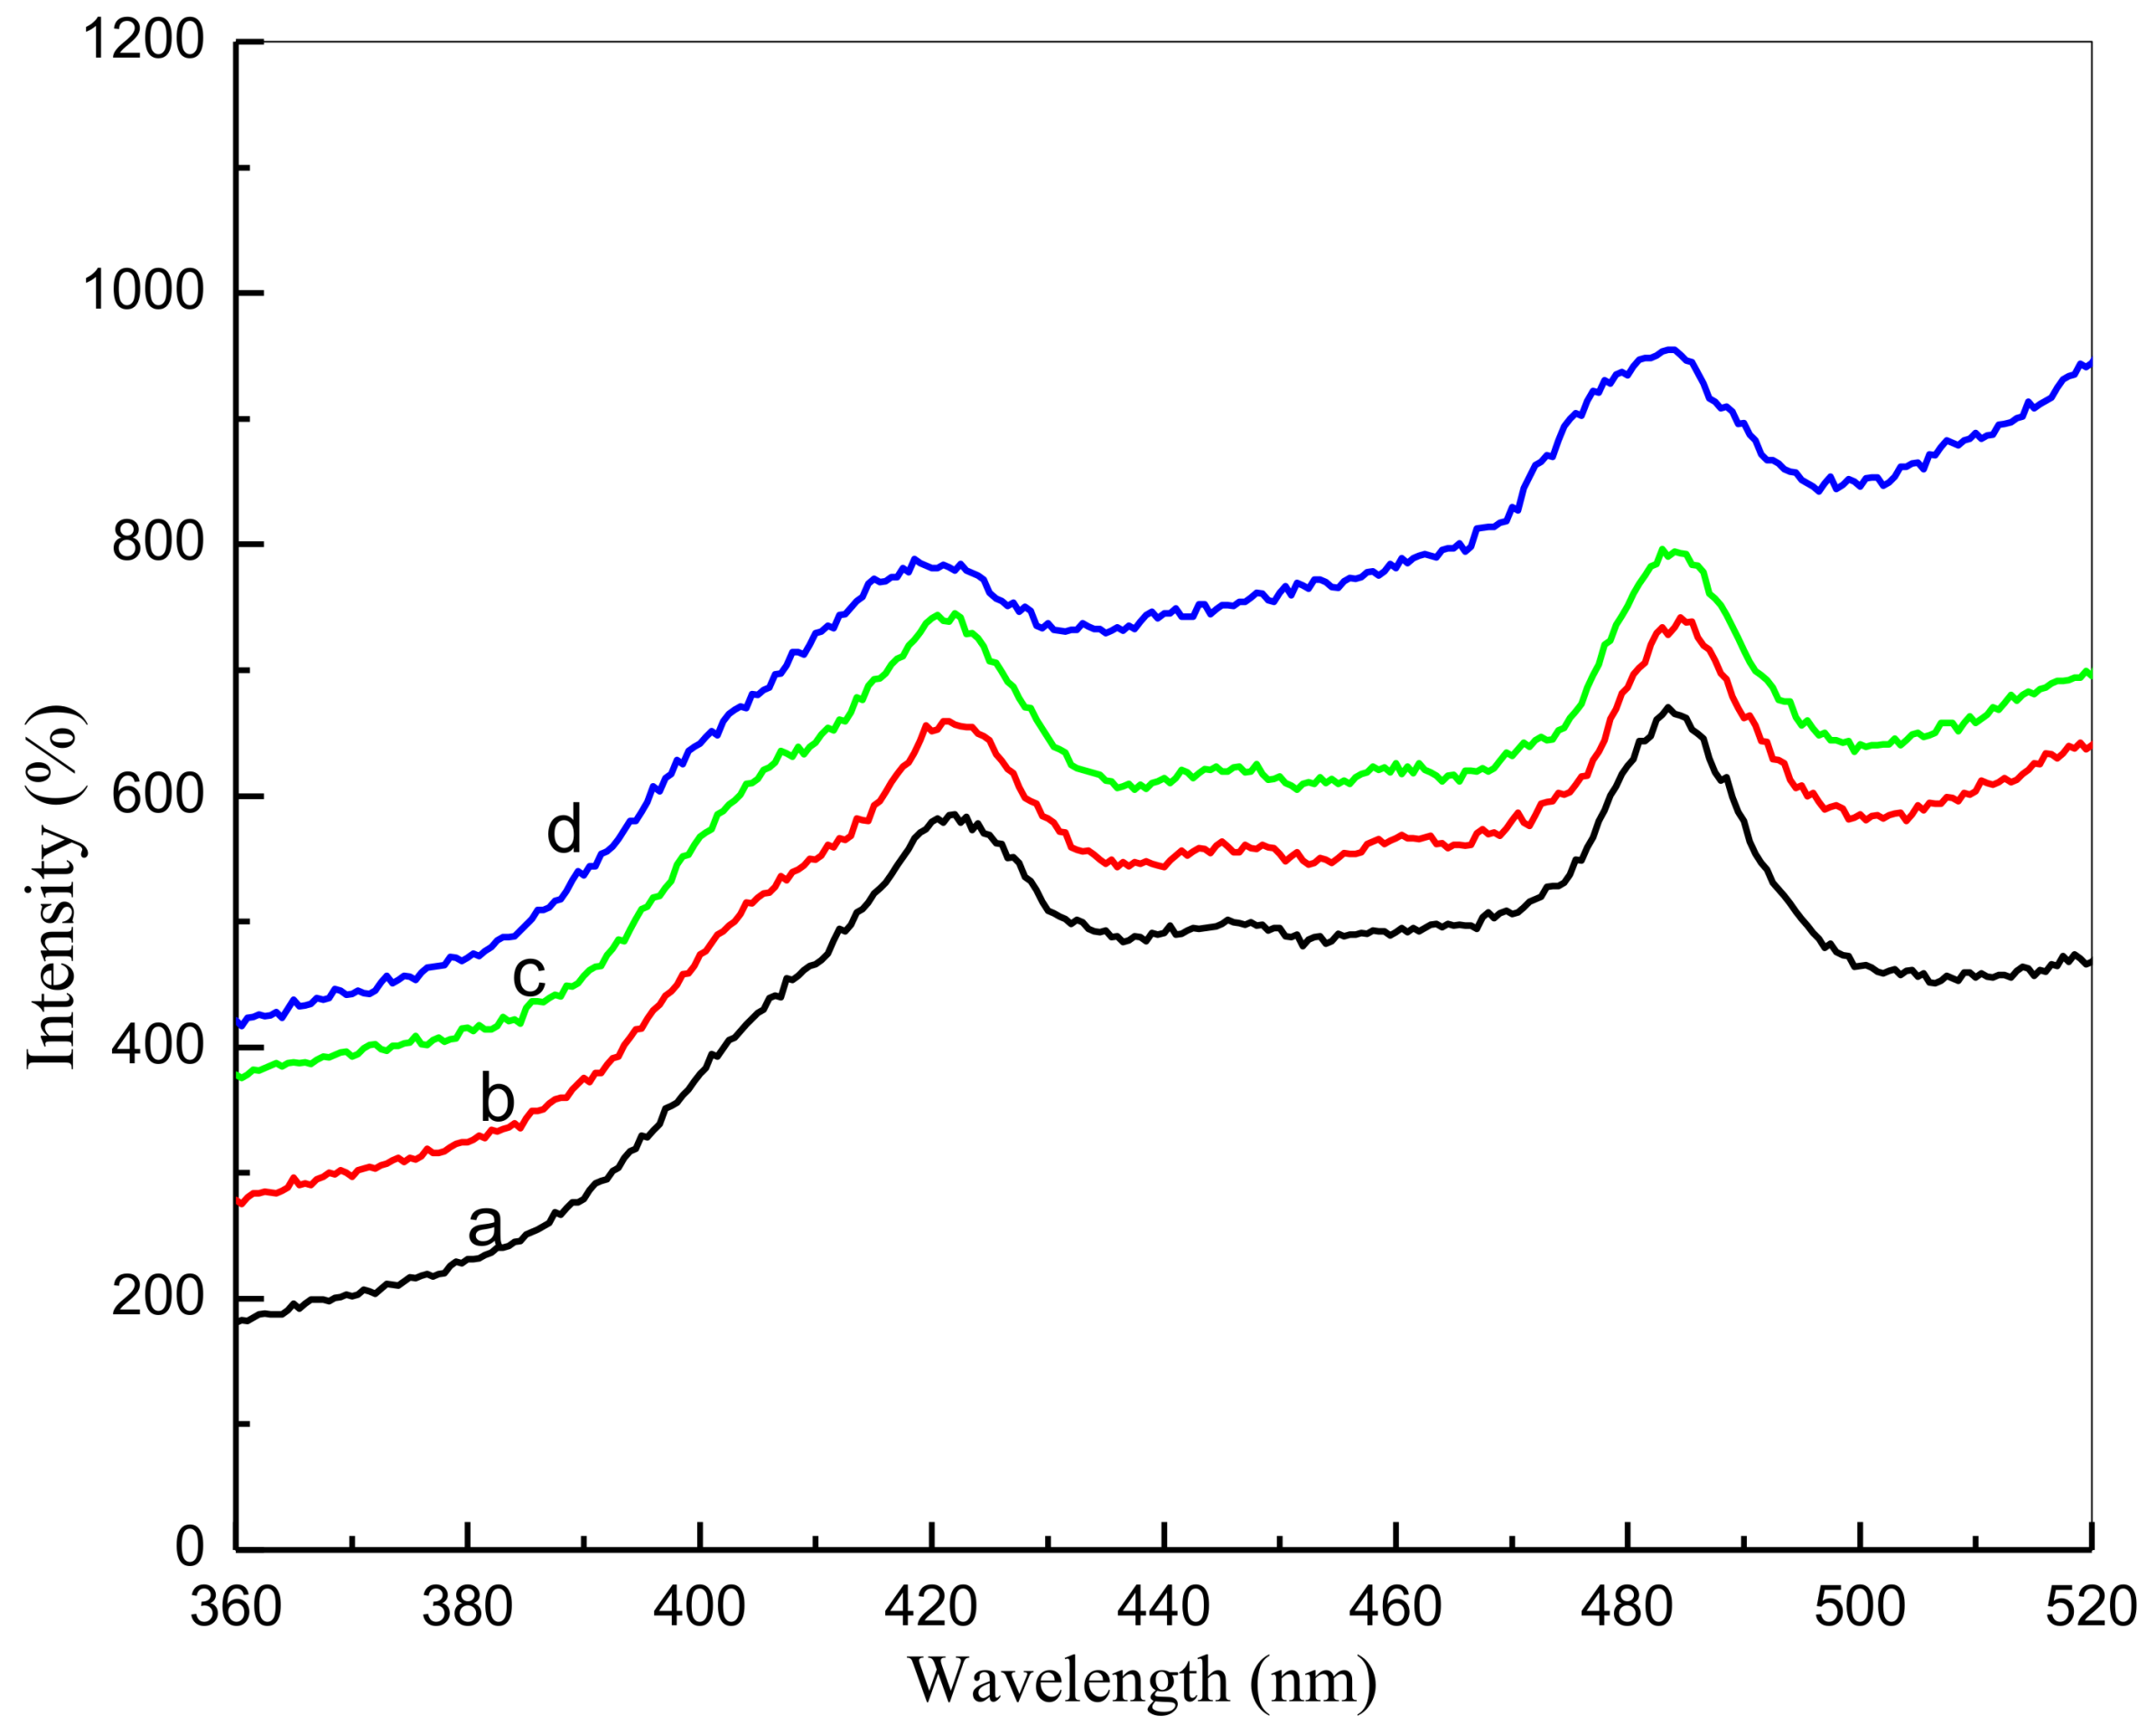
3.9. Photoluminescence Studies

Room temperature nanoparticle photoluminescence (PL) spectra were acquired as part of the analyses with Figure 9 demonstrating a broad emission scattering of approximately 425 nm to 487 nm for the PVP-prepared tin oxide nanoparticles. This is believed to be due to the compounded effect and energy states within the valence and conduction bands [73]. The first peak is believed to be caused by the recombination of electron-hole pairs in oxygen and metal vacancies, with the second peak being evident in the PL spectra of the nanoparticles transitioning between valence and conduction bands [74,75]. As the calcination temperature increases, intensification of the PL is demonstrated, with the greatest intensity shown at a temperature of 800 °C (also the point of ultimate crystallinity).

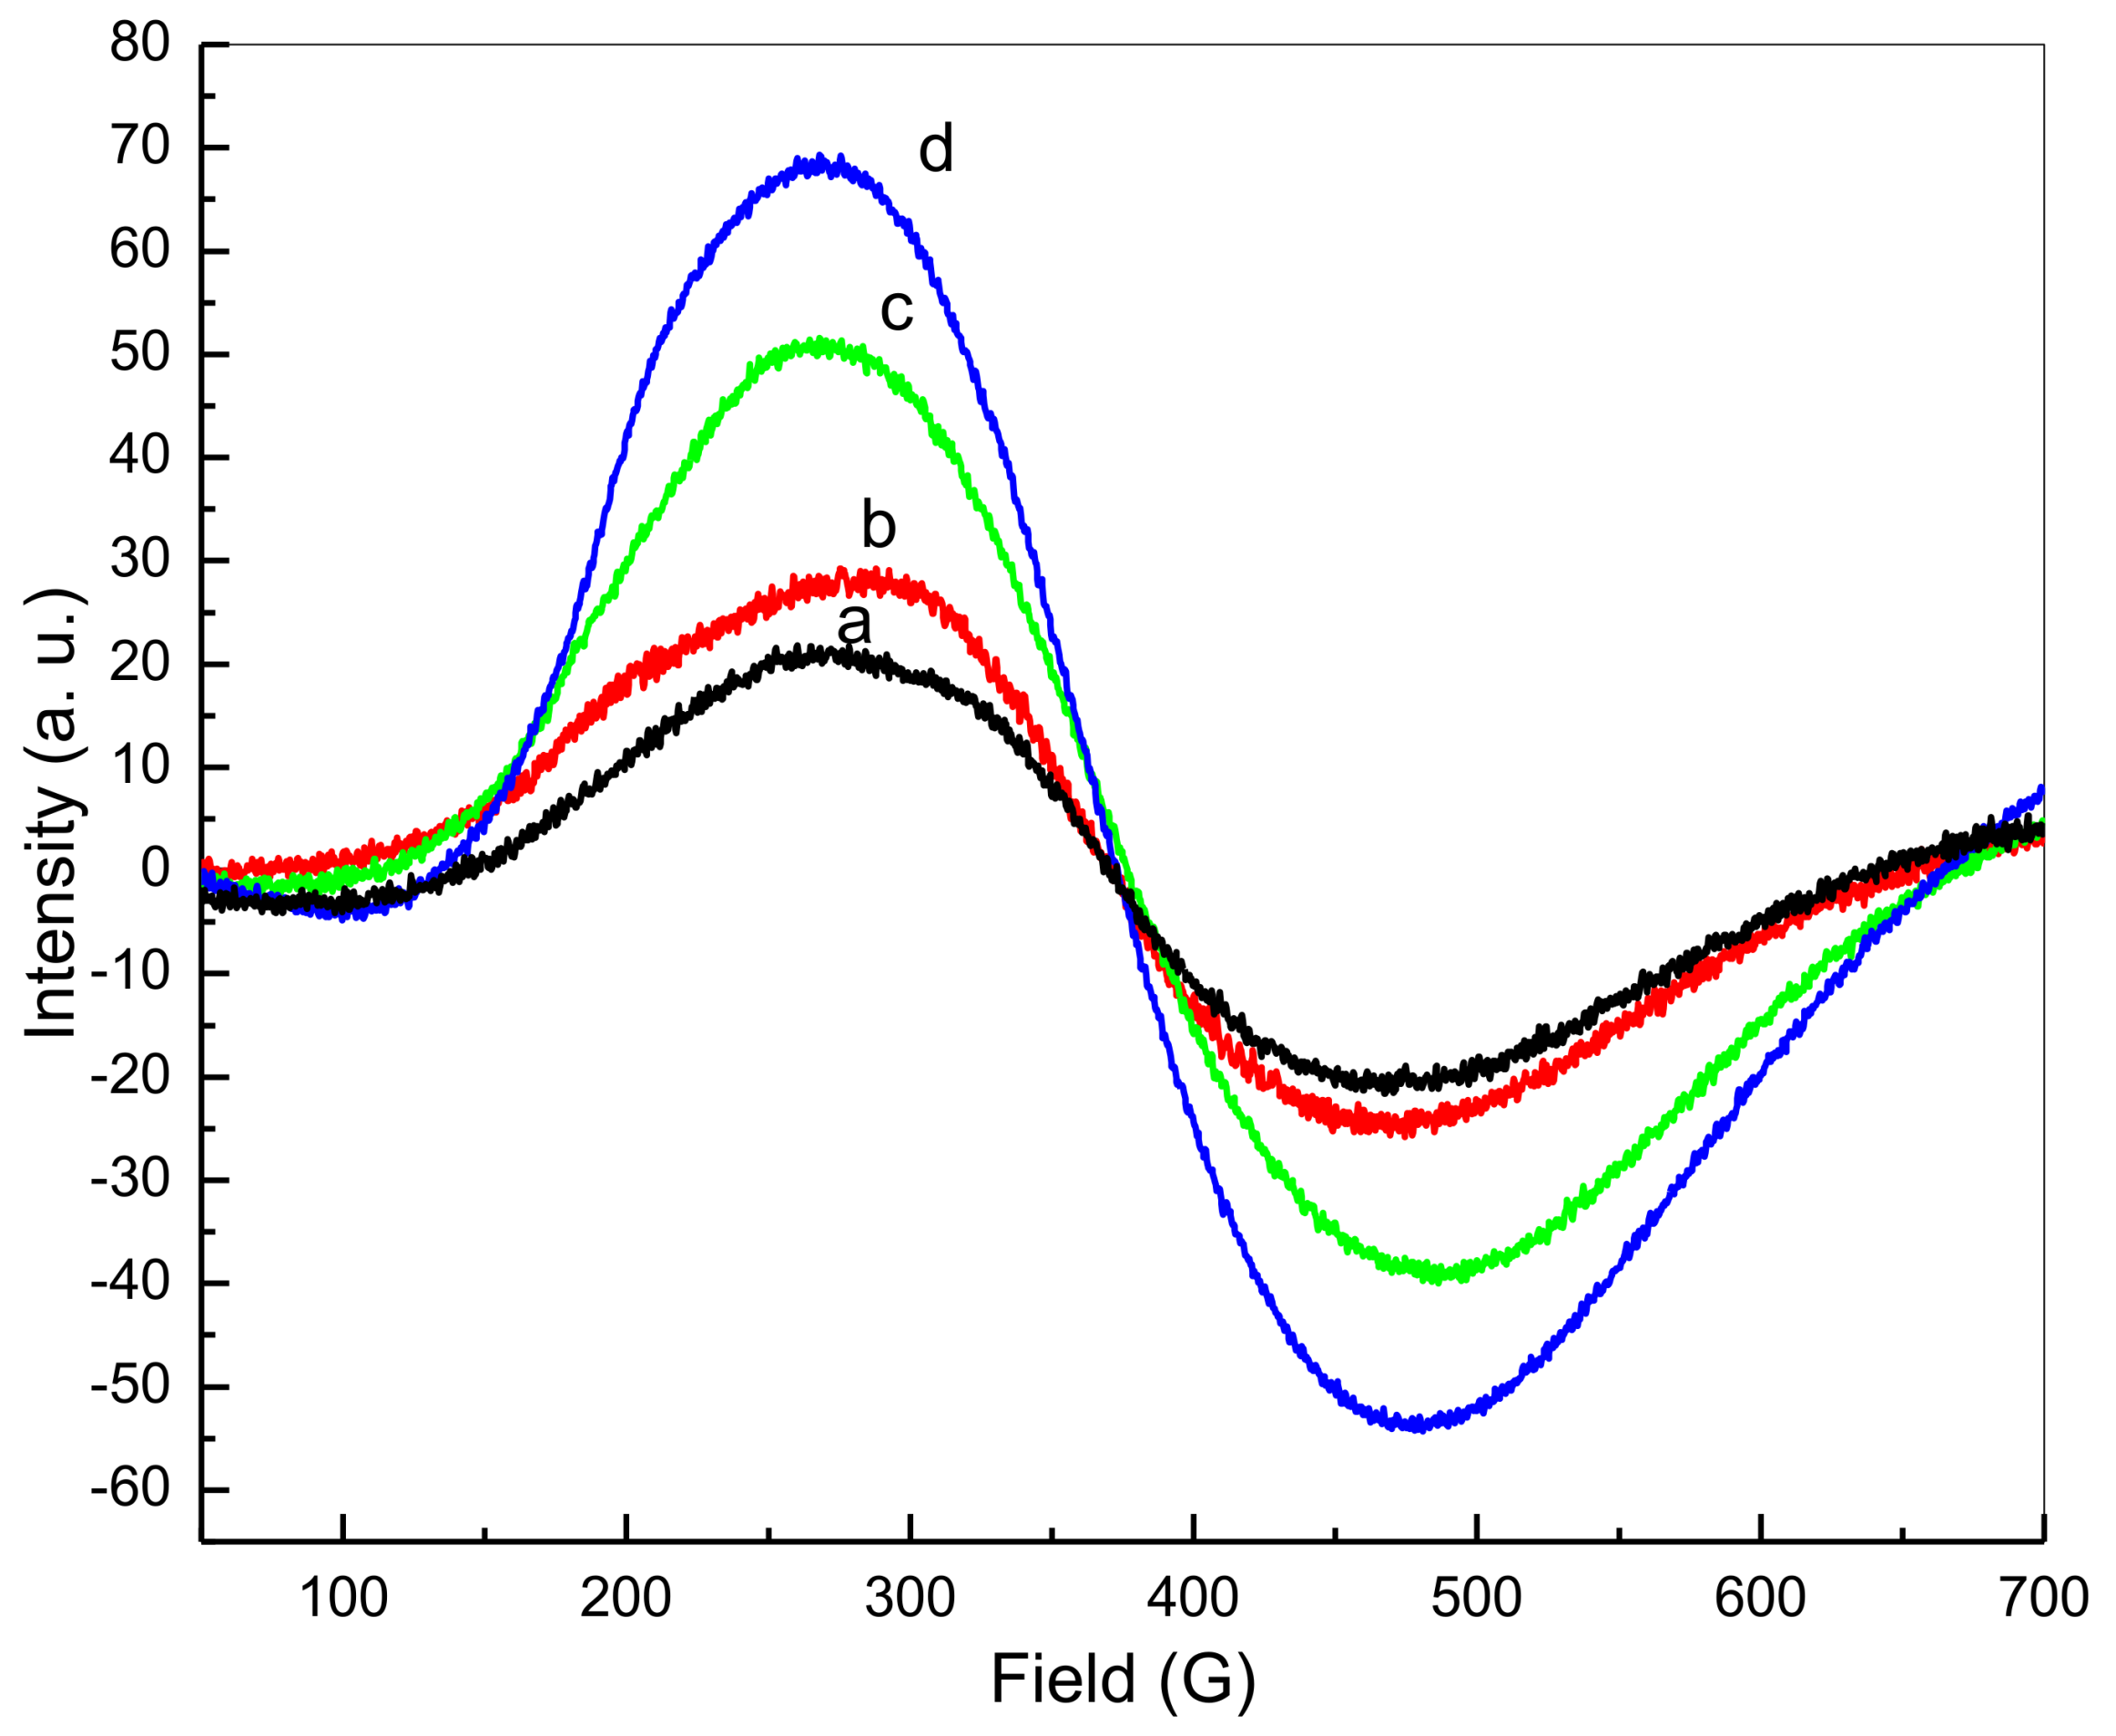
3.10. Electron Spin Resonance

Figure 10 illustrates the electron spin resonance (ESR) spectrum for different calcination temperatures, with symmetry and a broad scope demonstrated. This is due to the presence of unpaired transition Sn2+ ion conduction electrons, which were present across all samples at all temperatures, indicating paramagnetic attributes. Between 377.183 G and 370.590 G, the overall resonant magnetic field appeared to decrease, with calcination temperatures increasing from 500 °C to 800 °C (Table 3). Different calcination temperatures were also found to be associated with a g-factor increase from 1.7395 to 1.7703, demonstrating that the increase in temperatures occurred in line with a rise in the inner-magnetic field. Thus, the results suggest that an increase in particle size results in increased magnetic attributes. The following equation can be used to express the g-factor value [76]:
g = (hv)/(βHr)
where h is Planck’s constant, v is microwave frequency, β is the Bohr magneton (9.274 × 10⁻²⁴ J/T), and Hr is the resonant magnetic field. It is anticipated that an increase in g-factor will result in a decrease in the resonant magnetic field (Hr). This being said, the EPR spectroscopy results suggest that v values are constants. Previous research on SnO2 nanoparticles has also confirmed this increase in g-factor, decrease in Hr, and the resulting increase in magnetization.

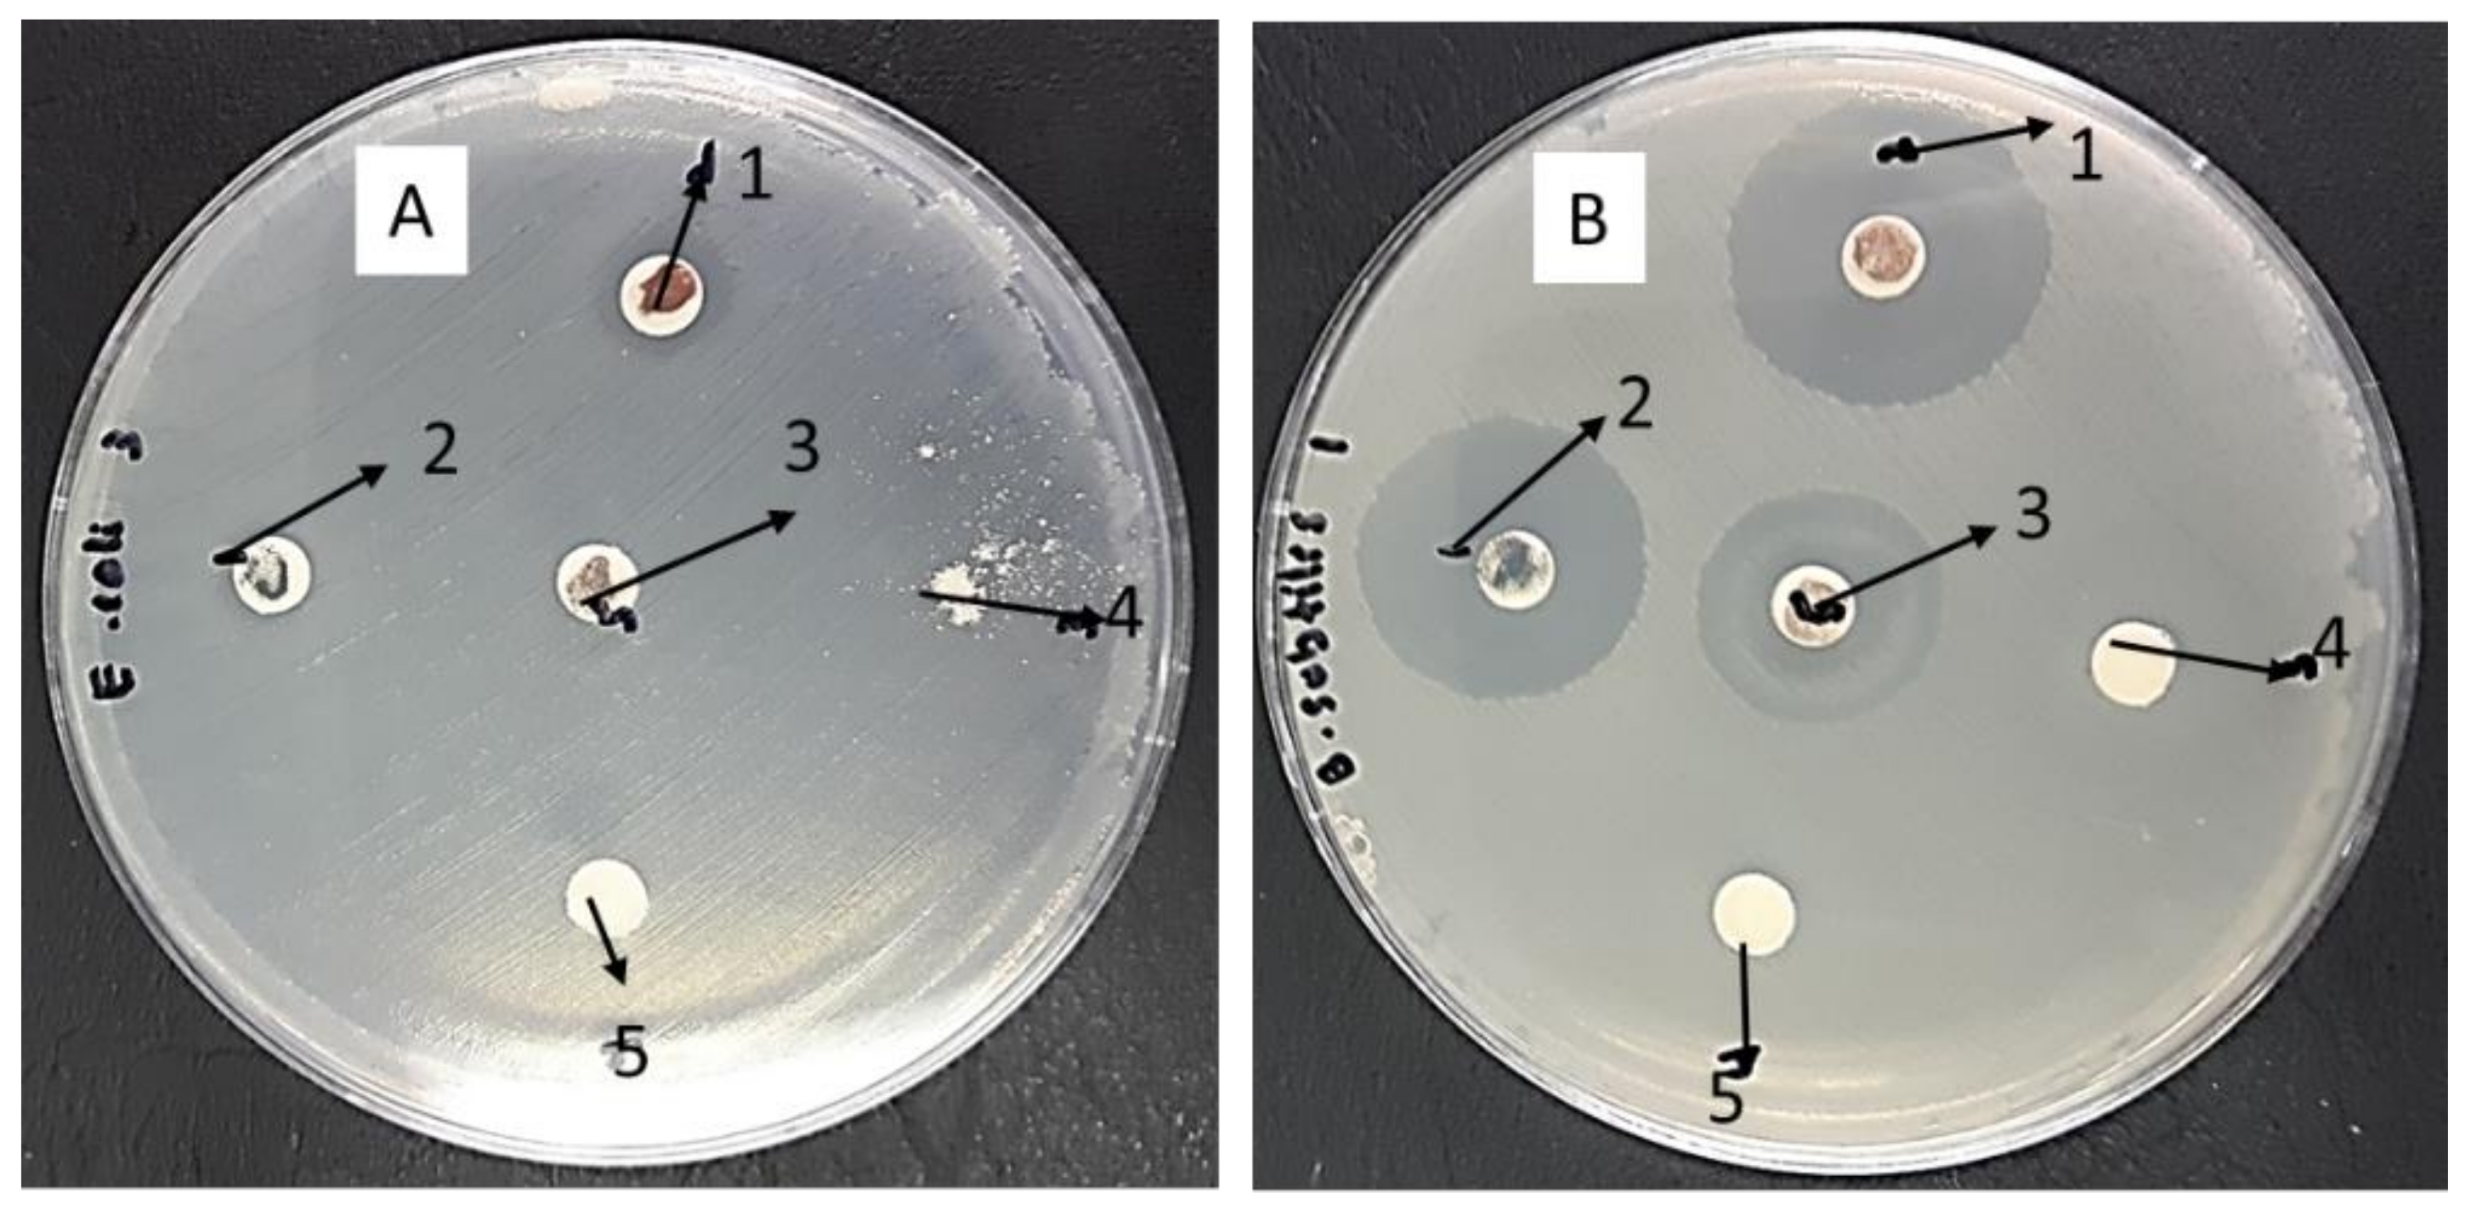
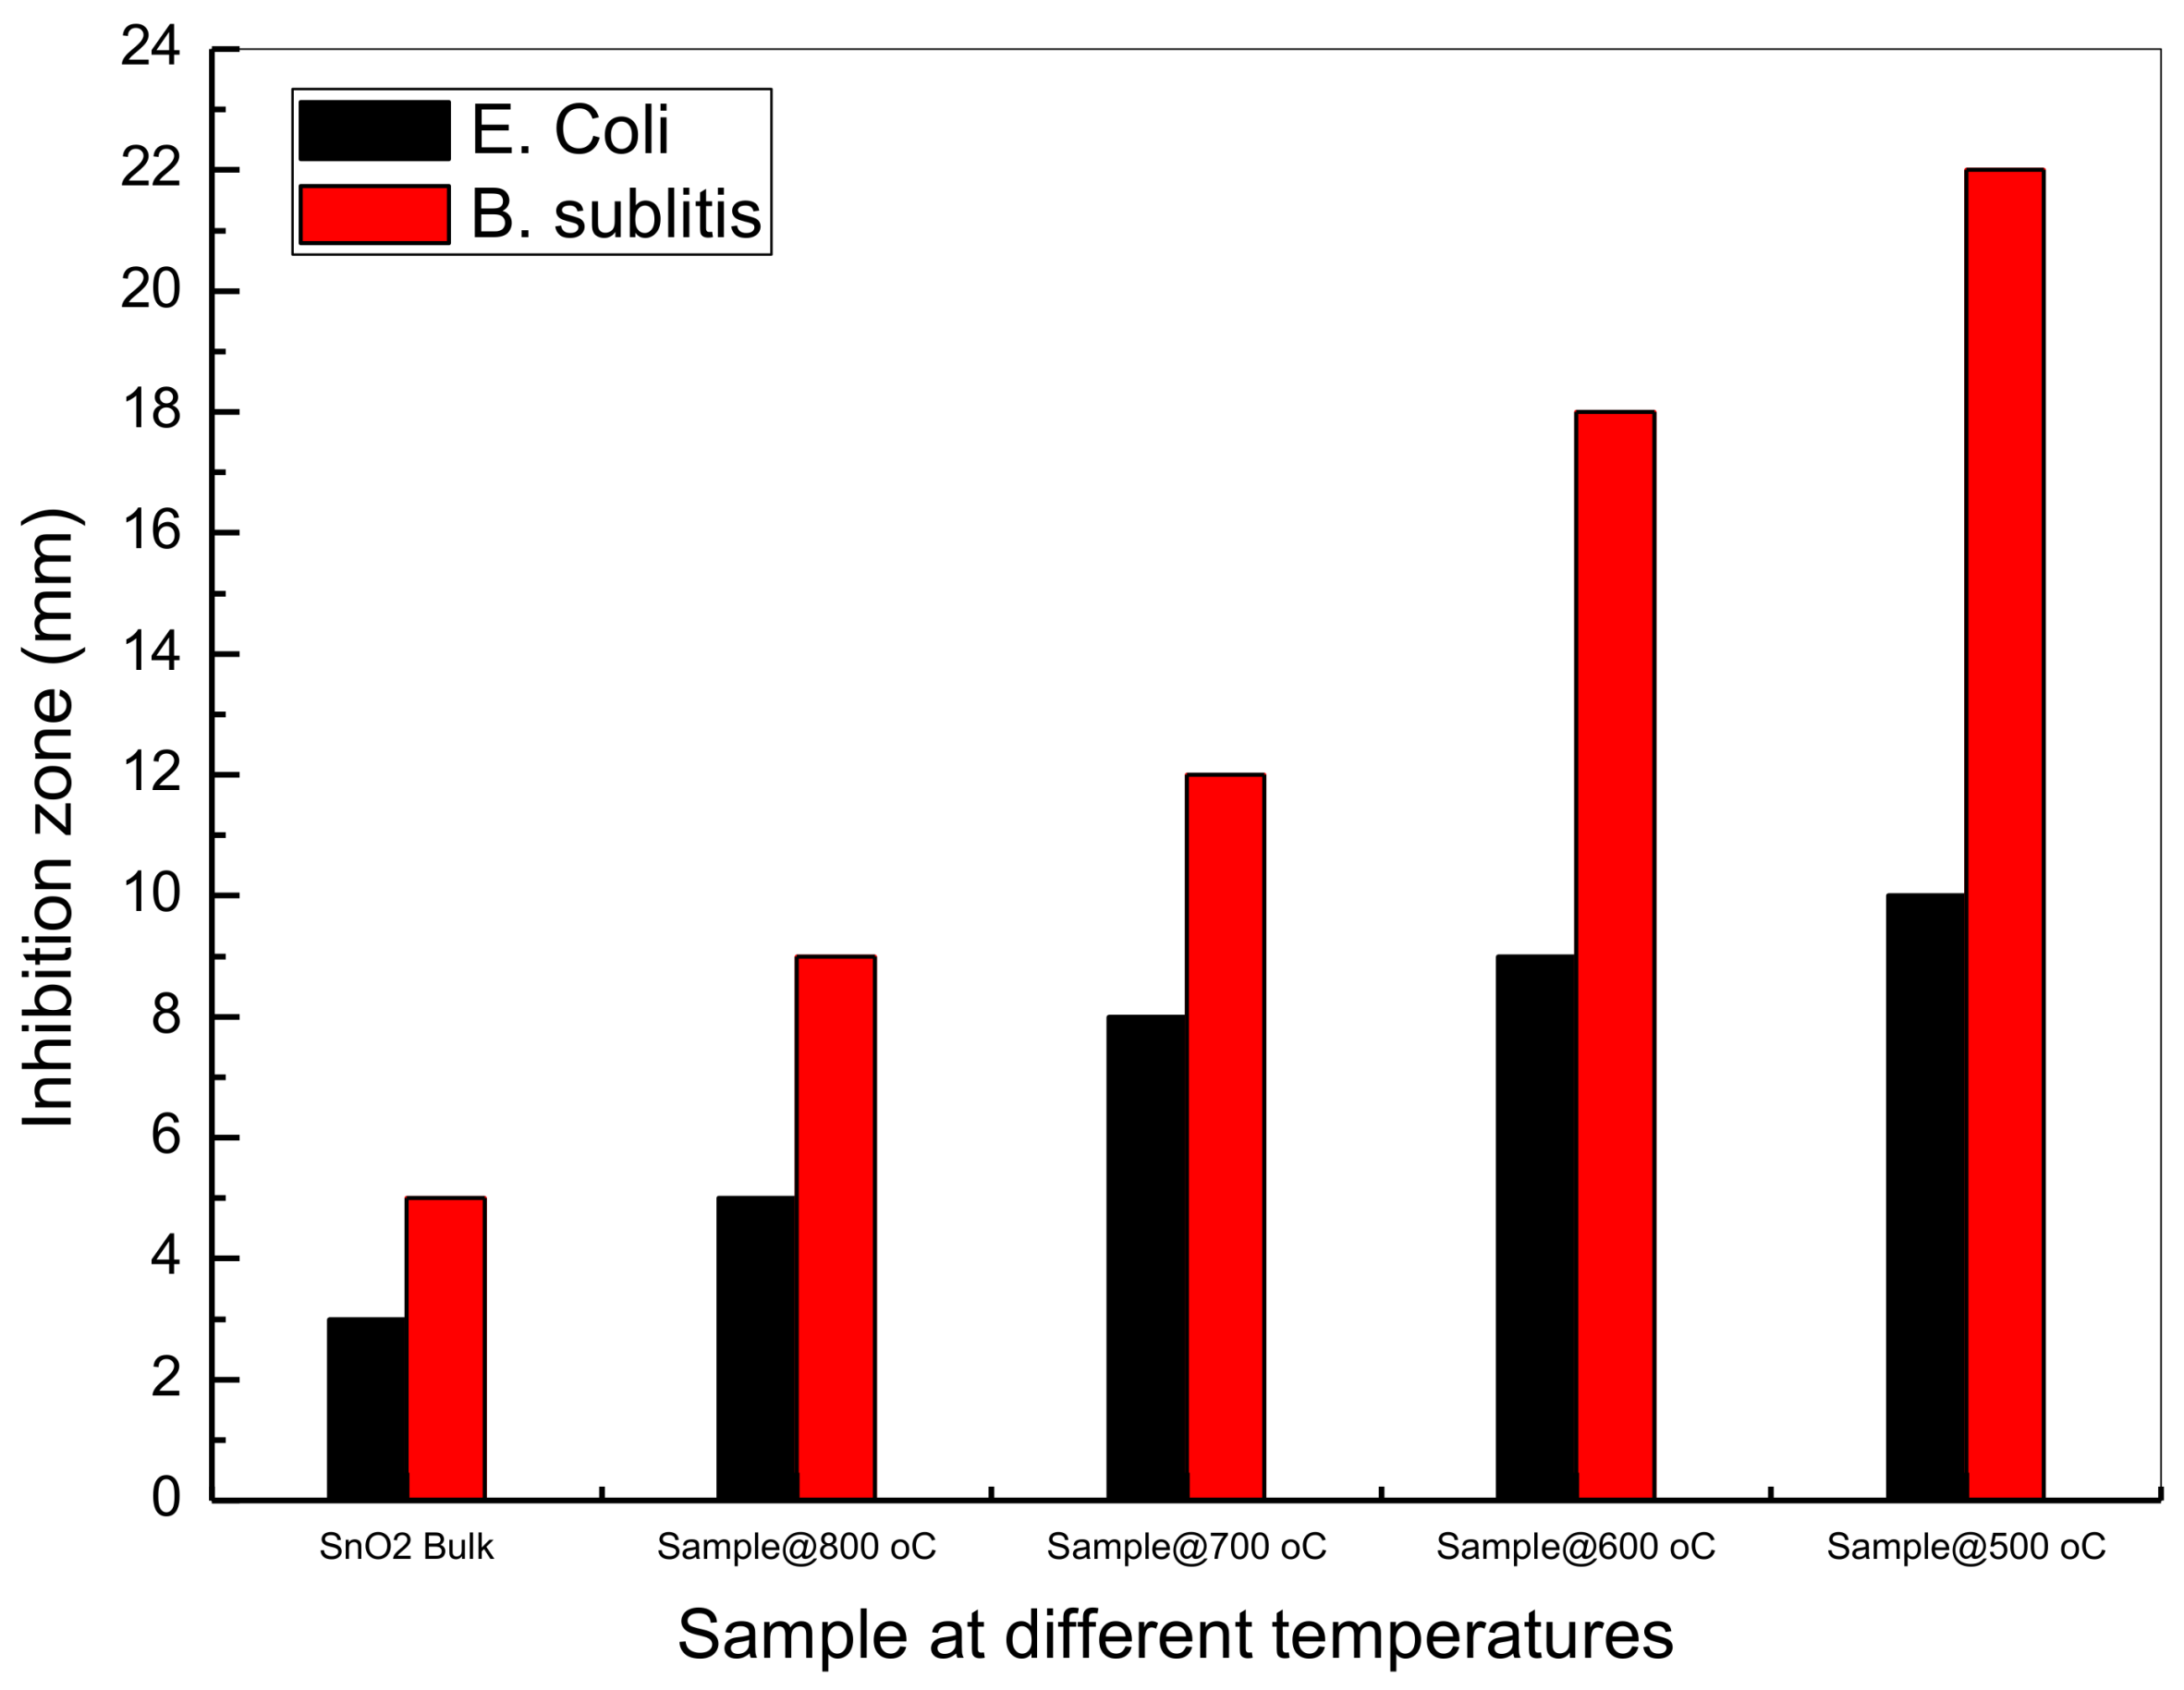
3.11. Antibacterial Activity

The bulk SnO2 nanoparticles and SnO2 nanoparticles were tested for antimicrobial activity in relation to Escherichia coli ATCC 25922 Gram (−ve) and Bacillus subtilis UPMC 1175 Gram (+ve) (Figure 11 and Figure 12), with inhibition zone diameters used with the agar plates shown in millimeters. Higher activity was observed in the nanoparticle samples (1 at 500 °C, 2 at 600 °C, 3 at 700 °C, and 4 at 800 °C), with lower activity observed in the bulk suspensions (5).
The higher antimicrobial activity in the nanoparticle samples can be explained in several ways. The first mechanism could be particle size, with size being found to decrease as antimicrobial activity increases [53]. Secondly, it is suggested that antimicrobial activity may be significantly impacted by Sn2+ ions [77]. The increase in antimicrobial activity resulting from either mechanism has been found to be effective in curtailing E. coli E266 N B. subtilis B29 N S. Furthermore, research indicates that even after peroxide treatment, which is believed to interrupt antimicrobial activity, the highly bactericidal SnO2 nanoparticles have been found to maintain their antimicrobial effectiveness [78,79]. The reason for this is believed to be the metal oxide nanoparticles covering the perimeter of the bacterial surface membrane. It should also be highlighted that research in cell inhibition has more commonly focused on SnO2 nanoparticles than on the use of traditional antibiotics, suggesting that many researchers may explore biomedical applications of nanoparticles over the coming years.

4. Conclusions

The results of this study demonstrate the effectiveness of thermal calcination to produce tin oxide nanoparticles. Here, the results of the XRD analysis confirmed the formation of tetragonal crystalline nanoparticles at several different calcination temperatures, with temperature also being found to increase particle size (ranging from 4 nm to 16 nm between 500 °C and 800 °C, respectively). Grain and regular morphology was identified through the conduction of SEM analysis, with EDX analysis also confirming the existence of Sn and O atoms following calcination. Their vibrational characteristics were captured based on FT-IR spectra. UV-vis absorption spectrophotometry analysis also revealed an inverse relationship between calcination temperature and optical bandgap, with a positive correlation found between particle size and photoluminescence intensity, as per the PL spectra. The results support the value of SnO2 application in the field of solar cell technology, with the absorption of specific solar energy wavelengths explored.
Finally, antimicrobial activity was tested against both Escherichia coli ATCC 25922 Gram (−ve) and Bacillus subtilis UPMC 1175 Gram (+ve), with the results of the analysis indicating that the SnO2 nanoparticle achieves effective antimicrobial action against Bacillus subtilis UPMC 1175 Gram (+ve) at a 22 mm inhibition zone. The robustness of the methodology adopted in this study has been verified by several additional tests, with the chosen model shown to have much value in further nanotechnology and biomedical research.

Acknowledgments

The author appreciates the financial support for this research from Universiti Putra Malaysia under grant (9597200).

Author Contributions

N.M.A.-H. and A.A.B. conceived and designed the experiments; N.M.A.-H. and A.A.B. performed the experiments; N.M.A.-H., H.M.K., A.H.S., E.S. and A.A.B. analyzed the data; N.M.A.-H., H.M.K. and A.A.B. contributed reagents/materials/analysis tools; N.M.A.-H. and H.M.K. wrote the paper.

Conflicts of Interest

The authors declare no conflict of interest.

References

  1. Glotzer, S.C.; Nordlander, P.; Fernandez, L.E. Theory, Simulation, and Computation in Nanoscience and Nanotechnology. ACS Nano 2017, 11, 6505–6506. [Google Scholar] [CrossRef] [PubMed]
  2. Petersen, N.O. Foundations for Nanoscience and Nanotechnology; CRC Press: Boca Raton, FL, USA, 2017. [Google Scholar]
  3. Dowling, A.P. Development of nanotechnologies. Mater. Today 2004, 7, 30–35. [Google Scholar] [CrossRef]
  4. Finardi, U. Nanosciences and nanotechnologies: Evolution trajectories and disruptive features. In Nanotechnology: Concepts, Methodologies, Tools, and Applications; IGI Global: Hershey, PA, USA, 2014; pp. 1–20. [Google Scholar]
  5. Jain, G.; Kumar, R. Electrical and optical properties of tin oxide and antimony doped tin oxide films. Opt. Mater. 2004, 26, 27–31. [Google Scholar] [CrossRef]
  6. Arai, T. The study of the optical properties of conducting Tin oxide films and their interpretation in terms of a tentative band scheme. J. Phys. Soc. Jpn. 1960, 15, 916–927. [Google Scholar] [CrossRef]
  7. Reddaway, S.; Wright, D. The optical properties of tin oxide crystals. Br. J. Appl. Phys. 1965, 16, 195. [Google Scholar] [CrossRef]
  8. Al-Hamdi, A.M.; Rinner, U.; Sillanpää, M. Tin dioxide as a photocatalyst for water treatment: A review. Process Saf. Environ. Prot. 2017, 107, 190–205. [Google Scholar] [CrossRef]
  9. Batzill, M.; Diebold, U. The surface and materials science of tin oxide. Prog. Surf. Sci. 2005, 79, 47–154. [Google Scholar] [CrossRef]
  10. Kruis, F.E.; Fissan, H.; Peled, A. Synthesis of nanoparticles in the gas phase for electronic, optical and magnetic applications—A review. J. Aerosol. Sci. 1998, 29, 511–535. [Google Scholar] [CrossRef]
  11. Goyal, R.N.; Gupta, V.K.; Oyama, M.; Bachheti, N. Gold nanoparticles modified indium tin oxide electrode for the simultaneous determination of dopamine and serotonin: Application in pharmaceutical formulations and biological fluids. Talanta 2007, 72, 976–983. [Google Scholar] [CrossRef] [PubMed]
  12. Leite, E.; Weber, I.; Longo, E.; Varela, J.A. A new method to control particle size and particle size distribution of SnO2 nanoparticles for gas sensor applications. Adv. Mater. 2000, 12, 965–968. [Google Scholar] [CrossRef]
  13. Ahmed, A.S.; Azam, A.; Muhamed Shafeeq, M.; Chaman, M.; Tabassum, S. Temperature dependent structural and optical properties of tin oxide nanoparticles. J. Phys. Chem. Solids 2012, 73, 943–947. [Google Scholar] [CrossRef]
  14. Demir-Cakan, R.; Hu, Y.-S.; Antonietti, M.; Maier, J.; Titirici, M.-M. Facile one-pot synthesis of mesoporous SnO2 microspheres via nanoparticles assembly and lithium storage properties. Chem. Mater. 2008, 20, 1227–1229. [Google Scholar] [CrossRef]
  15. Chiu, H.-C.; Yeh, C.-S. Hydrothermal synthesis of SnO2 nanoparticles and their gas-sensing of alcohol. J. Phys. Chem. C 2007, 111, 7256–7259. [Google Scholar] [CrossRef]
  16. Sharghi, H.; Ebrahimpourmoghaddam, S.; Memarzadeh, R.; Javadpour, S. Tin oxide nanoparticles (NP-SnO2): Preparation, characterization and their catalytic application in the knoevenagel condensation. J. Iran. Chem. Soc. 2013, 10, 141–149. [Google Scholar] [CrossRef]
  17. Dou, X.; Sabba, D.; Mathews, N.; Wong, L.H.; Lam, Y.M.; Mhaisalkar, S. Hydrothermal synthesis of high electron mobility Zn-doped SnO2 nanoflowers as photoanode material for efficient dye-sensitized solar cells. Chem. Mater. 2011, 23, 3938–3945. [Google Scholar] [CrossRef]
  18. Ramasamy, E.; Lee, J. Ordered mesoporous SnO2−based photoanodes for high-performance dye-sensitized solar cells. J. Phys. Chem. C 2010, 114, 22032–22037. [Google Scholar] [CrossRef]
  19. Li, F.; Song, J.; Yang, H.; Gan, S.; Zhang, Q.; Han, D.; Ivaska, A.; Niu, L. One-step synthesis of graphene/SnO2 nanocomposites and its application in electrochemical supercapacitors. Nanotechnology 2009, 20, 455602. [Google Scholar] [CrossRef] [PubMed]
  20. Zhu, J.; Lu, Z.; Aruna, S.; Aurbach, D.; Gedanken, A. Sonochemical synthesis of SnO2 nanoparticles and their preliminary study as Li insertion electrodes. Chem. Mater. 2000, 12, 2557–2566. [Google Scholar] [CrossRef]
  21. Wang, Y.; Lee, J.Y.; Zeng, H.C. Polycrystalline SnO2 nanotubes prepared via infiltration casting of nanocrystallites and their electrochemical application. Chem. Mater. 2005, 17, 3899–3903. [Google Scholar] [CrossRef]
  22. Jiang, L.-Y.; Wu, X.-L.; Guo, Y.-G.; Wan, L.-J. SnO2-based hierarchical nanomicrostructures: Facile synthesis and their applications in gas sensors and lithium-ion batteries. J. Phys. Chem. C 2009, 113, 14213–14219. [Google Scholar] [CrossRef]
  23. Lou, X.W.; Chen, J.S.; Chen, P.; Archer, L.A. One-pot synthesis of carbon-coated SnO2 nanocolloids with improved reversible lithium storage properties. Chem. Mater. 2009, 21, 2868–2874. [Google Scholar] [CrossRef]
  24. Roopan, S.M.; Khan, F.R.N. SnO2 nanoparticles mediated nontraditional synthesis of biologically active 9-chloro-6, 13-dihydro-7-phenyl-5h-indolo [3, 2-c]-acridine derivatives. Med. Chem. Res. 2011, 20, 732–737. [Google Scholar] [CrossRef]
  25. Srivastava, N.; Mukhopadhyay, M. Biosynthesis of SnO2 nanoparticles using bacterium erwinia herbicola and their photocatalytic activity for degradation of dyes. Ind. Eng. Chem. Res. 2014, 53, 13971–13979. [Google Scholar] [CrossRef]
  26. Arularasu, M.; Anbarasu, M.; Poovaragan, S.; Sundaram, R.; Kanimozhi, K.; Magdalane, C.M.; Kaviyarasu, K.; Thema, F.; Letsholathebe, D.; Mola, G.T. Structural, optical, morphological and microbial studies on SnO2 nanoparticles prepared by co-precipitation method. J. Nanosci. Nanotechnol. 2018, 18, 3511–3517. [Google Scholar] [CrossRef] [PubMed]
  27. Wang, Z.; Al-Jawhari, H.A.; Nayak, P.K.; Caraveo-Frescas, J.; Wei, N.; Hedhili, M.N.; Alshareef, H.N. Low temperature processed complementary metal oxide semiconductor (CMOS) device by oxidation effect from capping layer. Sci. Rep. 2015, 5, 9617. [Google Scholar] [CrossRef] [PubMed]
  28. Gu, F.; Wang, S.F.; Lü, M.K.; Zhou, G.J.; Xu, D.; Yuan, D.R. Photoluminescence properties of SnO2 nanoparticles synthesized by sol-gel method. J. Phys. Chem. B 2004, 108, 8119–8123. [Google Scholar] [CrossRef]
  29. Pereira, M.; Lima, F.; Silva, C.; Freire, P.; Vasconcelos, I. Structural, morphological and optical properties of SnO2 nanoparticles obtained by a proteic sol-gel method and their application in dye-sensitized solar cells. J. Sol-Gel Sci. Technol. 2017, 84, 206–213. [Google Scholar] [CrossRef]
  30. Davar, F.; Salavati-Niasari, M.; Fereshteh, Z. Synthesis and characterization of SnO2 nanoparticles by thermal decomposition of new inorganic precursor. J. Alloys Compd. 2010, 496, 638–643. [Google Scholar] [CrossRef]
  31. Wang, J.; Xie, S.; Cao, D.; Lu, X.; Meng, L.; Yang, G.; Wang, H. Facile synthesis of ultrafine SnO2 nanoparticles on graphene nanosheets via thermal decomposition of tin-octoate as anode for lithium ion batteries. J. Nanopart. Res. 2016, 18, 280. [Google Scholar] [CrossRef]
  32. Ponzoni, C.; Cannio, M.; Boccaccini, D.; Bahl, C.; Agersted, K.; Leonelli, C. Ultrafast microwave hydrothermal synthesis and characterization of Bi1−XLaXFeO3 micronized particles. Mater. Chem. Phys. 2015, 162, 69–75. [Google Scholar] [CrossRef]
  33. Wu, S.; Dai, W. Microwave-hydrothermal synthesis of SnO2-CNTs hybrid nanocomposites with visible light photocatalytic activity. Nanomaterials 2017, 7, 54. [Google Scholar] [CrossRef] [PubMed]
  34. Gaber, A.; Abdel-Rahim, M.; Abdel-Latief, A.; Abdel-Salam, M.N. Influence of calcination temperature on the structure and porosity of nanocrystalline SnO2 synthesized by a conventional precipitation method. Int. J. Electrochem. Sci. 2014, 9, 81–95. [Google Scholar]
  35. Chu, G.-W.; Zeng, Q.-H.; Shen, Z.-G.; Zou, H.-K.; Chen, J.-F. Preparation of SnO2 nanoparticles using a helical tube reactor via continuous hydrothermal route. Chem. Eng. J. 2014, 253, 78–83. [Google Scholar] [CrossRef]
  36. Zhu, H.; Yang, D.; Yu, G.; Zhang, H.; Yao, K. A simple hydrothermal route for synthesizing SnO2 quantum dots. Nanotechnology 2006, 17, 2386. [Google Scholar] [CrossRef]
  37. Soltan, W.B.; Mbarki, M.; Ammar, S.; Babot, O.; Toupance, T. Textural, structural and electrical properties of SnO2 nanoparticles prepared by the polyol method. J. Mater. Sci. Mater. Electron. 2015, 26, 1612–1618. [Google Scholar] [CrossRef]
  38. Selvi, E.T.; Sundar, S.M. Effect of mn doping on structural, optical and magnetic properties of SnO2 nanoparticles by solvothermal processing. J. Mater. Sci. Mater. Electron. 2017, 28, 15021–15032. [Google Scholar] [CrossRef]
  39. Parthibavarman, M.; Hariharan, V.; Sekar, C. High-sensitivity humidity sensor based on SnO2 nanoparticles synthesized by microwave irradiation method. Mater. Sci. Eng. C 2011, 31, 840–844. [Google Scholar] [CrossRef]
  40. Zhu, J.-J.; Zhu, J.-M.; Liao, X.-H.; Fang, J.-L.; Zhou, M.-G.; Chen, H.-Y. Rapid synthesis of nanocrystalline SnO2 powders by microwave heating method. Mater. Lett. 2002, 53, 12–19. [Google Scholar] [CrossRef]
  41. Parthibavarman, M.; Sathishkumar, S.; Prabhakaran, S. Enhanced visible light photocatalytic activity of tin oxide nanoparticles synthesized by different microwave optimum conditions. J. Mater. Sci. Mater. Electron. 2018, 29, 2341–2350. [Google Scholar] [CrossRef]
  42. Tran, V.-H.; Ambade, R.B.; Ambade, S.B.; Lee, S.-H.; Lee, I.-H. Low-temperature solution-processed SnO2 nanoparticles as a cathode buffer layer for inverted organic solar cells. ACS Appl. Mater. Interfaces 2017, 9, 1645–1653. [Google Scholar] [CrossRef] [PubMed]
  43. Hashem, M.; Saion, E.; Al-Hada, N.M.; Kamari, H.M.; Shaari, A.H.; Talib, Z.A.; Paiman, S.B.; Kamarudeen, M.A. Fabrication and characterization of semiconductor nickel oxide (NiO) nanoparticles manufactured using a facile thermal treatment. Results Phys. 2016, 6, 1024–1030. [Google Scholar] [CrossRef]
  44. Lee, P.J.; Saion, E.; Al-Hada, N.M.; Soltani, N. A simple up-scalable thermal treatment method for synthesis of ZnO nanoparticles. Metals 2015, 5, 2383–2392. [Google Scholar] [CrossRef]
  45. Salem, A.; Saion, E.; Al-Hada, N.M.; Kamari, H.M.; Shaari, A.H.; Abdullah, C.A.C.; Radiman, S. Synthesis and characterization of cdse nanoparticles via thermal treatment technique. Results Phys. 2017, 7, 1556–1562. [Google Scholar] [CrossRef]
  46. Salem, A.; Saion, E.; Al-Hada, N.M.; Kamari, H.M.; Shaari, A.H.; Radiman, S. Simple synthesis of ZnSe nanoparticles by thermal treatment and their characterization. Results Phys. 2017, 7, 1175–1180. [Google Scholar] [CrossRef]
  47. Zakiyah, L.B.; Saion, E.; Al-Hada, N.M.; Gharibshahi, E.; Salem, A.; Soltani, N.; Gene, S. Up-scalable synthesis of size-controlled copper ferrite nanocrystals by thermal treatment method. Mater. Sci. Semiconduct. Process. 2015, 40, 564–569. [Google Scholar] [CrossRef]
  48. Gene, S.A.; Saion, E.B.; Shaari, A.H.; Kamarudeen, M.A.; Al-Hada, N.M. Fabrication and characterization of nanospinel ZnCr2O4 using thermal treatement method. Adv. Mater. Res. 2015, 1107, 301–307. [Google Scholar] [CrossRef]
  49. Gene, S.A.; Saion, E.; Shaari, A.H.; Kamarudin, M.A.; Al-Hada, N.M.; Kharazmi, A. Structural, optical, and magnetic characterization of spinel zinc chromite nanocrystallines synthesised by thermal treatment method. J. Nanomater. 2014, 2014. [Google Scholar] [CrossRef]
  50. Baqer, A.A.; Matori, K.A.; Al-Hada, N.M.; Shaari, A.H.; Saion, E.; Chyi, J.L.Y. Synthesis, Structural and Optical Properties of Cerium Oxide Nanoparticles Prepared by Thermal Treatment Method; Solid State Phenomena: Zurich, Switzerland, 2017; pp. 132–137. [Google Scholar]
  51. Baqer, A.A.; Matori, K.A.; Al-Hada, N.M.; Shaari, A.H.; Saion, E.; Chyi, J.L.Y. Effect of polyvinylpyrrolidone on cerium oxide nanoparticle characteristics prepared by a facile heat treatment technique. Results Phys. 2017, 7, 611–619. [Google Scholar] [CrossRef]
  52. Kamari, H.M.; Al-Hada, N.M.; Saion, E.; Shaari, A.H.; Talib, Z.A.; Flaifel, M.H.; Ahmed, A.A.A. Calcined solution-based PVP influence on ZnO semiconductor nanoparticle properties. Crystals 2017, 7, 2. [Google Scholar] [CrossRef]
  53. Al-Hada, N.M.; Kamari, H.M.; Abdullah, C.A.C.; Saion, E.; Shaari, A.H.; Talib, Z.A.; Matori, K.A. Down-top nanofabrication of binary (CdO)x (ZnO)1–x nanoparticles and their antibacterial activity. Int. J. Nanomed. 2017, 12, 8309–8323. [Google Scholar] [CrossRef] [PubMed]
  54. Al-Hada, N.M.; Saion, E.; Kamari, H.M.; Flaifel, M.H.; Shaari, A.H.; Talib, Z.A.; Abdullahi, N.; Baqer, A.A.; Kharazmi, A. Structural, morphological and optical behaviour of PVP capped binary (ZnO)0.4(CdO)0.6 nanoparticles synthesised by a facile thermal route. Mater. Sci. Semiconduct. Process. 2016, 53, 56–65. [Google Scholar] [CrossRef]
  55. Izu, N.; Uchida, T.; Matsubara, I.; Itoh, T.; Shin, W.; Nishibori, M. Formation mechanism of monodispersed spherical core–shell ceria/polymer hybrid nanoparticles. Mater. Res. Bull. 2011, 46, 1168–1176. [Google Scholar] [CrossRef]
  56. Koczkur, K.M.; Mourdikoudis, S.; Polavarapu, L.; Skrabalak, S.E. Polyvinylpyrrolidone (PVP) in nanoparticle synthesis. Dalton Trans. 2015, 44, 17883–17905. [Google Scholar] [CrossRef] [PubMed]
  57. Thanh, N.T.; Maclean, N.; Mahiddine, S. Mechanisms of nucleation and growth of nanoparticles in solution. Chem. Rev. 2014, 114, 7610–7630. [Google Scholar] [CrossRef] [PubMed]
  58. Visaveliya, N.; Köhler, J.M. Control of shape and size of polymer nanoparticles aggregates in a single-step microcontinuous flow process: A case of flower and spherical shapes. Langmuir 2014, 30, 12180–12189. [Google Scholar] [CrossRef] [PubMed]
  59. Vallejos, S.; Selina, S.; Annanouch, F.E.; Gràcia, I.; Llobet, E.; Blackman, C. Aerosol assisted chemical vapour deposition of gas sensitive SnO2 and Au-functionalised SnO2 nanorods via a non-catalysed vapour solid (vs.) mechanism. Sci. Rep. 2016, 6, 28464. [Google Scholar] [CrossRef] [PubMed]
  60. Patil, P.S.; Kawar, R.K.; Seth, T.; Amalnerkar, D.P.; Chigare, P.S. Effect of substrate temperature on structural, electrical and optical properties of sprayed tin oxide (SnO2) thin films. Ceram. Int. 2003, 29, 725–734. [Google Scholar] [CrossRef]
  61. Tazikeh, S.; Akbari, A.; Talebi, A.; Talebi, E. Synthesis and characterization of tin oxide nanoparticles via the co-precipitation method. Mater. Sci. Pol. 2014, 32, 98–101. [Google Scholar] [CrossRef]
  62. Kolhe, P.S.; Koinkar, P.M.; Maiti, N.; Sonawane, K.M. Synthesis of Ag doped SnO2 thin films for the evaluation of H2S gas sensing properties. Phys. B Condens. Matter 2017, 524, 90–96. [Google Scholar] [CrossRef]
  63. Al-Hada, N.M.; Saion, E.B.; Shaari, A.H.; Kamarudin, M.A.; Flaifel, M.H.; Ahmad, S.H.; Gene, A. A facile thermal-treatment route to synthesize the semiconductor CdO nanoparticles and effect of calcination. Mater. Sci. Semiconduct. Process. 2014, 26, 460–466. [Google Scholar] [CrossRef]
  64. Al-Hada, N.M.; Saion, E.B.; Shaari, A.H.; Kamarudin, M.A.; Flaifel, M.H.; Ahmad, S.H.; Gene, S.A. A facile thermal-treatment route to synthesize ZnO nanosheets and effect of calcination temperature. PLoS ONE 2014, 9, e103134. [Google Scholar] [CrossRef] [PubMed]
  65. Al-Hada, N.M.; Saion, E.; Shaari, A.; Kamarudin, M.; Gene, S.A. The influence of calcination temperature on the formation of Zinc oxide nanoparticles by thermal-treatment. Appl. Mech. Mater. 2014, 446, 181–184. [Google Scholar] [CrossRef]
  66. Al-Hada, N.M.; Saion, E.; Talib, Z.A.; Shaari, A.H. The impact of polyvinylpyrrolidone on properties of cadmium oxide semiconductor nanoparticles manufactured by heat treatment technique. Polymers 2016, 8, 113. [Google Scholar] [CrossRef]
  67. Baqer, A.A.; Matori, K.A.; Al-Hada, N.M.; Kamari, H.M.; Shaari, A.H.; Saion, E.; Chyi, J.L.Y. Copper oxide nanoparticles synthesized by a heat treatment approach with structural, morphological and optical characteristics. J. Mater. Sci. Mater. Electron. 2018, 29, 1025–1033. [Google Scholar] [CrossRef]
  68. Baqer, A.A.; Matori, K.A.; Al-Hada, N.M.; Shaari, A.H.; Kamari, H.M.; Saion, E.; Chyi, J.L.Y.; Abdullah, C.A.C. Synthesis and characterization of of binary (CuO)0.6(CeO2)0.4 nanoparticles via a simple heat treatment method. Results Phys. 2018, 9, 471–478. [Google Scholar] [CrossRef]
  69. Moon, T.; Hwang, S.-T.; Jung, D.-R.; Son, D.; Kim, C.; Kim, J.; Kang, M.; Park, B. Hydroxyl-quenching effects on the photoluminescence properties of SnO2: Eu3+ nanoparticles. J. Phys. Chem. C 2007, 111, 4164–4167. [Google Scholar] [CrossRef]
  70. Stankovich, S.; Piner, R.D.; Chen, X.; Wu, N.; Nguyen, S.T.; Ruoff, R.S. Stable aqueous dispersions of graphitic nanoplatelets via the reduction of exfoliated graphite oxide in the presence of poly (sodium 4-styrenesulfonate). J. Mater. Chem. 2006, 16, 155–158. [Google Scholar] [CrossRef]
  71. Das, S.; Kim, D.-Y.; Choi, C.-M.; Hahn, Y.B. Structural evolution of SnO2 nanostructure from core–shell faceted pyramids to nanorods and its gas-sensing properties. J. Cryst. Growth 2011, 314, 171–179. [Google Scholar] [CrossRef]
  72. Choi, W.K.; Jung, H.J.; Koh, S.K. Chemical shifts and optical properties of tin oxide films grown by a reactive ion assisted deposition. J. Vac. Sci. Technol. A Vac. Surf. Films 1996, 14, 359–366. [Google Scholar] [CrossRef]
  73. Gu, F.; Wang, F.S.; Song, F.C.; Lü, K.M.; Qi, X.Y.; Zhou, J.G.; Xu, D.; Yuan, R.D. Synthesis and luminescence properties of SnO2 nanoparticles. Chem. Phys. Lett. 2003, 372, 451–454. [Google Scholar] [CrossRef]
  74. Kim, T.; Lee, D.; Yoon, Y. Microstructural, electrical, and optical properties of SnO2 nanocrystalline thin films grown on InP (100) substrates for applications as gas sensor devices. J. Appl. Phys. 2000, 88, 3759–3761. [Google Scholar] [CrossRef]
  75. Vanheusden, K.; Warren, W.; Seager, C.; Tallant, D.; Voigt, J.; Gnade, B. Mechanisms behind green photoluminescence in zno phosphor powders. J. Appl. Phys. 1996, 79, 7983–7990. [Google Scholar] [CrossRef]
  76. Chetri, P.; Choudhury, B.; Choudhury, A. Room temperature ferromagnetism in SnO2 nanoparticles: An experimental and density functional study. J. Mater. Chem. C 2014, 2, 9294–9302. [Google Scholar] [CrossRef]
  77. Kohen, R.; Nyska, A. Invited review: Oxidation of biological systems: Oxidative stress phenomena, antioxidants, redox reactions, and methods for their quantification. Toxicol. Pathol. 2002, 30, 620–650. [Google Scholar] [CrossRef] [PubMed]
  78. Vidhu, V.K.; Philip, D. Biogenic synthesis of SnO2 nanoparticles: Evaluation of antibacterial and antioxidant activities. Spectrochim. Acta Part A Mol. Biomol. Spectrosc. 2015, 134, 372–379. [Google Scholar] [CrossRef] [PubMed]
  79. Meena Kumari, M.; Philip, D. Synthesis of biogenic SnO2 nanoparticles and evaluation of thermal, rheological, antibacterial and antioxidant activities. Powder Technol. 2015, 270, 312–319. [Google Scholar] [CrossRef]
Figure 1. Nanoparticle growth mechanism.
Nanomaterials 08 00250 g001
Figure 2. Nanoparticle XRD patterns prepared at 30 °C/room temperature (a). with calcination at 500 °C (b), 600 °C (c), 700 °C (d), and 800 °C (e).
Nanomaterials 08 00250 g002
Figure 3. Nanoparticle SEM images at calcining temperatures of 500 °C (a), 600 °C (b), 700 °C (c) and 800 °C (d).
Nanomaterials 08 00250 g003
Figure 4. Nanoparticle EDX spectrum at 600 °C calcination.
Nanomaterials 08 00250 g004
Figure 5. Nanoparticle size distribution histogram and TEM micrographs at calcination temperatures of 500 °C (a,a’) 600 °C (b,b’) 700 °C (c,c’) and 800 °C (d,d’).
Nanomaterials 08 00250 g005
Figure 6. Nanoparticle FTIR spectra at the 280–4500 cm−1 range at room temperature (a) 500 °C (b), 600 °C (c), 700 °C (d), and 800 °C (e).
Nanomaterials 08 00250 g006
Figure 7. Nanoparticle XPS spectra for survey (a), tin (b), and oxygen (c).
Nanomaterials 08 00250 g007
Figure 8. Nanoparticle energy band gap at calcination temperatures of 500 °C (a), 600 °C (b), 700 °C (c), and 800 °C (d).
Nanomaterials 08 00250 g008
Figure 9. Nanoparticle photoluminescence at calcination temperatures of 500 °C (a), 600 °C (b), 700 °C (c), and 800 °C (d).
Nanomaterials 08 00250 g009
Figure 10. Nanoparticle ESR spectra at calcination temperatures of 500 °C (a), 600 °C (b), 700 °C (c), and 800 °C (d).
Nanomaterials 08 00250 g010
Figure 11. Inhibition zone test for Escherichia coli ATCC 25922 Gram (−ve) (A) and Bacillus subtilis UPMC 1175 Gram (+ve) (B), the nanoparticle samples (1 at 500 °C, 2 at 600 °C, 3 at 700 °C, and 4 at 800 °C), with lower activity observed in the bulk suspensions (5).
Nanomaterials 08 00250 g011
Figure 12. Average inhibition zone graph for SnO2 bulk and SnO2 nanoparticles against Escherichia coli ATCC 25922 Gram (−ve) and Bacillus subtilis UPMC 1175 Gram (+ve).
Nanomaterials 08 00250 g012
Table 1. XRD, TEM and energy band gap results for tin oxide nanoparticles at different temperature.
Temperature (°C)Crystallite Size (nm)Particle Size (nm)Band Gab (Eg)
50034 ± 23.90
60056.7 ± 33.84
70089.5 ± 23.80
8001415.5 ± 43.64
Table 2. EDX spectra showing the atomic percentages of Sn and oxygen species.
SpectrumIn Stats.OCSnTotal
Spectrum 1Yes60.434.0035.57100.00
Spectrum 2Yes66.59 33.41100.00
Spectrum 3Yes64.40 35.60100.00
Table 3. Magnetic parameters of SnO2 nanoparticles observed for ESR analysis.
Temperature (°C)g-FactorHr (Oe)
5001.7395377.183
6001.7519374.497
7001.7623372.251
8001.7703370.590

