Article

Highly Efficient Photocatalyst Fabricated from the Chemical Recycling of Iron Waste and Natural Zeolite for Super Dye Degradation

1
Nanophotonics and Applications (NPA) Lab, Physics Department, Faculty of Science, Beni-Suef University, Beni-Suef 62514, Egypt
2
Polymer Research Laboratory, Chemistry Department, Faculty of Science, Beni-Suef University, Beni-Suef 62514, Egypt
3
Department of Physics, Faculty of Science, Islamic University in Madinah, Al Madinah Al Munawwarah 42351, Saudi Arabia
*
Author to whom correspondence should be addressed.
Nanomaterials 2022, 12(2), 235; https://doi.org/10.3390/nano12020235
Submission received: 31 August 2021 / Revised: 22 November 2021 / Accepted: 17 December 2021 / Published: 12 January 2022

Abstract

:
In this paper, Fe2O3 and Fe2O3-zeolite nanopowders are prepared by chemical precipitation utilizing the rusted iron waste and natural zeolite. In addition to the nanomorphologies; the chemical composition, structural parameters, and optical properties are examined using many techniques. The Fe2O3-zeolite photocatalyst showed smaller sizes and higher light absorption in visible light than Fe2O3. Both Fe2O3 and Fe2O3-zeolite are used as photocatalysts for methylene blue (MB) photodegradation under solar light. The effects of the contact time, starting MB concentration, Fe2O3-zeolite dose, and pH value on photocatalytic performance are investigated. The full photocatalytic degradation of MB dye (10 mg/L) is achieved using 75 mg of Fe2O3-zeolite under visible light after 30 s, which, to the best of our knowledge, is the highest performance yet for Fe2O3-based photocatalysts. This photocatalyst has also shown remarkable stability and recyclability. The kinetics and mechanisms of the photocatalytic process are studied. Therefore, the current work can be applied industrially as a cost-effective method for eliminating the harmful MB dye from wastewater and recycling the rusted iron wires.

1. Introduction

Iron has long been considered a vital industrial material due to its vast variety of applications. Millions of tons of rusty iron waste every year are produced as a result of the corrosion in the air, resulting in environmental pollution and economic losses. Therefore, the reuse/recycling of rusty iron wire is a good method to decrease the wastes amounts. The corrosion of iron wires in the atmosphere produces a large amount of rust iron every year. This leads to the formation of millions of tons of rusty waste. In 2013, the global cost of corrosion is nearly US $2.5 trillion [1]. The rust amount may be worth about 5% of the gross USA product. Consequently, the rusting of iron becomes a problem of worldwide significance. As a result, the Fe2O3 nanoparticles fabricated from rusted iron wastes can thus be considered as a viable alternative to synthetic and natural iron supplies. Many techniques have been used to prepare Fe2O3 nanostructures such as hydrothermal, chemical precipitation, sol-gel, thermal evaporation, and spray pyrolysis [2]. Most of these techniques needed high energy, complicated reactions, and poor product yield. Chemical precipitation is considered the most effective method for the production of Fe2O3 because no special additives or equipment are required.
On the other side, dye pollutants are becoming a major source of environmental contaminations [3,4]. Methylene blue (MB) is amongst the most commonly used dyes in textile industries. It causes substantial harm to both marine and human health due to its extremely carcinogenic and mutagenic [5]. Being exposed to MB dye can cause increasing nausea, heart rates, diarrhea, shock, vomiting, stomach cramp, and human tissue necrosis [6]. Therefore, the development of effective pollutant disposal techniques from wastewater at a reasonable cost is important to many research areas. Organic dyes are removed via physical, chemical, and biological techniques. Some of the techniques utilized include adsorption, filtration, membrane separation, coagulation, dilution, flotation, softening electrochemical, reverse osmosis, and photodegradation [3,7]. The technique of photodegradation is commonly used to remediate organic dyes from wastewater into harmless inorganic molecules such as CO2 and H2O [7,8].
Fe2O3 is widely used as a photocatalyst for the degradation of a wide range of pollutants due to its high chemical stability, low cost, and abundance [9,10]. Fe2O3 is a semiconductor material with a narrow bandgap. So, it has good light absorption in the visible region. However, this material has several drawbacks that limit its usage in photocatalytic applications, including quick electron-hole recombination, weak conductivity, and short hole diffusion lengths [11]. To overcome these drawbacks, several studies immobilized the Fe2O3 nanoparticles on various supports such as silica, zeolite, clay, and activated carbon. Among these, zeolite is a very fascinating material for environmental applications. Zeolite is a microporous aluminosilicates mineral based on TO4 in a tetrahedral structure, where; T is silicon or aluminum atoms [12]. In addition to its semiconducting nature, it has a strong adsorption ability for organic dyes. Zeolite has excellent ionic exchange properties with a high surface area, which makes it ideal for the degradation/adsorption of organic impurities. In addition, zeolite is biocompatible, abundant, and inexpensive.
Various types of zeolites supported photocatalysts have been investigated in the past few years. Mostafa and Ehab prepared zeolite nanostructures by the hydrothermal treatments of Si and various Al sources for the adsorption and photocatalytic degradation of MB molecules from aqueous media [13]. Zhang et al. prepared TiO2-zeolite photocatalysts through a hydrolysis deposition method combined with a calcination crystallization process [14]. Owing to improved adsorption of Rhodamine B (RhB) dye with effective delocalization of photogenerated electrons, the presence of zeolites increased the photocatalytic efficiency of the TiO2. [15]. This photocatalyst displayed superior photocatalytic performance with high stability and reusability. Alamri et al. prepared Fe2O3-supported zeolite for the removal of the ofloxacin [16]. The dealumination of zeolite accompanied by ion exchange of Al with Fe3+ in the zeolite framework resulted in the formation of active species that improved the photocatalytic activity toward the discoloration of MO [16]. Abukhadra et al. synthesized photocatalyst of zeolite/polyaniline/nickel oxide to effectively photodegrade the Safranin-T dye using sunlight [17]. WO3 and magnetite (Fe3O4) based zeolite composite was applied for photocatalytic degradation of rhodamine B dye using solar light [18]. The acceleration of RhB’s degradation rate was due to the efficient separation of the electrons/holes and the availability of active sites to adsorb RhB molecules [19].
This study aims to replace the iron precursors with rust wastes as a source of iron for the synthesis of Fe2O3 and Fe2O3-zeolite by low-cost chemical precipitation. The prepared Fe2O3-zeolite photocatalyst is applied for the photodegradation of the harmful MB dye. By this strategy, two issues related to water pollution and waste management can be solved simultaneously. According to the best of our knowledge, no articles are available on the recycling of the rusted iron wires for the fabrication of Fe2O3 and its coupling with zeolite for photodegradation. The prepared Fe2O3-zeolite photocatalyst shows the high photocatalytic performance comparing with the previous studies for Fe2O3-based. The photocatalytic performance is evaluated in terms of catalyst mass, starting dye concentration, exposure time, and pH value. Moreover, the stability, reusability, and photocatalytic mechanism of the Fe2O3-zeolite photocatalyst are investigated.

2. Materials and Experimental Procedures

2.1. Materials

Natural zeolite was delivered from a zeolite mine located in Taiz city, Yemen. Rusted iron wires were collected from construction sites. Methylene blue dye and sodium hydroxide were received from El-Nasr Company (Cairo, Egypt). Ammonia, hydrochloric acid, and hydrogen peroxide solutions were purchased from Rankem Company (New Delhi, India).

2.2. Preparation of the Fe2O3 and Fe2O3-Zeolite

For the preparation of the Fe2O3, small rusted wires were washed several times using distilled water. About 5 g of these pieces were dissolved in 40 mL of HCl, 20 mL of H2O2, and 80 mL distilled water for 3 h at 80 °C. At this stage, the Fe3+ and Fe2+ ions were obtained in the HCl solution. Under intense stirring, about 15 mL of ammonia solution with concentration of 25 wt% was dropped to the iron solution. The pale-yellow colored solution has appeared. After that, an appropriate amount of NH3 was added (1:1 with water) to obtain a dark brown precipitate of iron oxide hydroxide (FeOOH). The precipitate was washed several times via a centrifugation process operating for 10 min. Then, the resulting precipitated (FeOOH) powder was washed and dried in the air at 80 °C. Finally, FeOOH was calcined at 550 °C to obtain hematite nanoparticles (α-Fe2O3 NPs). On heating, the FeOOH loses a water molecule to form α-Fe2O3 according to the chemical reaction: FeOOH → Fe2O3 + H2O.
For the preparation of Fe2O3-zeolite photocatalyst, 5 g of raw zeolite was triggered mechanically by ball milling at 5000 rpm for 8 h. Then, it was washed with distilled water and dried in the air. About 1 g of Fe2O3 and 1 g of activated zeolite were added to 100 mL of distilled water for 2 h under ultrasonication. The resulting mixture was dried at 70 °C for 10 h. Finally, the Fe2O3 and Fe2O3-zeolite photocatalysts were calcined at 550 °C for 2 h.

2.3. Characterizations

The X-ray diffraction (XRD) analysis is carried out by a XRD diffractometer (Philips X’Pert Pro MRD, Almelo, Netherlands) with λ = 0.154 nm and an operating voltage of 40 kV for obtaining the crystal structure of the zeolite, Fe2O3, and Fe2O3-zeolite. The samples morphologies were observed using a scanning electron microscope (SEM, JEOL JSM-5400 LV, Tokyo, Japan). The chemical composition was examined using energy-dispersive X-ray spectroscopy (EDX, JEOL JED-2300T, Tokyo, Japan). The optical properties of the samples were measured by UV-Vis double beam spectrophotometer (Perkin-Elmer Lamba 900, Waltham, MA, USA). Fourier transform-infrared (FTIR) spectra of photocatalysts were examined through FTIR spectrometer (Bruker Vertex 70 FTIR-FT, Billerica, MA, USA).

2.4. Photocatalytic Removal of MB Dye

The photocatalytic properties of Fe2O3-zeolite photocatalyst were examined toward MB dye as a typical organic pollutant under sunlight illumination. The photocatalytic measurements were performed in a cone-shaped vessel under stirring (500 rpm) at Beni-Suef city (Egypt) on sunshiny winter days (February 2021) from 10 am to 3 pm. The sunshine angle is 1040 east-southeast and has an average temperature of ~20 °C. Figure S1 shows a schematic diagram for the experimental photocatalytic measurements. Once the adsorption/desorption equilibrium was reached after 30 min, the photodegradation performance was examined versus the exposure times, catalyst masses, starting MB concentrations, pH values, and the number of reusability runs of the photocatalyst. The MB dye samples were taken each 10 s to observe using the Perkin-Elmer spectrophotometer at λ = 664 nm after regular exposure times.

2.4.1. Influence of Exposure Time and Catalyst Supporting Role

The influence of exposure period on the photocatalytic removal of MB was studied using 20 mg and 60 mg of the targeted photocatalyst (zeolite, Fe2O3, or Fe2O3-zeolite) in 10 mg/L dye solution (100 mL) at pH 7 and 20 °C. Zeolite’s supporting role in improving the catalytic performance of Fe2O3 was studied by applying the Fe2O3 and Fe2O3-zeolite for the catalytic photodegradation of MB based on a comparative analysis.

2.4.2. Influence of Starting MB Concentration

The influences of the starting MB concentrations (5–30 mg/L) on the MB dye removal-time characteristics were studied. This study was carried out using 20 mg of Fe2O3-zeolite catalyst in 100 mL MB dye solutions at pH 7 and 20 °C.

2.4.3. Influence of the Photocatalyst Dose

Effects of the Fe2O3-zeolite photocatalyst dose (20, 35, 50, 62, and 75 mg) on the photodegradation of MB dye were tested up to 30 s exposure time. The measurements were carried out using 10 mg/L MB dye solutions at pH 7 and 20 °C. In addition, the average MB dye removal% as a single point measurement at 30 s using different catalyst masses are measured using 10 mg/L MB dye solutions at pH 7 and 20 °C.

2.4.4. pH-Value Influence

0.1 M NaOH and HCl solutions are employed for controlling the pH-value of 100 mL MB solutions of starting 10 mg/L dye concentration. The influences of the pH-values on the photodegradation of the prepared MB solutions were studied using 20 mg of the photocatalyst under exposure to the natural sunlight for 30 s at ~20 °C.

2.4.5. Stability of the Fe2O3-Zeolite Photocatalyst

The reusability of the Fe2O3-zeolite photocatalyst for MB dye degradation was studied for 10 successive runs. The measurements were carried out for 30 s using 75 mg of the Fe2O3-zeolite and 10 mg/L starting MB at pH 7. Before each re-usability, a washing process was performed with H2O and a drying process at 70 °C for 120 min. In this case, 10 cycles of reusability were performed using sunlight every 30 s.

2.4.6. Chemical Oxygen Demand (COD) Measurements

The sample was oxidized by a boiling mixture of chromic and sulfuric acids and refluxed for 2h in a strong acid solution with a known excess of potassium dichromate. After digestion, the remaining unreacted K2Cr2O7 was titrated with ferrous ammonium sulfate to determine the amount of K2Cr2O7 consumed. The oxidizable matter was calculated in terms of oxygen equivalent. The measurements were carried out in triplicates in order to acquire accurate data.

3. Results and Discussion

3.1. Characterization of the Photocatalysts

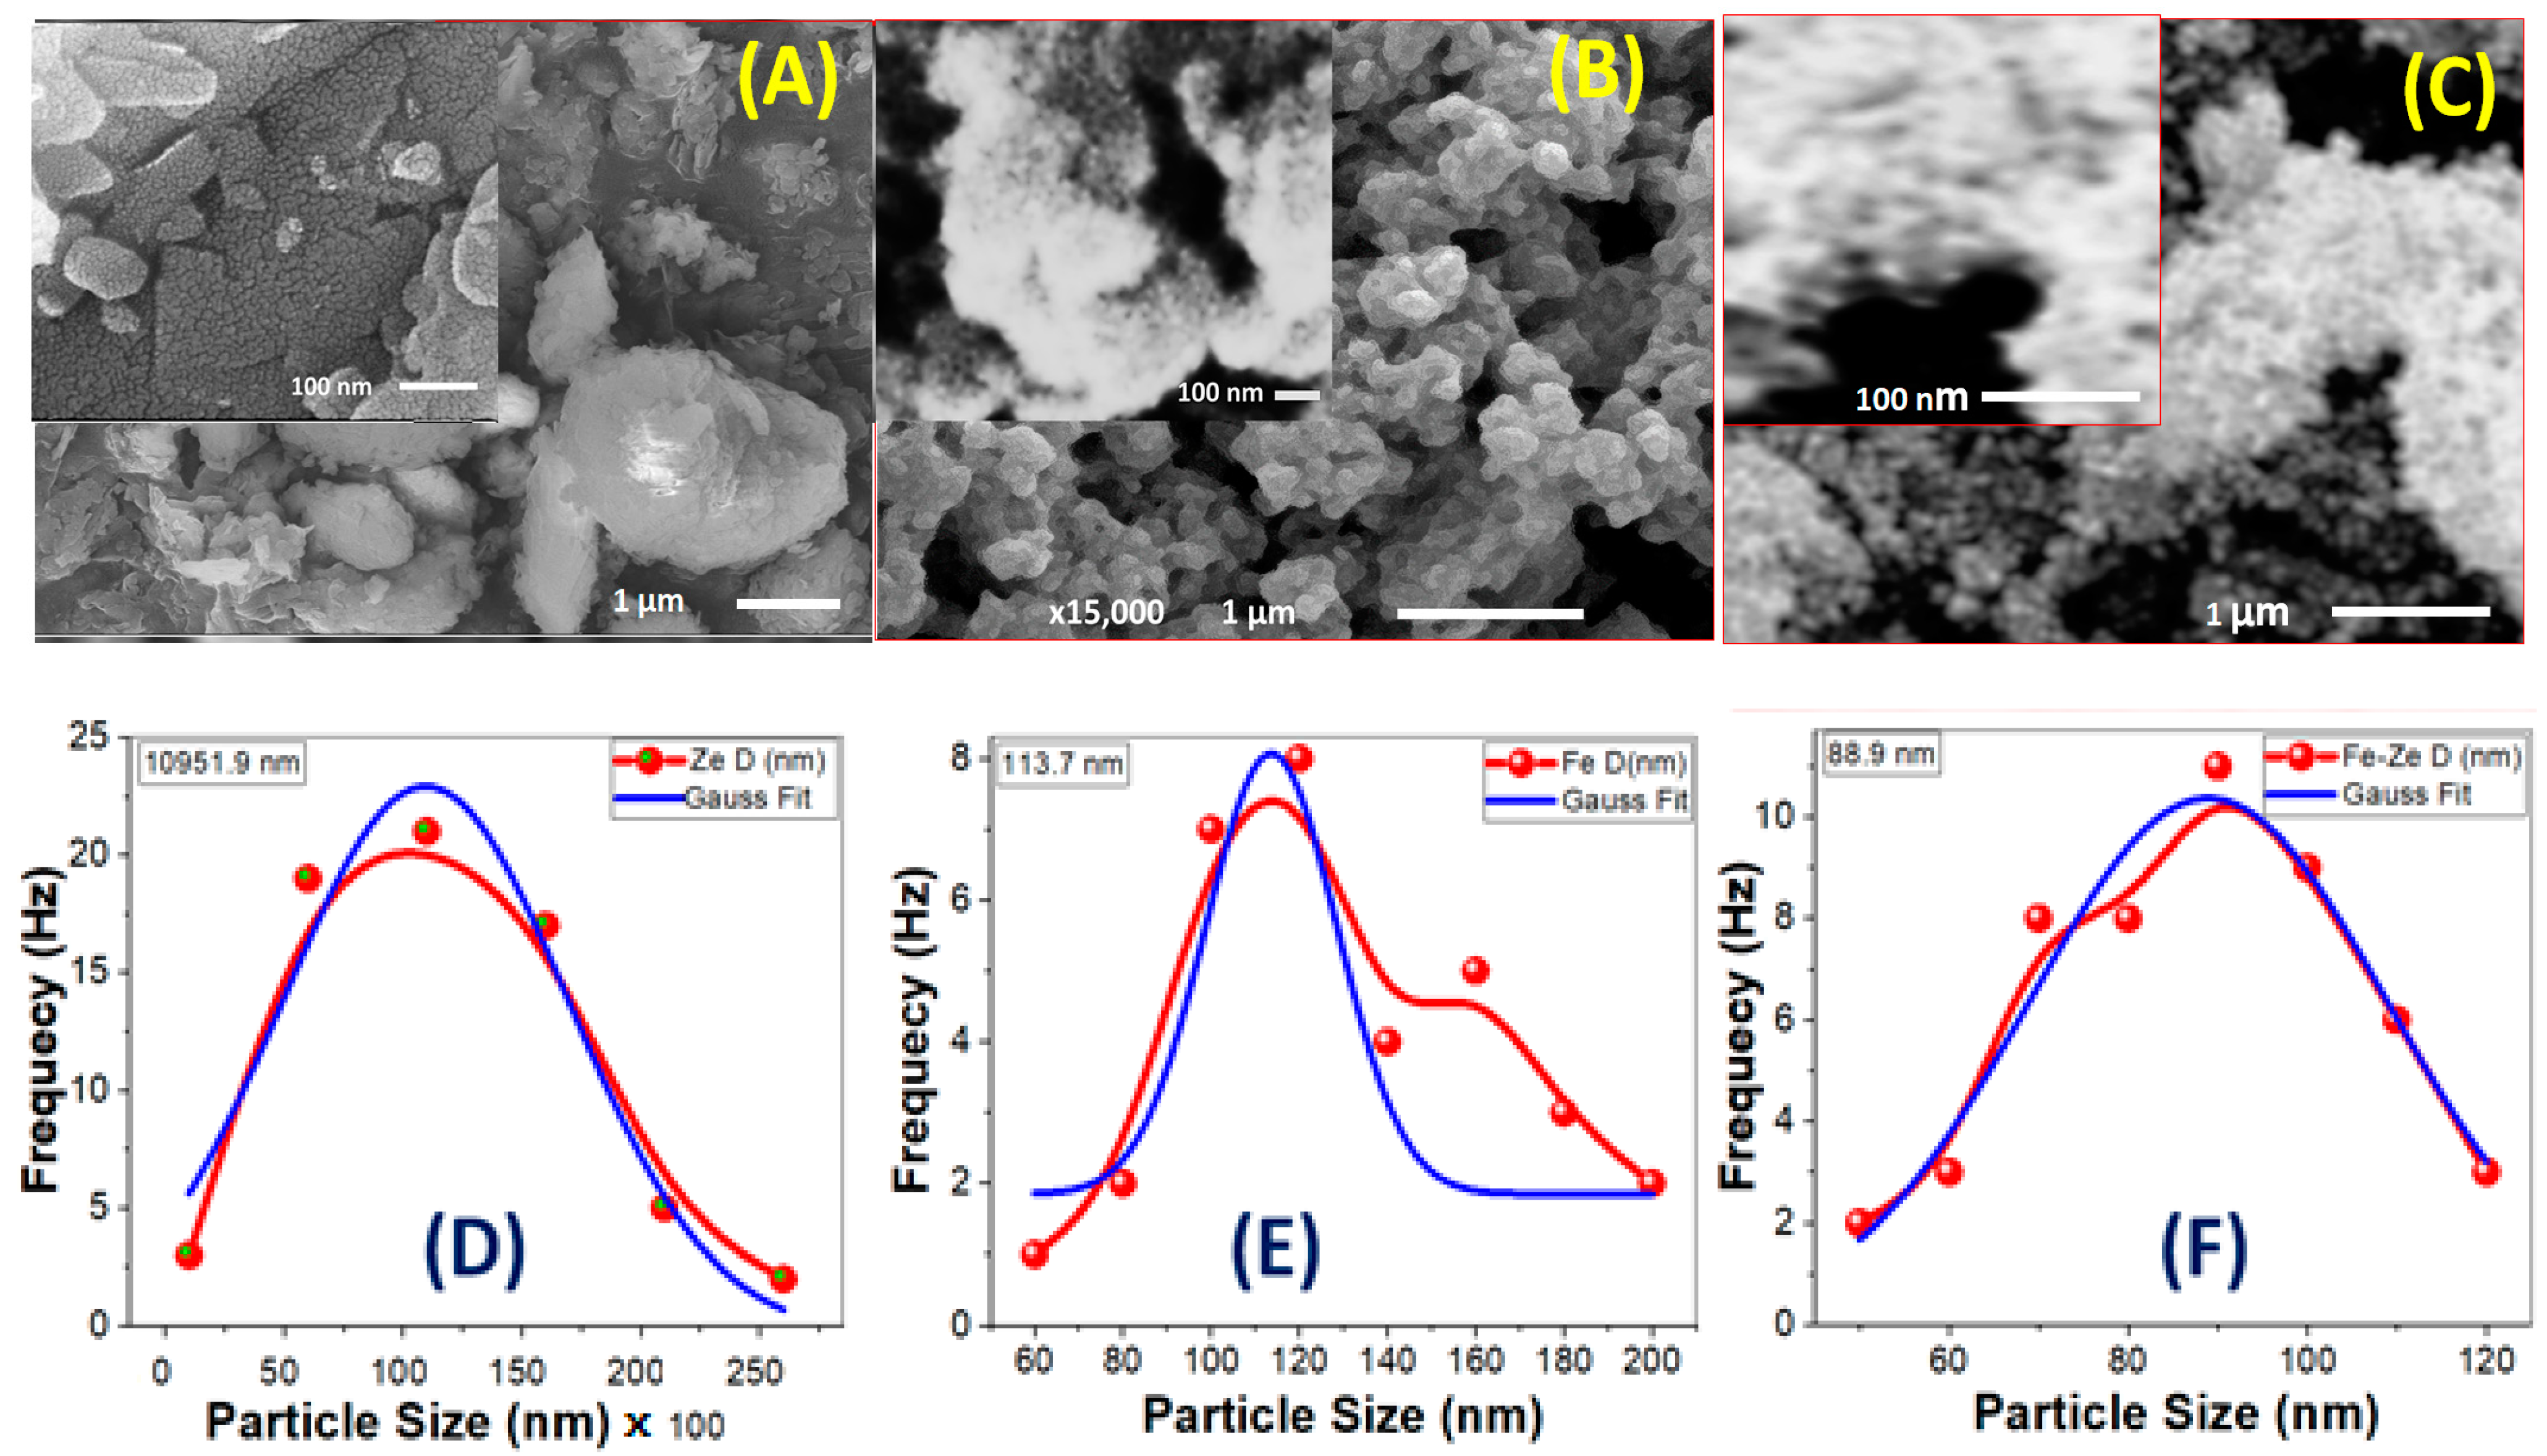
3.1.1. Surface Morphology

The photocatalytic activity of a photocatalyst is widely recognized to be substantially related to its surface shape. Figure 1A–C depicts the SEM examination of the morphologies of natural zeolite, Fe2O3, and Fe2O3-zeolite nanopowders.
Figure 1A shows SEM pictures of natural zeolite with micro/nano-stones in nonuniform shapes and sizes. The diameters of the stones for zeolite are varied from ~3.0 to ~26 μm, as evidenced in the matching particle size distribution (Figure 1D). Using Gaussian fitting, the mean stone size is ~11 μm with a standard deviation of 6.0 μm. A detailed examination of the image indicates the presence of numerous tiny nanoprotrusions/nanograins on the surfaces of zeolite stones with an average size of 115 nm. In addition, as observed in high magnification Figure 1A, there are many macropores among agglomerated zeolite crystals with an average diameter of ~70 nm on the surface of zeolite with irregular forms. The porous framework’s high surface area allows for the incorporation of iron oxide nanoclusters on the surface of the zeolite. These pores can also adsorb organic contaminants, which can improve photodegradation efficiency.
The Fe2O3 nanoparticle was made up of numerous semi-spherical nanoparticles. Figure 1B displays SEM images of Fe2O3 nanoparticles that demonstrate the nanoparticles are modest in size. Figure 1E shows the appropriate particle size distribution. The mean size of Fe2O3 nanoparticles is ~114 nm, with a standard deviation of ~15 nm, according to Gaussian fitting. These nanoparticles self-assemble and aggregate to create mesopores with an average diameter of ~21 nm and a standard variation of ~6 nm, as illustrated in Figure 1B’s inset.
Fine spherical Fe2O3 nanoparticles coated the zeolite surface and appeared as homogenous distributions that produced a nano-sized Fe2O3 coating surface over zeolite stones after loading zeolite with the intended Fe2O3 photocatalyst, as shown in Figure 1C. It’s also possible that the Fe2O3 coating was relatively uniform, with no obvious areas of uncoated zeolite. When compared to free-standing Fe2O3 nanoparticles, the size of the Fe2O3 nanoparticles appears to be reduced following loading on zeolite. The size distribution of supported Fe2O3 nanoparticles on the surface of zeolite, Figure 1F, shows an average value of ~89 nm. In addition, the high magnification SEM picture (inset of Figure 1C) reveals a more homogeneous pore-diameter distribution with a mean value of ~36 nm.
The interlock of Fe2O3 photocatalytic activity. Tedla et al. demonstrated that comparable interlock arrangements can allow generated electrons and holes to migrate quickly to the catalyst surface, resulting in a low chance of recombination [20]. Furthermore, reducing the particle size to the nanoscale and increasing the pores can provide a large effective surface area of the Fe2O3 nanocatalyst. This can boost the catalyst’s adsorption capability and allow for more intense absorption of incident light.

3.1.2. Chemical Compositions of the Photocatalysts

The EDX spectra were presented in Figure S2 (supplementary data) to identify the chemical compositions of zeolite, Fe2O3, and Fe2O3-zeolite photocatalysts. As seen in Figure S2a (supplementary data), the chemical composition for the zeolite displays the main three elements (Si, Al, and O). Smaller traces of Fe, Cu, K, and Ca have also been observed [21]. From Figure S2b (supplementary data), the EDX analysis of Fe2O3 showed the existence of Fe (62.3%) and O (37.6%) signals as the main components at around 6.39 and 0.52 keV, respectively. After loading Fe2O3 onto zeolite, the main characteristic peaks are Fe, Si, Al, and O with atomic ratios of 8.9%, 23.6%, 6.3%, and 58.0%, respectively, as seen in Table 1.
Zeolite is divided into heulandite and clinoptilolite which are isostructural with each other. Heulandite and clinoptilolite were differentiated by their framework composition. The Si/Al ratio is a critical value to distinguish between heulandite and clinoptilolite. Heulandite has Si/Al ratios between 2.8 and 4. Clinoptilolite has a Si/Al ratio > 4. Heulandite is encountered containing Ba, Ca, Na, K, and Sr. The ratio of atomic Si/Al ratios is increased from 3.61 for zeolite to 3.74 for zeolite-Fe2O3. Hence, the Si/Al is smaller than 4 for zeolite and Fe2O3-zeolite. Therefore, the type of zeolite (heulandite) not changes after adding Fe2O3. This suggests that Fe2O3 was successively loaded onto the porous surface of the zeolite.

3.1.3. Structural Properties of Fe2O3 and Fe2O3-Zeolite Photocatalyst

The phase and crystallinity of the zeolite, Fe2O3, and Fe2O3-zeolite photocatalysts were studied by using XRD analysis as displayed in Figure 2.
Based on XRD data, zeolite has a tetragonal structure according to JCPDS No. 00-053-1176. The type of zeolite is heulandite-Ca with the chemical formula Al8.8Ca3.6H52.2K0.8O98.1Si27.4. The heulandite-Ca is hydrous calcium and aluminum silicate. A small amount of potassium is usually replaced with part of the calcium. It has XRD peaks at 2θ = 11.00, 17.16, 18.87, 22.24, 26.01, 27.97, 29.84, 31.83, 35.88, 47.58, 61.76, and 67.31°. These peaks match to the planes [020], [200], [111], [-131], [-222], [-422], [-351], [-530], [−202], [005], [311] and [223], respectively.
The XRD pattern in Figure 2 indicates that crystalline hematite (α-Fe2O3) with rhombohedral structure was created for iron oxide nanoparticles based on JCPDS No. 01-089-0597. The peaks of Fe2O3 are located at 2θ = 33.00, 35.39, 49.32, 53.84, and 63.74°, which, respectively, relate to the planes [104], [110], [024], [116], and [300]. The sharp peaks suggest the high crystallinity of the synthesized hematite nanoparticles using the rusted iron wires. This indicates the high purity of the prepared Fe2O3 nanostructure, which agrees with the EDX results. According to the Debye-Scherrer relation, the crystallite sizes of Fe2O3 nanoparticles for [110] and [104] are 50.46 and 64.84 nm, respectively.
Figure 2 clarified that the primary core characteristics of Fe2O3 and Fe2O3-zeolite charts are highly similar, which showing that the addition of zeolite did not affect the crystal structure of the Fe2O3 photocatalyst. The coupling of zeolite with Fe2O3 results in an increase in the FWHM and a move in the plane location of the Fe2O3 toward higher angles for the Fe2O3-zeolite photocatalyst. Therefore, the crystallites sizes of [110] and [104] peaks were reduced to 47.85 and 56.53 nm for Fe2O3-zeolite photocatalyst, respectively. The same behavior was observed for zeolite-supported Fe2O3 prepared by the hydrothermal method [22]. Furthermore, the intensities of the diffraction peaks of Fe2O3-zeolite photocatalyst became lower than those of Fe2O3, representing a change in the crystallinity due to the distribution of Fe2O3 on the surface of the zeolite [23].
The structural parameters of Fe2O3 and Fe2O3-zeolite photocatalysts such as crystallite size (d), dislocation density (δ), interplanar distance (d), and microstrain (ε) are calculated for the highest two peaks, [110], [104] and listed in Table S1 (supplementary data). After loading the zeolite with Fe2O3, the value of interplanar distance decreases while the microstrain increases for the two planes [104] and [110]. The strongest peak corresponds to the plane [104], which indicates the preferred growth orientation of hematite. This growth orientation is beneficial to carrier transport [24]. The number of lattice defects was estimated depending on the dislocation density (δ). The value of δ is calculated by using the relation; δ = D 2. The values of δ at the orientation [104] for the Fe2O3-zeolite and Fe2O3 are 3.129 × 10⁻⁴ and 2.378 × 10⁻⁴ nm2, respectively. The high density of the defects might contribute favorably to the photocatalytic performance of the Fe2O3-zeolite photocatalysts as a result of the formation of a high density of the active sites and the surface area increase [25]. The creation of static charge around the dislocation lines may result in the formation of these active sites.

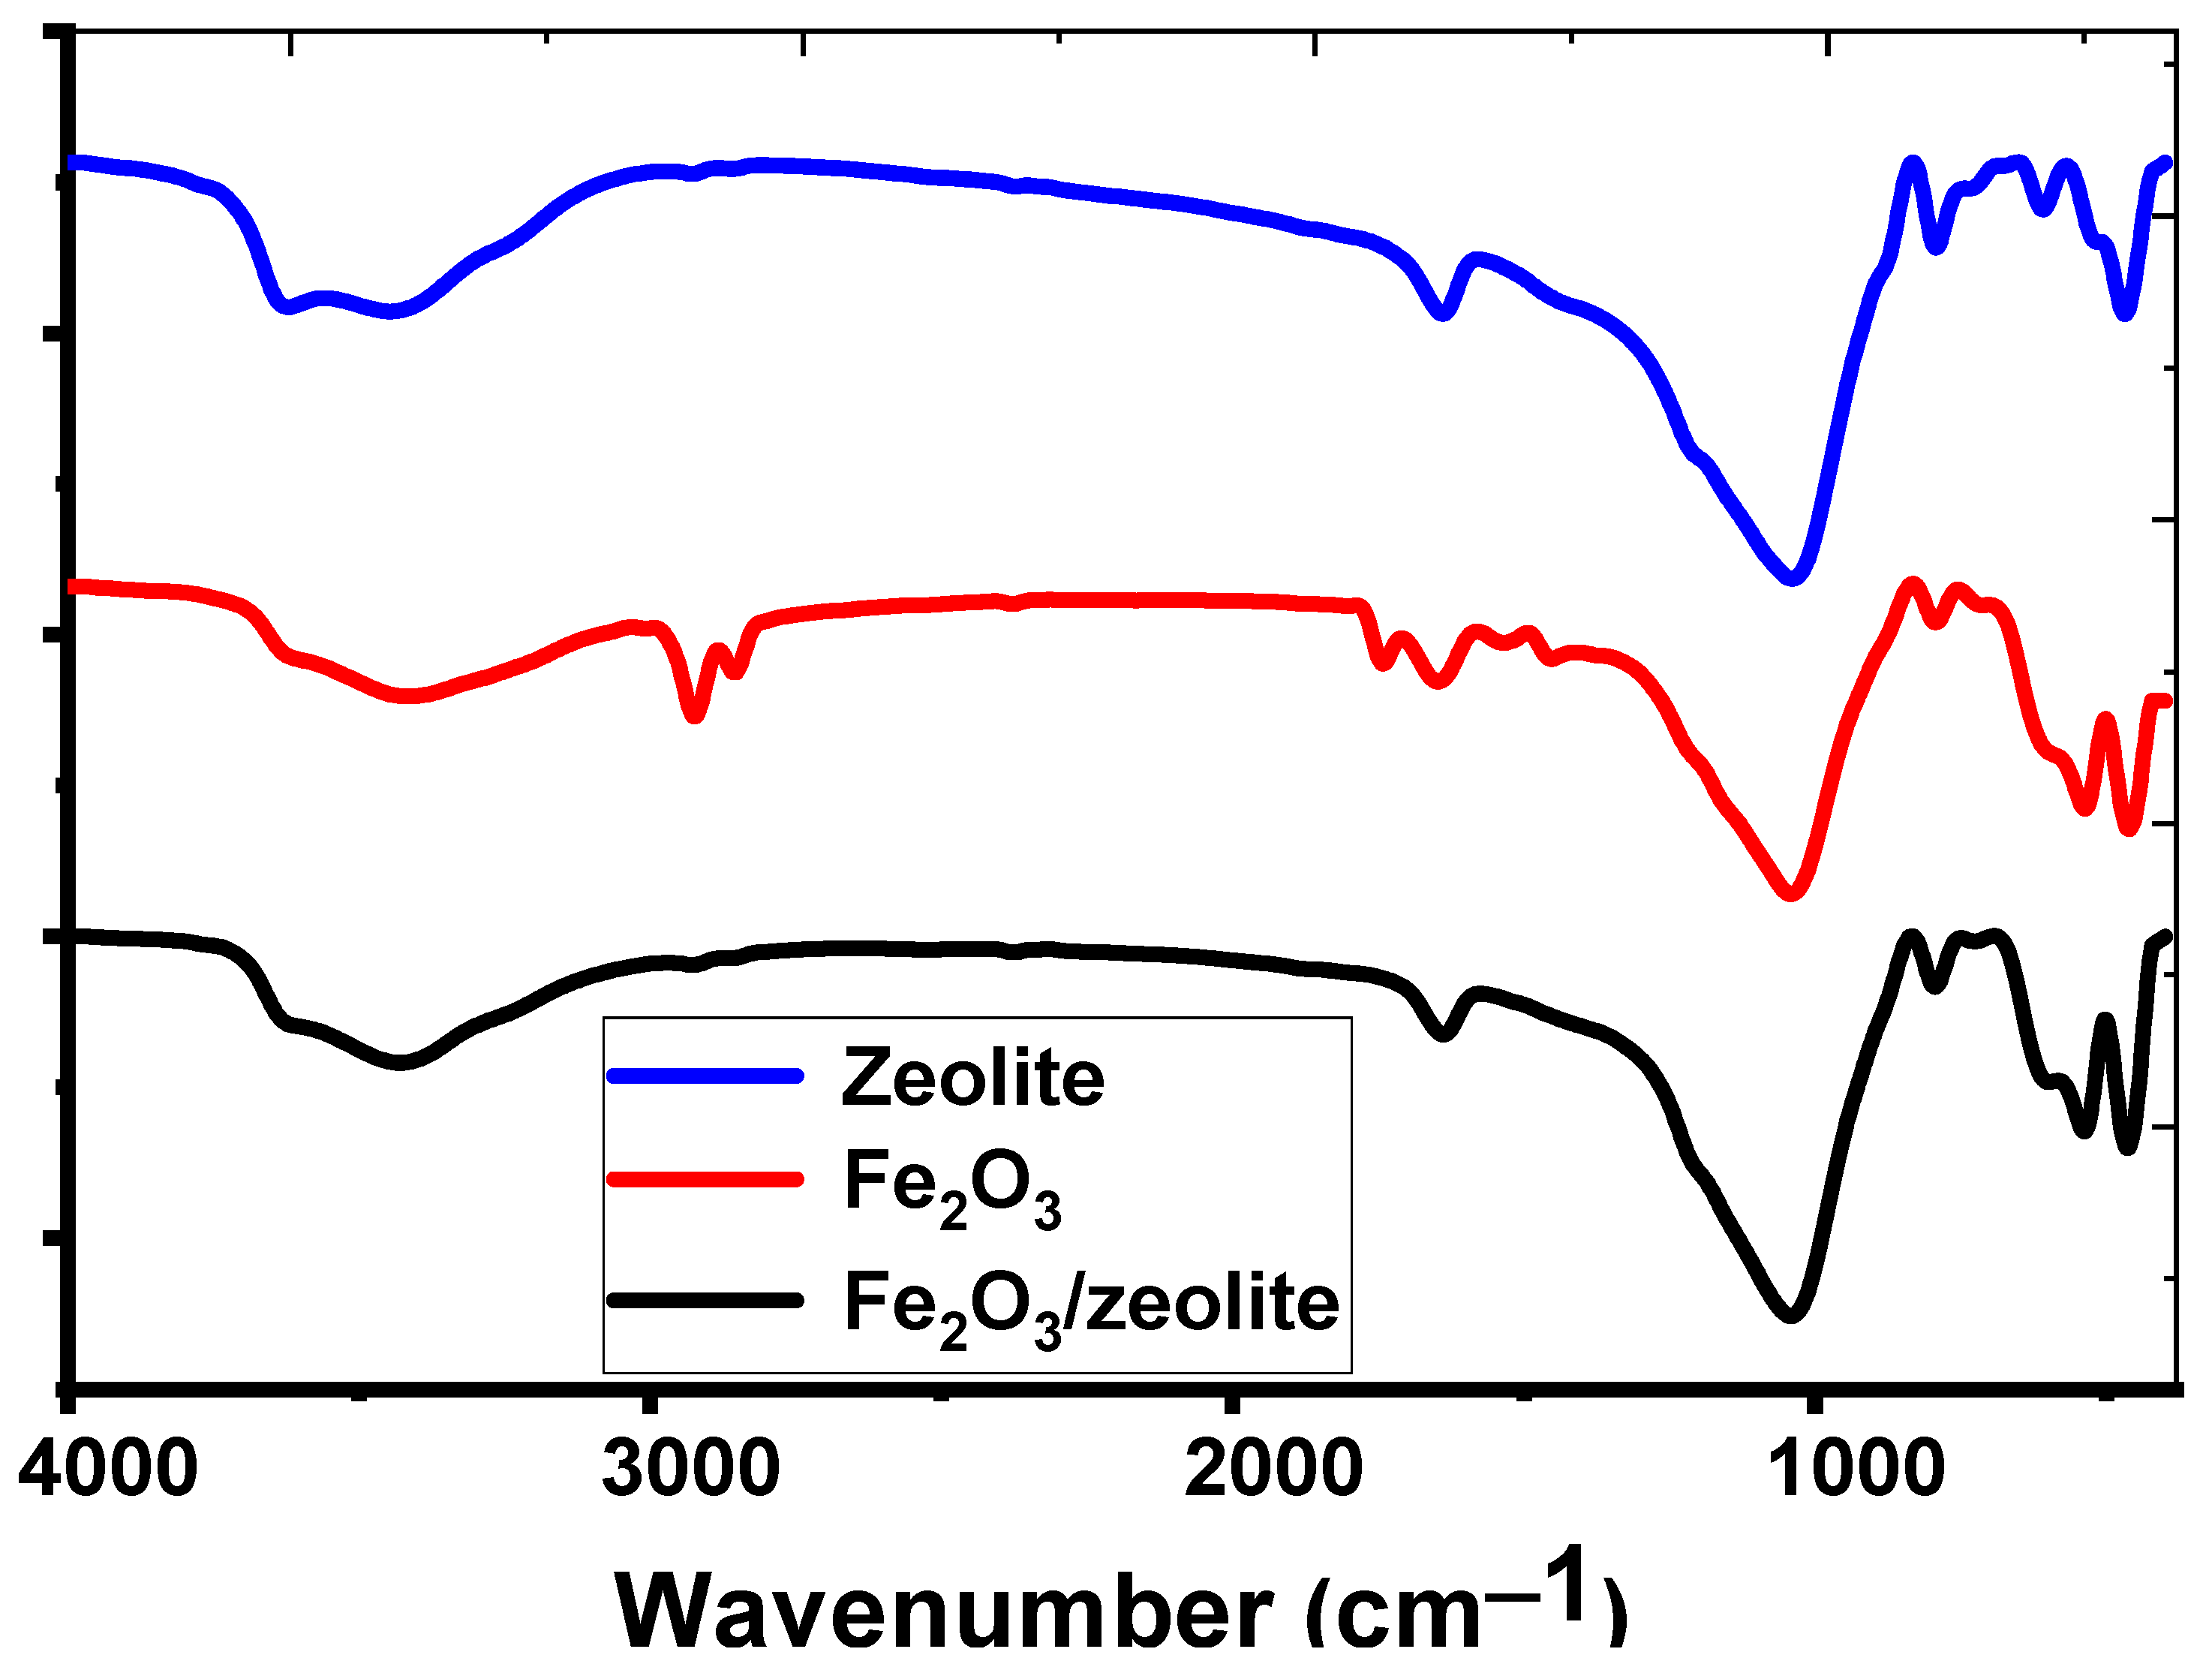
3.1.4. Functional Groups

Figure 3 illustrates a comparison of the different photocatalysts’ FTIR spectra ranges. Figure 3 shows the FTIR spectra of Fe2O3 nanoparticles in the 4000–400 cm1 wavenumber band. There are absorption bands at 1641 and 3415 cm1 in the case of Fe2O3. The absorbed H2O bending vibrations, O-H stretching vibrations, and surface hydroxyl modes were all attributed to these bands. Due to the symmetric and asymmetric -CH2-groups stretch modes, there are some absorption bands at 2920 and 2850 cm1. These groups may be due to hydrocarbon contamination in the surface of rusted iron wire. At 1040 cm1, a sharp absorption peak was seen, which was attributed to the Fe-O asymmetric stretching mode [26]. The FTIR spectrum of zeolite, on the other hand, was distinct, as illustrated in Figure 3. Si-OH groups with H-bonding were found to have broadbands at 3620 and 3446 cm1. The OH bending mode is responsible for an absorption peak at 1640 cm1 [27]. The O–Si(Al)–O bond vibrations in tetrahedra (TO4) or aluminum- and silicon-oxygen bridges are responsible for the intensive band at 1040 cm1 [27]. In the region of 700–500 cm–1, the bands were ascribed to four- or five-membered ring vibrations of TO4 units and stretching of the inter tetrahedral bonds typical of the ordered crystal structure, respectively [27].
Figure 3 shows the FTIR of Fe2O3-zeolite. Broadband was discovered at 3429 cm1 and attributed to the O-H stretch mode, whereas the O-H bending mode was observed at 1650 cm1 [28]. At 1000 cm1, zeolite bands appear in the photocatalyst, and the shift of these bands relative to zeolite refers to H-bond breaking produced by Fe on zeolite SiO4/AlO4 surfaces. Strong bands at 720, 598, 530, and 460 cm1 were attributed to the symmetric vibration of (Al or Si)-O due to the internal vibration of zeolite.

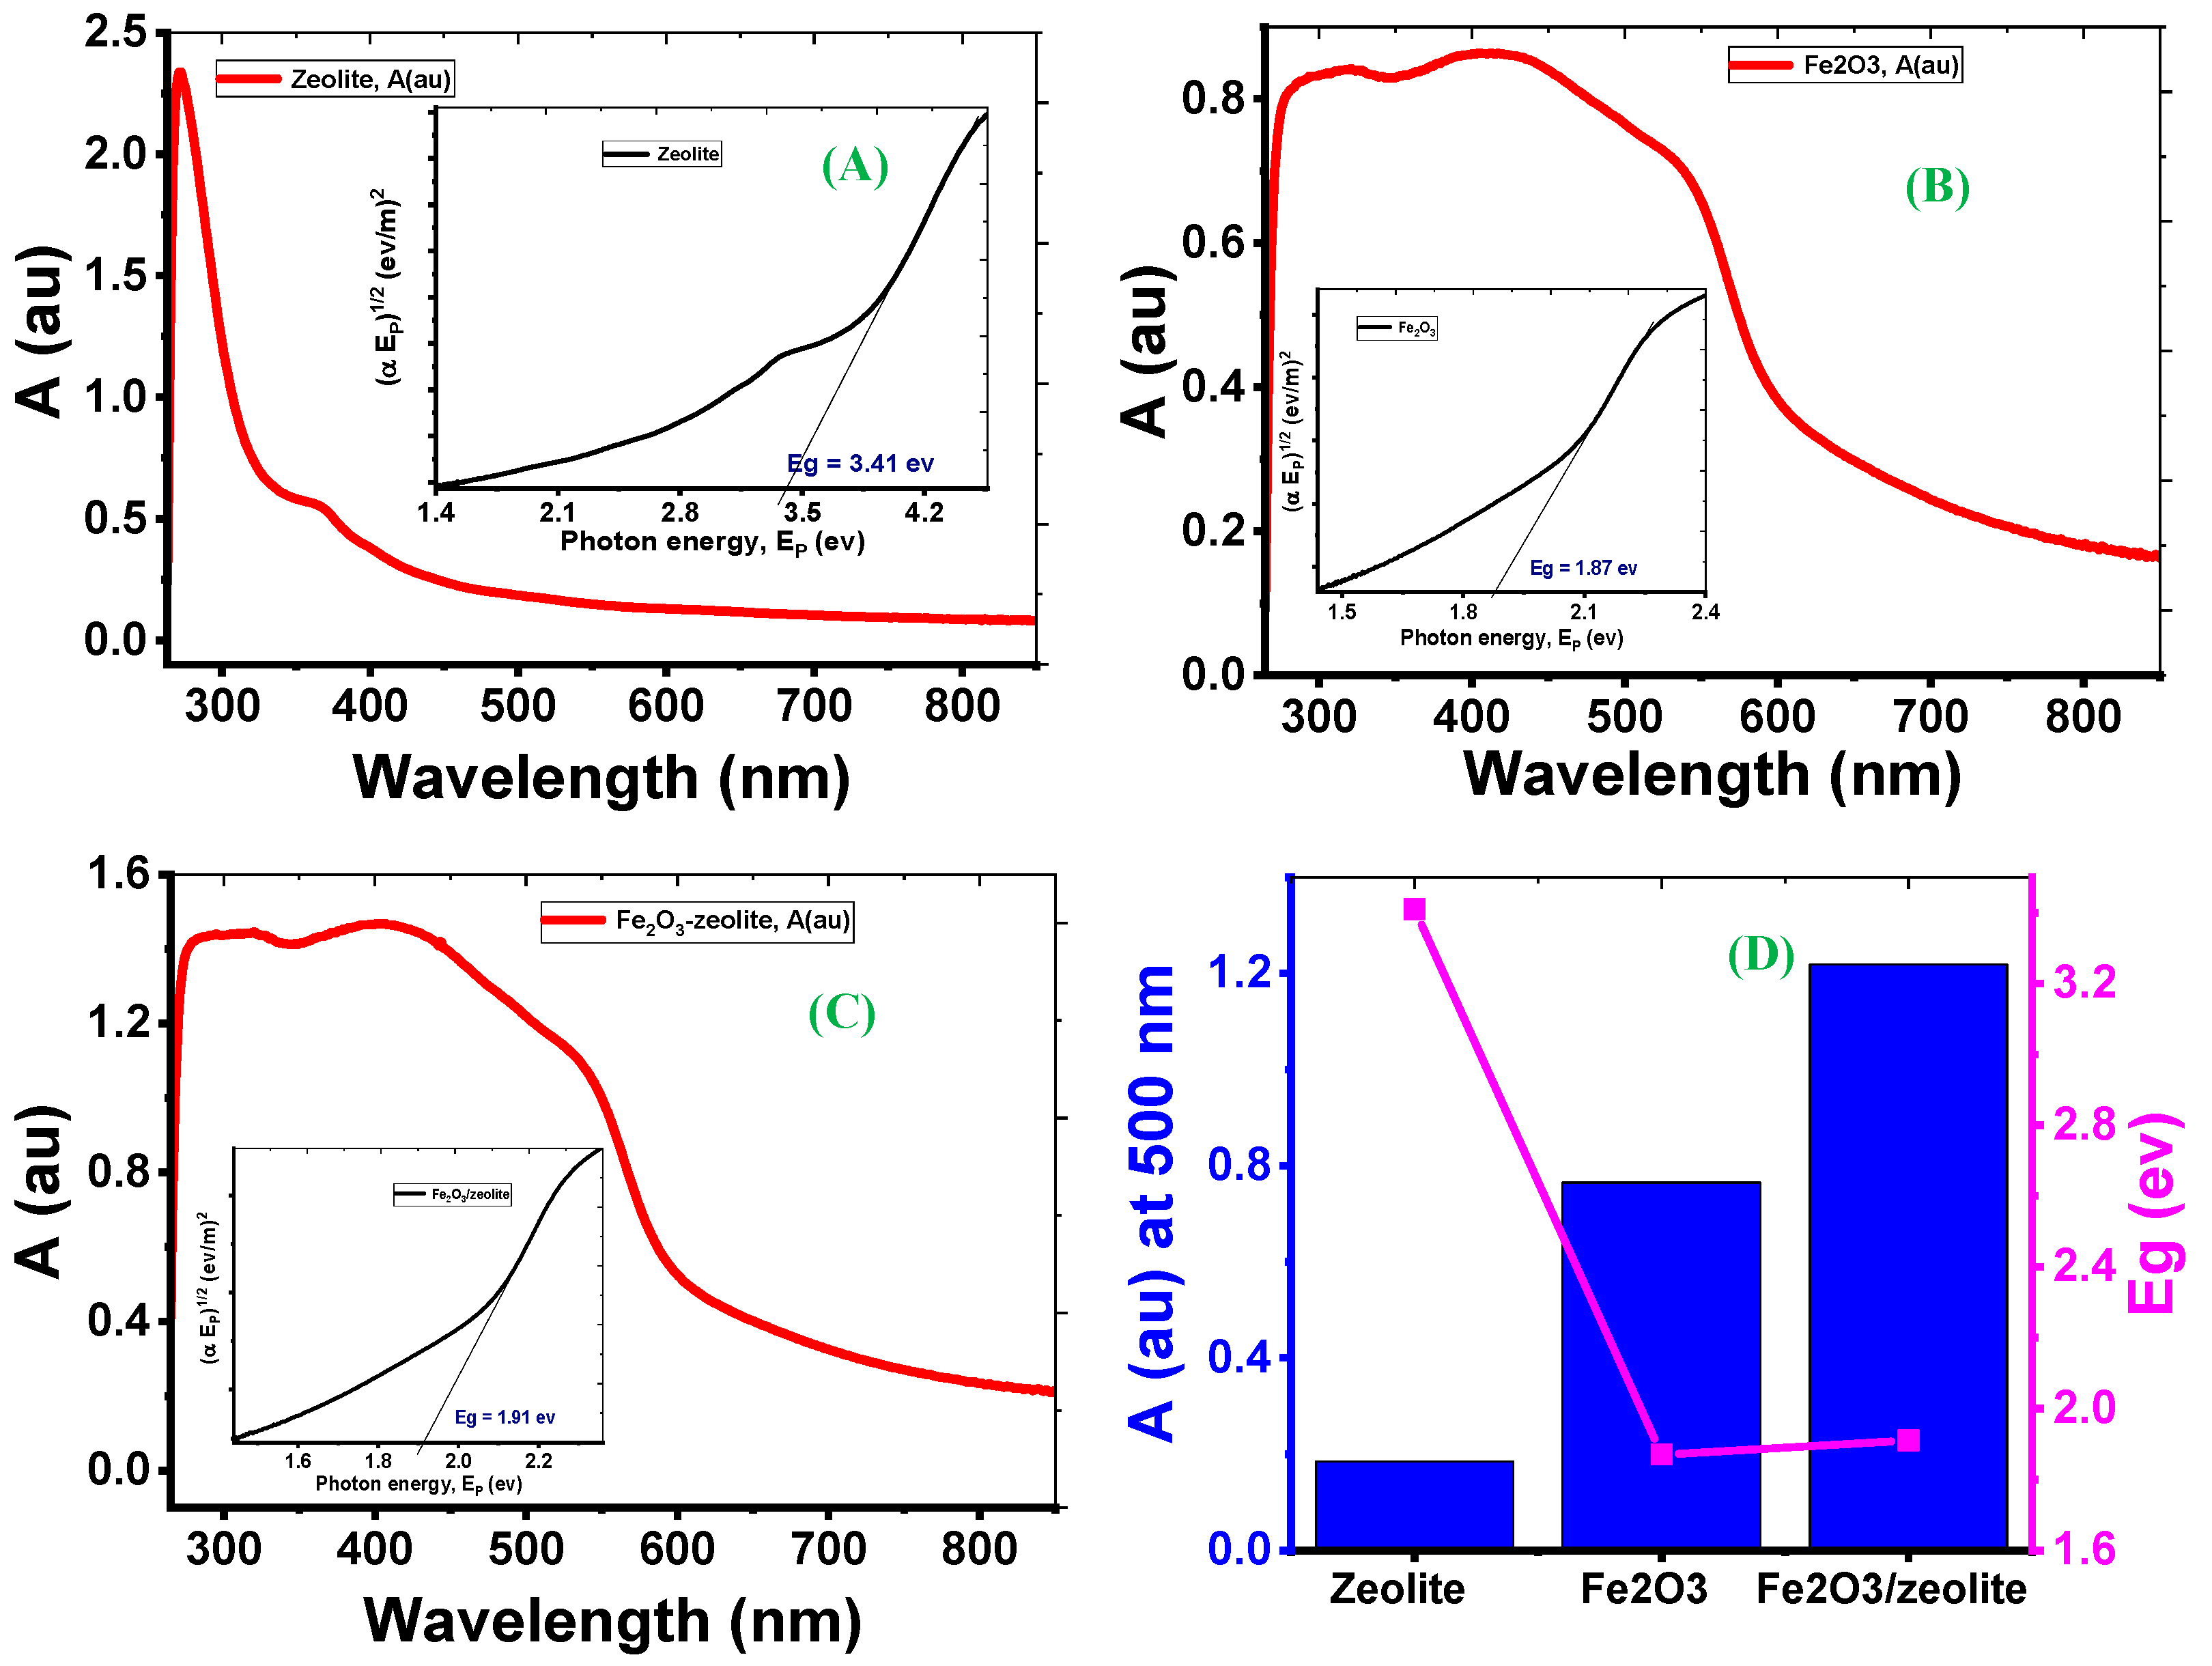
3.1.5. The Photocatalysts’ Optical Properties

Figure 4 shows the absorption spectra of zeolite, Fe2O3, and Fe2O3-zeolite. The zeolite powder presents a prominent peak due to a substantial photoabsorption band in the ultraviolet (UV) region, as seen in Figure 4A. As the wavelength becomes longer, the absorption drops rapidly. This indicates that the zeolite sample’s spectral response in the visible light region was exceedingly low. Figure 4B,C shows that the optical absorbance of Fe2O3 was modified after loading Fe2O3 onto zeolite. The Fe2O3 has strong absorption in the visible and UV regions [29]. Due to the spin-forbidden-excitations and straight transition, Fe2O3 has a broad absorption band in the visible region [30,31,32]. A wide and sharp absorption band in the visible region was detected for the Fe2O3-zeolite as seen in Figure 4C. The absorbance values of zeolite, Fe2O3, and Fe2O3-zeolite photocatalysts are 0.18, 0.76 and 1.22 at λ = 500 nm, respectively, Figure 4D. This means more and more photons in the visible region can be absorbed by Fe2O3-zeolite than Fe2O3. This would be preferable to generate a large number of electron-hole pairs by transferring electrons from the valence to conduction bands. As result, zeolite has significantly improved the visible light absorption capability of the loaded Fe2O3 photocatalyst.
The indirect band gaps of Fe2O3, zeolite, and Fe2O3-zeolite photocatalysts were expected by Tauc’s equation ( α   E p ) 0.5 = α 0   ( E p E g ) . Where E p is the energy of the incident photon light, E g refers to the optical bandgap, α is the absorption coefficient, and α 0 represents independent energy constant. This demonstrates the formation and incorporation of Fe2O3 nanoparticles in the zeolite. These results agree with the stated values for Fe2O3 fabricated by many methods [16,33]. Based on the quantization effect, the decrease in crystallite size reported in XRD data can explain the rise in the bandgap of Fe2O3-zeolite compared to Fe2O3 [34,35]. The studied optical properties suggest that Fe2O3-zeolite can be used for solar energy applications such as the photodegradation of organic dyes under sunlight.

3.2. Evaluation of Photocatalytic Performance

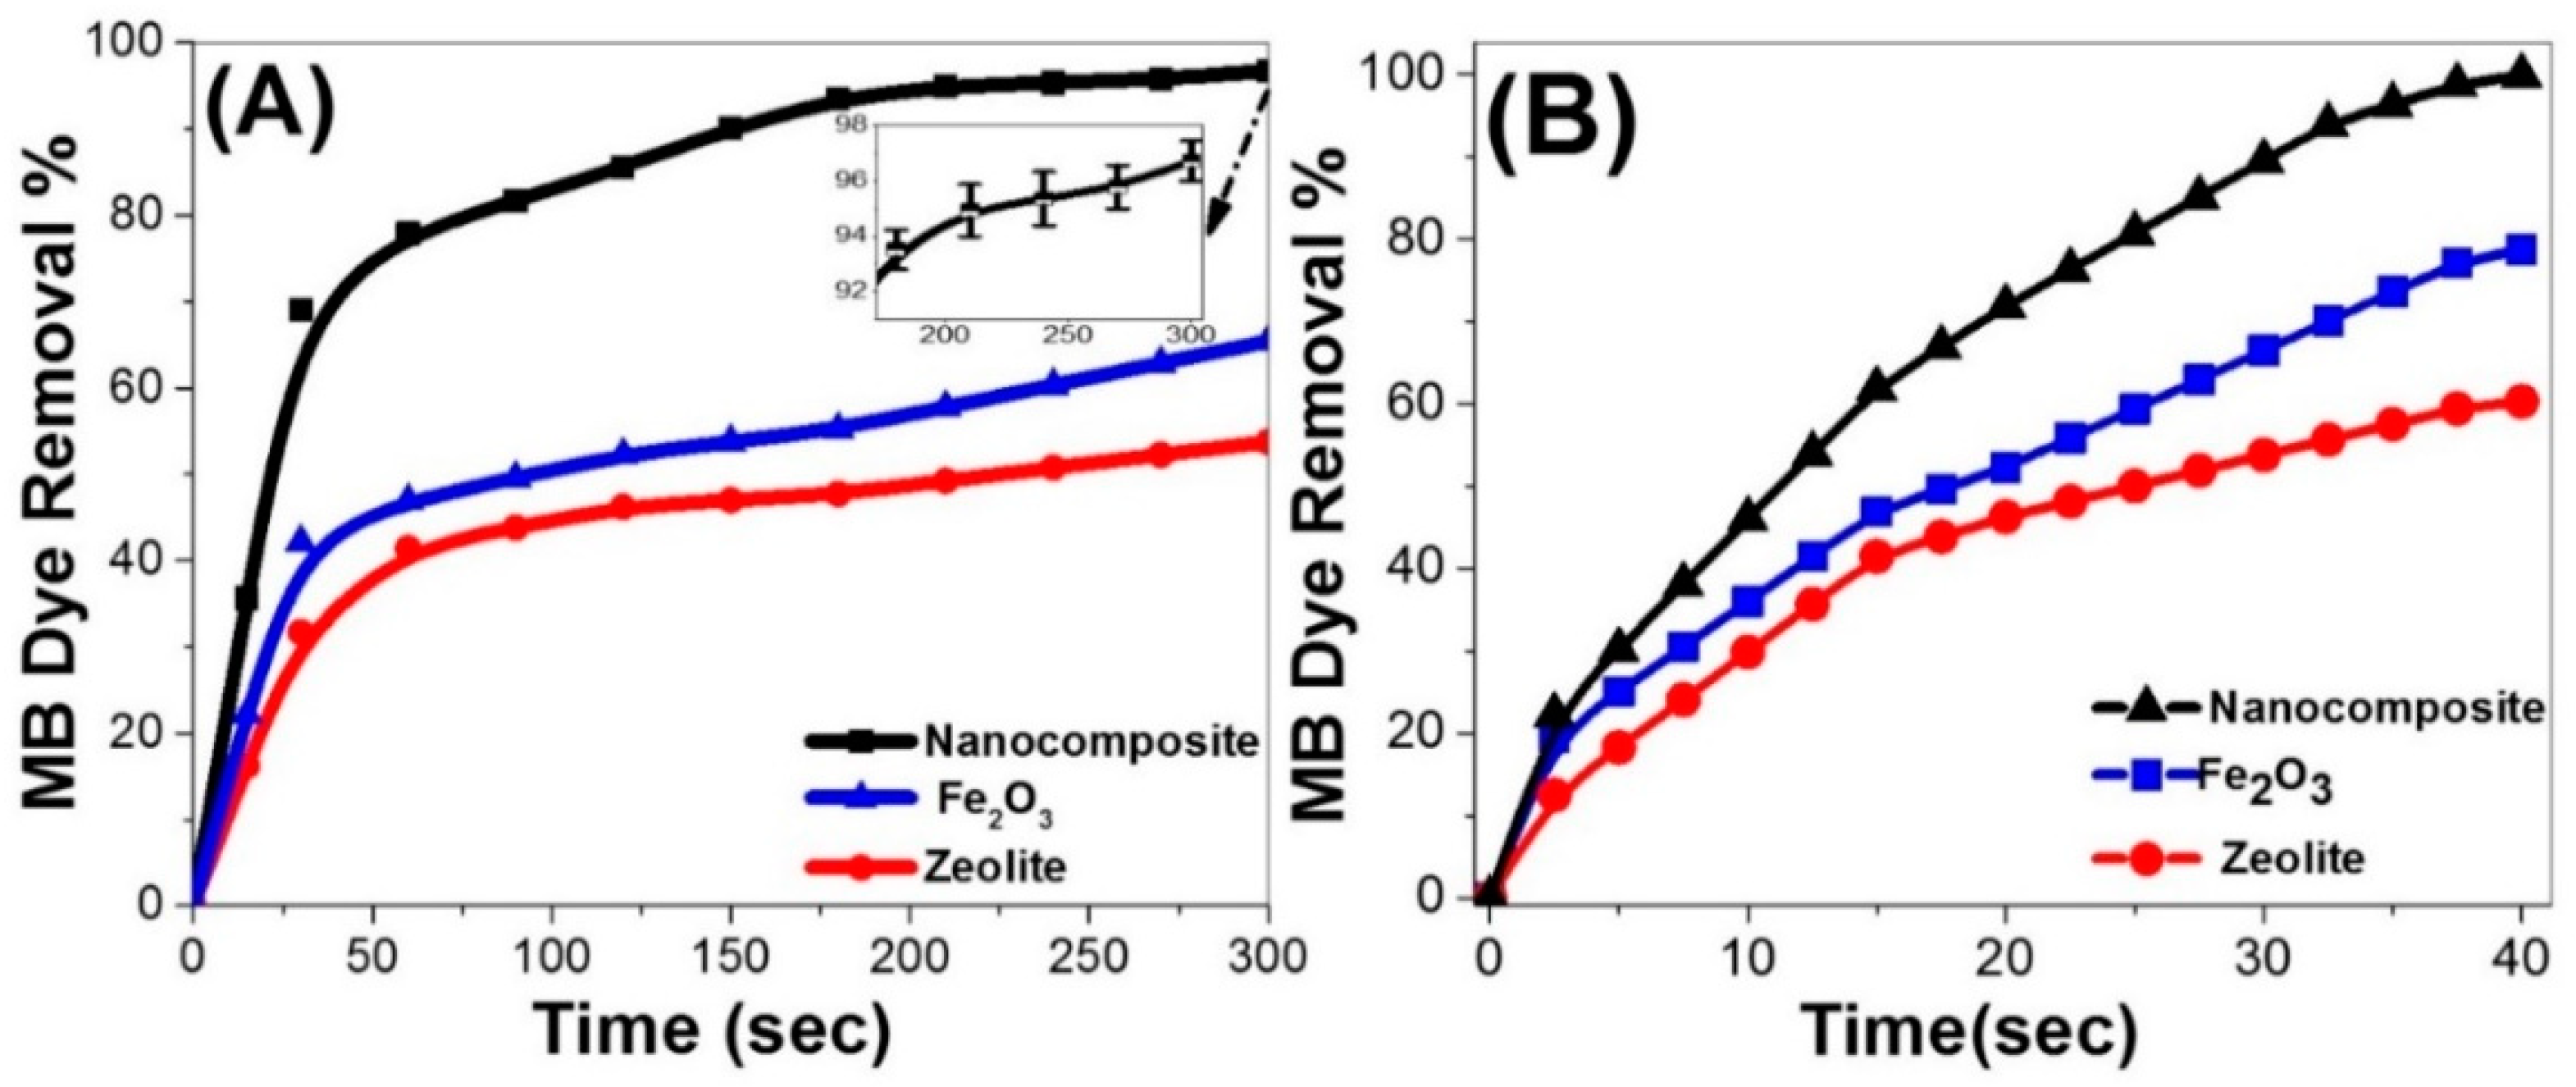
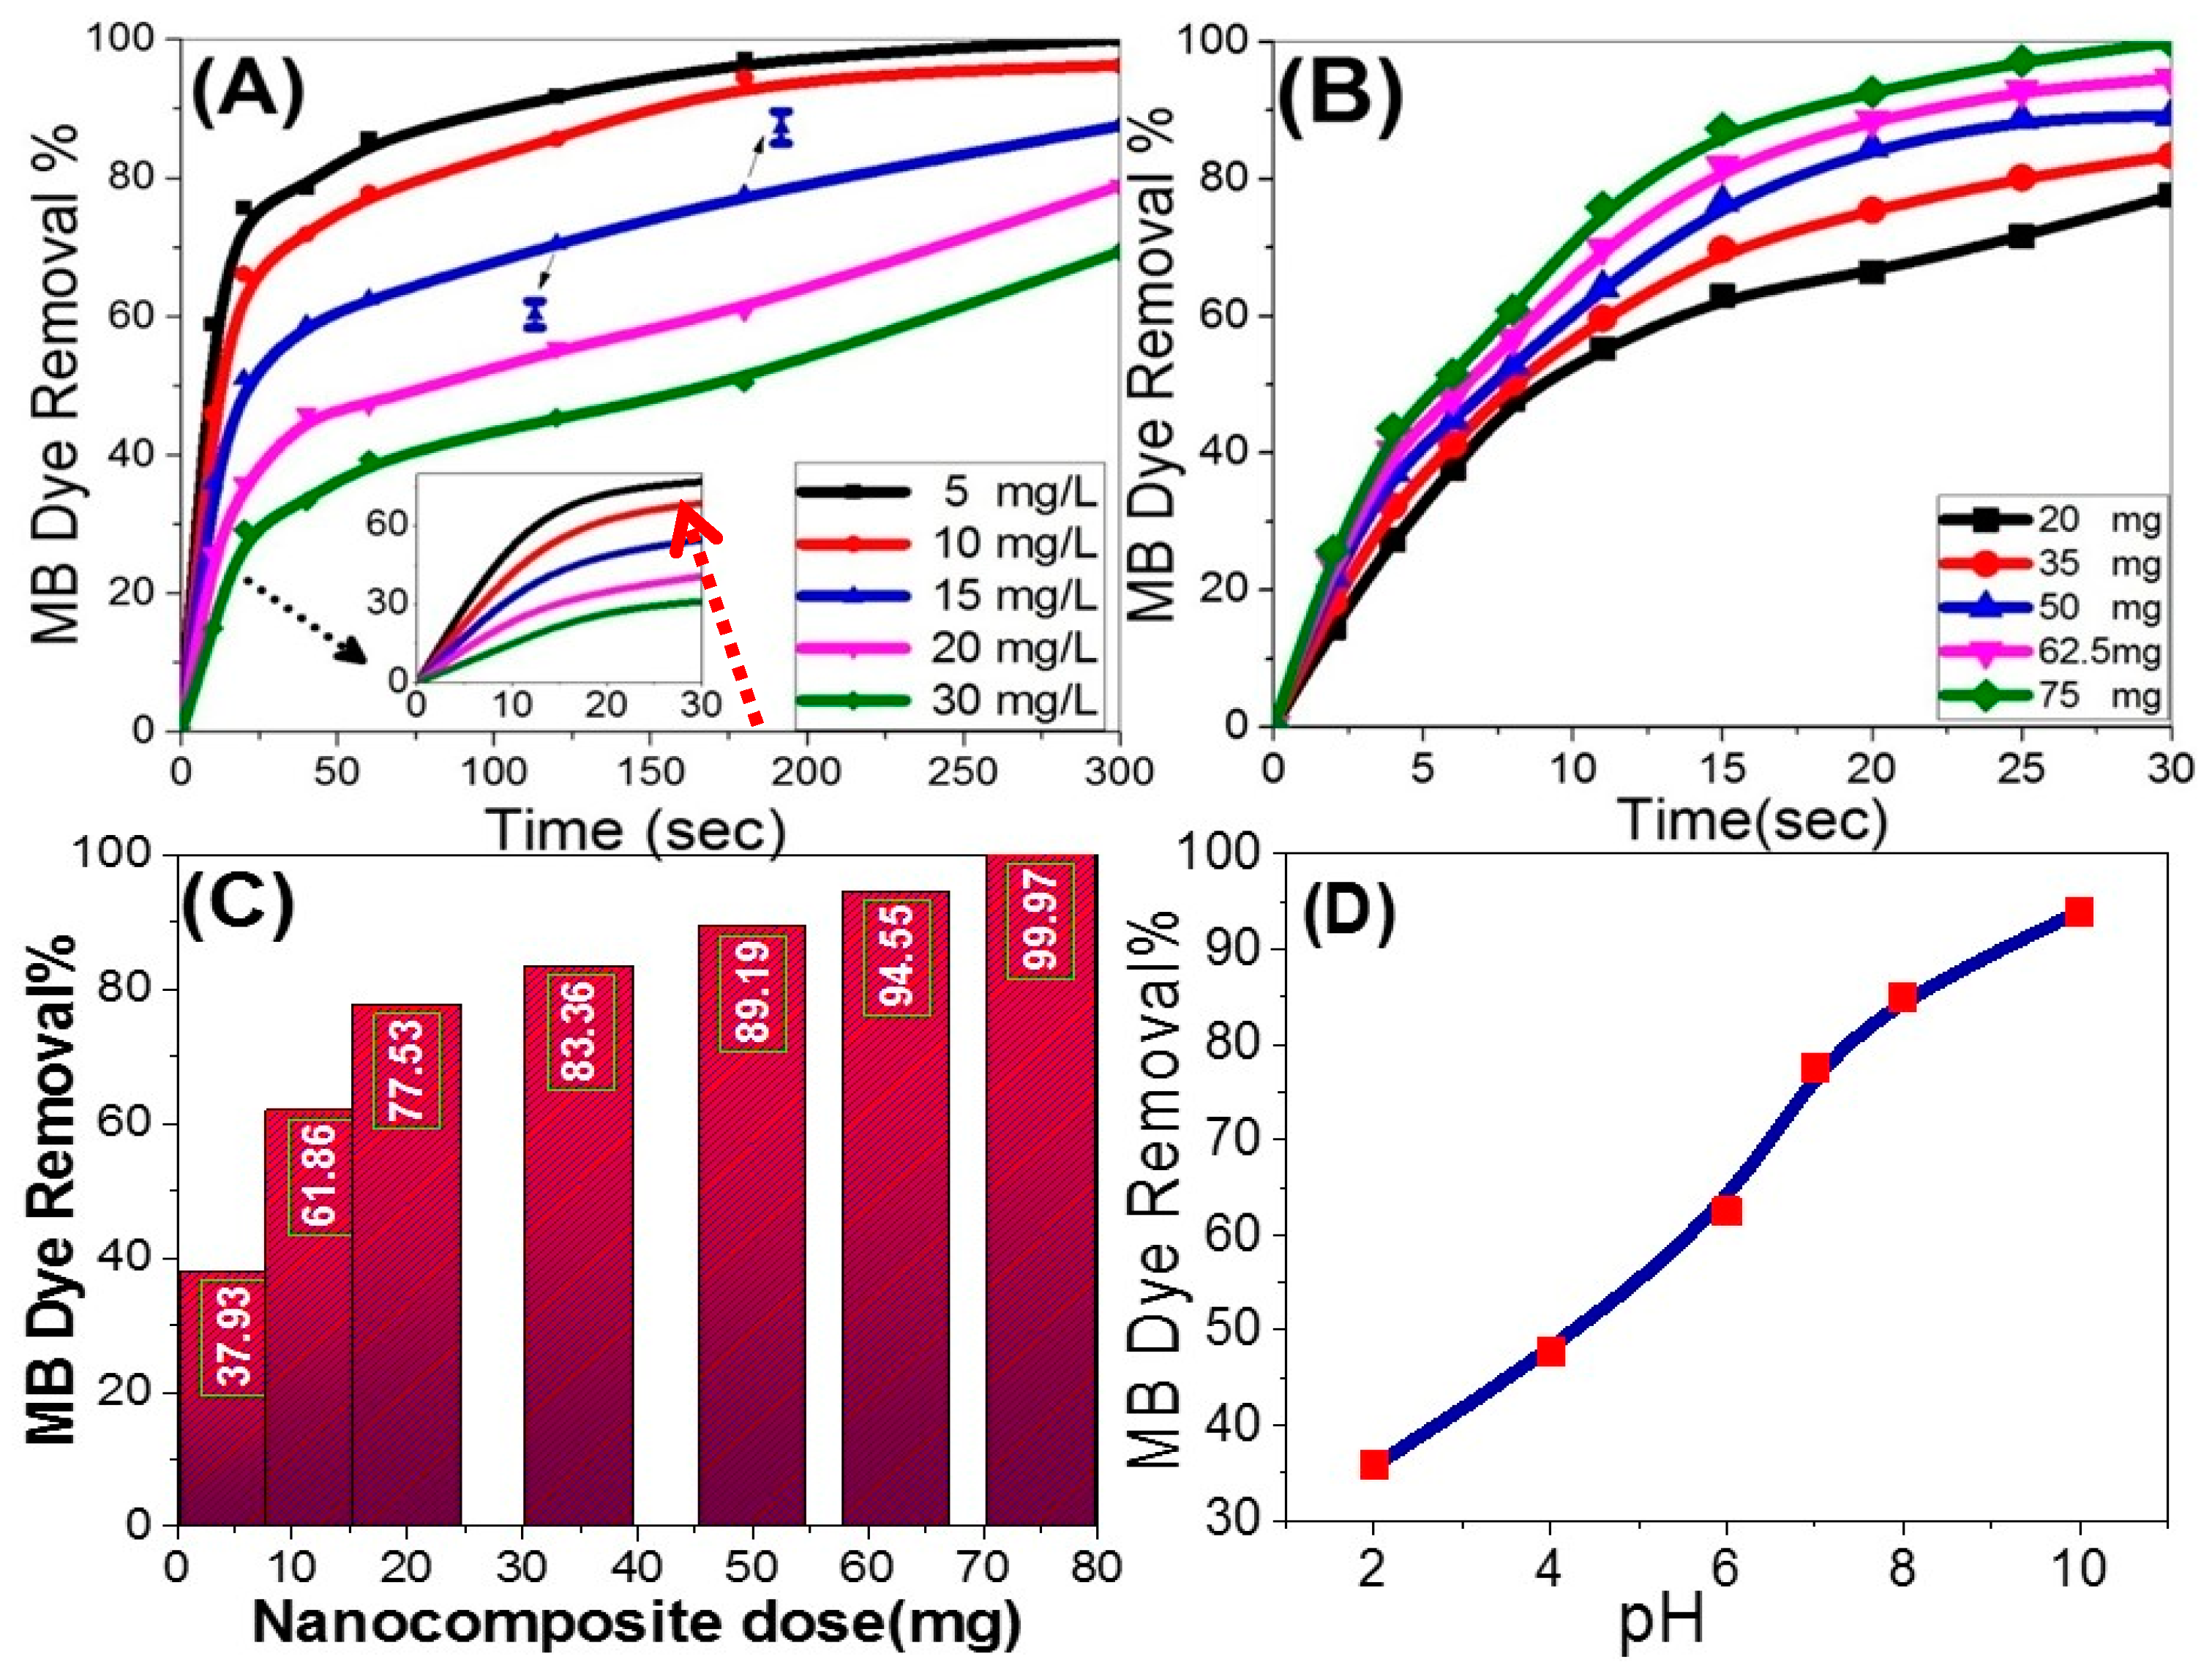
3.2.1. Role of the Catalyst Support and Effect of Irradiation Time

The photocatalysis tests were performed over Fe2O3, zeolite, and Fe2O3-zeolite to recognize their influences on the photodegradation performance and to evaluate the role of zeolite for enhancing the photocatalytic behavior of Fe2O3 for MB photodegradation utilizing the sunlight (Figure 5). The values of the photocatalytic removal% within 300 s, Figure 5A, are 53%, 65%, and 96% for the photocatalytic degradation of MB using 20 mg of zeolite, Fe2O3, and Fe2O3-zeolite, respectively. With increasing the catalyst dose to 60 mg and 40 s exposure time, Figure 5B, the photocatalytic degradation efficiency is jumped to reach ~60%, 78%, and 99% using zeolite, Fe2O3, and Fe2O3-zeolite, respectively. These results showed that the existence of zeolite supporting can play the main role in improving the photodegradation rate of the photocatalyst. This improvement is attributed to two factors. First, zeolite is considered an electron acceptor and contributes effectively to the enhancement of the electron transfer from the photoexcited Fe2O3 to the host zeolite molecules. Consequently, it prevents electron-hole recombination [36]. Second, it reflects several beneficial attributes, such as its high effective surface areas and strong adsorption property.
From Figure 5, MB dye removal% increases continuously with increasing the exposure time for all catalysts until a specific time and then reaches a plateau value. Comparing the time-scale photodegradation profiles of MB over zeolite, Fe2O3, and Fe2O3-zeolite under sunlight illumination, an efficient photodegradation of MB is observable utilizing 60 mg of Fe2O3-zeolite within 40 s. The high performance of the Fe2O3-zeolite photocatalyst is due to its ability to grow charging carriers formed by incident photons in the development of oxidizing radicals such as hydroxyl radicals/superoxide anions. The oxidizing radicals density in the photocatalytic cell controls the photocatalyst’s effectiveness in moving the charge carriers and degrading the organic pollutants.

3.2.2. Influence of Starting Dye Concentrations and Photocatalyst Dosage

The influence of the starting dye concentrations (5–30 mg/L) on the time-scale photodegradation characteristics of 100 mL MB over 20 mg of Fe2O3-zeolite under sunlight illumination was studied at pH 7 and 20 °C. The graphical representation of these time-scale photodegradation profiles is shown in Figure 6A. As the exposure time increased to 300 s, the photocatalytic MB dye removal% increases to reach 100, 96, 87, 78, and 69% at starting dye concentrations of 5, 10, 15, 20, and 30 mg/L, correspondingly. In this case, i.e., the MB photodegradation rate is decreased by rising the starting MB concentration. As shown in the inset of Figure 6A, the plateau removal% increased and reached after a short time by decreasing the initial dye concentration. This may be because the dye molecules at high concentrations serve as an optical filter to the incident light, so that, this may be because the dye molecules at high concentrations serve as an optical filter to the incident light, so that the desired light intensity may not enter the photocatalyst [37]. This is also due to the scarcity of the lifetime of the produced hydroxyl radicals (just a few nanoseconds), they can only react at or near the place where they are produced [37].
The determination of the optimum dose of photocatalysts is a key point in the scaling up of the catalytic method since it touches the financial side and separation process of the catalyst from the MB solution. The effects of the Fe2O3-zeolite dose (20, 35, 50, 62, and 75 mg) on the time-scale photodegradation curves of 100 mL MB (10 mg/L) were tested up to 30 s exposure time at pH 7 and 20 °C, Figure 6B. As the exposure time increased, the MB dye removal% increased to reach 77% over 20 mg Fe2O3-zeolite after 30 s. The complete removal of the MB dye is reached at 30 s by increasing the dose of Fe2O3-zeolite to 75 mg. Increasing the catalyst dose speeds the photodegradation cycle by supplying more active sites to generate free radicals [38,39]. In addition, the average MB dye removal% of triplicate measurements are presented as a single point data in Figure 6C at 30 s using different catalyst masses over 10 mg/L MB dye solutions at pH 7 and 20 °C. The values of the average removal% were 37, 61, 77, 83, 89, 94, and 99% by using 5, 12.5, 20, 35, 50, 62.5, and 75 mg of Fe2O3-zeolite photocatalyst, respectively. Then, the amount of applied Fe2O3-zeolite to the photocatalytic system has a major impact on process performance. In this case, i.e., the photocatalytic performance improvement is correlated with an increase in the heterogeneous catalyst dose. This can be understood based on the improvement in the catalyst’s surface area and the availability of more dynamic sites for the discoloration of dye solution [40,41].

3.2.3. Influence of pH Value

The optimized pH value is a critical characteristic that directly influences the organic pollutants and photocatalyst’s net surface charges [42]. The influence of pH value on the photocatalytic removal% of MB was illustrated in Figure 6D. These measurements were carried out using 20 mg of Fe2O3-zeolite over 100 mL MB (10 mg/L) under 30 s sunlight illumination at 20 °C. There are noticeable increases in MB removal%, as the pH rises from 2 to 10. The removal% increased from 35 to 93% as the pH increased from 2 to 10. The efficient MB photodegradation was observed at high pH values (alkaline solutions) due to the surface deprotonation. Therefore, the photocatalyst surfaces are negatively charged which improves the MB (basic dye) uptake [43].

3.2.4. Reusability of the Fe2O3-Zeolite Photocatalyst

Reusability/stability is an important feature of the functional application of the Fe2O3-zeolite catalyst. The photocatalytic stability and reusability of Fe2O3-zeolite in the photodegradation of MB dye were subjected to 10 successive cycles of reusability (Figure 7) using 75 mg from the photocatalyst with 100 mL of 10 mg/L MB within 30 s under sunlight. The recovery process after each run was performed by washing and drying the used photocatalyst at 70 °C for 2 h. The catalytic photoreactivity of the Fe2O3-zeolite displays a little loss which revealed the high photostability of the catalyst upon exposure to sunlight radiation. In addition, the photodegradation percentage of dye using Fe2O3-zeolite photocatalyst displays high performance for the 10 cycles investigated at 30 s each. After the tenth run, the photocatalytic activity of the Fe2O3-zeolite was reduced from ~100 to 9%. So, after 10 recycling cycles, the Fe2O3-zeolite can retain ~97% of its initial performance. This confirms that Fe2O3-zeolite nanocatalyst is extremely stable and recyclable.

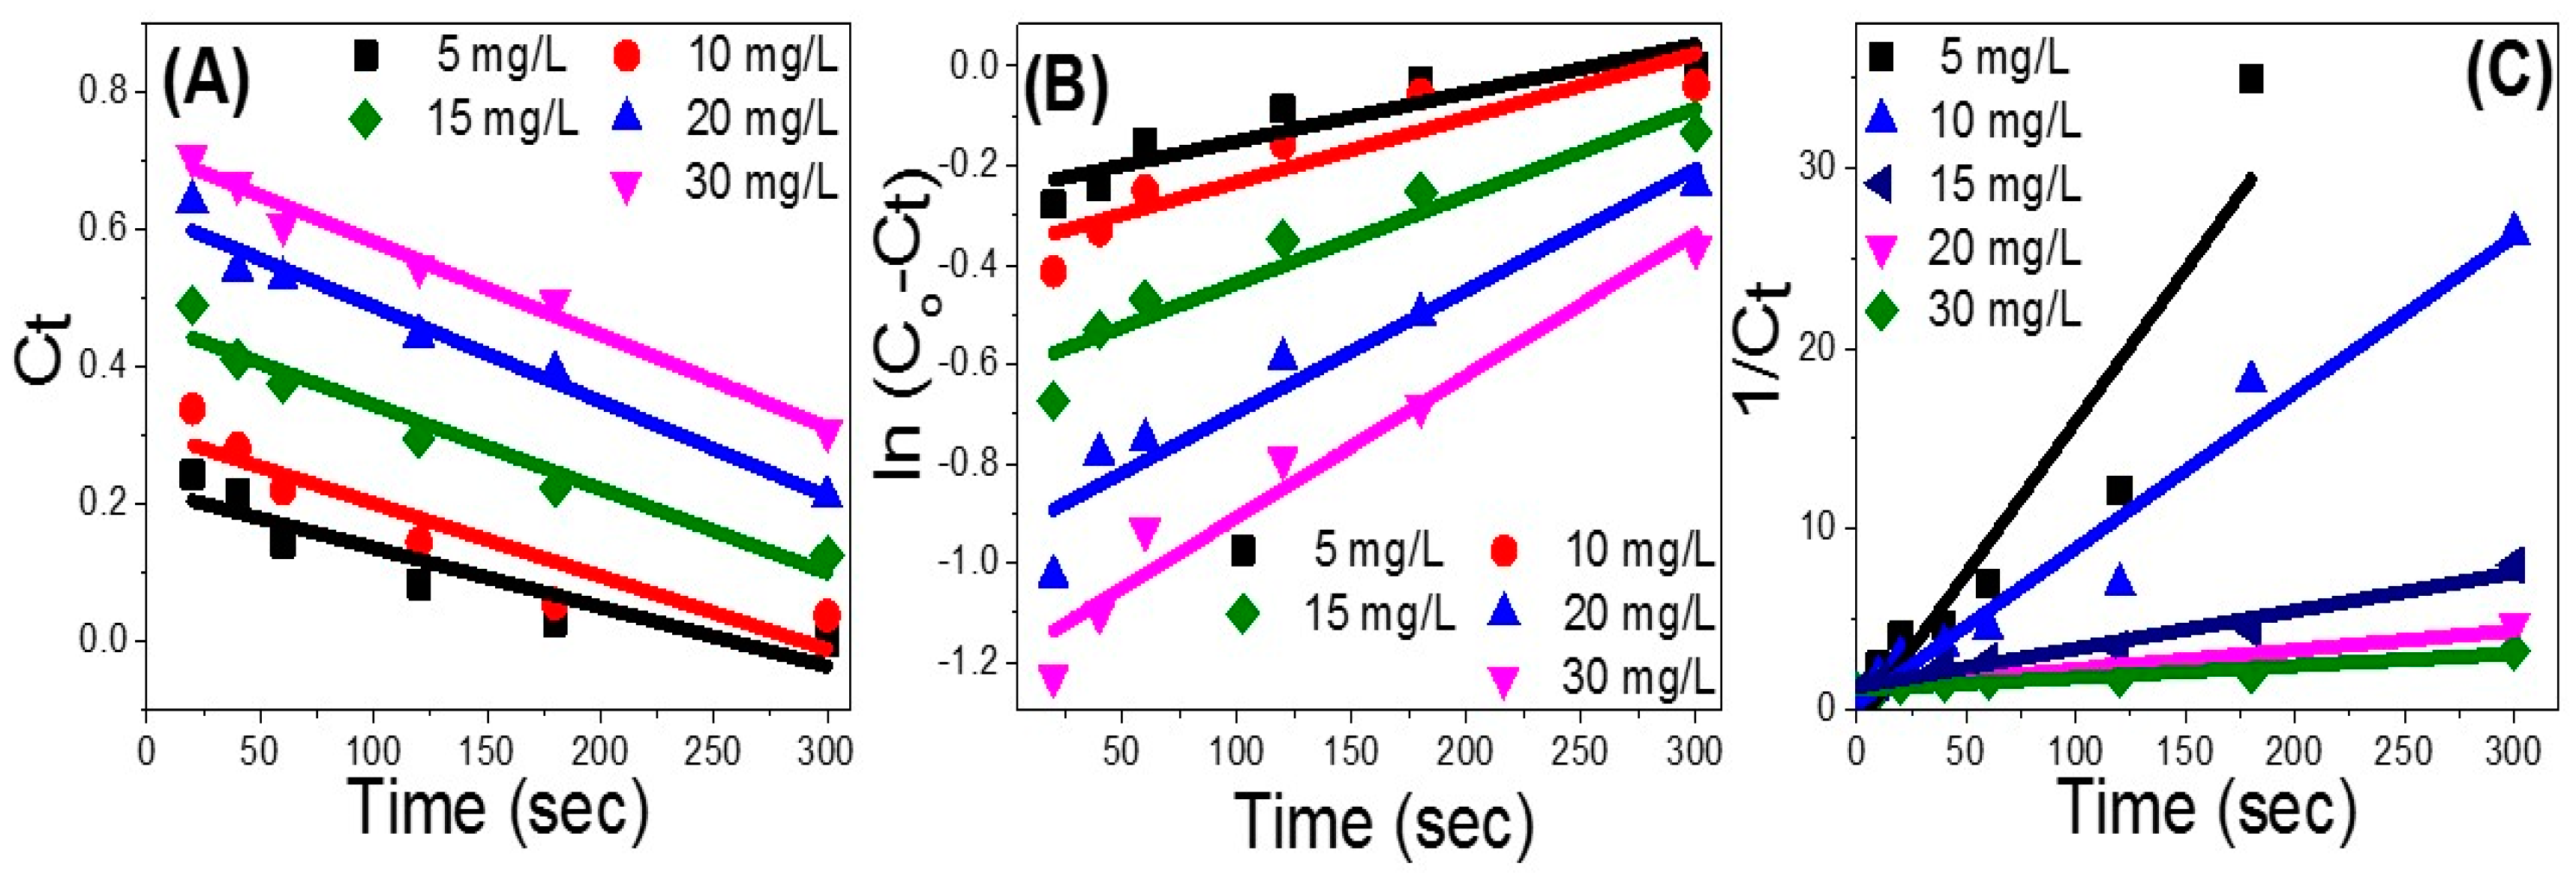
3.2.5. Kinetics of Photocatalytic Process

Facilitating the wide-ranging application of the photocatalyst requires understanding and exploring the photocatalytic reaction kinetics. The MB concentration-time curves were used to identify the suitable catalytic photodegradation kinetics for MB. In the heterogeneous photocatalytic process, the photocatalyst cleaves the aromatic ring of the dye molecules and initiates its degradation. The kinetic modeling explains the nature of the photocatalytic mechanism. The kinetic models’ parameters, containing the photocatalytic degradation rates, have been calculated by presented Ct, ln(C0/Ct), and 1/Ct vs. exposure time (t) for zero-order, pseudo-first-order, and pseudo-second-order, correspondingly. In that order, the kinetic models are presented in Equations (1)–(3) [44].
Ct = C0 − k0 t
Ct = C0 e−(k1t)
1/Ct = 1/C0 + k2 t
where, kn refers to the resultant degradation rate (n = 0, 1, 2), and Ct represents reminder MB concentration after exposure time t.
The experimental curves were fitted based on Equation (1), zero-order-model, by plotting the residual dye concentration linear regression versus the illumination time (Figure 8A). For this model, the determination coefficient (R2) value displays a good fit, especially for dye concentration ≥ 15 mg/L, Table 2. In addition, the predicted photodegradation rate (k0) increases by rising the MB concentration from 5 to 20 mg/L and then remains constant at 14 × 104 min1 until 30 mg/L (Table 2).
The plot of Ln(C0 − Ct) vs. the exposure time, Figure 8B, was fitted based on Equation (2) for the first-order model. The obtained parameters in Table 2 show a moderate fit between the experimental results and this model for MB concentration < 15 mg/L, and then a better fit for dye concentrations > 20 mg/L. The photodegradation rate constant also displays a significant rise in the calculated values to reach 29 × 104 min1, with rising the MB concentration to 30 mg/L.
The linear regression plotting of 1/Ct versus illumination time, by the same fitting process, reflects the fit of the photodegradation data to the kinetic second-order model (Figure 8C). The model’s output is displayed in Table 2. MB dye degradation tends to be matched to the second-order model at starting MB concentration of 10 mg/L and 15 mg/L. Then, the matching degree decreases for dye concentration > 20 mg/L. The value of k2 also displayed a steady decrease with rising the starting MB concentration consistent with the experimental data. The value of k2 is decreased from 1681 × 104 to 65.5 × 10⁴ L/mol.min1, with rising the starting MB concentration from 5 to 30 mg/L. Therefore, the experimental photodegradation results are well presented by the second-order model rather than any other model at starting MB concentration < 20 mg/L as shown in Table 2. Therefore, the photodegradation process is dye concentration- and catalyst dose-dependent. To identify the effect of catalyst dose in the photodegradation process similar fitting processes were carried out at different catalyst doses (20–75 mg) using Figure 6B and presented in Table 3. This table shows that the MB photodegradation follows pseudo-second-order kinetics.
For dye concentration ≥ 20 mg/L, the photodegradation process is well presented by the zero-order model instead of any other model, and the reaction rates are independent of the initial dye concentration. This is a common behavior that occurs when the reaction requires contact with a catalytic surface. The photodegradation data is fitted with more than one kinetic model to show concurrent and comparable degradation mechanisms for the studied starting MB concentrations [44]. It is important to note that the reported photodegradation rate constant, k2, is higher than any previously reported data for Fe2O3-based photocatalyst [24,45]. This can explain the fast photodegradation performance of Fe2O3-zeolite under visible light illumination.
Table 4 illustrates the photocatalytic performance of our Fe2O3-zeolite photocatalyst comparing with the previously studied metal oxide and/or zeolite-based photocatalysts for MB dye degradation [46,47,48,49,50,51,52,53]. As shown in this table, the presented photocatalytic performance parameters are much higher than the reported performances for the previously reported catalysts in the literature. As an example, the photodegradation efficiency of Ni-doped α-Fe2O3 photocatalyst was 89% after 140 min under visible light illumination [48]. In addition, Au-zeolites required 11 min under sunlight illumination to reach 50% dye removal [47]. Under the UV exposure, Fe2O3/Cu2O photocatalyst reached 91% dye removal% after 120 min, whereas, Fe2O3/graphene oxide required 100 min to reach the complete removal% [49,50].

3.2.6. Chemical Oxygen Demand (COD) Measurements

The mineralization degree was estimated by analyzing the chemical oxygen demand (COD) in methylene dye solution under sunlight. This technique has been frequently used to quantify the organic waste water capacity. The COD of the dye solution was estimated before and after the treatment. The COD   removal   ( % ) was calculated from Equation (4);
COD   removal   ( % ) = Initial   COD     Final   COD     Initial   COD × 100
For aqueous solution of MB, the COD removal% was more than 91% after visible light irradiation for 60 min as seen in Figure S3 (supplementary data).

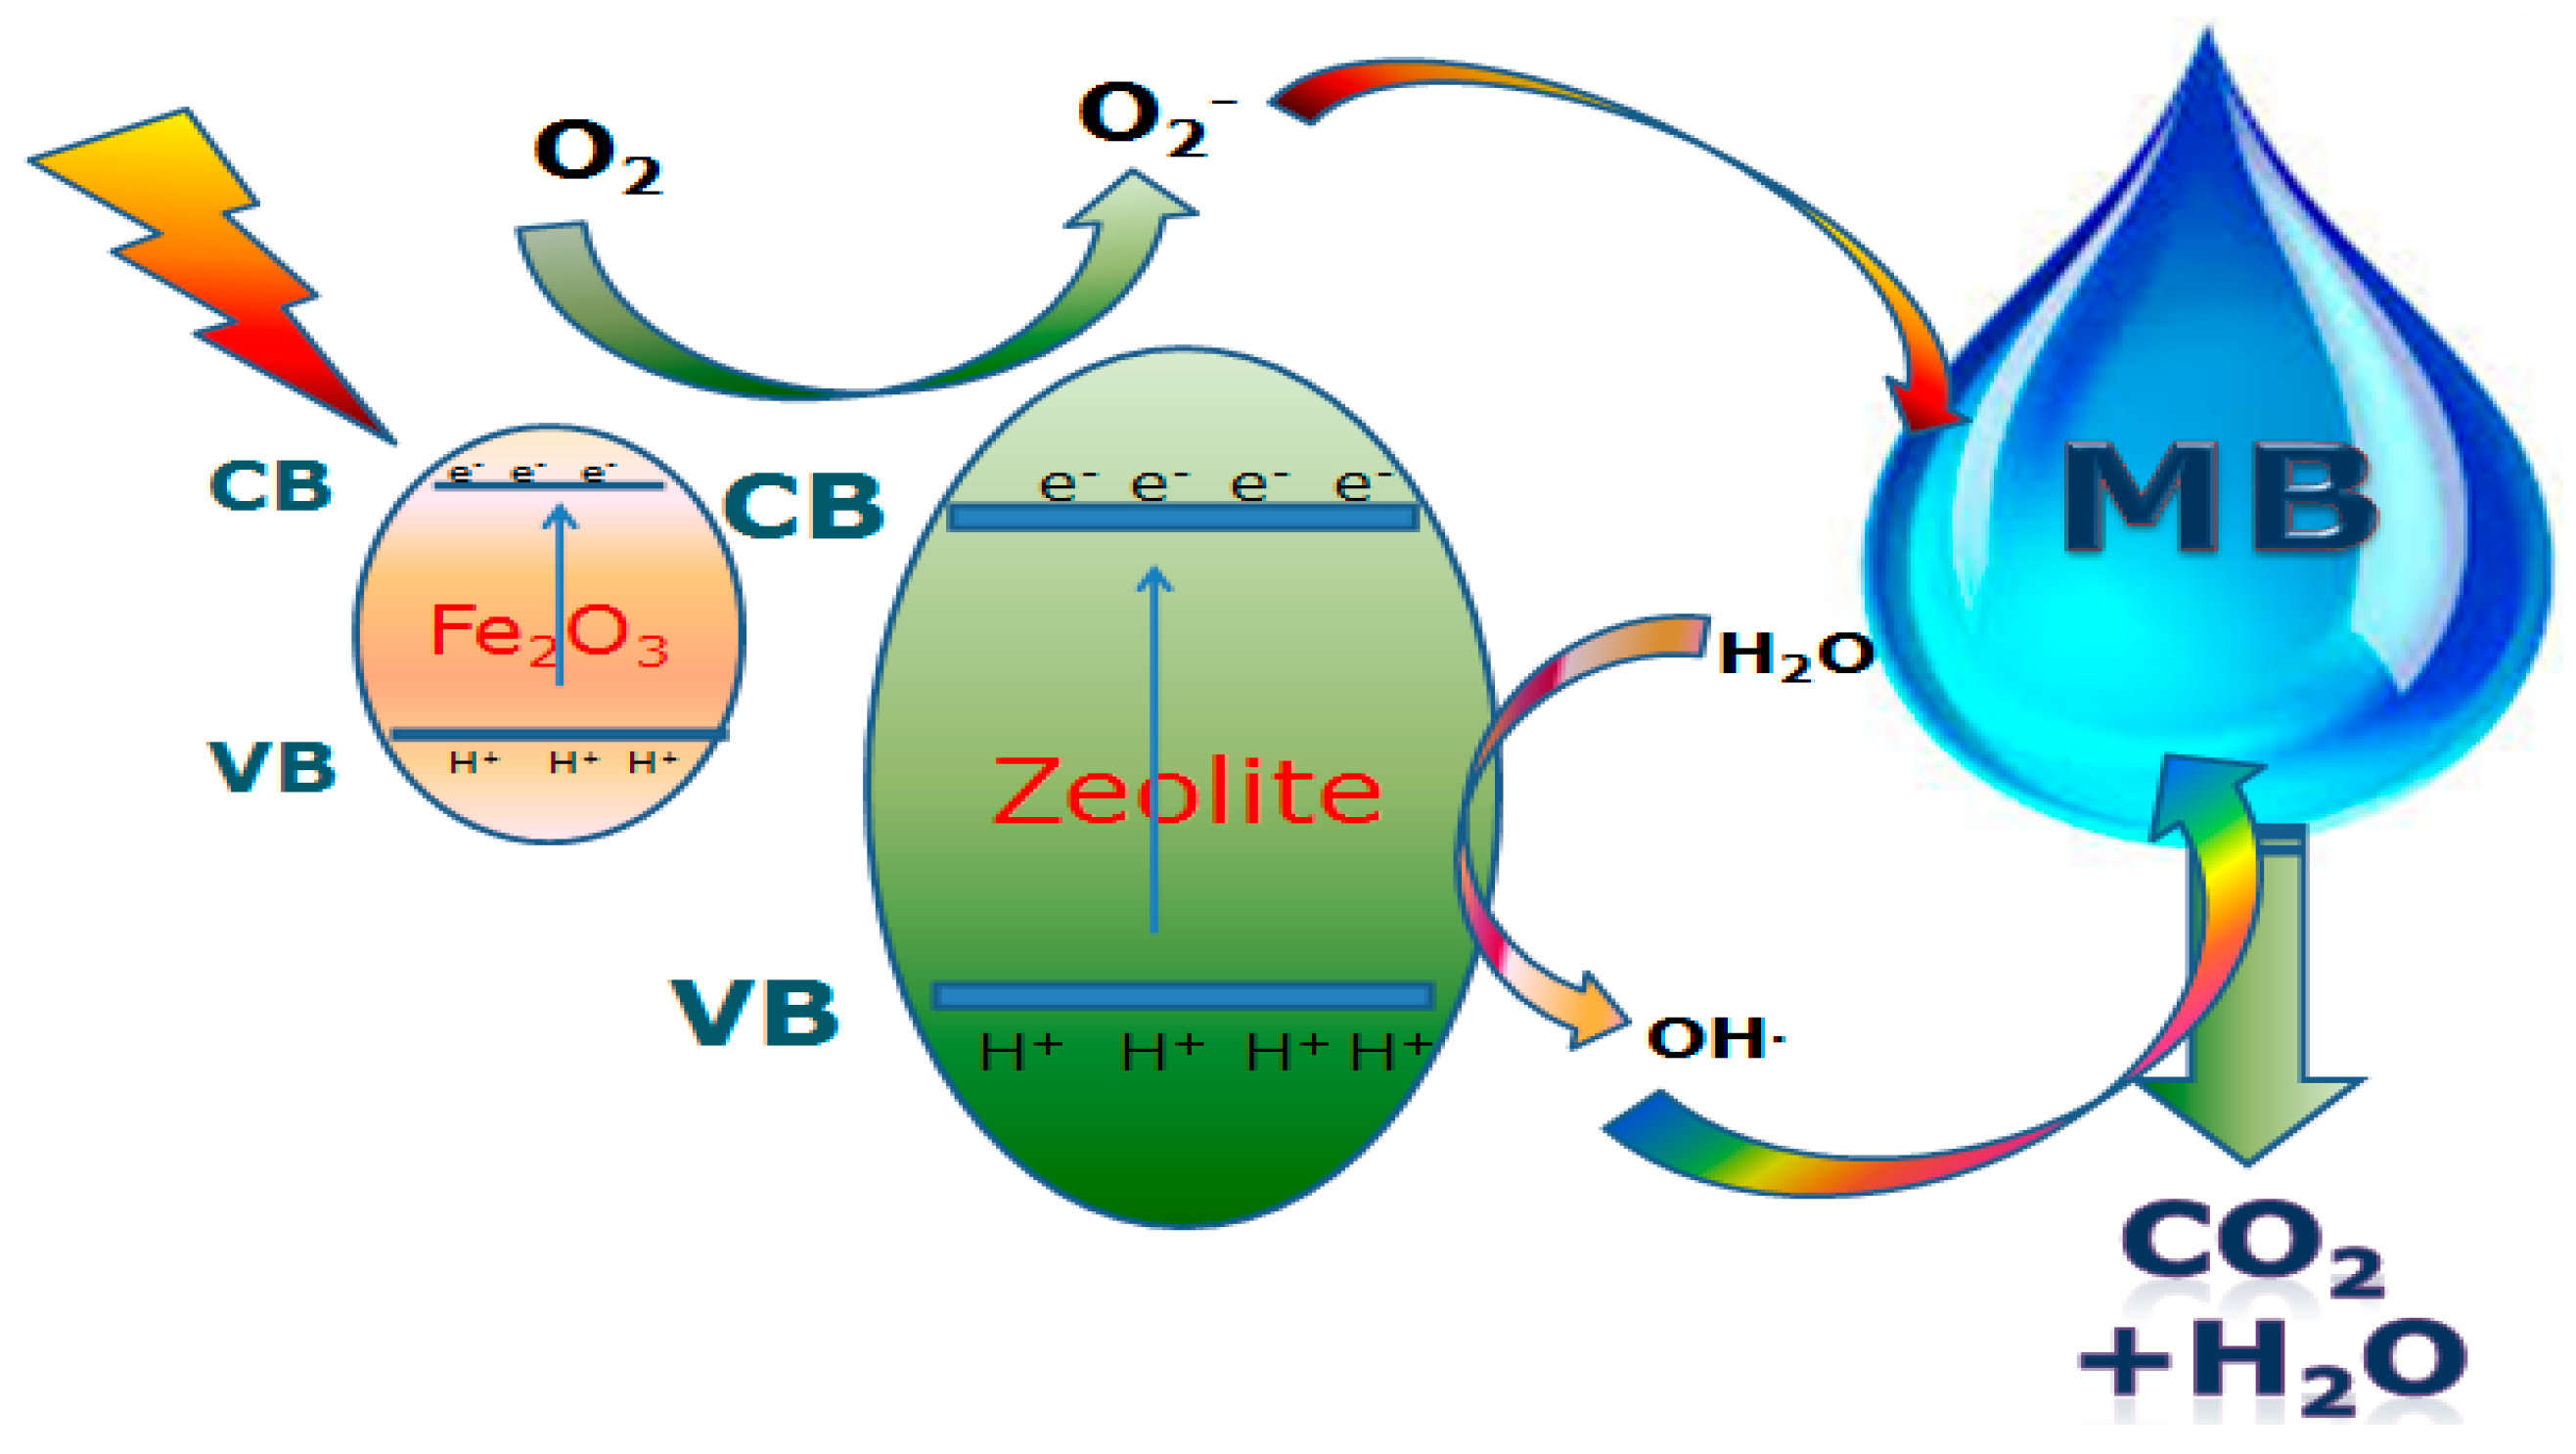
3.2.7. Photocatalytic Mechanism of Fe2O3-Zeolite

Fe2O3 has been considered one of the main heterogeneous photocatalysts in the fields of solar energy conversion and environmental treatment, but it suffers from many disadvantages such as high load recombination, low conductivity, and short hole lengths in the bulk form [54]. The mesoporous surfaces of zeolite act as optimum sites to capture Fe2O3 nanoparticles. Adsorption is the starting stage in the photodegradation process before decoloration of MB molecules and is therefore a crucial mechanism for initiating the photodegradation process. Direct electrochemical bonding and electrostatic interactions are the principal photocatalytic reactions between photocatalyst surfaces and MB molecules. The electrochemical bonding between the functional dye groups and the active photocatalyst sites is a powerful interaction between the photocatalyst and the anchoring MB dye. Figure 9 shows a schematic diagram of the proposed mechanism of MB photodegradation using Fe2O3-zeolite under sunlight illumination. The mesoporous surfaces of zeolite serve as a large and strong holding place for Fe2O3 nanostructures and hot adsorption sites for the MB molecules at the start of the process. In addition, zeolite can distribute the exciting CB electrons of Fe2O3 into the network structure and thus reduce the recombination of electron-hole pairs [55]. Zeolite and Fe2O3 serve as active photoelectric sites during the photocatalytic cycle and require good interaction between the surfaces of MB and the photocatalyst for effective MB photodegradation. As shown in Figure 9, the Fe2O3 CB is marginally more negative whereas the VB is much more positive than the zeolite CB. It enhances the driving forces of the migration of holes relative to electrons migration. This causes a decrease of e/h+ recombination rates and can thus result in an efficient charge carrier separation. Hence, the effective e/h+ separation occurs over robust interfacial interactions in Fe2O3-zeolite heterostructure, which reduces the e/h+ recombination and improves the photo/photoelectrocatalytic performance. In addition, the trapping of the electrons by the distributed Fe2O3 nanoparticles on the surface of the mesoporous zeolite can improve the photocatalytic performance of Fe2O3-zeolite. Whereas O2•− (radical superoxide) is produced from the interaction between the trapped electron and dissolved oxygen in the photocatalytic system, which results in the development of hydroxyl radicals (•OH). The rate of oxidation of the organic compounds depends on the densities of these radicals. Additionally; the vigorous sites on the photocatalyst surfaces can play an important role in improving photocatalytic efficiency. Eventually, the cost of the engineered Fe2O3-zeolite photocatalyst is estimated to be ~0.5–0.7 USD per 1 g. However, for massive production, it can be reduced to 0.3–0.4 USD. Therefore, this study provided an innovative method for producing highly efficient photocatalysts for acceptable industrial applications at a reasonable cost.

4. Conclusions

In this paper, rusted iron wastes were recycling for the preparation of Fe2O3 and Fe2O3-zeolite photocatalyst. The use of zeolite as support has induced significant changes in the properties of Fe2O3. Compared to Fe2O3, the Fe2O3-zeolite photocatalyst had a more homogeneous mesopores diameter distribution, smaller sizes, and higher light absorption capabilities. Fe2O3-zeolite photocatalyst was applied successfully for the photodegradation of MB dye under sunlight illumination. It showed much higher photocatalytic performance against Fe2O3 nanopowder, which, to the best of our knowledge, is the highest performance yet for Fe2O3-based photocatalysts. Different photocatalytic parameters such as the exposure time, starting MB concentrations, photocatalyst dosage, and pH value have been optimized to reach the full photocatalytic degradation of MB dye (10 mg/L) within 30 s utilizing 75 mg of Fe2O3-zeolite. In addition, this photocatalyst showed extreme stability and recyclability because it can retain ~97% of its initial performance after 10 cycles of reusability. For initial dye concentration <20 mg/L, the photodegradation process followed the pseudo-second-order kinetics and showed a very high photodegradation rate constant. The present research can be applied industrially as a cost-effective technique to address two issues at once by quickly eliminating the harmful MB dye from wastewater and recycling the rusted iron wires.

Supplementary Materials

The following are available online at https://www.mdpi.com/article/10.3390/nano12020235/s1, Figure S1: Showing the scheme experimental part for the photocatalytic measurements, Figure S2: EDX spectrum of (a) zeolite, (b) Fe2O3, and (c) Fe2O3-zeolite photocatalyst, Figure S3: COD removal% versus exposure time during MB photodegradation under sunlight, Table S1: Values of the crystallographic parameters of Fe2O3 and Fe2O3-zeolite photocatalysts.

Author Contributions

Conceptualization, F.M., A.M.A. and M.S.; methodology, F.M., A.M.A. and M.S.; validation, F.M., A.M.A. and M.S.; formal analysis, F.M., A.M.A. and M.S.; investigation, F.M., A.M.A. and M.S.; resources, F.M., A.M.A., S.H. and M.S.; data curation, F.M., A.M.A., and M.S.; writing—original draft preparation, F.M., A.M.A., and M.S.; writing—review and editing, F.M., A.M.A., S.H., and M.S.; visualization, F.M., A.M.A. and M.S.; project administration, F.M., A.M.A., S.H. and M.S.; funding acquisition, F.M., A.M.A., S.H. and M.S. All authors have read and agreed to the published version of the manuscript.

Funding

This research received external funding from the Deputyship for Research and Innovation, Ministry of Education in Saudi Arabia through the project number (20/4).

Institutional Review Board Statement

Not applicable.

Informed Consent Statement

Not applicable.

Data Availability Statement

The data presented in this study are available on request from the corresponding author.

Acknowledgments

The authors extend their appreciation to the Deputyship for Research and Innovation, Ministry of Education in Saudi Arabia for funding this research work through the project number (20/4).

Conflicts of Interest

The authors declare no conflict of interest.

References

  1. Koch, G. Trends in Oil And Gas Corrosion Research And Technologies: Production and Transmission; Woodhead Publishing Series in Energy, 1st ed.; Elsevier: Amsterdam, The Netherlands, 2017; pp. 3–30. [Google Scholar] [CrossRef]
  2. Tamirat, A.G.; Rick, J.; Dubale, A.A.; Su, W.-N.; Hwang, B.-J. Using hematite for photoelectrochemical water splitting: A review of current progress and challenges. Nanoscale Horizons 2016, 1, 243–267. [Google Scholar] [CrossRef]
  3. Maryudi, M.; Amelia, S.; Salamah, S. Removal of Methylene Blue of Textile Industry Waste with Activated Carbon using Adsorption Method. Reaktor 2019, 19, 168–171. [Google Scholar] [CrossRef]
  4. Zayed, M.; Ahmed, A.M.; Shaban, M. Synthesis and characterization of nanoporous ZnO and Pt/ZnO thin films for dye degradation and water splitting applications. Int. J. Hydrogen Energy 2019, 44, 17630–17648. [Google Scholar] [CrossRef]
  5. Toxicology and Carcinogenesis Studies of Methylene Blue Trihydrate (Cas No. 7220-79-3) in F344/N Rats and B6C3F1 Mice (Gavage Studies)—PubMed, (n.d.). Available online: https://pubmed.ncbi.nlm.nih.gov/18685714/ (accessed on 18 August 2020).
  6. Foura, G.; Chouchou, N.; Soualah, A.; Kouachi, K.; Guidotti, M.; Robert, D. Fe-Doped TiO2 Supported on HY Zeolite for Solar Photocatalytic Treatment of Dye Pollutants. Catalysts 2017, 7, 344. [Google Scholar] [CrossRef] [Green Version]
  7. Ren, G.; Han, H.; Wang, Y.; Liu, S.; Zhao, J.; Meng, X.; Li, Z. Recent Advances of Photocatalytic Application in Water Treatment: A Review. Nanomaterials 2021, 11, 1804. [Google Scholar] [CrossRef] [PubMed]
  8. Shaban, M.; Ahmed, A.M.; Shehata, N.; Betiha, M.A.; Rabie, A.M. Ni-doped and Ni/Cr co-doped TiO2 nanotubes for enhancement of photocatalytic degradation of methylene blue. J. Colloid Interface Sci. 2019, 555, 31–41. [Google Scholar] [CrossRef] [PubMed]
  9. Lassoued, A.; Lassoued, M.S.; Dkhil, B.; Ammar, S.; Gadri, A. Photocatalytic degradation of methylene blue dye by iron oxide (α- Fe2O3) nanoparticles under visible irradiation. J. Mater. Sci. Mater. Electron. 2018, 29, 8142–8152. [Google Scholar] [CrossRef]
  10. Danish, M.S.S.; Estrella, L.L.; Alemaida, I.M.A.; Lisin, A.; Moiseev, N.; Ahmadi, M.; Nazari, M.; Wali, M.; Zaheb, H.; Senjyu, T. Photocatalytic Applications of Metal Oxides for Sustainable Environmental Remediation. Metals 2021, 11, 80. [Google Scholar] [CrossRef]
  11. Li, C.; Wang, D.; Gu, J.; Liu, Y.; Zhang, X. Promoting Photoelectrochemical Water Oxidation on Ti-Doped Fe2O3 Nanowires Photoanode by O2 Plasma Treatment. Catalysts 2021, 11, 82. [Google Scholar] [CrossRef]
  12. Shaban, M.; Abukhadra, M.R.; Shahien, M.G.; Ibrahim, S.S. Novel bentonite/zeolite-NaP composite efficiently removes methylene blue and Congo red dyes. Environ. Chem. Lett. 2017, 16, 275–280. [Google Scholar] [CrossRef]
  13. Nassar, M.Y.; Abdelrahman, E.A. Hydrothermal tuning of the morphology and crystallite size of zeolite nanostructures for simultaneous adsorption and photocatalytic degradation of methylene blue dye. J. Mol. Liq. 2017, 242, 364–374. [Google Scholar] [CrossRef]
  14. Zhang, G.; Song, A.; Duan, Y.; Zheng, S. Enhanced photocatalytic activity of TiO2/zeolite composite for abatement of pollutants. Microporous Mesoporous Mater. 2018, 255, 61–68. [Google Scholar] [CrossRef]
  15. Yang, L.; Wang, F.; Hakki, A.; Macphee, D.; Liu, P.; Hu, S. The influence of zeolites fly ash bead/TiO2 composite material surface morphologies on their adsorption and photocatalytic performance. Appl. Surf. Sci. 2017, 392, 687–696. [Google Scholar] [CrossRef]
  16. Ahmad, A.D.; Imam, S.; Oh, W.; Adnan, R. Fe3O4-Zeolite Hybrid Material as Hetero-Fenton Catalyst for Enhanced Degradation of Aqueous Ofloxacin Solution. Catalysts 2020, 10, 1241. [Google Scholar] [CrossRef]
  17. Abukhadra, M.R.; Shaban, M.; El Samad, M.A.A. Enhanced photocatalytic removal of Safranin-T dye under sunlight within minute time intervals using heulandite/polyaniline@ nickel oxide composite as a novel photocatalyst. Ecotoxicol. Environ. Saf. 2018, 162, 261–271. [Google Scholar] [CrossRef] [PubMed]
  18. Rubab, M.; Bhatti, I.A.; Nadeem, N.; Shah, S.A.R.; Yaseen, M.; Naz, M.Y.; Zahid, M. Synthesis and photocatalytic degradation of rhodamine B using ternary zeolite/WO3/Fe3O4 composite. Nanotechnology 2021, 32, 345705. [Google Scholar] [CrossRef]
  19. Xu, C.; Wang, J.; Gao, B.; Dou, M.; Chen, R. Synergistic adsorption and visible-light catalytic degradation of RhB from recyclable 3D mesoporous graphitic carbon nitride/reduced graphene oxide aerogels. J. Mater. Sci. 2019, 54, 8892–8906. [Google Scholar] [CrossRef]
  20. Tedla, H.; Díaz, I.; Kebede, T.; Taddesse, A.M. Taddesse, Synthesis, characterization and photocatalytic activity of zeolite supported ZnO/ Fe2O3/MnO2 nanocomposites. J. Environ. Chem. Eng. 2015, 3, 1586–1591. [Google Scholar] [CrossRef]
  21. Garay-Rodríguez, M.E.; Gutiérrez-Arzaluz, M.; Mejía-Saavedra, J.; Carrizales-Yánez, L.; Mugica-Álvarez, V.; Torres-Rodríguez, M. Natural Mexican Zeolite Modified with Iron to Remove Arsenic Ions from Water Sources. Proceedings 2018, 2, 1312. [Google Scholar] [CrossRef] [Green Version]
  22. Chen, F.; Li, Y.; Cai, W.; Zhang, J. Preparation and sono-Fenton performance of 4A-zeolite supported α- Fe2O3. J. Hazard. Mater. 2010, 177, 743–749. [Google Scholar] [CrossRef]
  23. Jahangirian, H.; Rafiee-Moghaddam, R.; Jahangirian, N.; Nikpey, B.; Jahangirian, S.; Bassous, N.; Saleh, B.; Kalantari, K.; Webster, T.J. Green Synthesis of Zeolite/Fe2O3 Nanocomposites: Toxicity & Cell Proliferation Assays and Application as a Smart Iron Nanofertilizer. Int. J. Nanomed. 2020, 15, 1005–1020. [Google Scholar] [CrossRef] [Green Version]
  24. Mohamed, F.; Rabia, M.; Shaban, M. Synthesis and characterization of biogenic iron oxides of different nanomorphologies from pomegranate peels for efficient solar hydrogen production. J. Mater. Res. Technol. 2020, 9, 4255–4271. [Google Scholar] [CrossRef]
  25. Parmar, V.; Changela, K.; Srinivas, B.; Sankar, M.M.; Mohanty, S.; Panigrahi, S.K.; Hariharan, K.; Kalyanasundaram, D. Relationship between dislocation density and antibacterial activity of cryo-rolled and cold-rolled copper. Materials 2019, 12, 200. [Google Scholar] [CrossRef] [PubMed] [Green Version]
  26. Lang, J.; Mohrbach, J.; Dillinger, S.; Hewer, J.M.; Niedner-Schatteburg, G. Vibrational blue shift of coordinated N2 in [Fe3O(OAc)6(N2)n]+: “non-classical” dinitrogen complexes. Chem. Commun. 2017, 53, 420–423. [Google Scholar] [CrossRef] [Green Version]
  27. Shendrik, R.; Kaneva, E.; Radomskaya, T.; Sharygin, I.; Marfin, A. Relationships between the Structural, Vibrational, and Optical Properties of Microporous Cancrinite. Crystals 2021, 11, 280. [Google Scholar] [CrossRef]
  28. Shokrolahi, S.; Farhadian, M.; Davari, N. Degradation of Enrofloxacin antibiotic in contaminated water by ZnO/Fe2O3/Zeolite nanophotocatalyst. J. Appl. Res. Water Wastewater 2019, 6, 150–155. [Google Scholar] [CrossRef]
  29. De Góis, M.M.; Araújo, W.D.P.; da Silva, R.; da Luz, G.E.; Soares, J.M. Bi25FeO40—Fe3O4—Fe2O3 composites: Synthesis, structural characterization, magnetic and UV–visible photocatalytic properties. J. Alloy. Compd. 2019, 785, 598–602. [Google Scholar] [CrossRef]
  30. Cao, Y.-Q.; Zi, T.-Q.; Zhao, X.-R.; Liu, C.; Ren, Q.; Fang, J.-B.; Li, W.-M.; Li, A.-D. Enhanced visible light photocatalytic activity of Fe2O3 modified TiO2 prepared by atomic layer deposition. Sci. Rep. 2020, 10, 13437. [Google Scholar] [CrossRef]
  31. Bharath, G.; Anwer, S.; Mangalaraja, R.V.; Alhseinat, E.; Banat, F.; Ponpandian, N. Sunlight-Induced photochemical synthesis of Au nanodots on α-Fe2O3@Reduced graphene oxide nanocomposite and their enhanced heterogeneous catalytic properties. Sci. Rep. 2018, 8, 5718. [Google Scholar] [CrossRef] [PubMed]
  32. Baldovi, H. Optimization of α-Fe2O3 Nanopillars Diameters for Photoelectrochemical Enhancement of α-Fe2O3-TiO2 Heterojunction. Nanomaterials 2021, 11, 2019. [Google Scholar] [CrossRef]
  33. Lei, Y.; Huo, J.; Liao, H. Microstructure and photocatalytic properties of polyimide/heterostructured NiO–Fe2O3–ZnO nanocomposite films via an ion-exchange technique. RSC Adv. 2017, 7, 40621–40631. [Google Scholar] [CrossRef] [Green Version]
  34. Valášková, M.; Tokarský, J.; Pavlovský, J.; Prostějovský, T.; Kočí, K. α-Fe2O3 Nanoparticles/Vermiculite Clay Material: Structural, Optical and Photocatalytic Properties. Materials 2019, 12, 1880. [Google Scholar] [CrossRef] [Green Version]
  35. Suman; Chahal, S.; Kumar, A.; Kumar, P. Zn Doped α-Fe2O3: An Efficient Material for UV Driven Photocatalysis and Electrical Conductivity. Crystals 2020, 10, 273. [Google Scholar] [CrossRef] [Green Version]
  36. Dutta, P.K.; Severance, M. Photoelectron Transfer in Zeolite Cages and Its Relevance to Solar Energy Conversion. J. Phys. Chem. Lett. 2011, 2, 467–476. [Google Scholar] [CrossRef]
  37. Weldegebrieal, G.K. Synthesis method, antibacterial and photocatalytic activity of ZnO nanoparticles for azo dyes in wastewater treatment: A review. Inorg. Chem. Commun. 2020, 120, 108140. [Google Scholar] [CrossRef]
  38. Melinte, V.; Stroea, L.; Chibac-Scutaru, A.L. Polymer Nanocomposites for Photocatalytic Applications. Catalysts 2019, 9, 986. [Google Scholar] [CrossRef] [Green Version]
  39. Mohamed, F.; Abukhadra, M.R.; Shaban, M. Removal of safranin dye from water using polypyrrole nanofiber/Zn-Fe layered double hydroxide nanocomposite (Ppy NF/Zn-Fe LDH) of enhanced adsorption and photocatalytic properties. Sci. Total. Environ. 2018, 640–641, 352–363. [Google Scholar] [CrossRef] [PubMed]
  40. Chiu, Y.-H.; Chang, T.-F.M.; Chen, C.-Y.; Sone, M.; Hsu, Y.-J. Mechanistic Insights into Photodegradation of Organic Dyes Using Heterostructure Photocatalysts. Catalysts 2019, 9, 430. [Google Scholar] [CrossRef] [Green Version]
  41. Li, S.; Zhang, J.; Cao, Y.; Yang, Y.; Xie, T.; Lin, Y. Visible light assisted heterogeneous photo-Fenton-like degradation of Rhodamine B based on the Co-POM/N-TiO2 composites: Catalyst properties, photogenerated carrier transfer and degradation mechanism. Colloids Surf. A Physicochem. Eng. Asp. 2021, 127479, in press. [Google Scholar] [CrossRef]
  42. Jallouli, N.; Elghniji, K.; Trabelsi, H.; Ksibi, M. Photocatalytic degradation of paracetamol on TiO2 nanoparticles and TiO2/cellulosic fiber under UV and sunlight irradiation. Arab. J. Chem. 2017, 10, S3640–S3645. [Google Scholar] [CrossRef] [Green Version]
  43. Adeyemo, A.A.; Adeoye, I.O.; Bello, O.S. Adsorption of dyes using different types of clay: A review. Appl. Water Sci. 2017, 7, 543–568. [Google Scholar] [CrossRef] [Green Version]
  44. Ozer, L.Y.; Garlisi, C.; Oladipo, H.; Pagliaro, M.; Sharief, S.A.; Yusuf, A.; Almheiri, S.; Palmisano, G. Inorganic semiconductors-graphene composites in photo(electro)catalysis: Synthetic strategies, interaction mechanisms and applications. J. Photochem. Photobiol. C: Photochem. Rev. 2017, 33, 132–164. [Google Scholar] [CrossRef]
  45. Kumar, M.R.A.; Abebe, B.; Nagaswarupa, H.P.; Murthy, H.C.A.; Ravikumar, C.R.; Sabir, F.K. Enhanced photocatalytic and electrochemical performance of TiO2- Fe2O3 nanocomposite: Its applications in dye decolorization and as supercapacitors. Sci. Rep. 2020, 10, 1249. [Google Scholar] [CrossRef] [PubMed] [Green Version]
  46. Wu, Z.; Chen, X.; Liu, X.; Yang, X.; Yang, Y. Ternary Magnetic Recyclable ZnO/Fe3O4/g-C3N4 Composite Photocatalyst for Efficient Photodegradation of Monoazo Dye. Nanoscale Res. Lett. 2019, 14, 147. [Google Scholar] [CrossRef]
  47. León, E.R.; Rodríguez, E.L.; Beas, C.R.; Plascencia-Villa, G.; Palomares, R.A.I. Palomares, Study of Methylene Blue Degradation by Gold Nanoparticles Synthesized within Natural Zeolites. J. Nanomater. 2016, 2016, 9541683. [Google Scholar] [CrossRef]
  48. Lassoued, A.; Lassoued, M.S.; García-Granda, S.; Dkhil, B.; Ammar, S.; Gadri, A. Synthesis and characterization of Ni-doped α-Fe2O3 nanoparticles through co-precipitation method with enhanced photocatalytic activities. J. Mater. Sci. Mater. Electron. 2018, 29, 5726–5737. [Google Scholar] [CrossRef]
  49. Wang, F.; Yu, X.; Ge, M.; Wu, S.; Guan, J.; Tang, J.; Wu, X.; Ritchie, R.O. Facile self-assembly synthesis of Γ- Fe2O3 /graphene oxide for enhanced photo-Fenton reaction. Environ. Pollut. 2019, 248, 229–237. [Google Scholar] [CrossRef]
  50. Abhilash, M.R.; Akshatha, G.; Srikantaswamy, S. Photocatalytic dye degradation and biological activities of the Fe2O3/Cu2O nanocomposite. RSC Adv. 2019, 9, 8557–8568. [Google Scholar] [CrossRef] [Green Version]
  51. Bui, V.K.H.; Park, D.; Pham, T.N.; An, Y.; Choi, J.S.; Lee, H.U.; Kwon, O.-H.; Moon, J.-Y.; Kim, K.-T.; Lee, Y.-C. Synthesis of MgAC-Fe3O4/TiO2 hybrid nanocomposites via sol-gel chemistry for water treatment by photo-Fenton and photocatalytic reactions. Sci. Rep. 2019, 9, 2876. [Google Scholar] [CrossRef] [Green Version]
  52. Kamal, S.; Balu, S.; Palanisamy, S.; Uma, K.; Velusamy, V.; Yang, T.C. Synthesis of boron doped C3N4/NiFe2O4 nanocomposite: An enhanced visible light photocatalyst for the degradation of methylene blue. Results Phys. 2019, 12, 1238–1244. [Google Scholar] [CrossRef]
  53. Liao, G.; He, W.; He, Y. Investigation of Microstructure and Photocatalytic Performance of a Modified Zeolite Supported Nanocrystal TiO2 Composite. Catalysts 2019, 9, 502. [Google Scholar] [CrossRef] [Green Version]
  54. Nehme, S.I.; Crocker, L.; Fruk, L. Flavin-Conjugated Iron Oxide Nanoparticles as Enzyme-Inspired Photocatalysts for Azo Dye Degradation. Catalysts 2020, 10, 324. [Google Scholar] [CrossRef] [Green Version]
  55. Patnaik, S.; Martha, S.; Parida, K.M. An overview of the structural, textural and morphological modulations of g-C3N4 towards photocatalytic hydrogen production. RSC Adv. 2016, 6, 46929–46951. [Google Scholar] [CrossRef]
Figure 1. SEM micrographs and the corresponding particle size distribution for (A,D) natural zeolite, (B,E) Fe2O3, and (C,F) Fe2O3-zeolite.
Nanomaterials 12 00235 g001
Figure 2. XRD patterns of zeolite, Fe2O3, and Fe2O3-zeolite photocatalysts.
Nanomaterials 12 00235 g002
Figure 3. FTIR spectra of zeolite, Fe2O3, and Fe2O3-zeolite photocatalyst.
Nanomaterials 12 00235 g003
Figure 4. Absorbance and Tauc curve for zeolite (A), Fe2O3 (B), and Fe2O3-zeolite (C); and absorbance at 500 nm and indirect Eg for all samples (D).
Nanomaterials 12 00235 g004
Figure 5. The photocatalytic degradation of 100 mL MB dye solution of concentration 10 mg/L at pH 7 using zeolite, Fe2O3, and Fe2O3-zeolite photocatalyst (A) 20 mg, and (B) 60 mg. The inset shows the statistical error bars.
Nanomaterials 12 00235 g005
Figure 6. Effects of (A) initial dye concentration over 20 mg Fe2O3-zeolite and (B) photocatalyst dose for 10 mg/L MB on the time-scale photodegradation profiles of MB; MB dye removal as a function of (C) photocatalyst dose and (D) pH value using 20 mg of the catalyst over 100 mL MB under 30 s sunlight illumination at 20 °C.
Nanomaterials 12 00235 g006
Figure 7. The reusability of 75 mg of Fe2O3-zeolite photocatalyst for degradation 10 mg/L of MB for 10 runs at pH 7 for 30 s.
Nanomaterials 12 00235 g007
Figure 8. Photodegradation data fitting using (A) zero-order (B) first-order, and (C) second-order kinetic models.
Nanomaterials 12 00235 g008
Figure 9. A schematic diagram of the proposed mechanism for MB photodegradation utilizing Fe2O3-zeolite under sunlight illumination.
Nanomaterials 12 00235 g009
Table 1. The Atomic ratio of zeolite, Fe2O3, and Fe2O3-zeolite photocatalysts.
ElementZeoliteFe2O3Fe2O3-Zeolite
O65.237.658.0
Al6.9---6.3
Si25.0---23.6
K1.3---1.4
Ca0.9---1.1
Fe1.662.48.9
Cu0.1---0.7
Table 2. The zero-, first-, and second-order kinetic parameters using 20 mg Fe2O3-zeolite photocatalyst for photodegradation of MB of different concentrations.
Kinetic ModelParameters5 mg/L10 mg/L15 mg/L20 mg/L30 mg/L
Zero-order
kinetic model
K0 (mol/(L·min))
R2
0.0009 ± 0.00018
0.8550
0.0011 ± 0.00022
0.8523
0.0012 ± 0.00014
0.9501
0.0014 ± 0.00012
0.9696
0.0014 ± 0.00009
0.9833
First-order
kinetic model
k1 (/min)
R2
0.0010 ± 0.00022
0.8329
0.001 ± 0.00030
0.8269
0.002 ± 0.00028
0.9085
0.002 ± 0.00035
0.9239
0.003 ± 0.00031
0.9553
Second-order kinetic modelk2 (L/mol min)
R2
0.17 ± 0.027
0.9039
0.09 ± 0.007
0.9620
0.02 ± 0.002
0.9703
0.01 ± 0.001
0.9350
0.01 ± 0.0006
0.9456
Table 3. The zero-, first-, and second-order kinetic parameters using 10 mg/L MB for photodegradation of MB of different concentrations.
Kinetic ModelParameters20 mg35 mg50 mg62.5 mg75 mg
Zero-order
kinetic model
K0 (mol/(L.min))
R2
0.02 ± 0.003
0.8175
0. 22 ± 0.001
0.8676
0.25 ± 0.037
0.8506
0.25 ± 0.035
0.8593
0.25 ± 0.037
0.8490
First-order
kinetic model
K1 (min−1)
R2
0.05 ± 0.001
0.60335
0.05 ± 0.001
0.6589
0.05 ± 0.001
0.6639
0.04 ± 0.010
0.71437
0.04 ± 0.009
0.7160
Second-order
kinetic model
k2 (L/mol min)
R2
0.01 ± 0.001
0.9800
0.01 ± 0.001
0.9757
0.02 ± 0.002
0.9703
0.03 ± 0.002
0.9681
0.15 ± 0.028
0.7724
Table 4. Comparison of the efficiency of the current photocatalysts with the literature values for iron oxide and/or zeolite-based photocatalysts [46,47,48,49,50,51,52,53].
CatalystLight
Source
Irradiation Time
(min)
Dye
Removal%
Ref.
ZnO/Fe3O4/g-C3N4Visible15098[46]
Au-zeoliteSunlight1150[47]
Ni-doped α-Fe2O3Visible14086[48]
Fe2O3/graphene oxideUV100100[49]
Fe2O3/Cu2OUV12091[50]
MgAC-Fe3O4/TiO2UV60100[51]
C3N4/NiFe2O4Visible8098[52]
TiO2-zeoliteUV6093[53]
Fe2O3-zeoliteSunlight596% @ 20 mgPresent work
2/399% @ 60 mg
1/2~100% @ 75 mg
Publisher’s Note: MDPI stays neutral with regard to jurisdictional claims in published maps and institutional affiliations.

