
Surface-Enhanced Raman Spectroscopy for Molecule Characterization: HIM Investigation into Sources of SERS Activity of Silver-Coated Butterfly Scales

 and
and 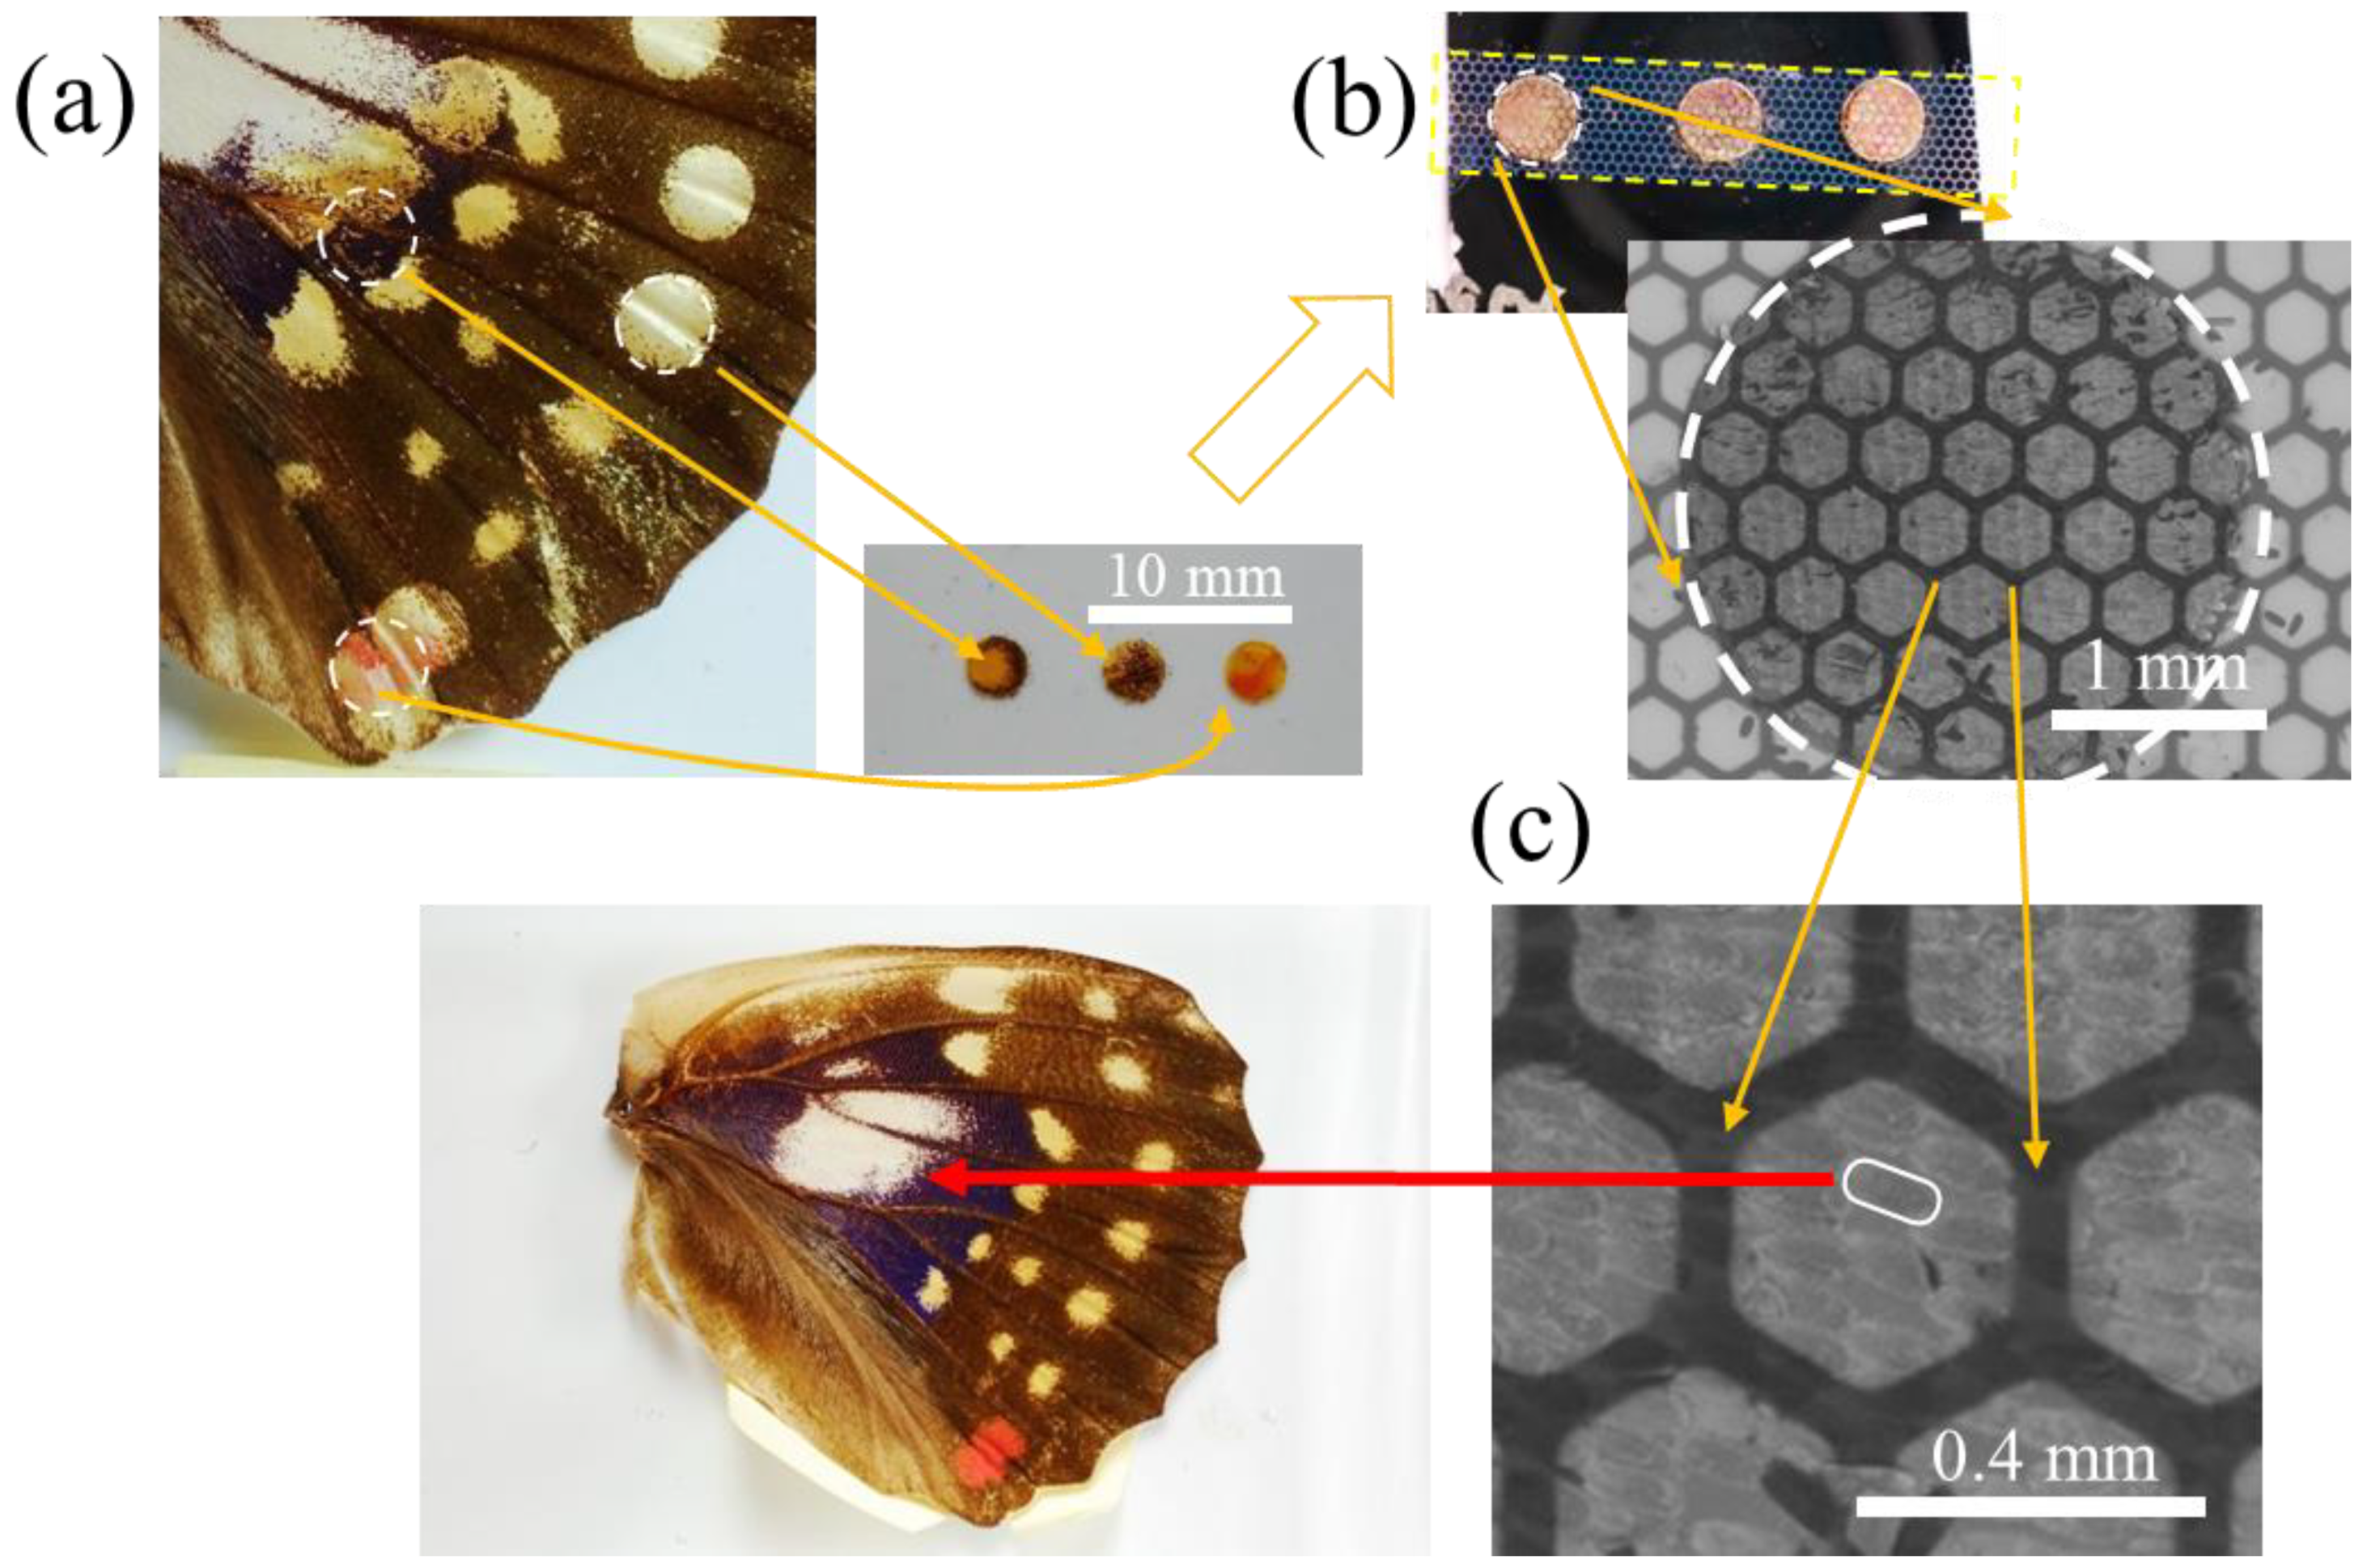
Abstract
:1. Introduction
2. Materials and Methods
2.1. Materials
2.2. Sample Preparation
2.3. Applications of Model Compounds
2.4. Modifications to the Scales
2.4.1. Physical Removal of the Upper Layer
2.4.2. Ozone Treatment
2.5. SERS Measurement
2.6. Scanning Electron Microscopy
2.7. Helium Ion Microscopy
3. Results
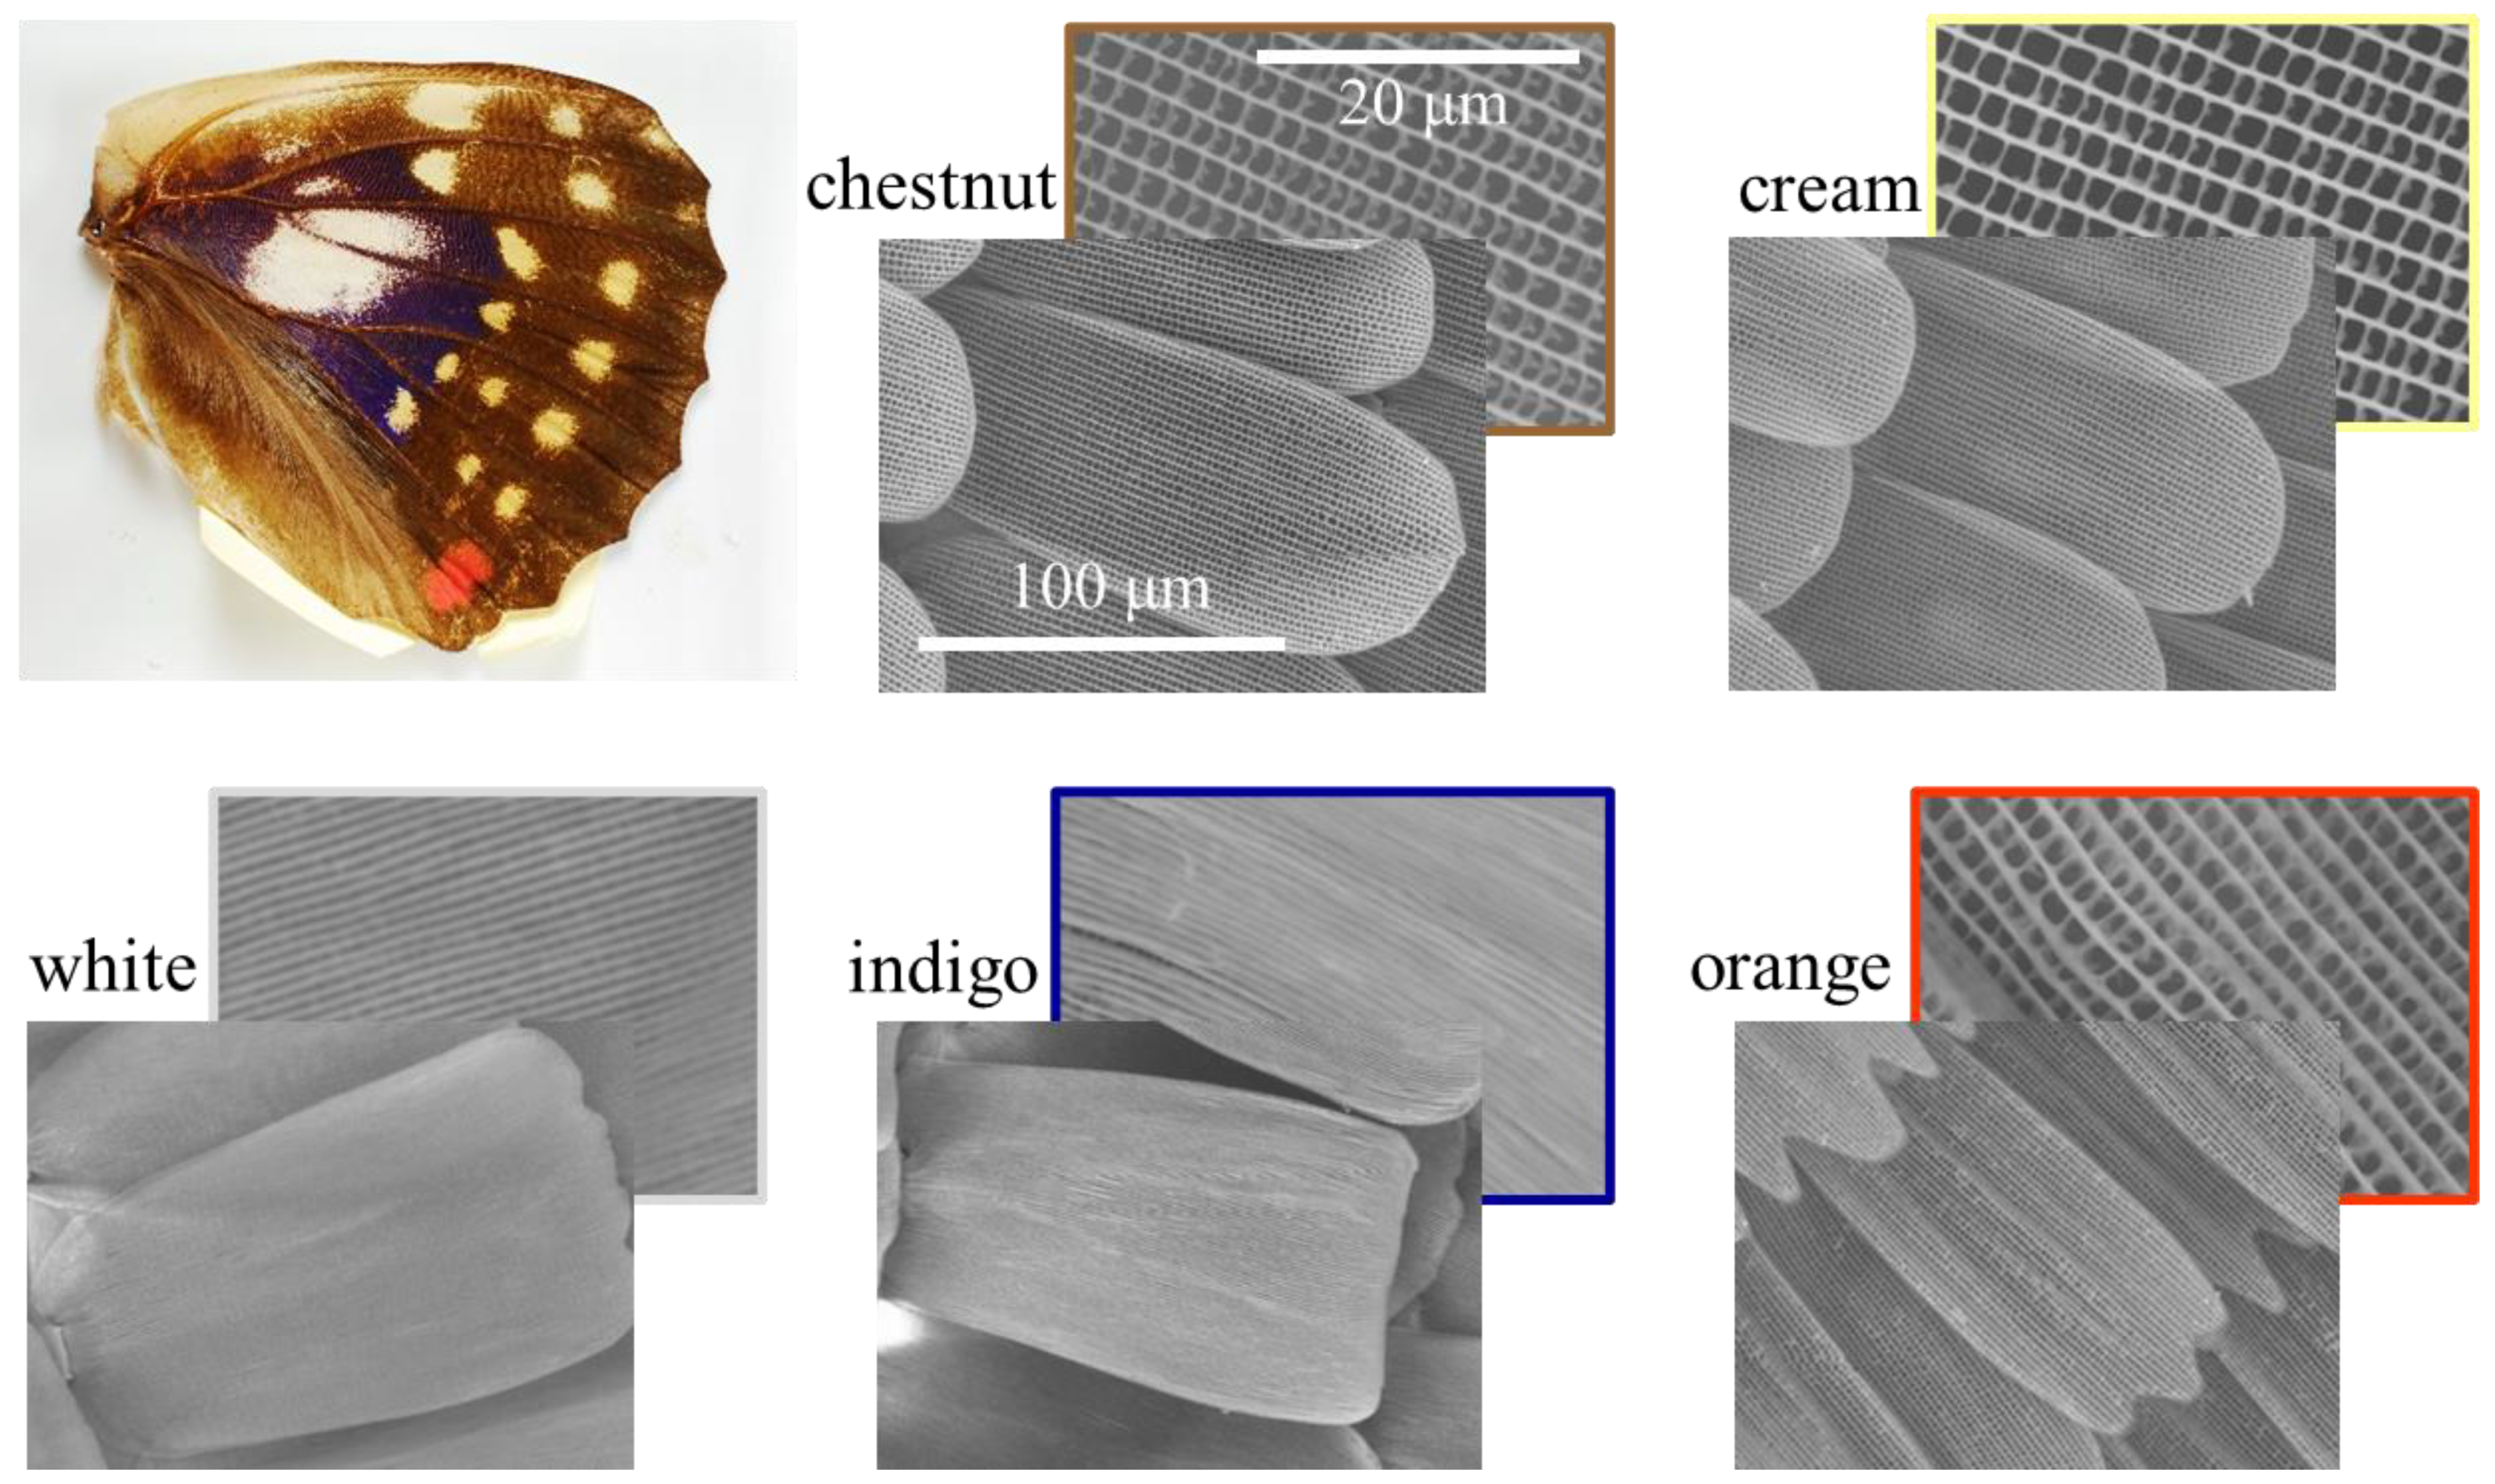
3.1. Classification of Scales and their Morphology
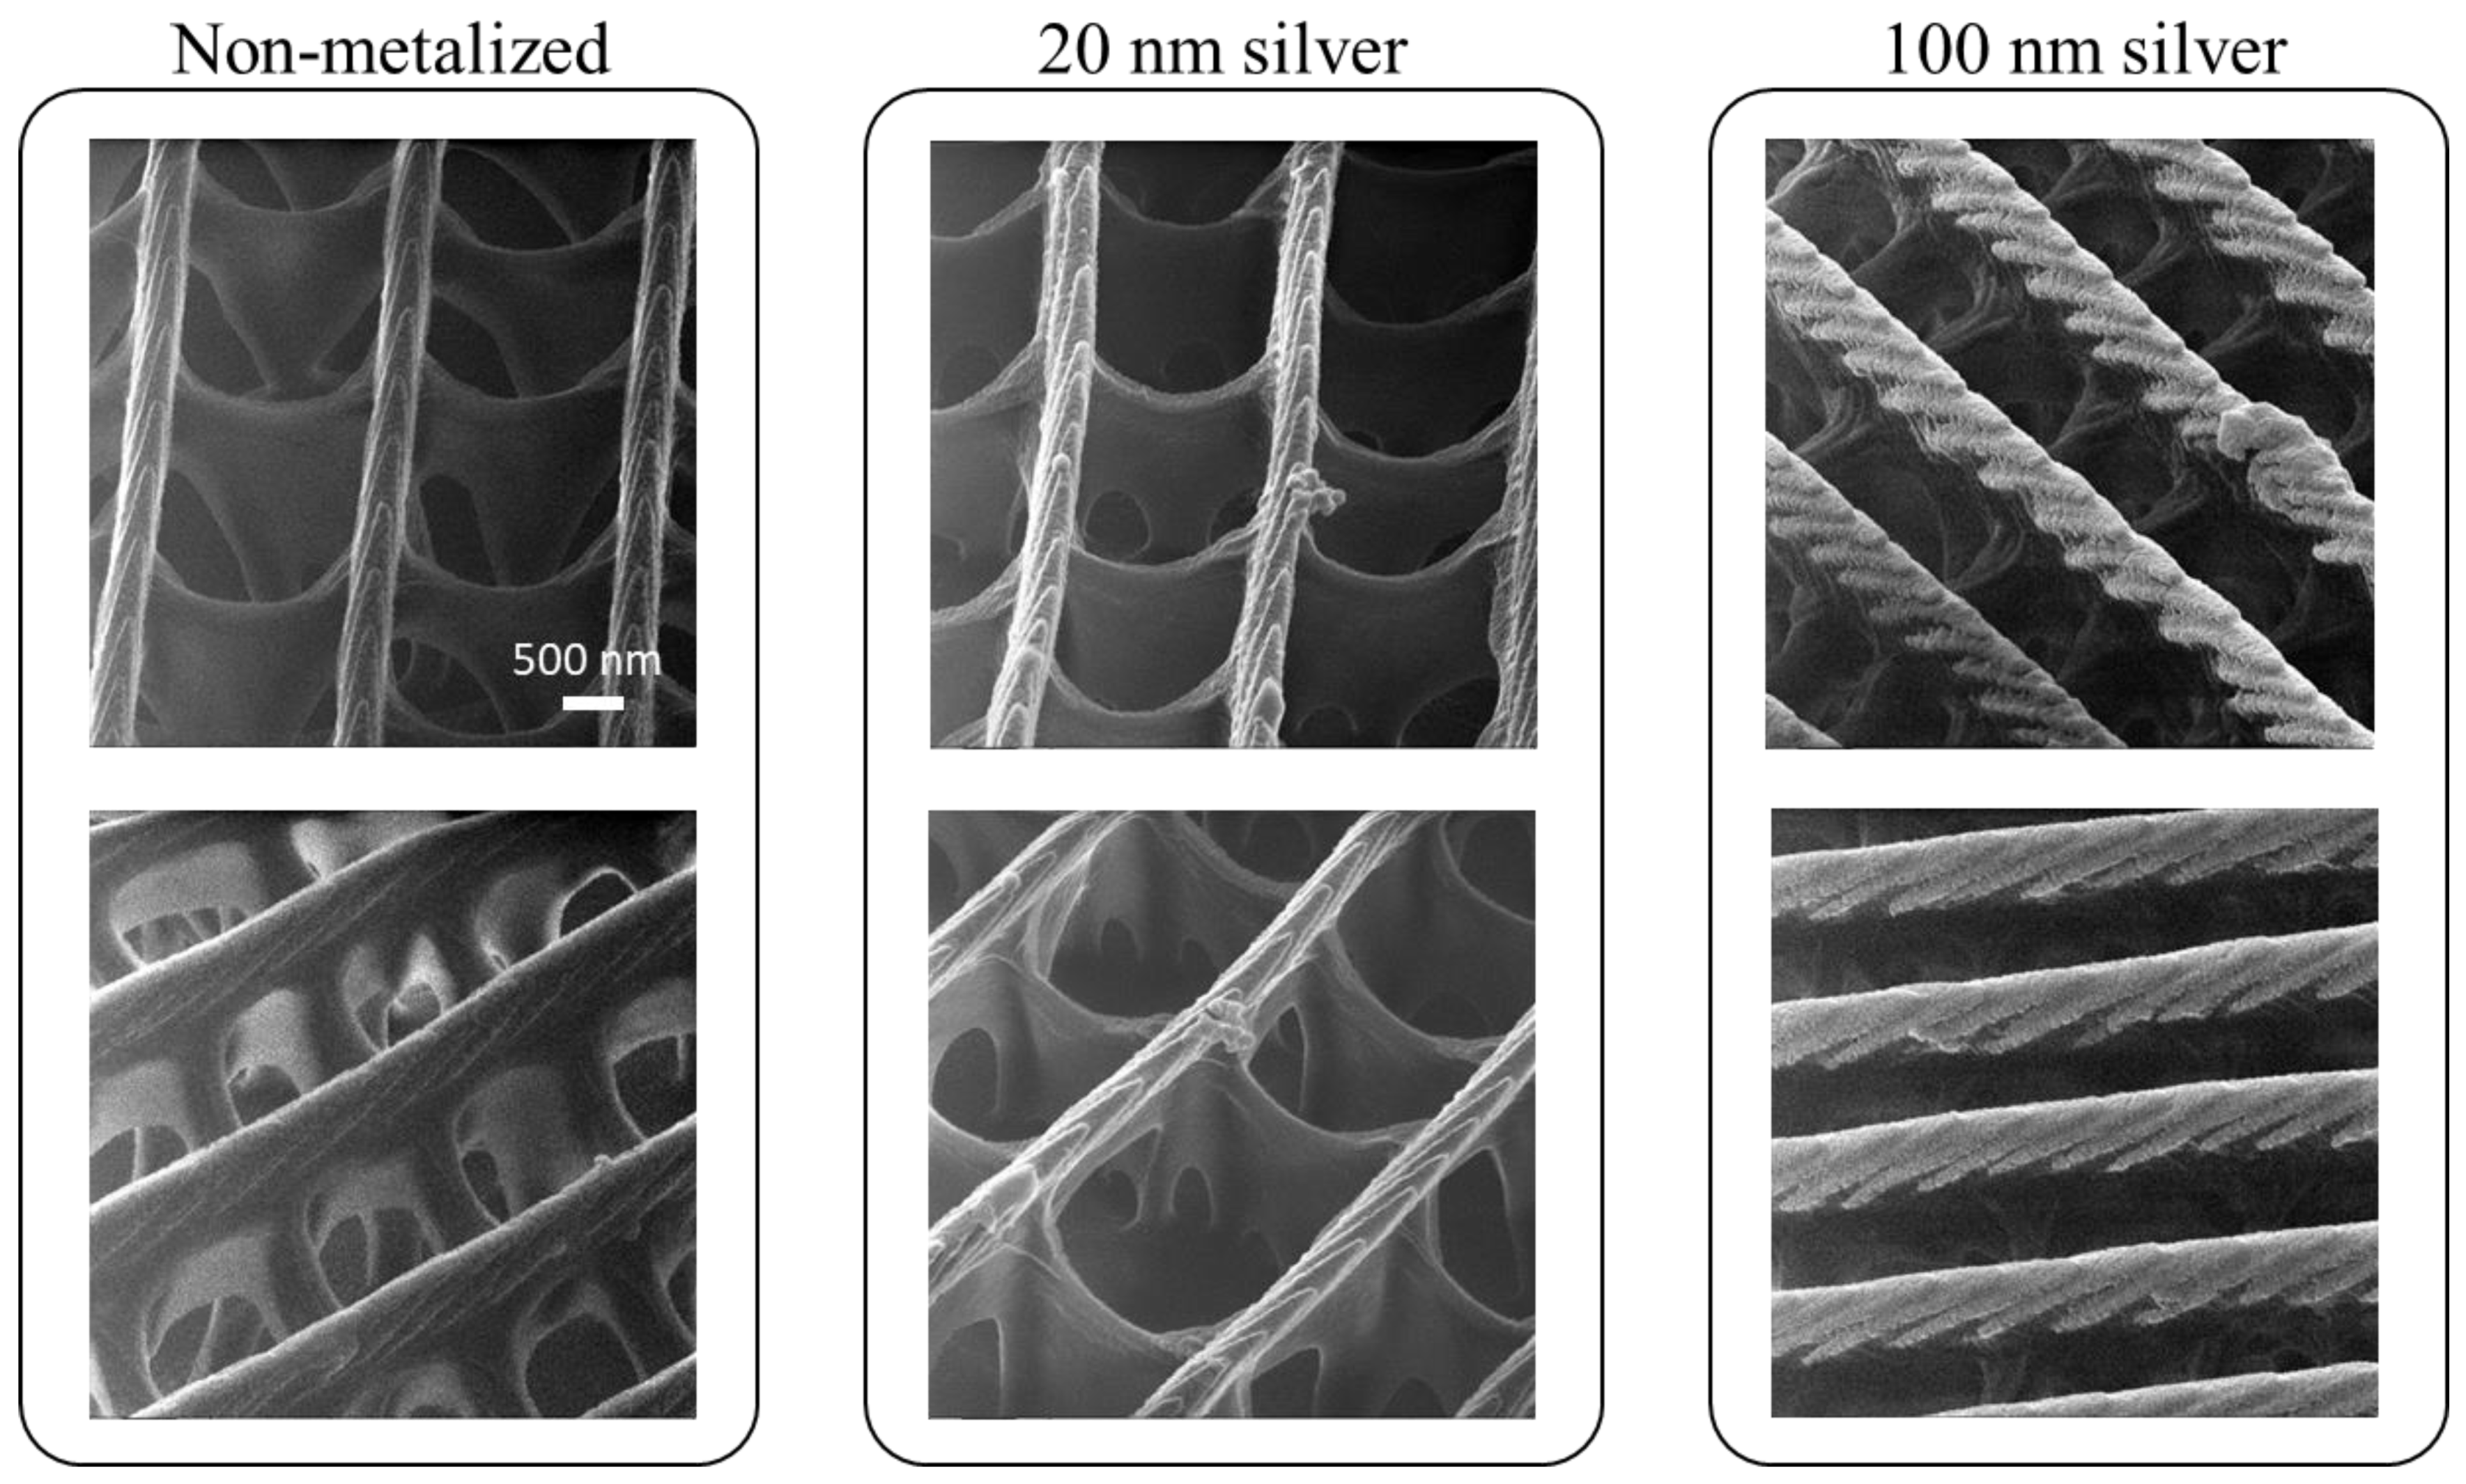
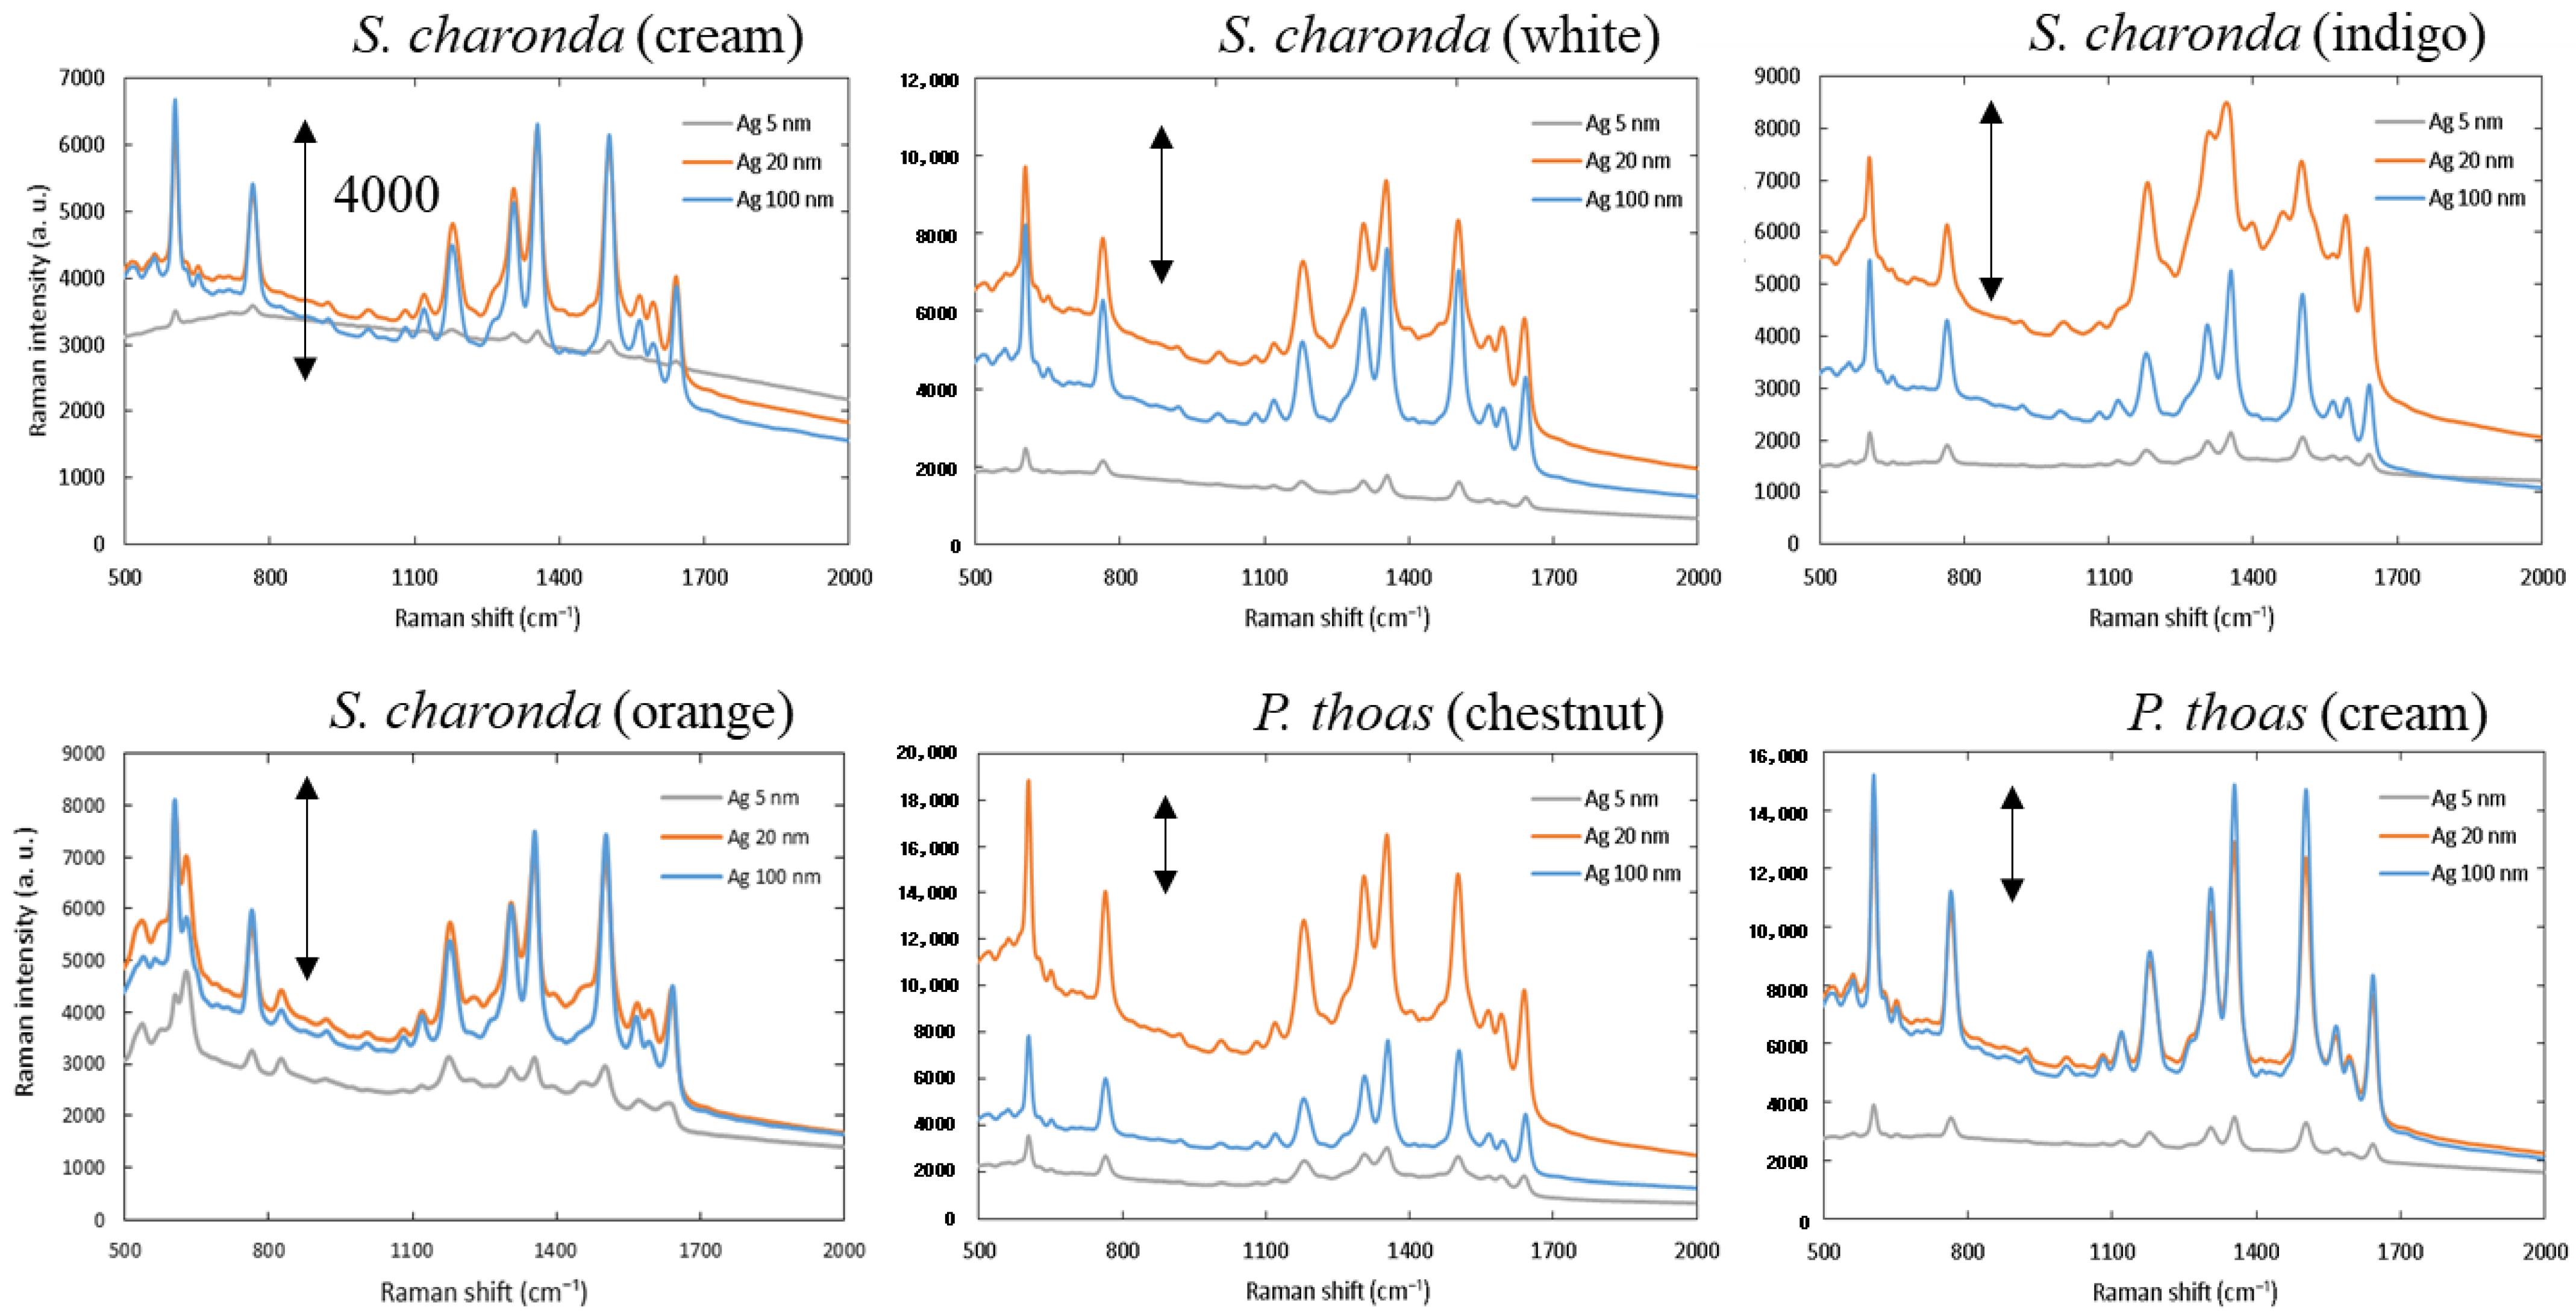
3.2. Dependence of SERS Activity on Ag Deposition Thickness
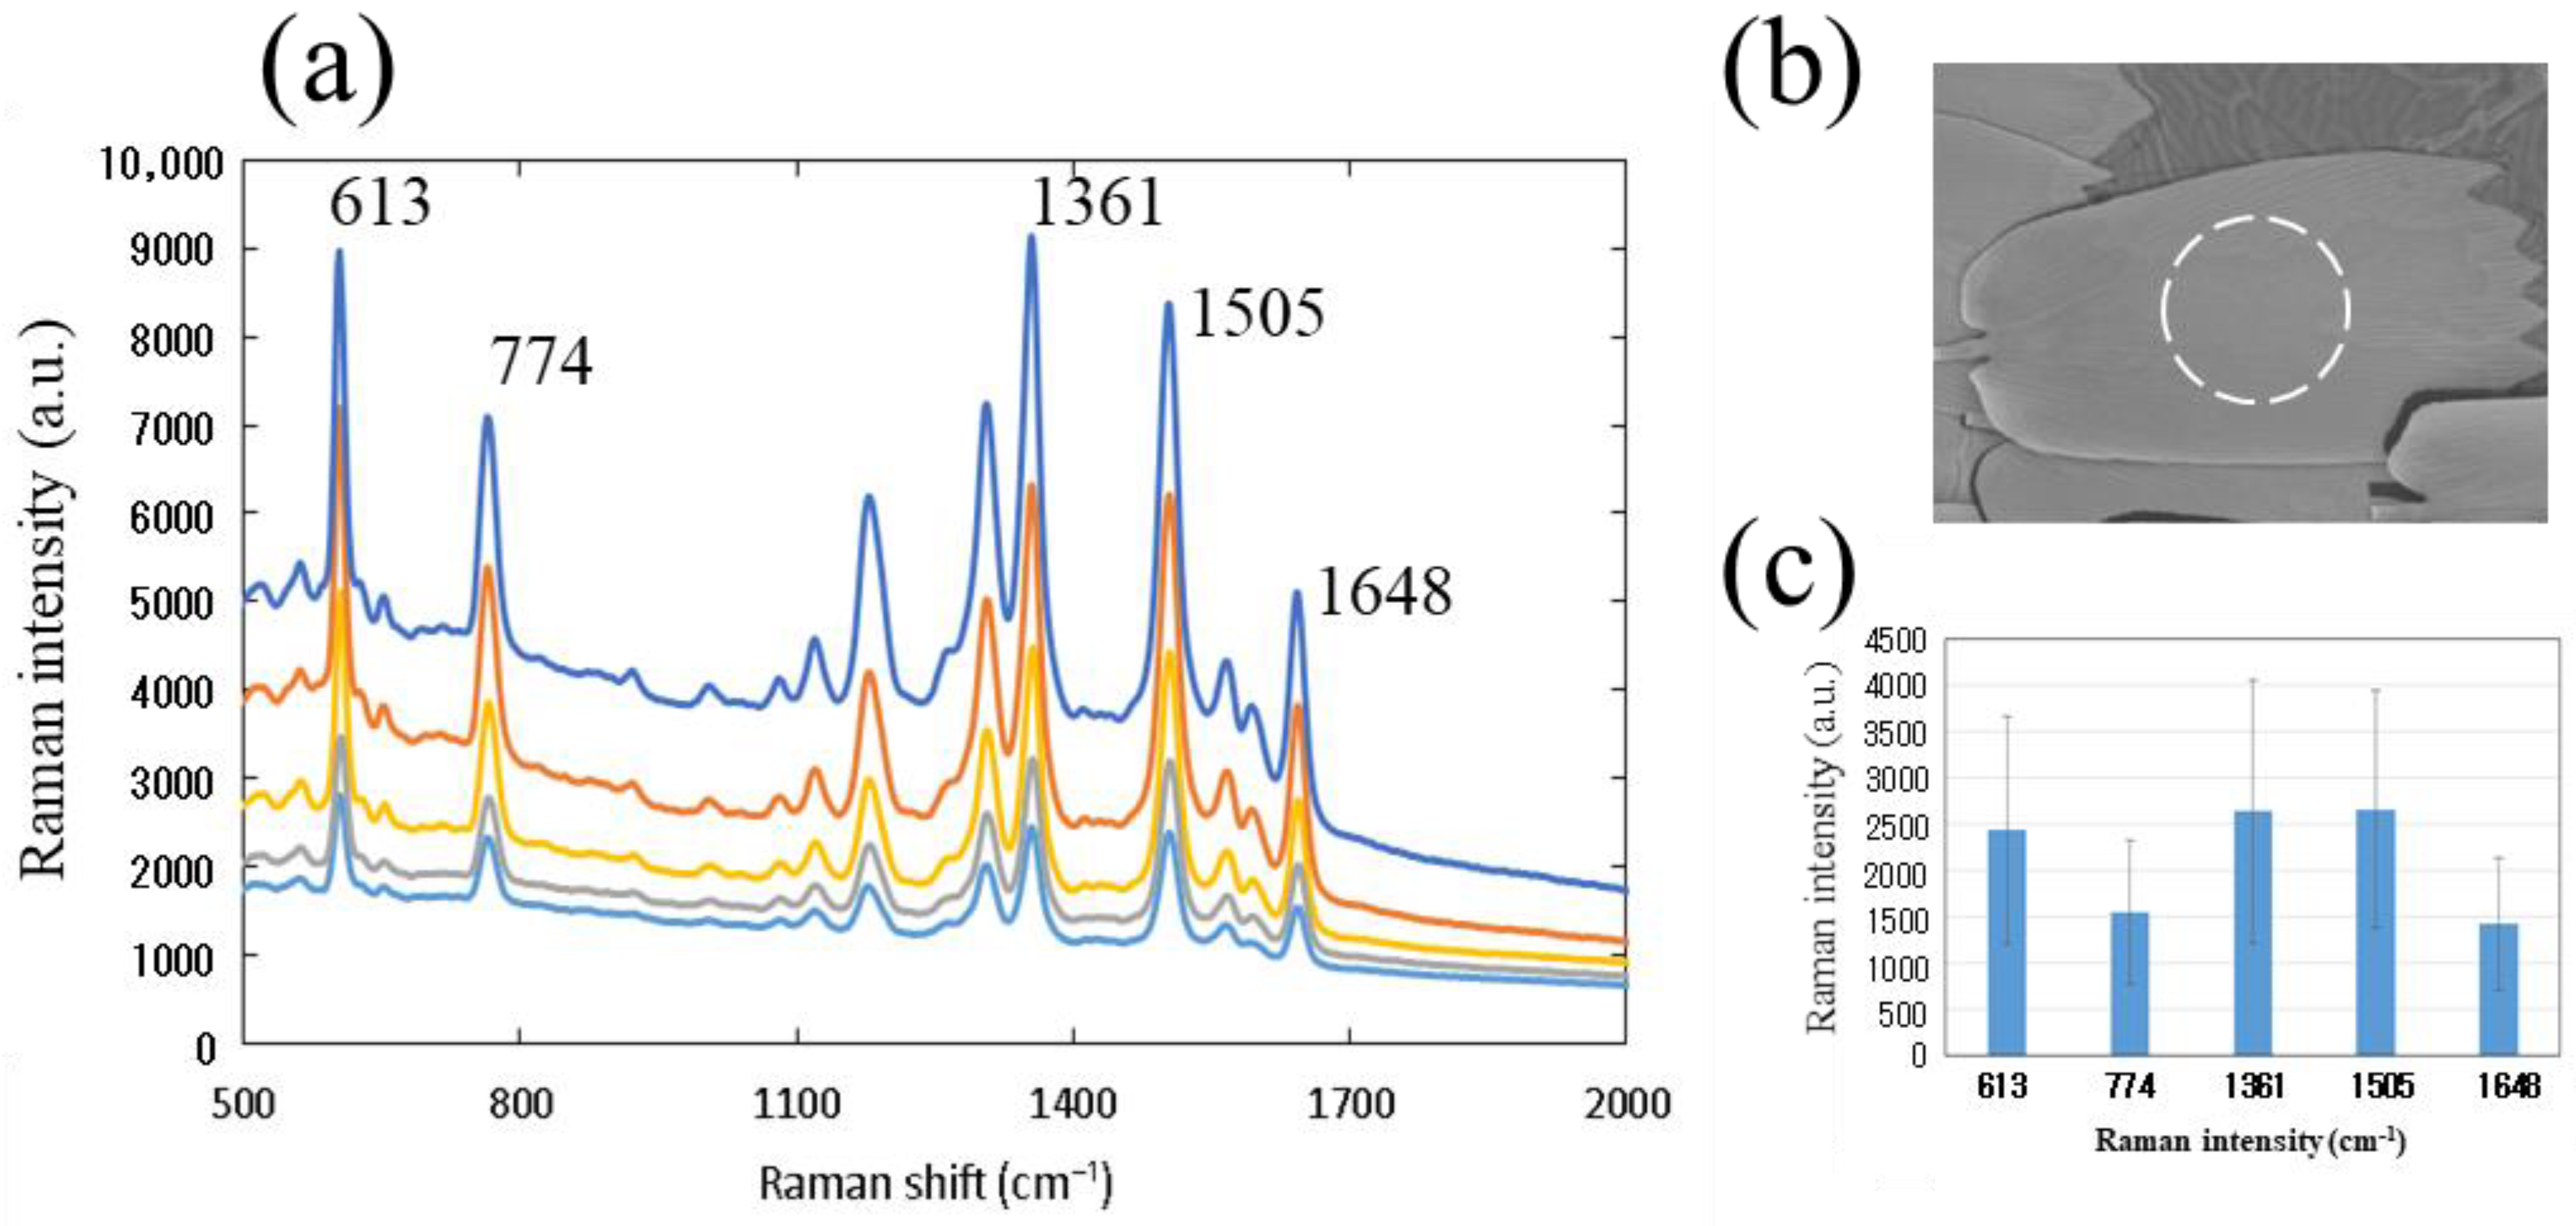
3.3. HIM Characterization of Scale Morphology
3.4. Polarization Dependence of SERS Activity
3.5. Modified Scales
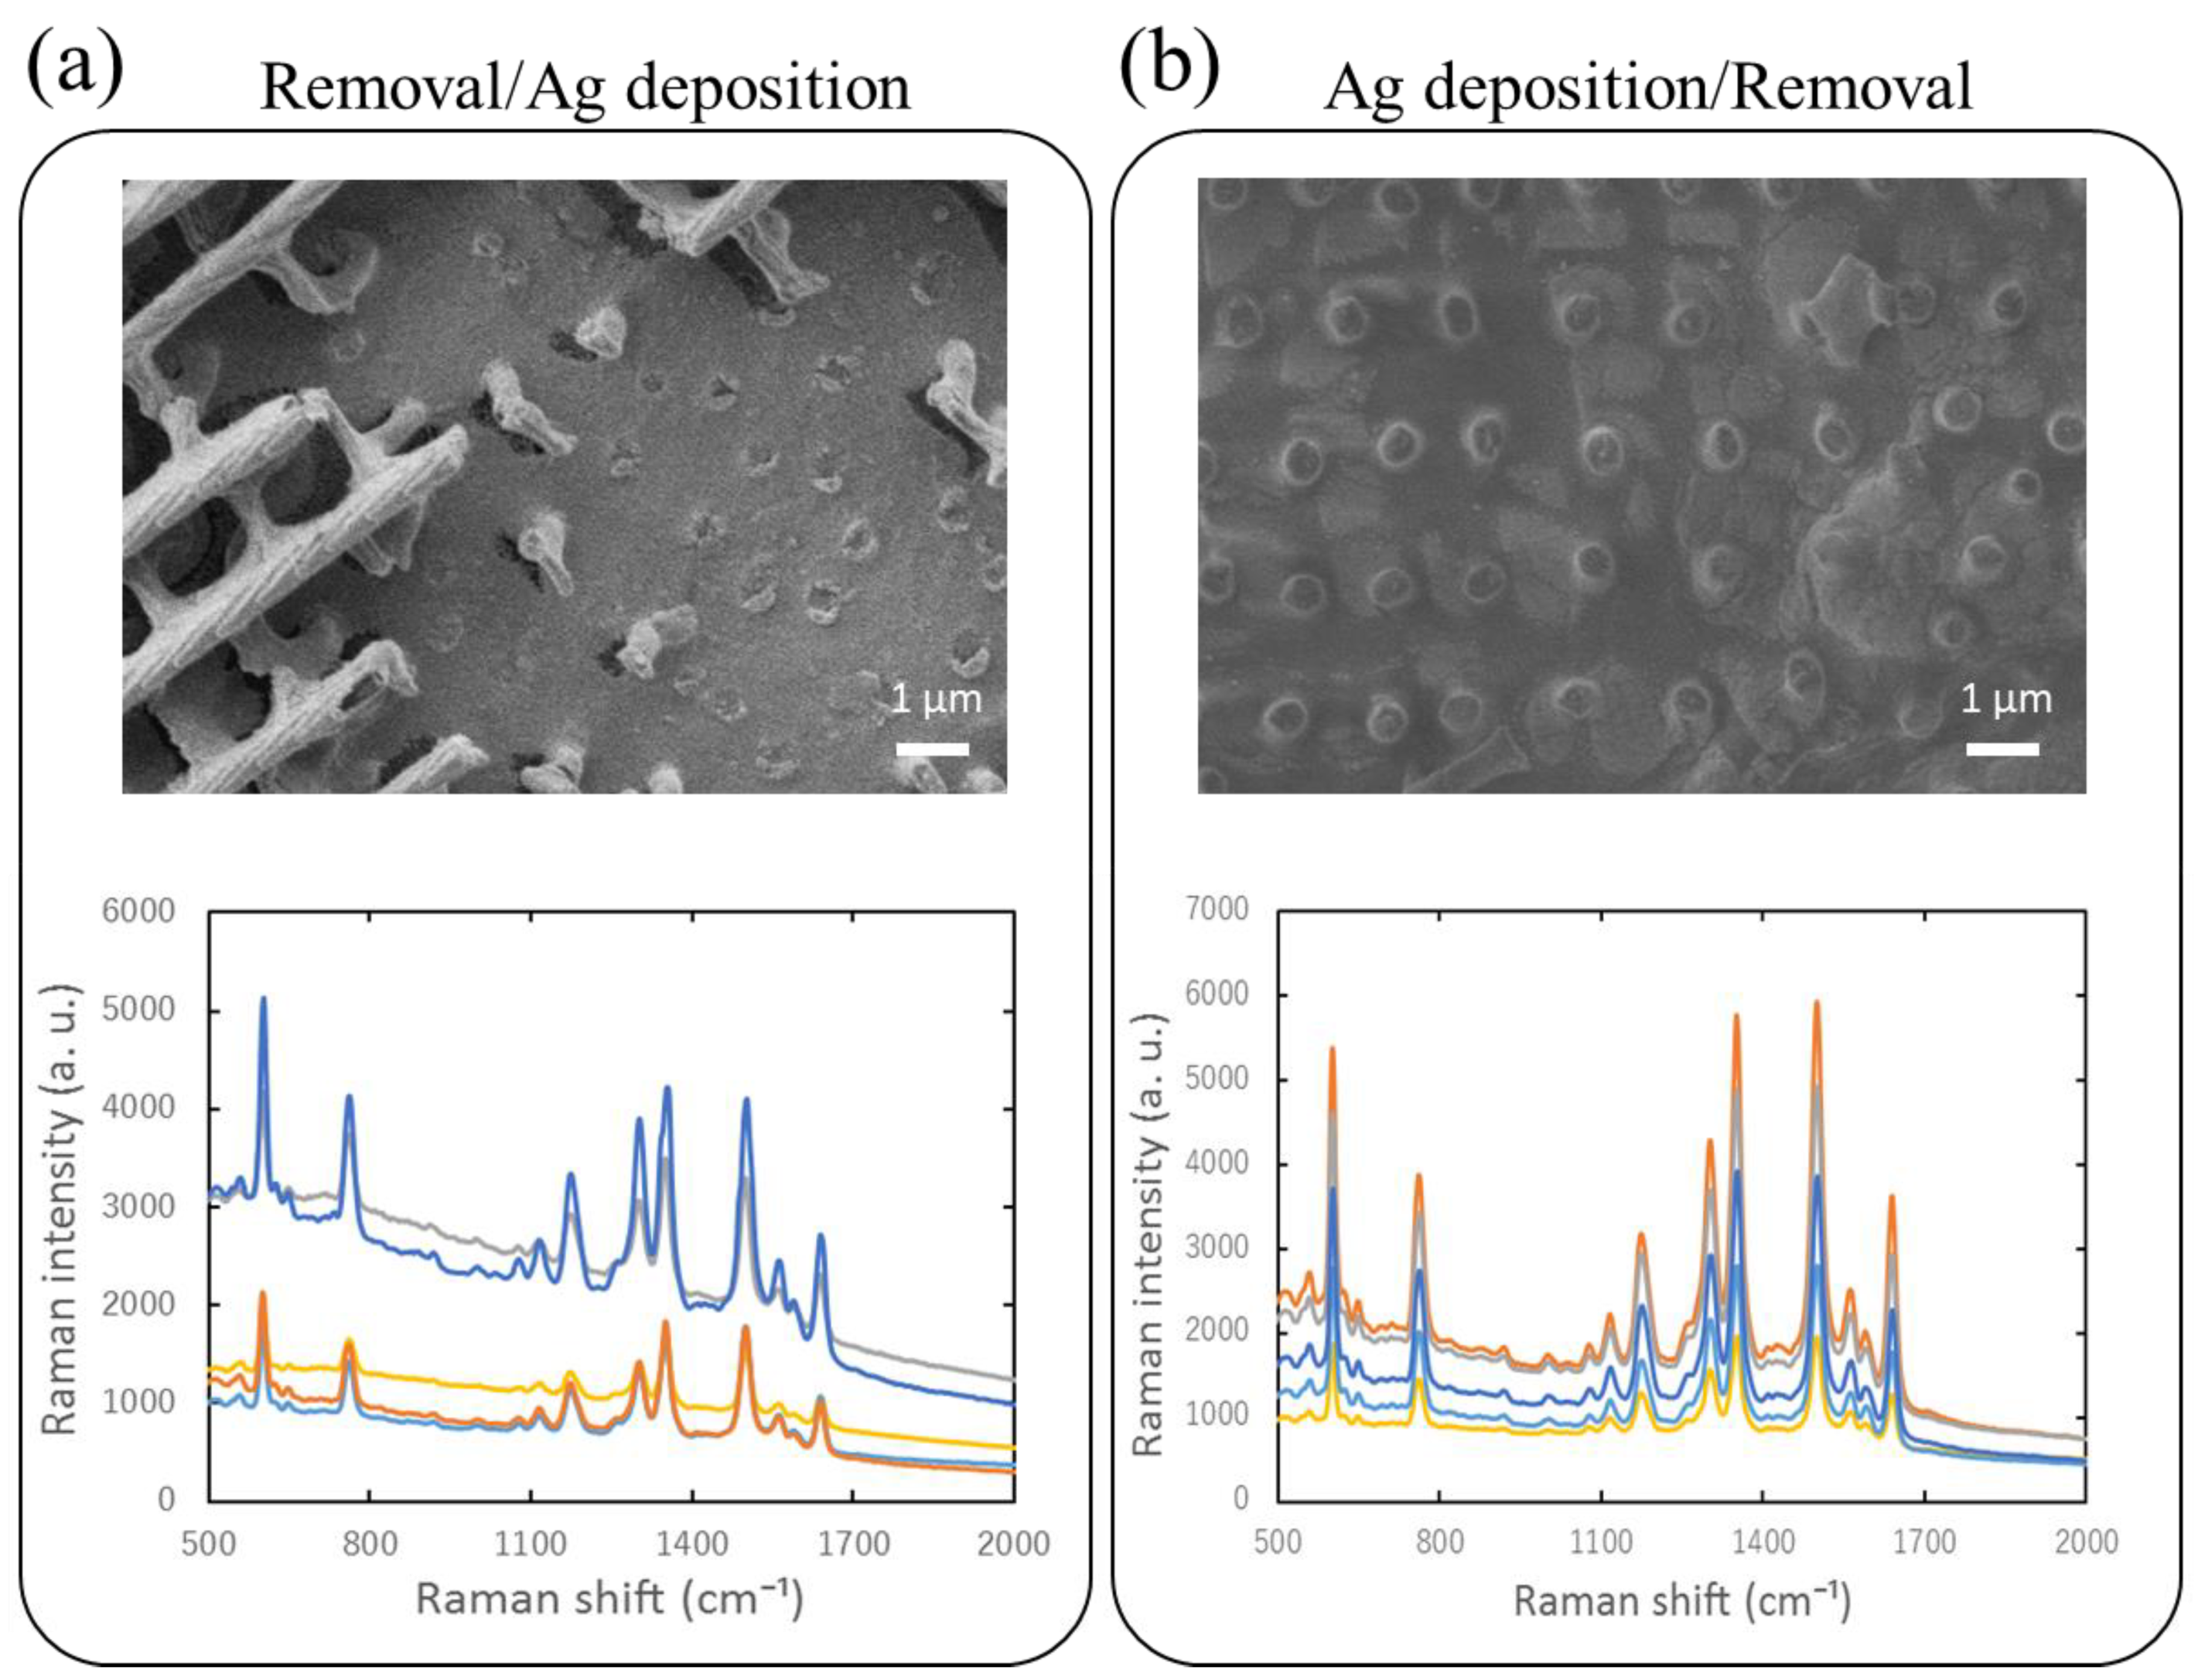
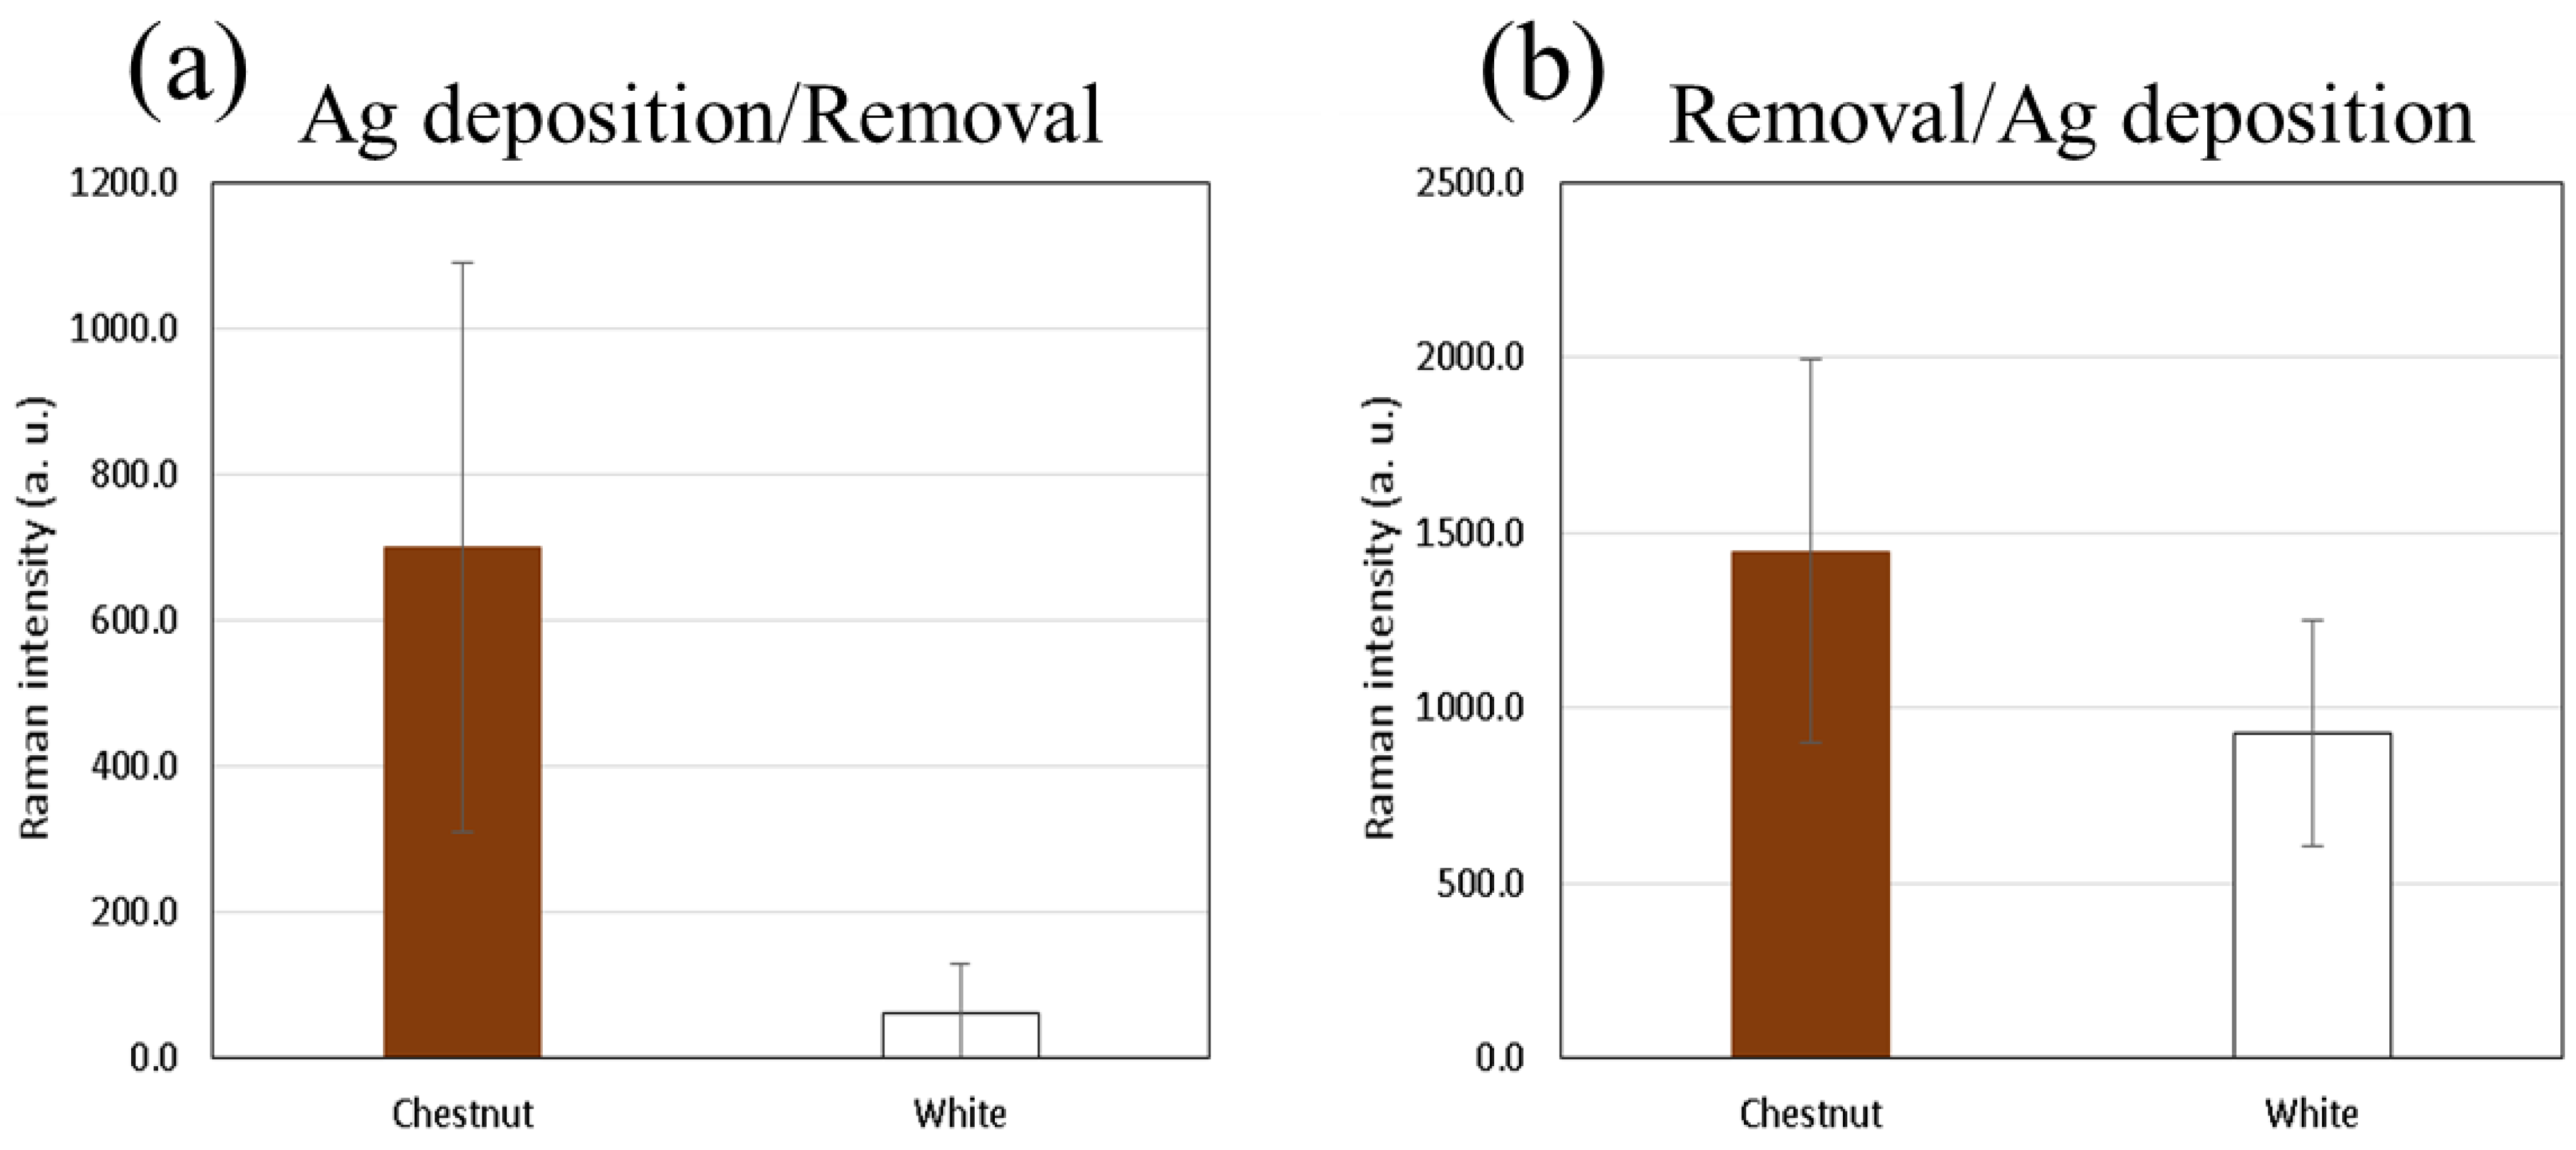
3.5.1. Physical Removal of the Upper Layer
3.5.2. Ozone Treatment
4. Conclusions
5. Patents
Author Contributions
Funding
Data Availability Statement
Acknowledgments
Conflicts of Interest
Appendix A


References
- Larmour, I.A.; Graham, D. Surface enhanced optical spectroscopies for bioanalysis. Analyst 2011, 136, 3831–3853. [Google Scholar] [CrossRef]
- Jeon, T.Y.; Kim, D.J.; Park, S.-G.; Kim, S.-H.; Kim, D.-H. Nanostructured plasmonic substrates for use as SERS sensors. Nano Converg. 2016, 3, 1–20. [Google Scholar] [CrossRef] [PubMed] [Green Version]
- Managò, S.; Zito, G.; Rogato, A.; Casalino, M.; Esposito, E.; De Luca, A.C.; De Tommasi, E. Bioderived three-dimensional hierarchical nanostructures as efficient surface-enhanced Raman scattering substrates for cell membrane probing. ACS Appl. Mater. Interfaces 2018, 10, 12406–12416. [Google Scholar] [CrossRef] [PubMed]
- Zhang, X.; Young, M.A.; Lyandres, O.; Van Duyne, R.P. Rapid detection of an anthrax biomarker by surface-enhanced Raman spectroscopy. J. Am. Chem. Soc. 2005, 127, 4484–4489. [Google Scholar] [CrossRef] [PubMed]
- Bantz, K.C.; Meyer, A.F.; Wittenberg, N.J.; Im, H.; Kurtuluş, Ö.; Lee, S.H.; Lindquist, N.C.; Oh, S.-H.; Haynes, C.L. Recent progress in SERS biosensing. Phys. Chem. Chem. Phys. 2011, 13, 11551–11567. [Google Scholar] [CrossRef]
- Tripp, R.A.; Dluhy, R.A.; Zhao, Y. Novel nanostructures for SERS biosensing. Nanotoday 2008, 3, 31–37. [Google Scholar] [CrossRef]
- Harper, M.M.; McKeating, K.S.; Faulds, K. Recent developments and future directions in SERS for bioanalysis. Phys. Chem. Chem. Phys. 2013, 15, 5312–5328. [Google Scholar] [CrossRef]
- Pang, S.; Yang, T.; He, L. Review of surface-enhanced Raman spectroscopic (SERS) detection of synthetic chemical pesticides. Trends Anal. Chem. 2016, 85, 73–82. [Google Scholar] [CrossRef] [Green Version]
- Xu, H.; Aizpurua, J.; Käll, M.; Apell, P. Electromagnetic contributions to single-molecule sensitivity in surface-enhanced Raman scattering. Phys. Rev. E 2000, 62, 4318–4323. [Google Scholar] [CrossRef] [PubMed] [Green Version]
- Le, F.; Brandl, D.W.; Urzhumov, Y.A.; Wang, H.; Kundu, J.; Halas, N.J.; Aizpurua, J.; Nordlander, P. Metallic nanoparticle arrays: A common substrate for both surface-enhanced Raman scattering and surface-enhanced infrared absorption. ACS Nano 2008, 2, 707–718. [Google Scholar] [CrossRef] [PubMed]
- Rycenga, M.; Cobley, C.M.; Zeng, J.; Li, W.; Moran, C.H.; Zhang, Q.; Qin, D.; Xia, Y. Controlling the synthesis and assembly of silver nanostructures for plasmonic applications. Chem. Rev. 2011, 111, 3669–3712. [Google Scholar] [CrossRef] [Green Version]
- Zamborini, F.P.; Bao, L.; Dasari, R. Nanoparticles in measurement science. Anal. Chem. 2012, 84, 541–576. [Google Scholar] [CrossRef] [PubMed]
- Henry, A.-I.; Bingham, J.M.; Ringe, E.; Marks, L.D.; Schatz, G.C.; Van Duyne, R.P. Correlated structure and optical property studies of plasmonic nanoparticles. J. Phys. Chem. 2011, 115, 9291–9305. [Google Scholar] [CrossRef]
- Chumanov, G.; Sokolov, K.; Gregory, B.W.; Cotton, T.M. Colloidal metal films as a substrate for surface-enhanced spectroscopy. J. Phys. Chem. 1995, 99, 9466–9471. [Google Scholar] [CrossRef]
- Van Duyne, R.P.; Hulteen, J.C.; Treichel, D.A. Atomic force microscopy and surface-enhanced Raman spectroscopy-I. Ag island films and Ag film over polymer nanosphere surfaces supported on glass. J. Chem. Phys. 1993, 99, 2101–2115. [Google Scholar] [CrossRef] [Green Version]
- Greeneltch, N.G.; Davis, A.S.; Valley, N.A.; Casadio, F.; Schatz, G.C.; Van Duyne, R.P.; Shah, N.C. Near-infrared surface-enhanced Raman spectroscopy (NIR-SERS) for the identification of eosin Y: Theoretical calculations and evaluation of two different nanoplasmonic substrates. J. Phys. Chem. A 2012, 116, 11863–11869. [Google Scholar] [CrossRef]
- Baia, M.; Baia, L.; Astilean, S. Gold nanostructured films deposited on polystyrene colloidal crystal templates for surface-enhanced Raman spectroscopy. Chem. Phys. Lett. 2005, 404, 3–8. [Google Scholar] [CrossRef]
- Farcau, C.; Astilean, S. Mapping the SERS efficiency and hot-spots localization on gold film over nanospheres substrates. S. J. Phys. Chem. C 2010, 114, 11717–11722. [Google Scholar] [CrossRef]
- Takei, H.; Okamoto, T. Morphology effects of cap-shaped silver nanoparticle films as a SERS platform. Anal. Sci. 2016, 32, 287–293. [Google Scholar] [CrossRef] [PubMed] [Green Version]
- Yamaguchi, U.; Ogawa, M.; Takei, H. Patterned superhydrophobic SERS substrates for sample pre-concentration and demonstration of its utility through monitoring of inhibitory effects of paraoxon and carbaryl on AChE. Molecules 2020, 25, 2223. [Google Scholar] [CrossRef]
- Métraux, G.S.; Cao, Y.C.; Jin, R.; Mirkin, C.A. Triangular nano frames made of gold and silver. Nano Lett. 2003, 3, 519–522. [Google Scholar] [CrossRef]
- He, L.; Lin, M.; Li, H.; Kim, N.-J. Surface-enhanced Raman spectroscopy coupled with dendritic silver nano substrate for detection of restricted antibiotics. J. Raman Spectrosc. 2010, 41, 739–744. [Google Scholar]
- Zhang, T.; Song, Y.-J.; Zhang, X.-Y.; Wu, J.-Y. Synthesis of silver nanostructures by multistep methods. Sensors 2014, 14, 5860–5889. [Google Scholar] [CrossRef]
- Wang, Y.-C.; DuChene, J.S.; Huo, F.; Wei, W.D. An in-situ approach for facile fabrication of robust and scalable SERS substrates. Nanoscale 2014, 6, 7232–7236. [Google Scholar] [CrossRef]
- Koya, A.N.; Zhu, X.; Ohannesian, N.; Yanik, A.A.; Alabastri, A.; Zaccaria, R.P.; Krahne, R.; Shih, W.-C.; Garoli, D. Nanoporous metals: From plasmonic properties to applications in enhanced spectroscopy and photocatalysis. ACS Nano 2021, 15, 6038–6060. [Google Scholar] [CrossRef]
- Theiss, J.; Pavaskar, P.; Echternach, P.M.; Muller, R.E.; Cronin, S.B. Plasmonic nanoparticle arrays with nanometer separation for high-performance SERS substrates. Nano Lett. 2010, 10, 2749–2754. [Google Scholar] [CrossRef] [PubMed]
- Yan, B.; Thubagere, A.; Premasiri, W.R.; Ziegler, L.D.; Negro, L.D.; Reinhard, B.M. Engineered SERS substrates with multiscale signal enhancement: Nanoparticle cluster arrays. ACS Nano 2009, 3, 1190–1201. [Google Scholar] [CrossRef]
- Liu, B.-Y.; Zhang, W.; Lv, H.-M.; Zhang, D.; Gong, X. Novel Ag decorated biomorphic SnO2 inspired by natural 3D nanostructures as SERS substrates. Mater. Lett. 2012, 74, 43–45. [Google Scholar] [CrossRef]
- Lv, M.-Y.; Teng, H.-Y.; Chen, Z.-Y.; Zhao, Y.-M.; Zhang, X.; Liu, L.; Wu, Z.; Liu, L.-M.; Xu, H.-J. Low-cost Au nanoparticle-decorated cicada wing as sensitive and recyclable substrates for surface enhanced Raman scattering. Sens. Actuators B 2015, 209, 820–827. [Google Scholar] [CrossRef]
- Tian, X.; Song, G.; Ding, X.; Gu, J.; Liu, Q.; Zhang, W.; Su, H.; Kang, D.; Qin, Z.; Zhang, D. Photonic structure arrays generated using butterfly wing scales as biological units. J. Mater. Chem. B 2015, 3, 1743–1747. [Google Scholar] [CrossRef]
- Garett, N.-L.; Sekine, R.; Dixon, M.W.A.; Tilley, L.; Bambery, K.R.; Wood, B.R. Bio-sensing with butterfly wings: Naturally occurring nanostructures for SERS-based malaria parasite detection. Phys. Chem. Chem. Phys. 2015, 17, 21164–21168. [Google Scholar] [CrossRef] [Green Version]
- Shi, G.; Zhu, Y.; Wang, M.; Shen, L.; Chen, Y.; Wang, Y.; Xu, X.; Li, R.; Ma, W. Comparison of surface-enhanced Raman scattering (SERS) effectiveness of Au nanoparticles/cicada wing substrates prepared by different methods. Optik 2017, 149, 36–42. [Google Scholar] [CrossRef]
- Shi, G.-C.; Wang, M.-L.; Zhu, Y.-Y.; Shen, L.; Ma, W.-L.; Wang, Y.-H.; Li, R.-F. Dragonfly wing decorated by gold nano islands as flexible and stable substrates for surface-enhanced Raman scattering (SERS). Sci. Rep. 2018, 8, 6916. [Google Scholar] [CrossRef]
- Wang, M.; Shi, G.; Zhu, Y.; Wang, Y.; Ma, W. Au-Decorated dragonfly wing bio scaffold arrays as flexible surface-enhanced Raman scattering (SERS) substrate for simultaneous determination of pesticide residues. Nanomaterials 2018, 8, 289. [Google Scholar] [CrossRef] [PubMed] [Green Version]
- Zhang, D.; Zhang, W.; Gu, J.; Fan, T.; Liu, Q.; Su, H.; Zhu, S. Inspiration from butterfly and moth wing scales: Characterization, modeling, and fabrication. Prog. Mater. Sci. 2015, 68, 67–96. [Google Scholar] [CrossRef]
- Garrett, N.L.; Vukusic, P.; Ogrin, F.; Sirotkin, E.; Winlove, C.P.; Moger, J. Spectroscopy on the wing, Naturally inspired SERS substrates for biochemical analysis. J. Biophoton. 2009, 2, 157–166. [Google Scholar] [CrossRef]
- Tan, Y.; Gu, J.; Zang, X.; Xu, W.; Shi, K.; Xu, L.; Zhang, D. Versatile fabrication of intact three-dimensional metallic butterfly wing scales with hierarchical sub-micrometer structures. Angew. Chem. Int. Ed. 2011, 50, 8307–8311. [Google Scholar]
- Tan, Y.; Gu, J.; Xu, L.; Zang, X.; Liu, D.; Zhang, W.; Liu, Q.; Zhu, S.; Su, H.; Feng, C.; et al. High-density hotspots engineered by naturally piled-up subwavelength Structures in three-dimensional copper butterfly wing scales for surface-enhanced Raman scattering detection. Adv. Funct. Mater. 2012, 22, 1578–1585. [Google Scholar] [CrossRef]
- Mu, Z.; Zhao, X.; Xie, Z.; Zhao, Y.; Zhong, Q.; Bo, L.; Gu, Z. In situ synthesis of gold nanoparticles (AuNPs) in butterfly wings for surface enhanced Raman spectroscopy (SERS). J. Mater. Chem. B 2013, 1, 1607–1613. [Google Scholar] [CrossRef] [PubMed]
- Tanahashi, I.; Harada, Y. Silver nanoparticles deposited on TiO2-coated cicada and butterfly wings as naturally inspired SERS substrates. J. Mater. Chem. C 2015, 3, 5721–5726. [Google Scholar] [CrossRef]
- Song, G.; Zhou, H.; Gu, J.; Liu, Q.; Zhang, W.; Su, H.; Su, Y.; Yao, Q.; Zhang, D. Tumor marker detection using surface enhanced Raman spectroscopy on 3D Au butterfly wings. J. Mater. Chem. B 2017, 5, 1594–1600. [Google Scholar] [CrossRef] [PubMed]
- Tan, Y.; Zang, X.; Gu, J.; Liu, D.; Zhu, S.; Su, H.; Feng, C.; Liu, Q.; Lau, W.M.; Moon, W.-J.; et al. Morphological effects on surface-enhanced Raman scattering from silver butterfly wing scales synthesized via photoreduction. Langmuir 2011, 27, 11742–11746. [Google Scholar] [CrossRef] [PubMed]
- Janssen, J.M.; Monteiro, A.; Brakefield, P.M. Correlations between scale structure and pigmentation in butterfly wings. Evolution & Development. Evol. Dev. 2001, 3, 415–423. [Google Scholar] [PubMed]
- Hildebrandt, P.; Stockburger, M. Surface-enhanced resonance Raman spectroscopy of rhodamine 6G adsorbed on colloidal silver. J. Phys. Chem. 1984, 88, 5935–5944. [Google Scholar] [CrossRef]
- Wu, L.; Wang, W.; Zhang, W.; Su, H.; Liu, Q.; Gu, J.; Deng, T.; Zhang, D. Highly sensitive, reproducible, and uniform SERS substrates with a high density of three-dimensionally distributed hotspots: Gyroid-structured Au periodic metallic materials. NPG Asia Mater. 2018, e462. [Google Scholar] [CrossRef] [Green Version]
- Bell, S.E.J.; Charron, G.; Cortés, E.; Kneipp, J.; de la Chapelle, M.L.; Langer, J.; Procházka, M.; Tran, V.; Schlücker, S. Towards reliable and quantitative surface-enhanced Raman scattering (SERS): From key parameters to good analytical practice. Angew. Chem. Int. Ed. 2020, 59, 5454–5462. [Google Scholar] [CrossRef] [Green Version]


Publisher’s Note: MDPI stays neutral with regard to jurisdictional claims in published maps and institutional affiliations. |
© 2021 by the authors. Licensee MDPI, Basel, Switzerland. This article is an open access article distributed under the terms and conditions of the Creative Commons Attribution (CC BY) license (https://creativecommons.org/licenses/by/4.0/).
Share and Cite
Takei, H.; Nagata, K.; Frese, N.; Gölzhäuser, A.; Okamoto, T. Surface-Enhanced Raman Spectroscopy for Molecule Characterization: HIM Investigation into Sources of SERS Activity of Silver-Coated Butterfly Scales. Nanomaterials 2021, 11, 1741. https://doi.org/10.3390/nano11071741
Takei H, Nagata K, Frese N, Gölzhäuser A, Okamoto T. Surface-Enhanced Raman Spectroscopy for Molecule Characterization: HIM Investigation into Sources of SERS Activity of Silver-Coated Butterfly Scales. Nanomaterials. 2021; 11(7):1741. https://doi.org/10.3390/nano11071741
Chicago/Turabian StyleTakei, Hiroyuki, Kazuki Nagata, Natalie Frese, Armin Gölzhäuser, and Takayuki Okamoto. 2021. "Surface-Enhanced Raman Spectroscopy for Molecule Characterization: HIM Investigation into Sources of SERS Activity of Silver-Coated Butterfly Scales" Nanomaterials 11, no. 7: 1741. https://doi.org/10.3390/nano11071741