Graphene Oxide with Controlled Content of Oxygen Groups as a Filler for Polymer Composites Used for Infrared Radiation Shielding

 , ,
, ,
Abstract
:1. Introduction
2. Materials and Methods
2.1. Graphene Oxide (GO) Preparation
2.2. Reduction of Graphene Oxide
2.3. Composite Preparation
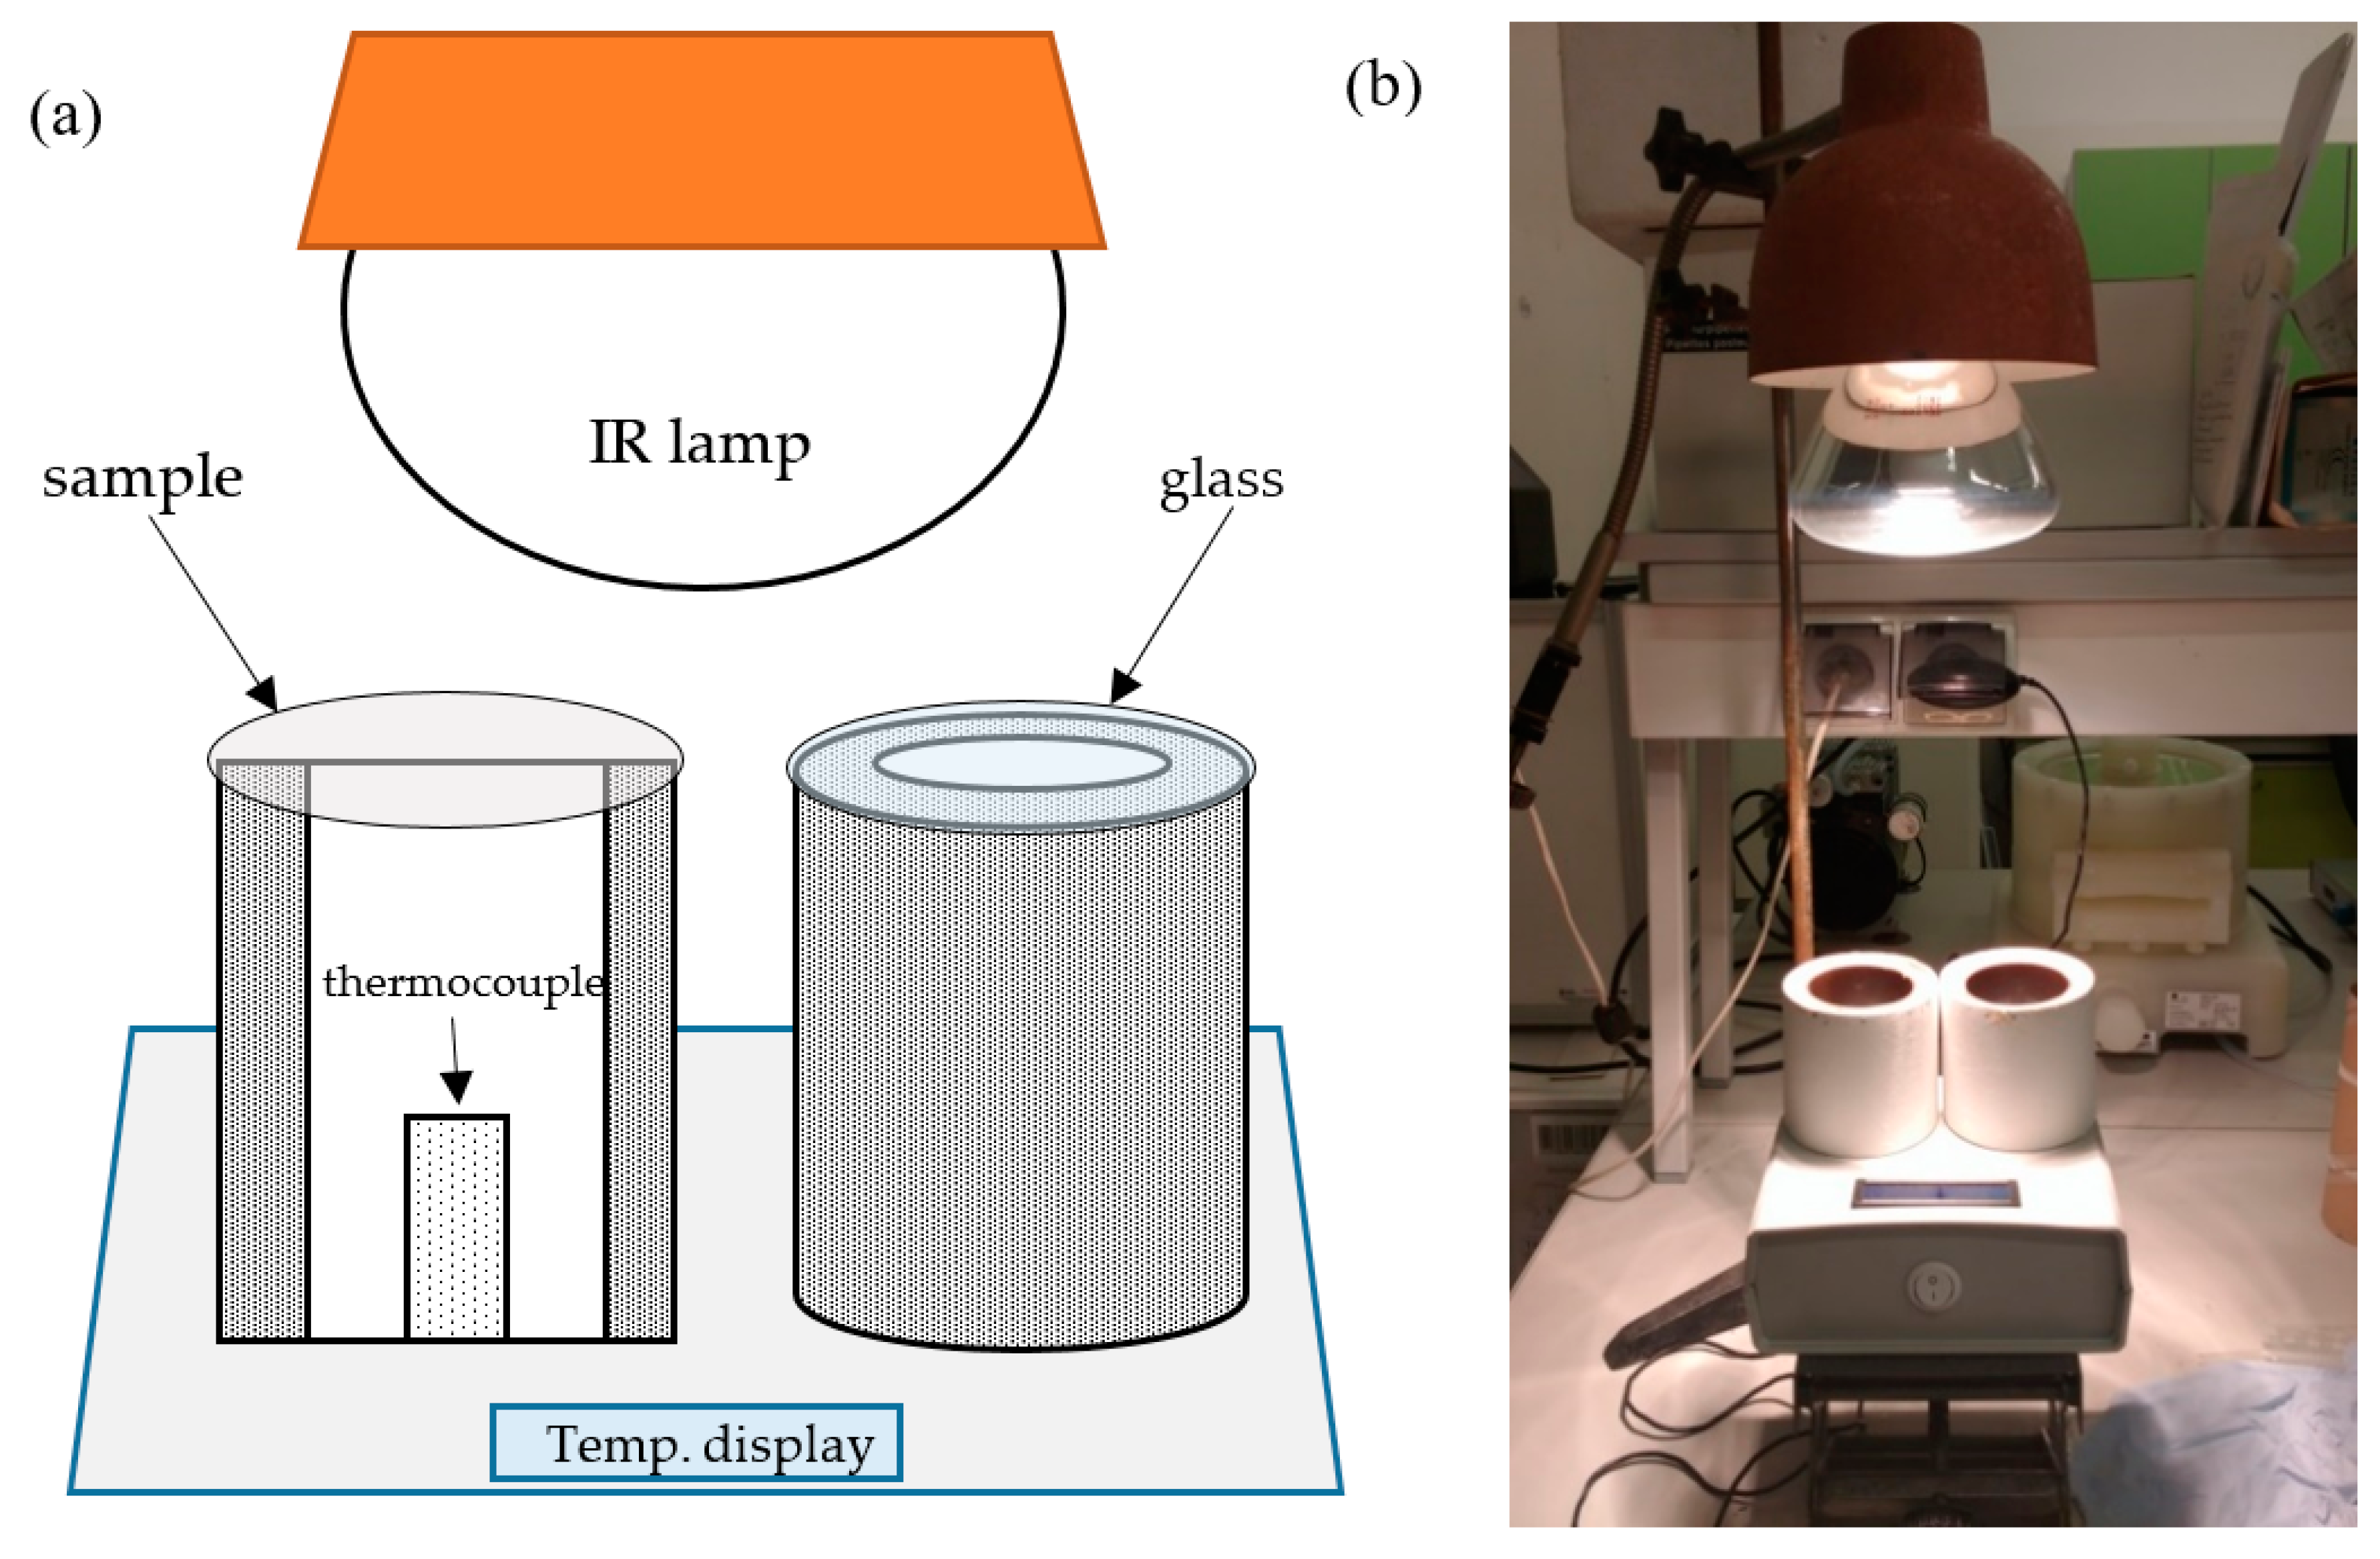
2.4. Sample Characterization
3. Results and Discussion
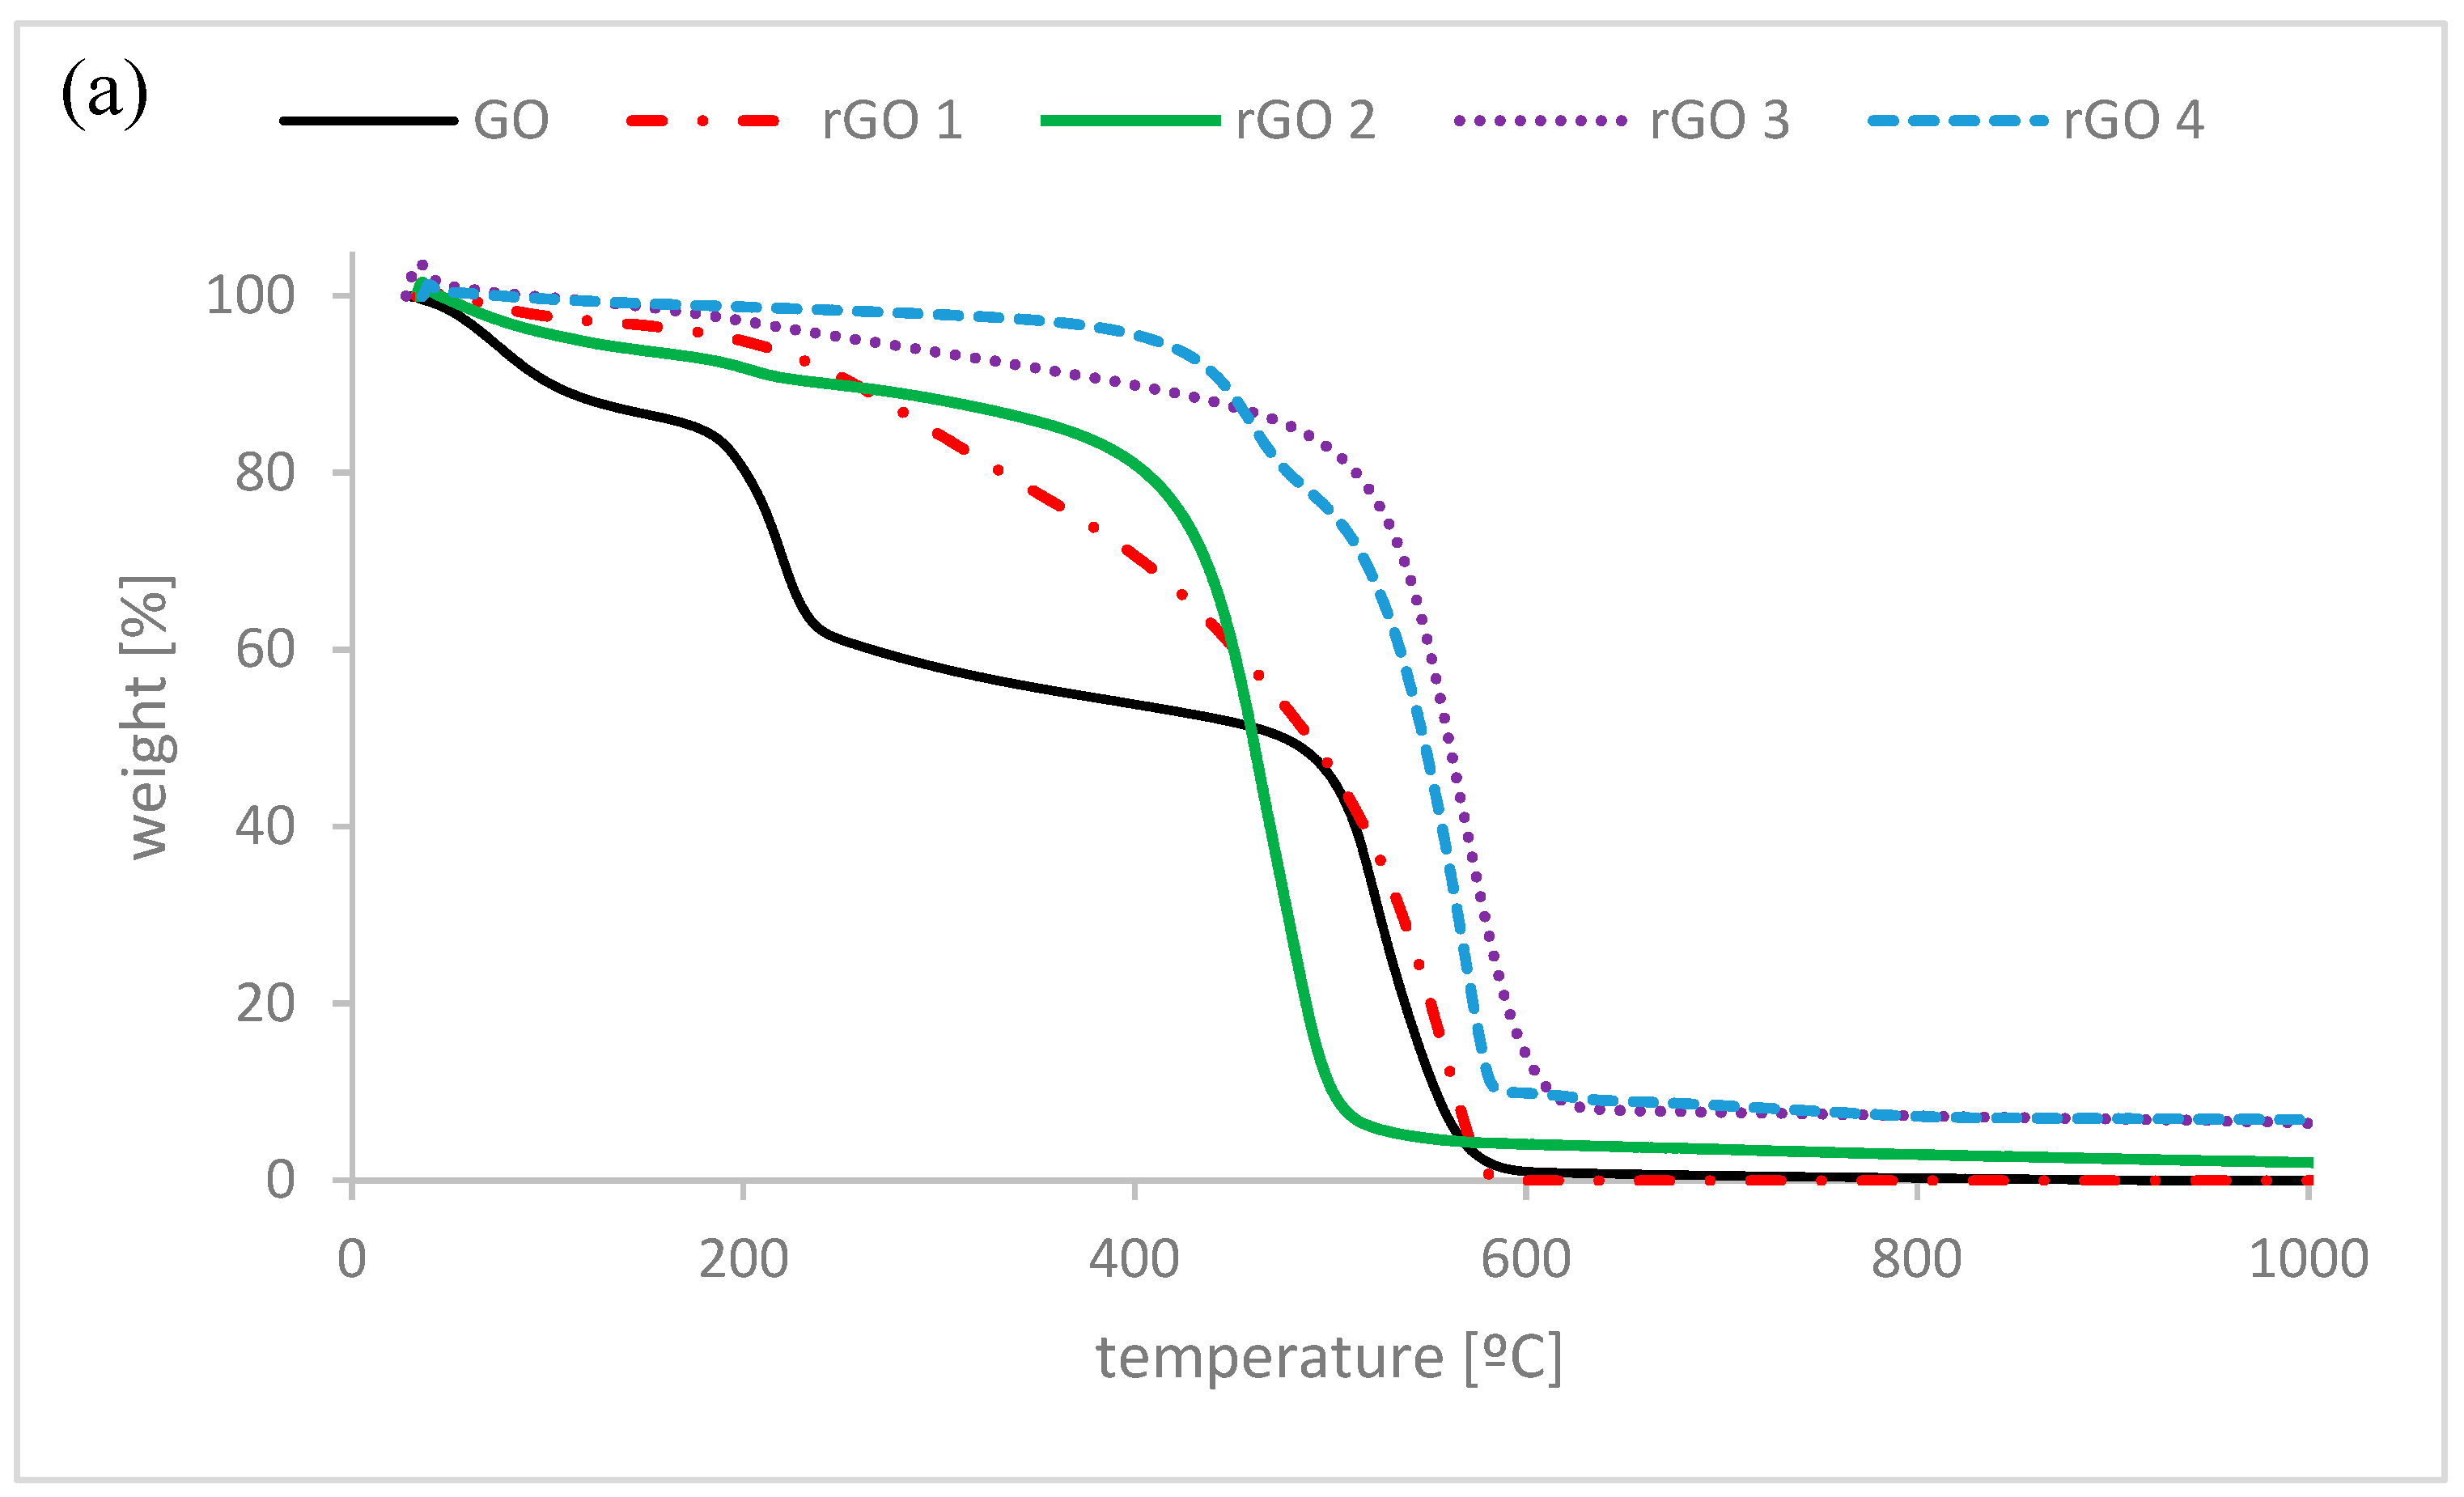
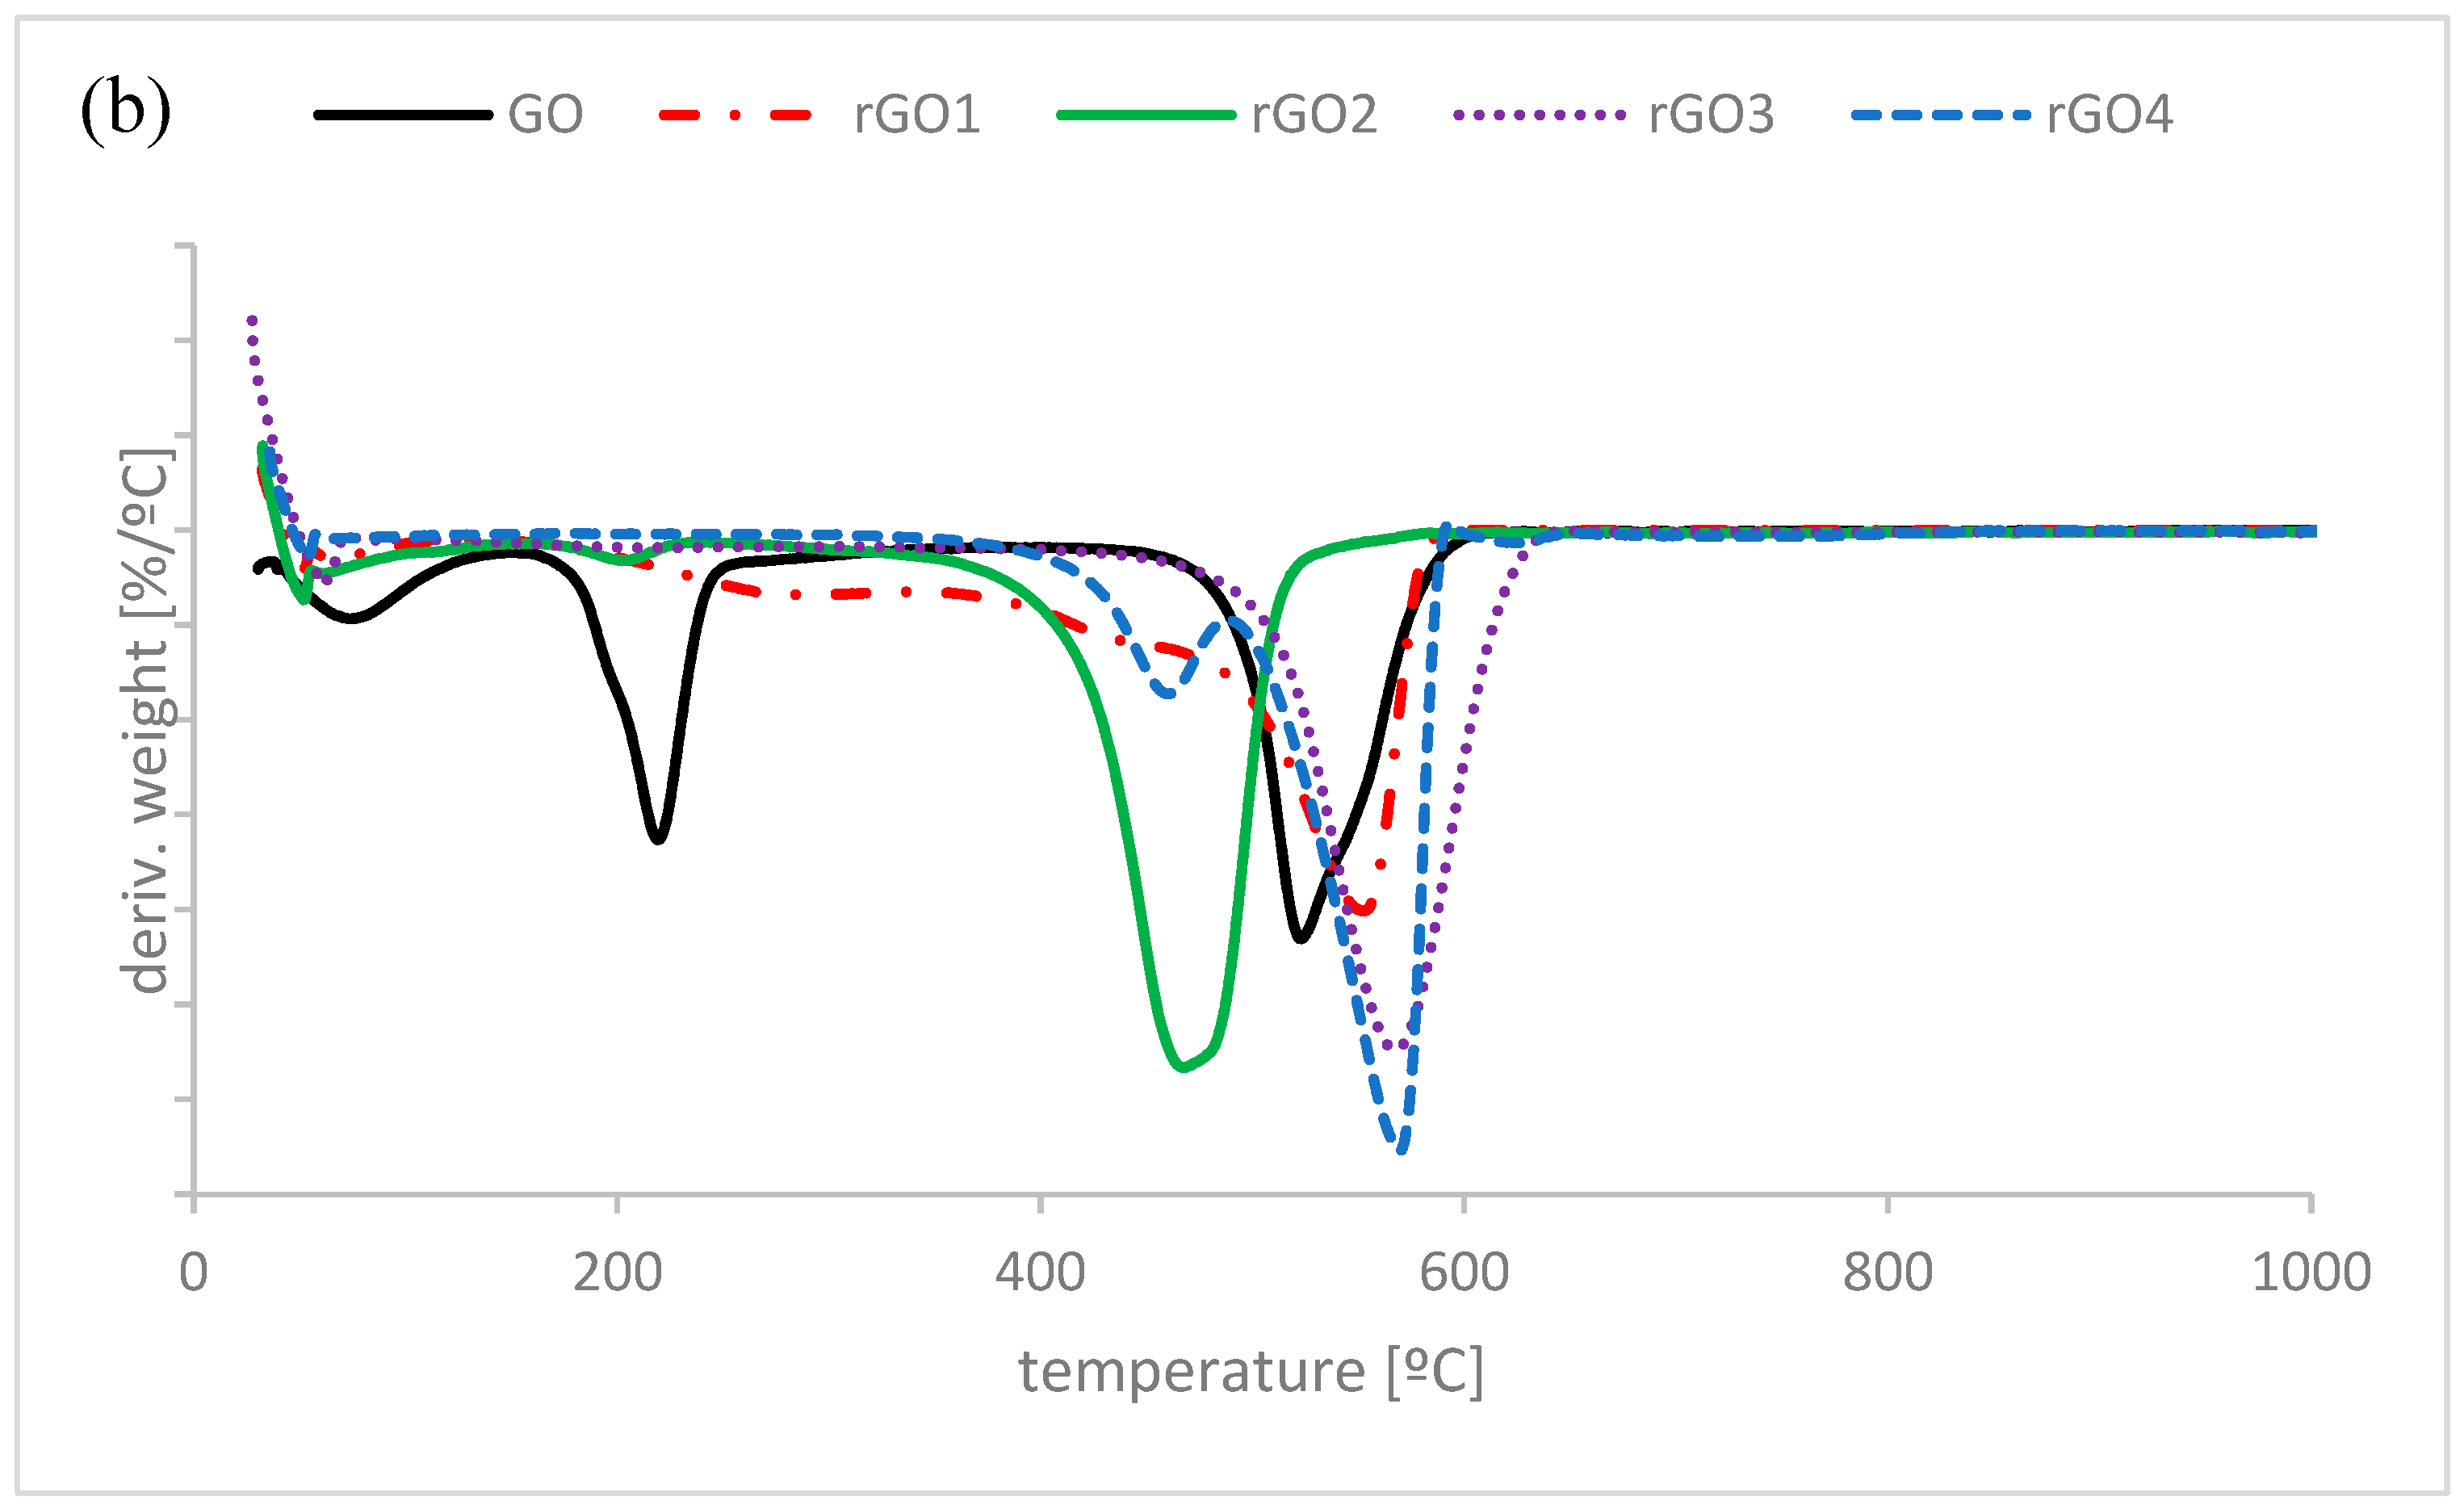
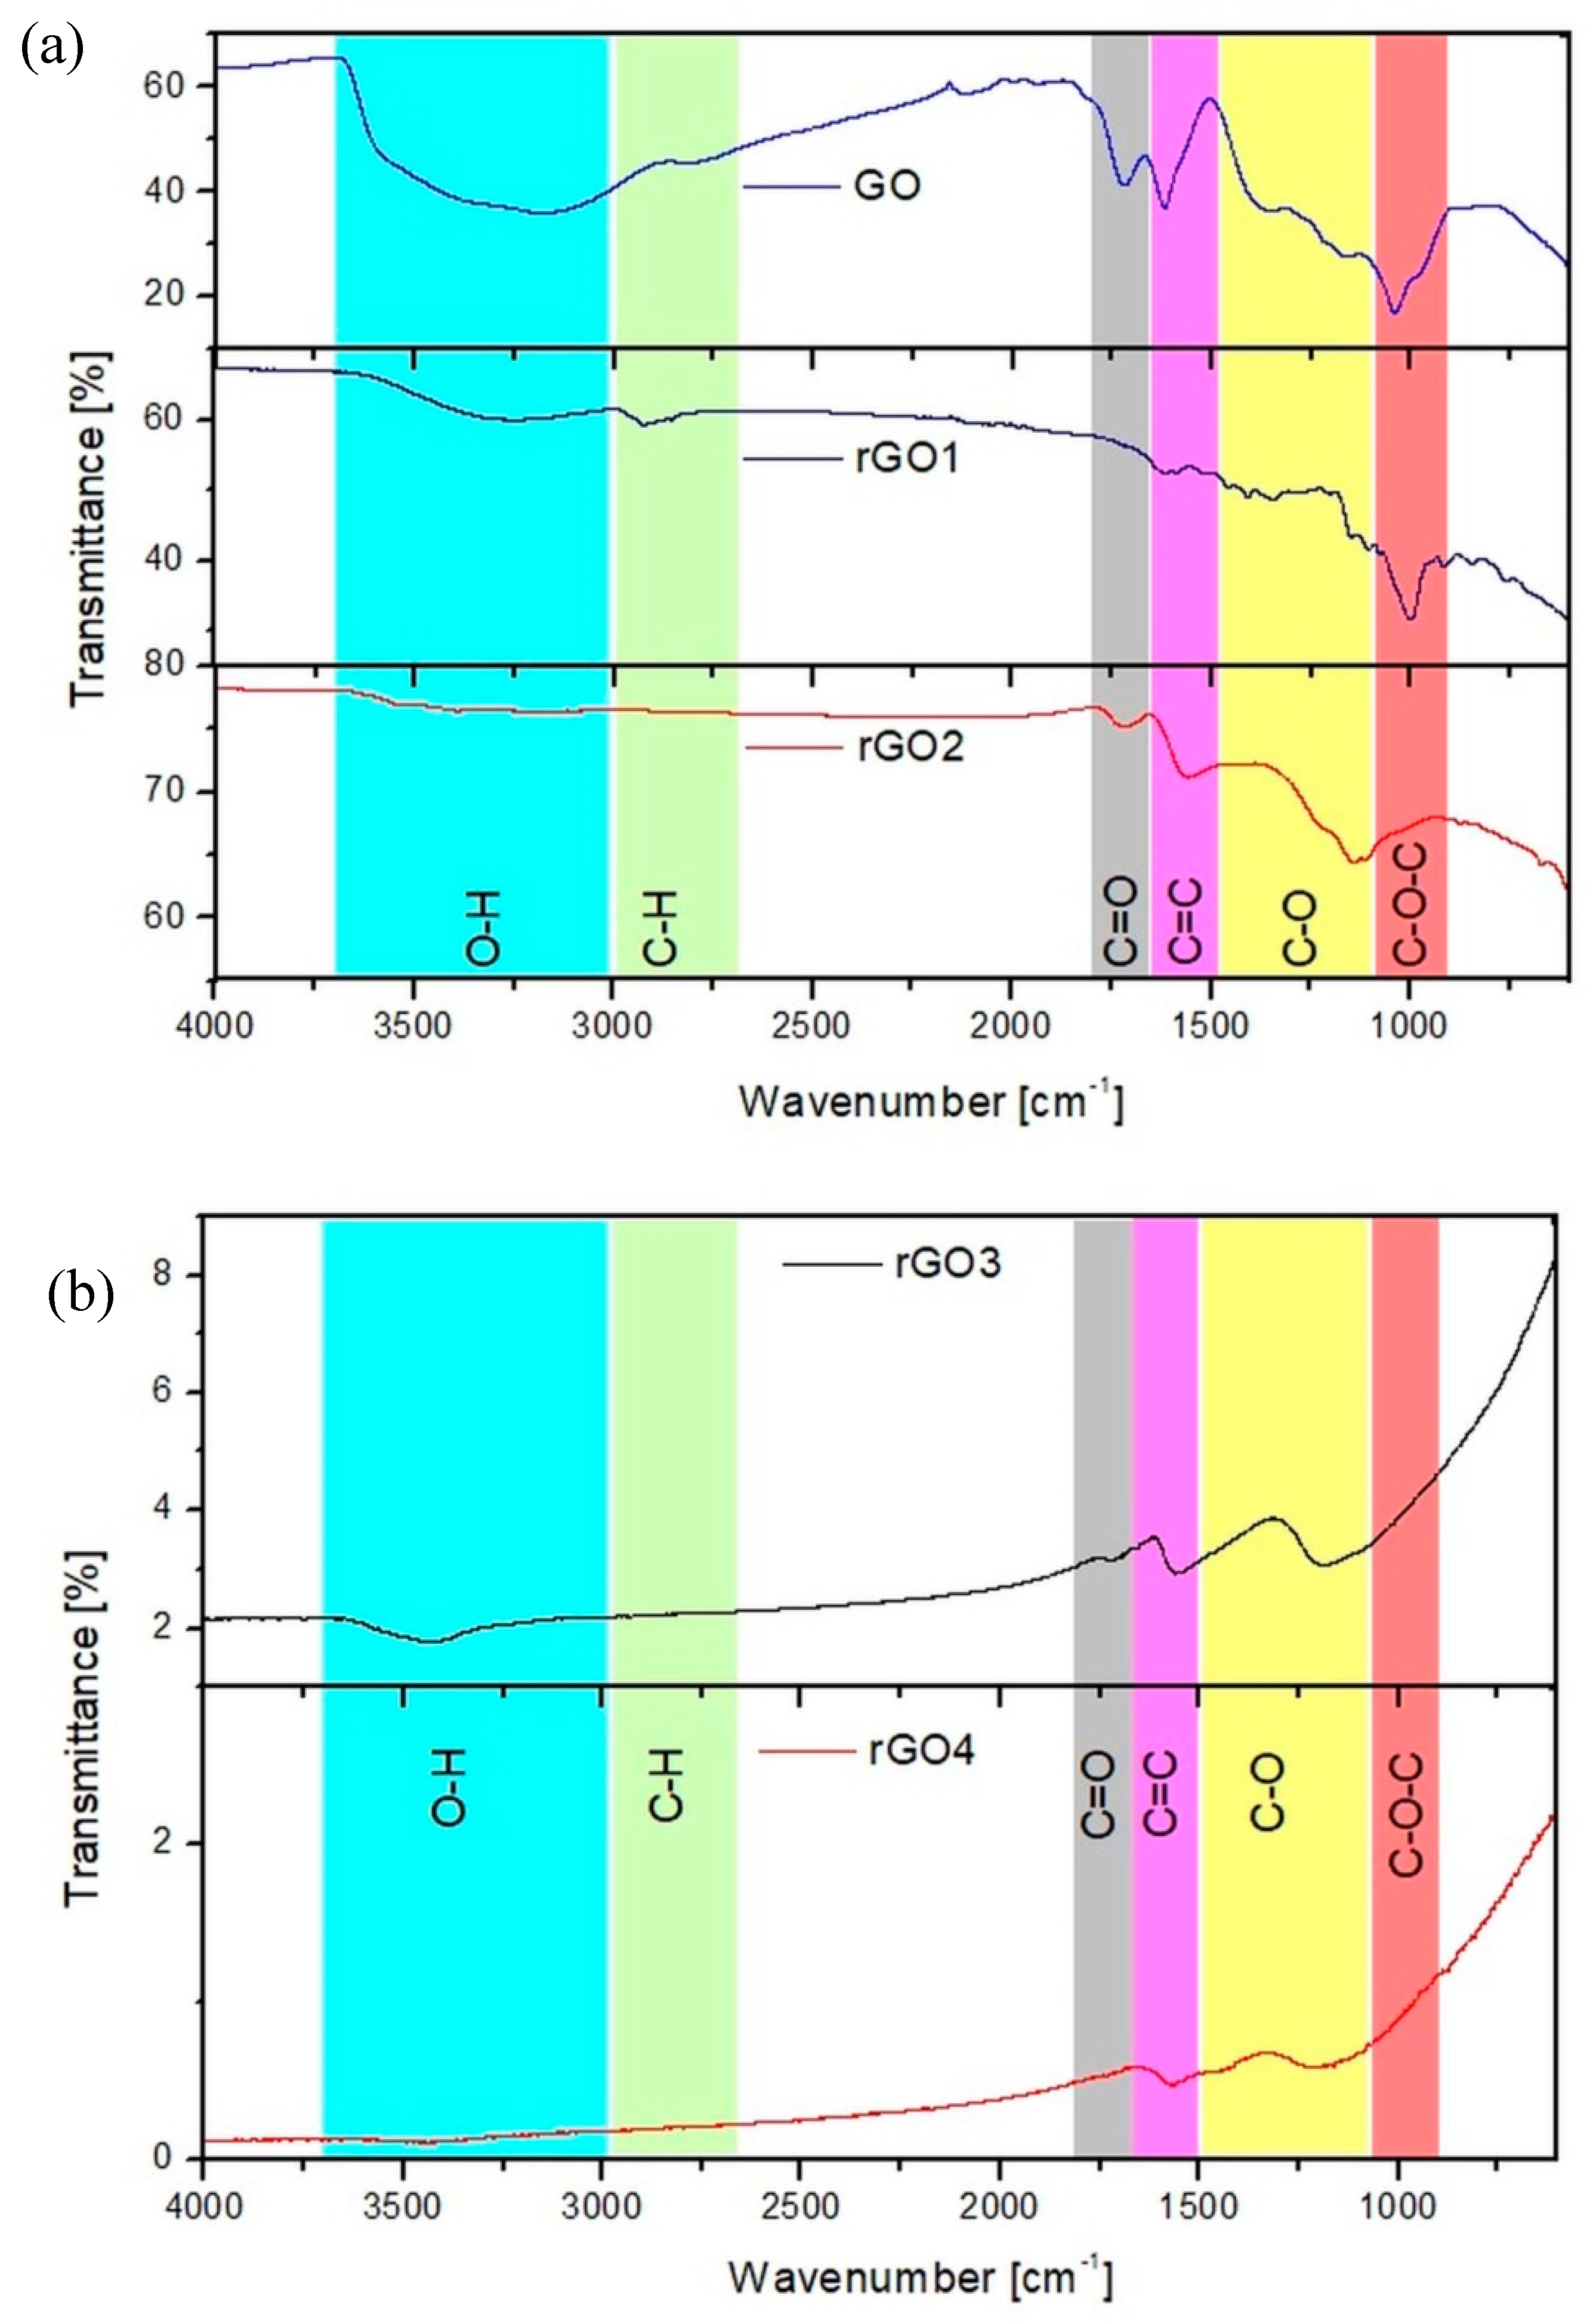
3.1. Graphene Nanomaterials Characterization
3.2. Polymer Nanocomposites Characterisation
4. Conclusions
Author Contributions
Funding
Conflicts of Interest
References
- Long, C.S.; Lu, H.H.; Lii, D.F.; Huang, J.L. Effects of annealing on near-infrared shielding properties of Cs-doped tungsten oxide thin films deposited by electron beam evaporation. Surf. Coat. Technol. 2015, 284, 75–79. [Google Scholar] [CrossRef]
- Guo, C.; Yin, S.; Zhang, P.; Yan, M.; Adachi, K.; Chonan, T.; Sato, T. Novel synthesis of homogenous CsxWO3 nanorods with excellent NIR shielding properties by a water controlled-release solvothermal process. J. Mater. Chem. 2010, 20, 8227–8229. [Google Scholar] [CrossRef]
- Liu, T.; Liu, B.; Wang, J.; Yang, L.; Ma, X.; Li, H.; Zhang, Y.; Yin, S.; Sato, T.; Sekino, T.; et al. Smart window coating based on F-TiO2-KxWO3 nanocomposites with heat shielding, ultraviolet isolating, hydrophilic and photocatalytic performance. Sci. Rep. 2016, 6, 27373. [Google Scholar] [CrossRef] [PubMed] [Green Version]
- Tang, H.; Su, Y.; Hu, T.; Liu, S.; Mu, S.; Xiao, L. Synergetic effect of LaB6 and ITO nanoparticles on optical properties and thermal stability of poly(vinylbutyral) nanocomposite films. Appl. Phys. A Mater. Sci. Process. 2014, 117, 2127–2132. [Google Scholar] [CrossRef] [Green Version]
- Song, Z.; Qin, J.; Qu, J.; Song, J.; Zhang, W.; Shi, Y.; Zhang, T.; Xue, X.; Zhang, R.; Zhang, H.; et al. A systematic investigation of the factors affecting the optical properties of near infrared transmitting cool non-white coatings. Sol. Energy Mater. Sol. Cells 2014, 125, 206–214. [Google Scholar] [CrossRef]
- Wu, X.; Yin, S.; Xue, D.; Komarneni, S.; Sato, T. A CsxWO3/ZnO nanocomposite as a smart coating for photocatalytic environmental cleanup and heat insulation. Nanoscale 2015, 7, 17048–17054. [Google Scholar] [CrossRef]
- Katagiri, K.; Takabatake, R.; Inumaru, K. Robust infrared-shielding coating films prepared using perhydropolysilazane and hydrophobized indium tin oxide nanoparticles with tuned surface plasmon resonance. ACS Appl. Mater. Interfaces 2013, 5, 10240–10245. [Google Scholar] [CrossRef]
- Qi, Y.; Yin, X.; Zhang, J. Transparent and heat-insulation plasticized polyvinyl chloride (PVC) thin film with solar spectrally selective property. Sol. Energy Mater. Sol. Cells 2016, 151, 30–35. [Google Scholar] [CrossRef]
- Zhou, H.; Wang, H.; Tian, X.; Zheng, K.; Wu, Z.; Ding, X.; Ye, X. Preparation of UV-curable transparent poly(urethane acrylate) nanocomposites with excellent UV/IR shielding properties. Compos. Sci. Technol. 2014, 94, 105–110. [Google Scholar] [CrossRef]
- Khandelwal, H.; Schenning, A.P.H.J.; Debije, M.G. Infrared Regulating Smart Window Based on Organic Materials. Adv. Energy Mater. 2017, 7, 1602209. [Google Scholar] [CrossRef]
- Tan, W.K.; Yokoi, A.; Kawamura, G.; Matsuda, A.; Muto, H. PMMA-ITO composite formation via electrostatic assembly method for infra-red filtering. Nanomaterials 2019, 9, 886. [Google Scholar] [CrossRef] [PubMed] [Green Version]
- Cobos, M.; Fernández, M.J.; Fernández, M.D. Graphene based poly(Vinyl alcohol) nanocomposites prepared by in situ green reduction of graphene oxide by ascorbic acid: Influence of graphene content and glycerol plasticizer on properties. Nanomaterials 2018, 8, 1013. [Google Scholar] [CrossRef] [PubMed] [Green Version]
- Aslam, M.; Kalyar, M.A.; Raza, Z.A. Polyvinyl alcohol: A review of research status and use of polyvinyl alcohol based nanocomposites. Polym. Eng. Sci. 2018, 58, 2119–2132. [Google Scholar] [CrossRef]
- Paradossi, G.; Cavalieri, F.; Chiessi, E.; Spagnoli, C.; Cowman, M.K. Poly(vinyl alcohol) as versatile biomaterial for potential biomedical applications. J. Mater. Sci. Mater. Med. 2003, 14, 687–691. [Google Scholar] [CrossRef] [PubMed]
- Hamidi, M.; Azadi, A.; Rafiei, P. Hydrogel nanoparticles in drug delivery. Adv. Drug Deliv. Rev. 2008, 60, 1638–1649. [Google Scholar] [CrossRef] [PubMed]
- Rhim, J.W.; Park, H.B.; Lee, C.S.; Jun, J.H.; Kim, D.S.; Lee, Y.M. Crosslinked poly(vinyl alcohol) membranes containing sulfonic acid group: Proton and methanol transport through membranes. J. Membr. Sci. 2004, 238, 143–151. [Google Scholar] [CrossRef]
- Bolto, B.; Tran, T.; Hoang, M.; Xie, Z. Crosslinked poly(vinyl alcohol) membranes. Prog. Polym. Sci. 2009, 34, 969–981. [Google Scholar] [CrossRef]
- Mak, K.F.; Ju, L.; Wang, F.; Heinz, T.F. Optical spectroscopy of graphene: From the far infrared to the ultraviolet. Solid State Commun. 2012, 152, 1341–1349. [Google Scholar] [CrossRef]
- Acik, M.; Lee, G.; Mattevi, C.; Chhowalla, M.; Cho, K.; Chabal, Y.J. Unusual infrared-absorption mechanism in thermally reduced graphene oxide. Nat. Mater. 2010, 9, 840–845. [Google Scholar] [CrossRef]
- Nair, R.R.; Blake, P.; Grigorenko, A.N.; Novoselov, K.S.; Booth, T.J.; Stauber, T.; Peres, N.M.R.; Geim, A.K. Fine structure constant defines visual transparency of graphene. Science 2008, 320, 1308. [Google Scholar] [CrossRef] [Green Version]
- Bonaccorso, F.; Sun, Z.; Hasan, T.; Ferrari, A.C. Graphene photonics and optoelectronics. Nat. Photonics 2010, 4, 611–622. [Google Scholar] [CrossRef] [Green Version]
- Stobinski, L.; Lesiak, B.; Malolepszy, A.; Mazurkiewicz, M.; Mierzwa, B.; Zemek, J.; Jiricek, P.; Bieloshapka, I. Graphene oxide and reduced graphene oxide studied by the XRD, TEM and electron spectroscopy methods. J. Electron Spectrosc. Relat. Phenom. 2014, 195, 145–154. [Google Scholar] [CrossRef]
- Lesiak, B.; Stobinski, L.; Malolepszy, A.; Mazurkiewicz, M.; Kövér, L.; Tóth, J. Preparation of graphene oxide and characterisation using electron spectroscopy. J. Electron Spectrosc. Relat. Phenom. 2014, 193, 92–99. [Google Scholar] [CrossRef]
- Robinson, J.T.; Tabakman, S.M.; Liang, Y.; Wang, H.; Sanchez Casalongue, H.; Vinh, D.; Dai, H. Ultrasmall reduced graphene oxide with high near-infrared absorbance for photothermal therapy. J. Am. Chem. Soc. 2011, 133, 6825–6831. [Google Scholar] [CrossRef]
- Li, M.; Yang, X.; Ren, J.; Qu, K.; Qu, X. Using graphene oxide high near-infrared absorbance for photothermal treatment of Alzheimer’s disease. Adv. Mater. 2012, 24, 1722–1728. [Google Scholar] [CrossRef]
- Ma, Y.; Zhi, L. Graphene-Based Transparent Conductive Films: Material Systems, Preparation and Applications. Small Methods 2019, 3, 1800199. [Google Scholar] [CrossRef] [Green Version]
- Zeranska-Chudek, K.; Lapinska, A.; Wroblewska, A.; Judek, J.; Duzynska, A.; Pawlowski, M.; Witowski, A.M.; Zdrojek, M. Study of the absorption coefficient of graphene-polymer composites. Sci. Rep. 2018, 8, 9132. [Google Scholar] [CrossRef]
- Mo, S.; Peng, L.; Yuan, C.; Zhao, C.; Tang, W.; Ma, C.; Shen, J.; Yang, W.; Yu, Y.; Min, Y.; et al. Enhanced properties of poly(vinyl alcohol) composite films with functionalized graphene. RSC Adv. 2015, 5, 97738–97745. [Google Scholar] [CrossRef]
- Tantis, I.; Psarras, G.C.; Tasis, D. Functionalized grapheme—Poly(vinyl alcohol) nanocomposites: Physical and dielectric properties. Express Polym. Lett. 2012, 6, 283–292. [Google Scholar] [CrossRef]
- Xiang, B.; Qi, Y.; Wang, S.; Zhang, J. Using a Novel and Easy-to-Use Sandwich Structure Device to Evaluate the Cooling Properties of Cool Materials. Int. J. Polym. Anal. Charact. 2015, 20, 529–540. [Google Scholar] [CrossRef]
- Jaworski, S.; Wierzbicki, M.; Sawosz, E.; Jung, A.; Gielerak, G.; Biernat, J.; Jaremek, H.; Łojkowski, W.; Woźniak, B.; Wojnarowicz, J.; et al. Graphene Oxide-Based Nanocomposites Decorated with Silver Nanoparticles as an Antibacterial Agent. Nanoscale Res. Lett. 2018, 13, 116. [Google Scholar] [CrossRef] [PubMed] [Green Version]
- Liang, H. Mid-infrared response of reduced graphene oxide and its high-temperature coefficient of resistance. AIP Adv. 2014, 4, 107131. [Google Scholar] [CrossRef] [Green Version]


| Sample Name | Thickness [mm] |
|---|---|
| 0.1% GO | 0.229 ± 0.019 |
| 0.1% rGO1 | 0.256 ± 0.047 |
| 0.1% rGO2 | 0.266 ± 0.049 |
| 0.1% rGO3 | 0.337 ± 0.033 |
| 0.1% rGO4 | 0.381 ± 0.051 |
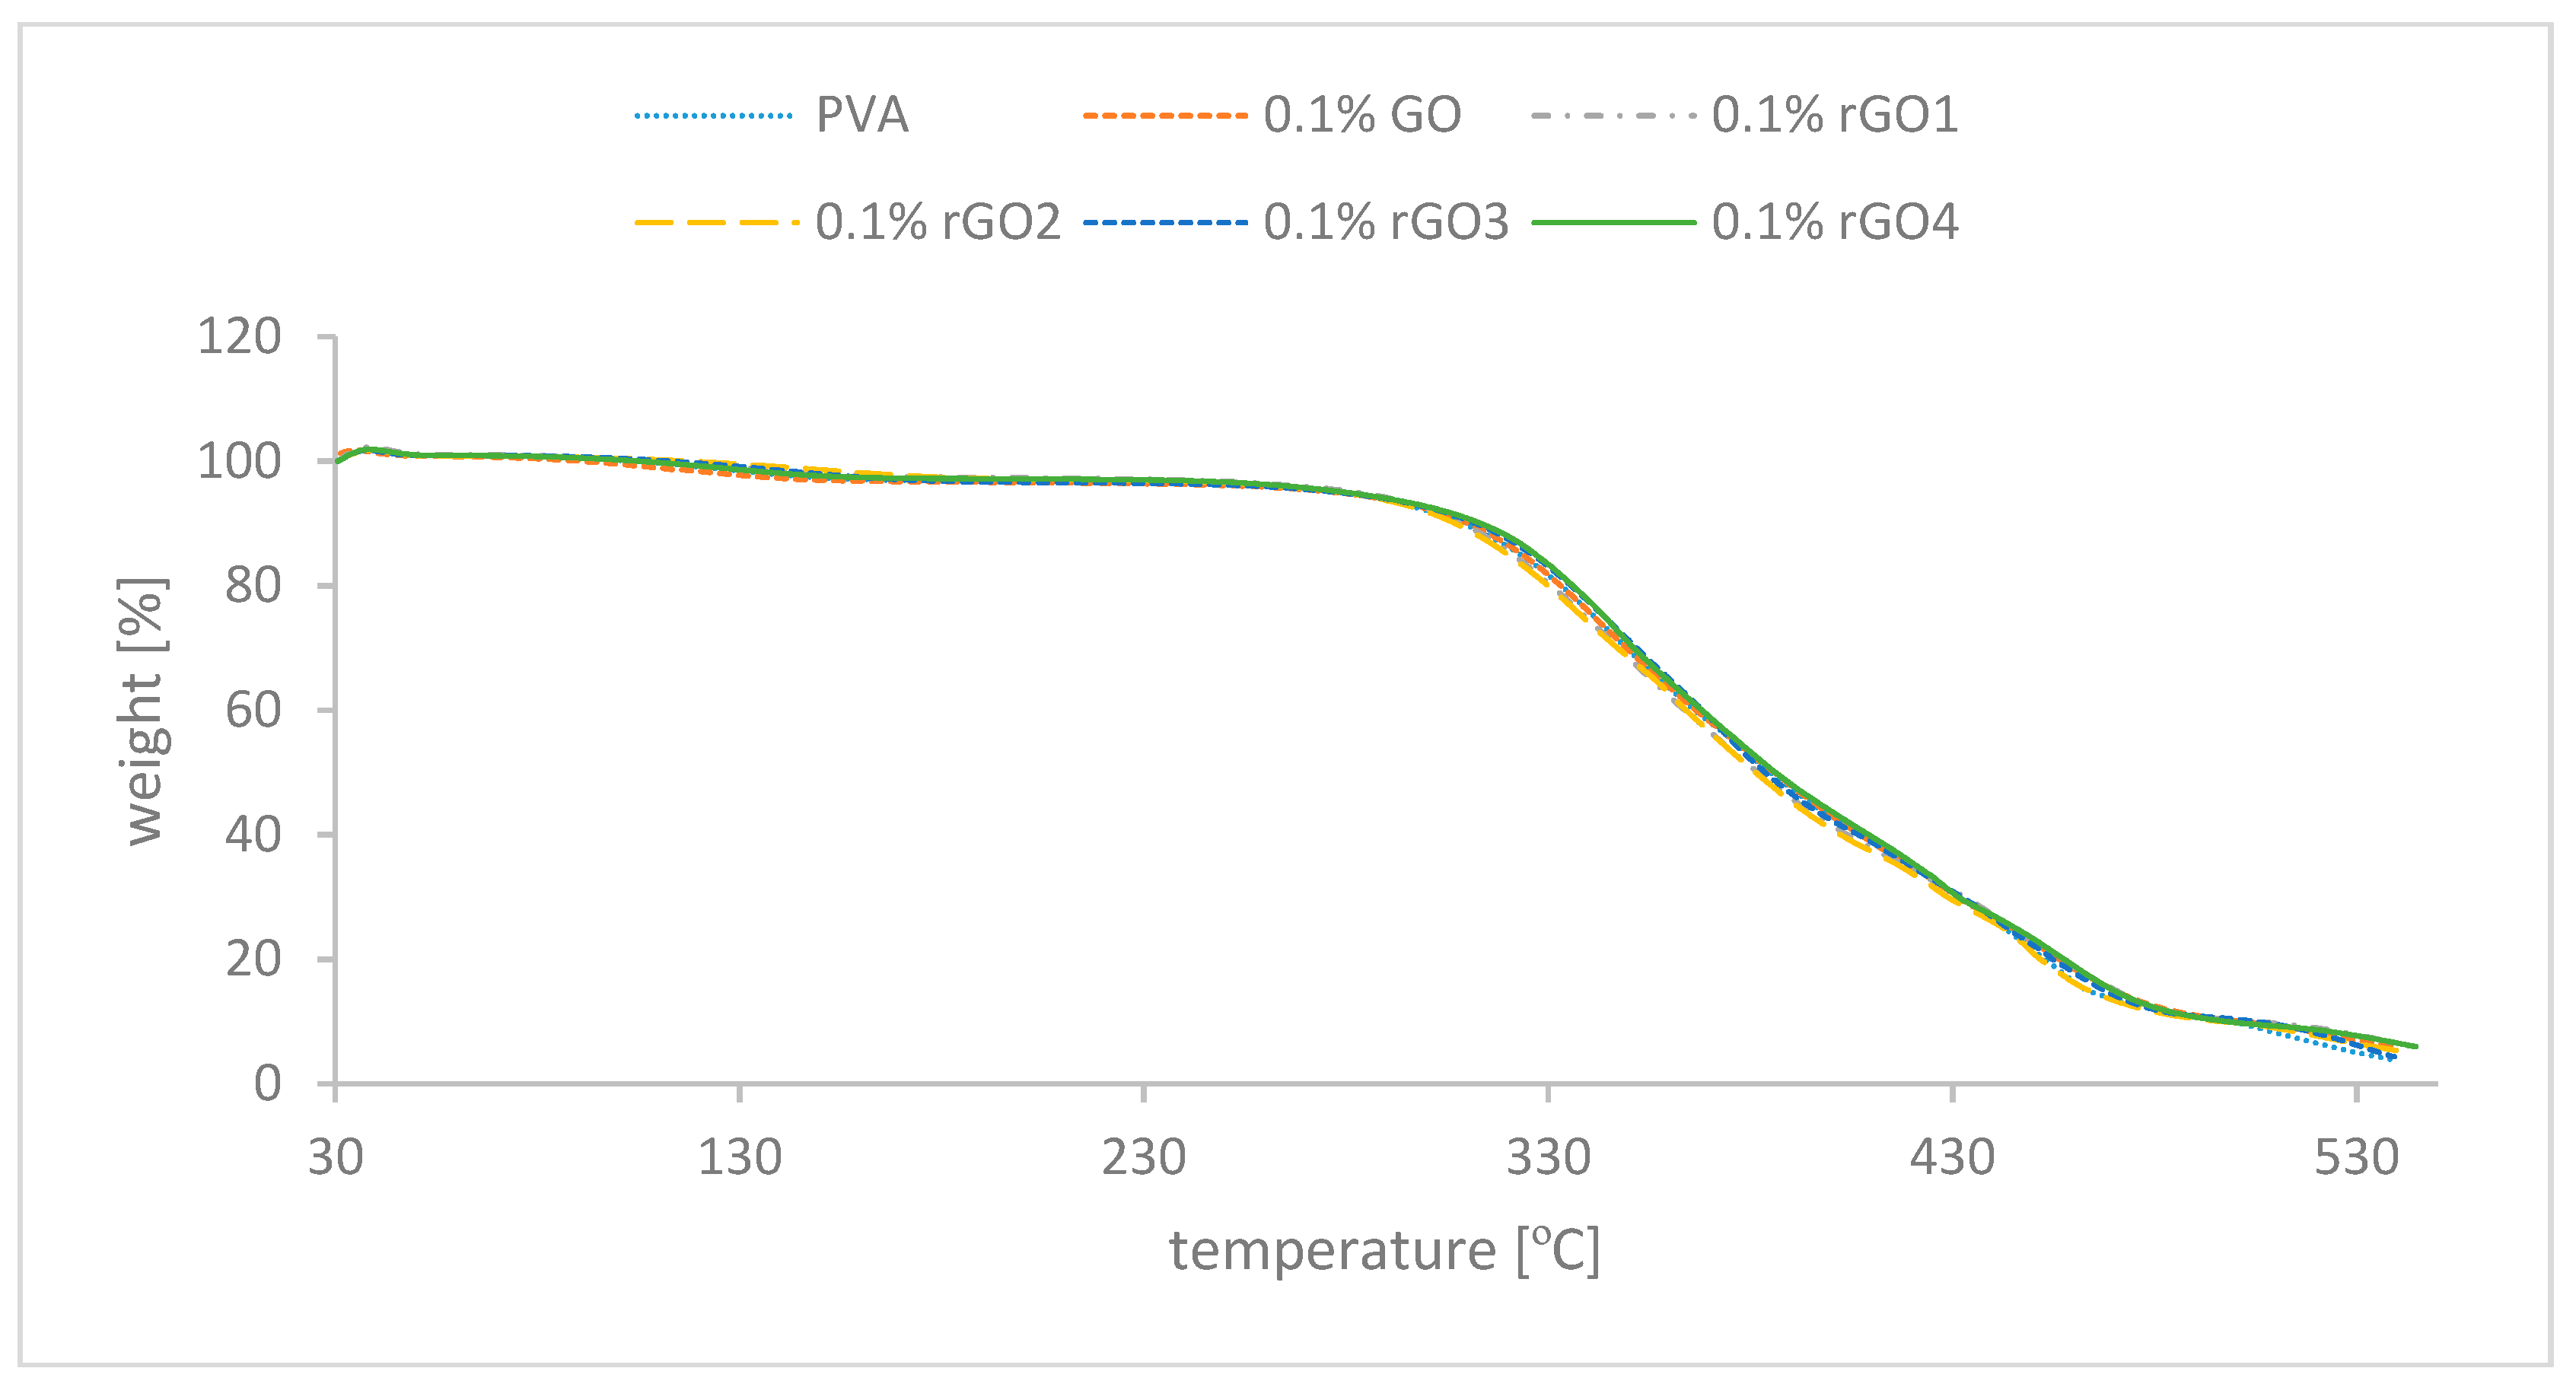
| Sample | Elemental Content | |||||
|---|---|---|---|---|---|---|
| TGA [wt.%] | C [wt.%] | H [wt.%] | N [wt.%] | S [wt.%] | O [wt.%] | |
| GO | 0.00 | 48.98 | 2.18 | 0.00 | 1.03 | 47.20 |
| rGO1 | 0.00 | 67.56 | 1.62 | 0.00 | 0.00 | 30.82 |
| rGO2 | 1.88 | 67.48 | 0.87 | 0.00 | 0.00 | 29.77 |
| rGO3 | 6.35 | 82.70 | 0.68 | 1.66 | 0.00 | 8.61 |
| rGO4 | 6.78 | 83.21 | 0.64 | 0.00 | 0.53 | 8.84 |
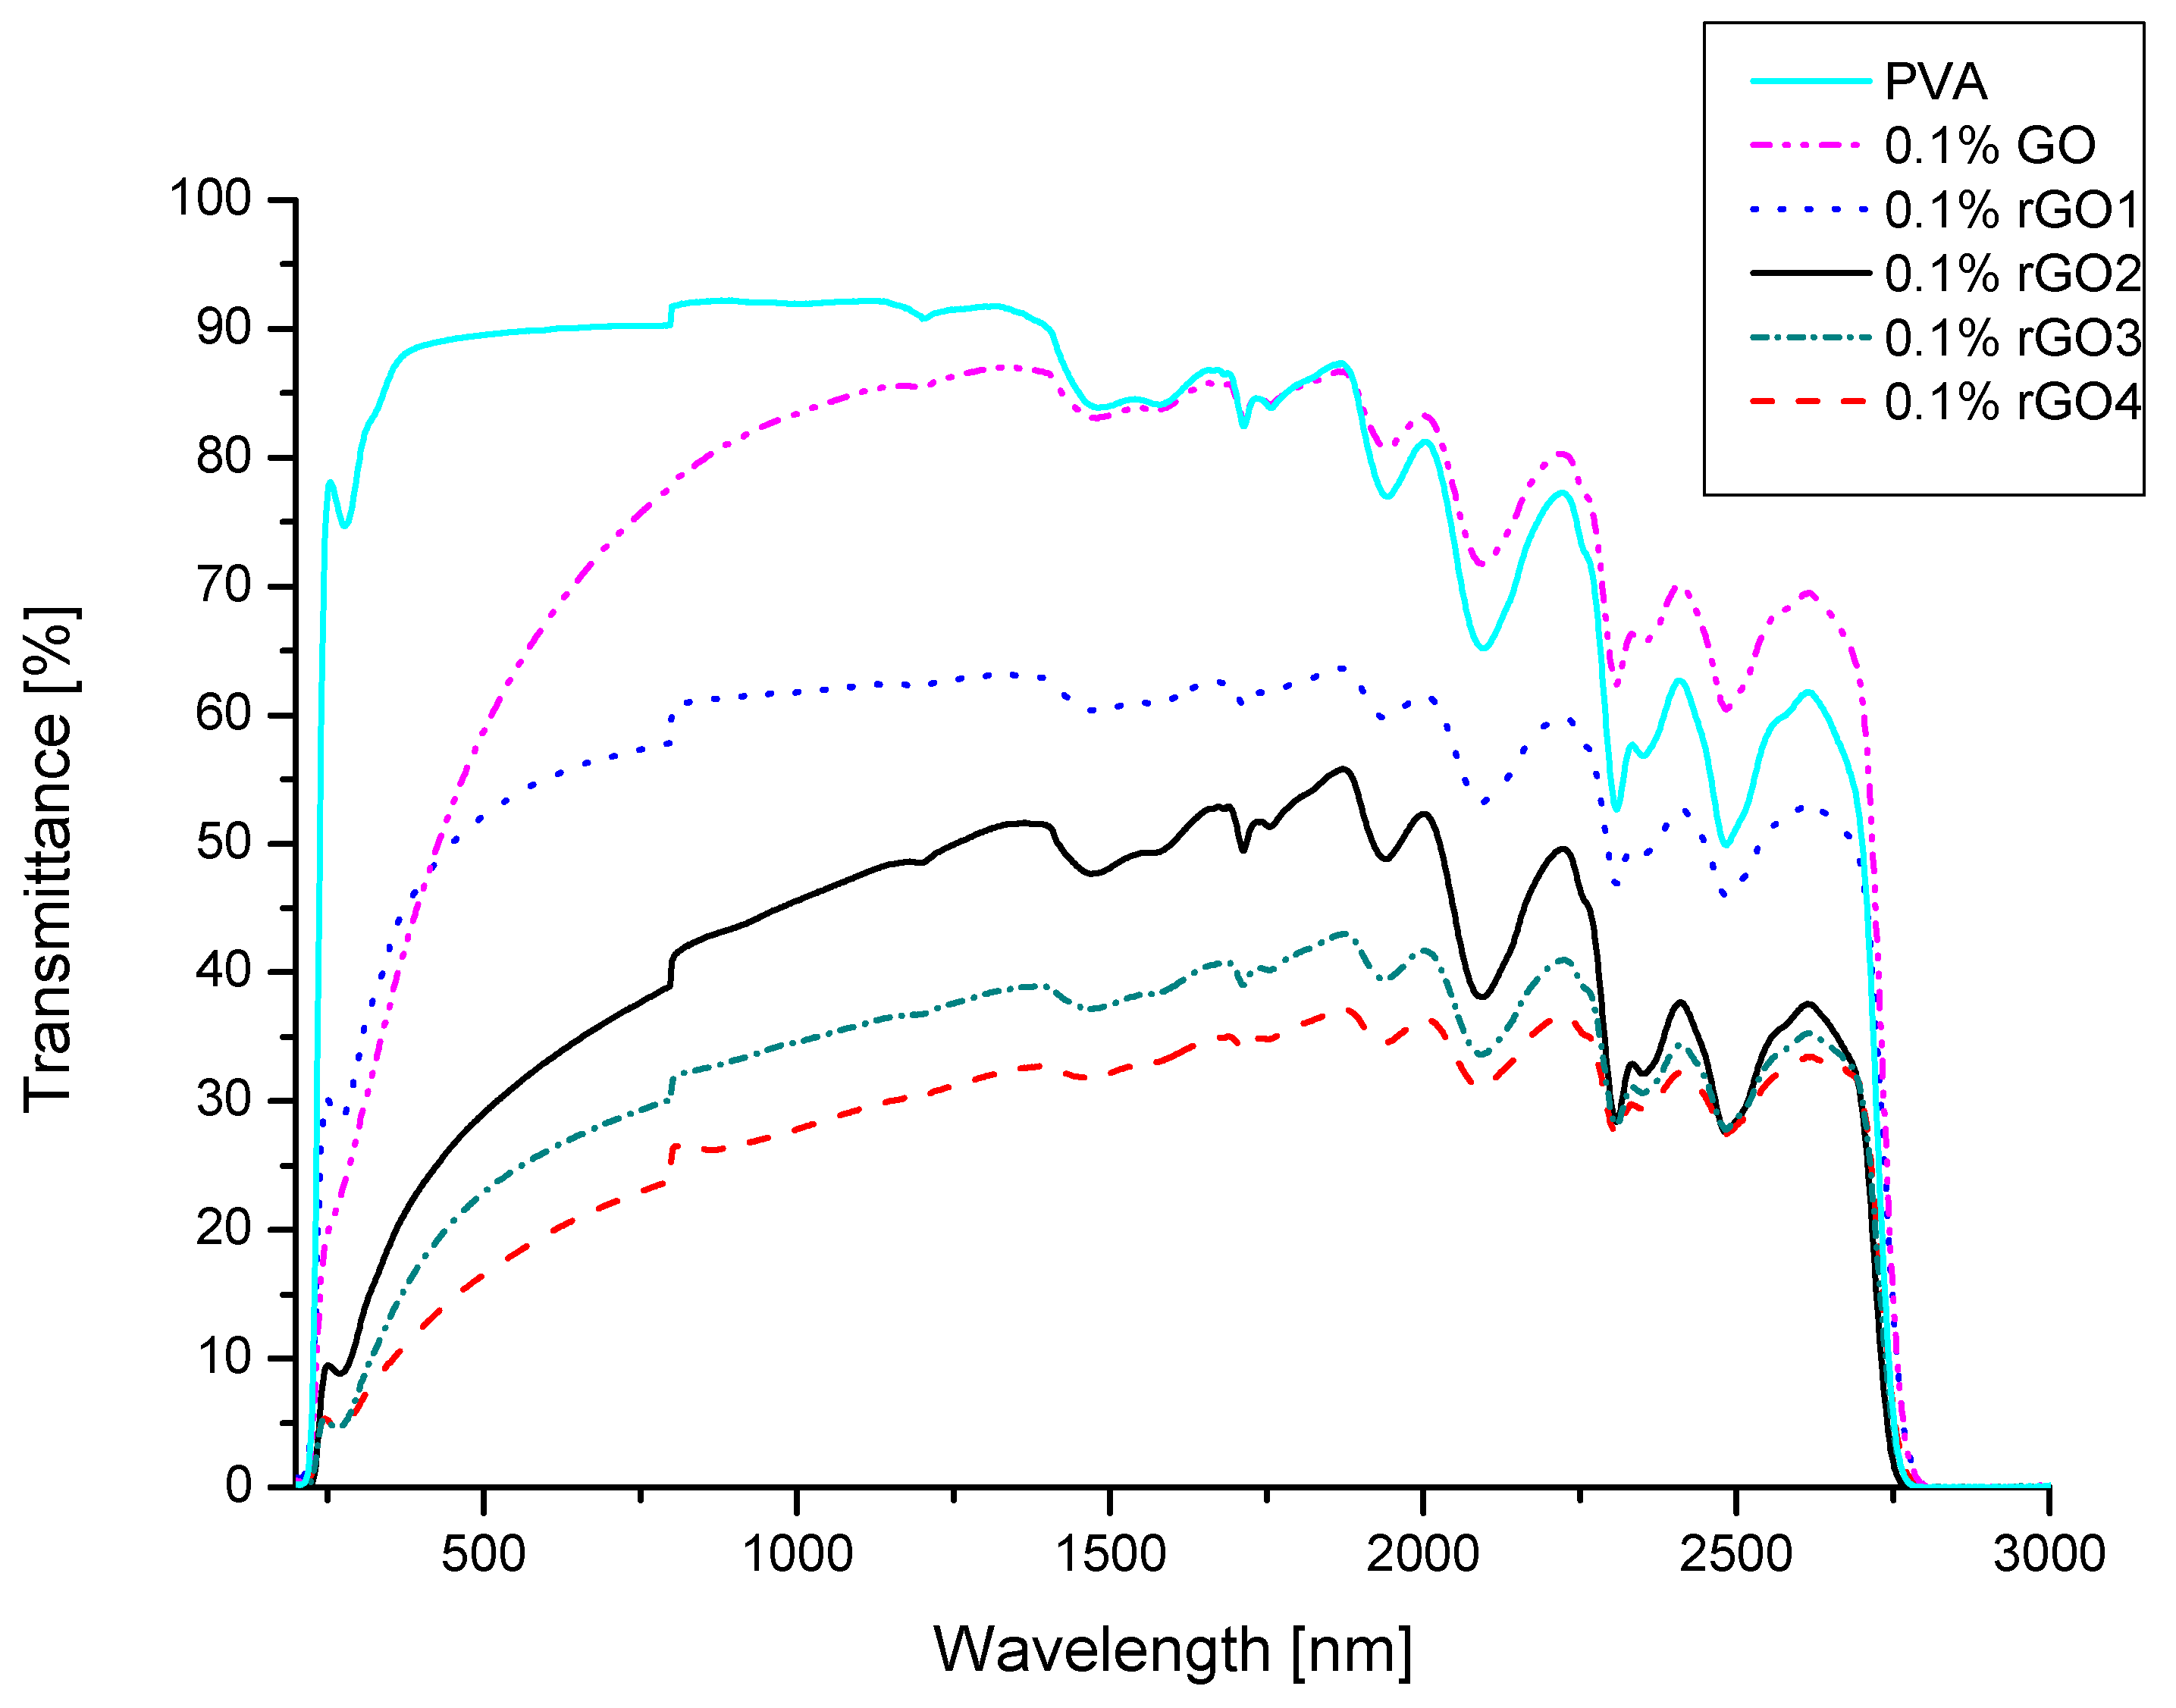
| Sample | UV (200–400 nm) [%] | Vis (400–800 nm) [%] | NIR (800–2600 nm) [%] |
|---|---|---|---|
| PVA | 67.57 | 89.81 | 80.19 |
| 0.1% GO | 26.23 | 65.54 | 79.88 |
| 0.1% rGO 1 | 31.01 | 54.23 | 59.03 |
| 0.1% rGO 2 | 12.31 | 32.51 | 45.65 |
| 0.1% rGO 3 | 8.29 | 25.41 | 36.71 |
| 0.1% rGO 4 | 6.59 | 19.14 | 31.92 |
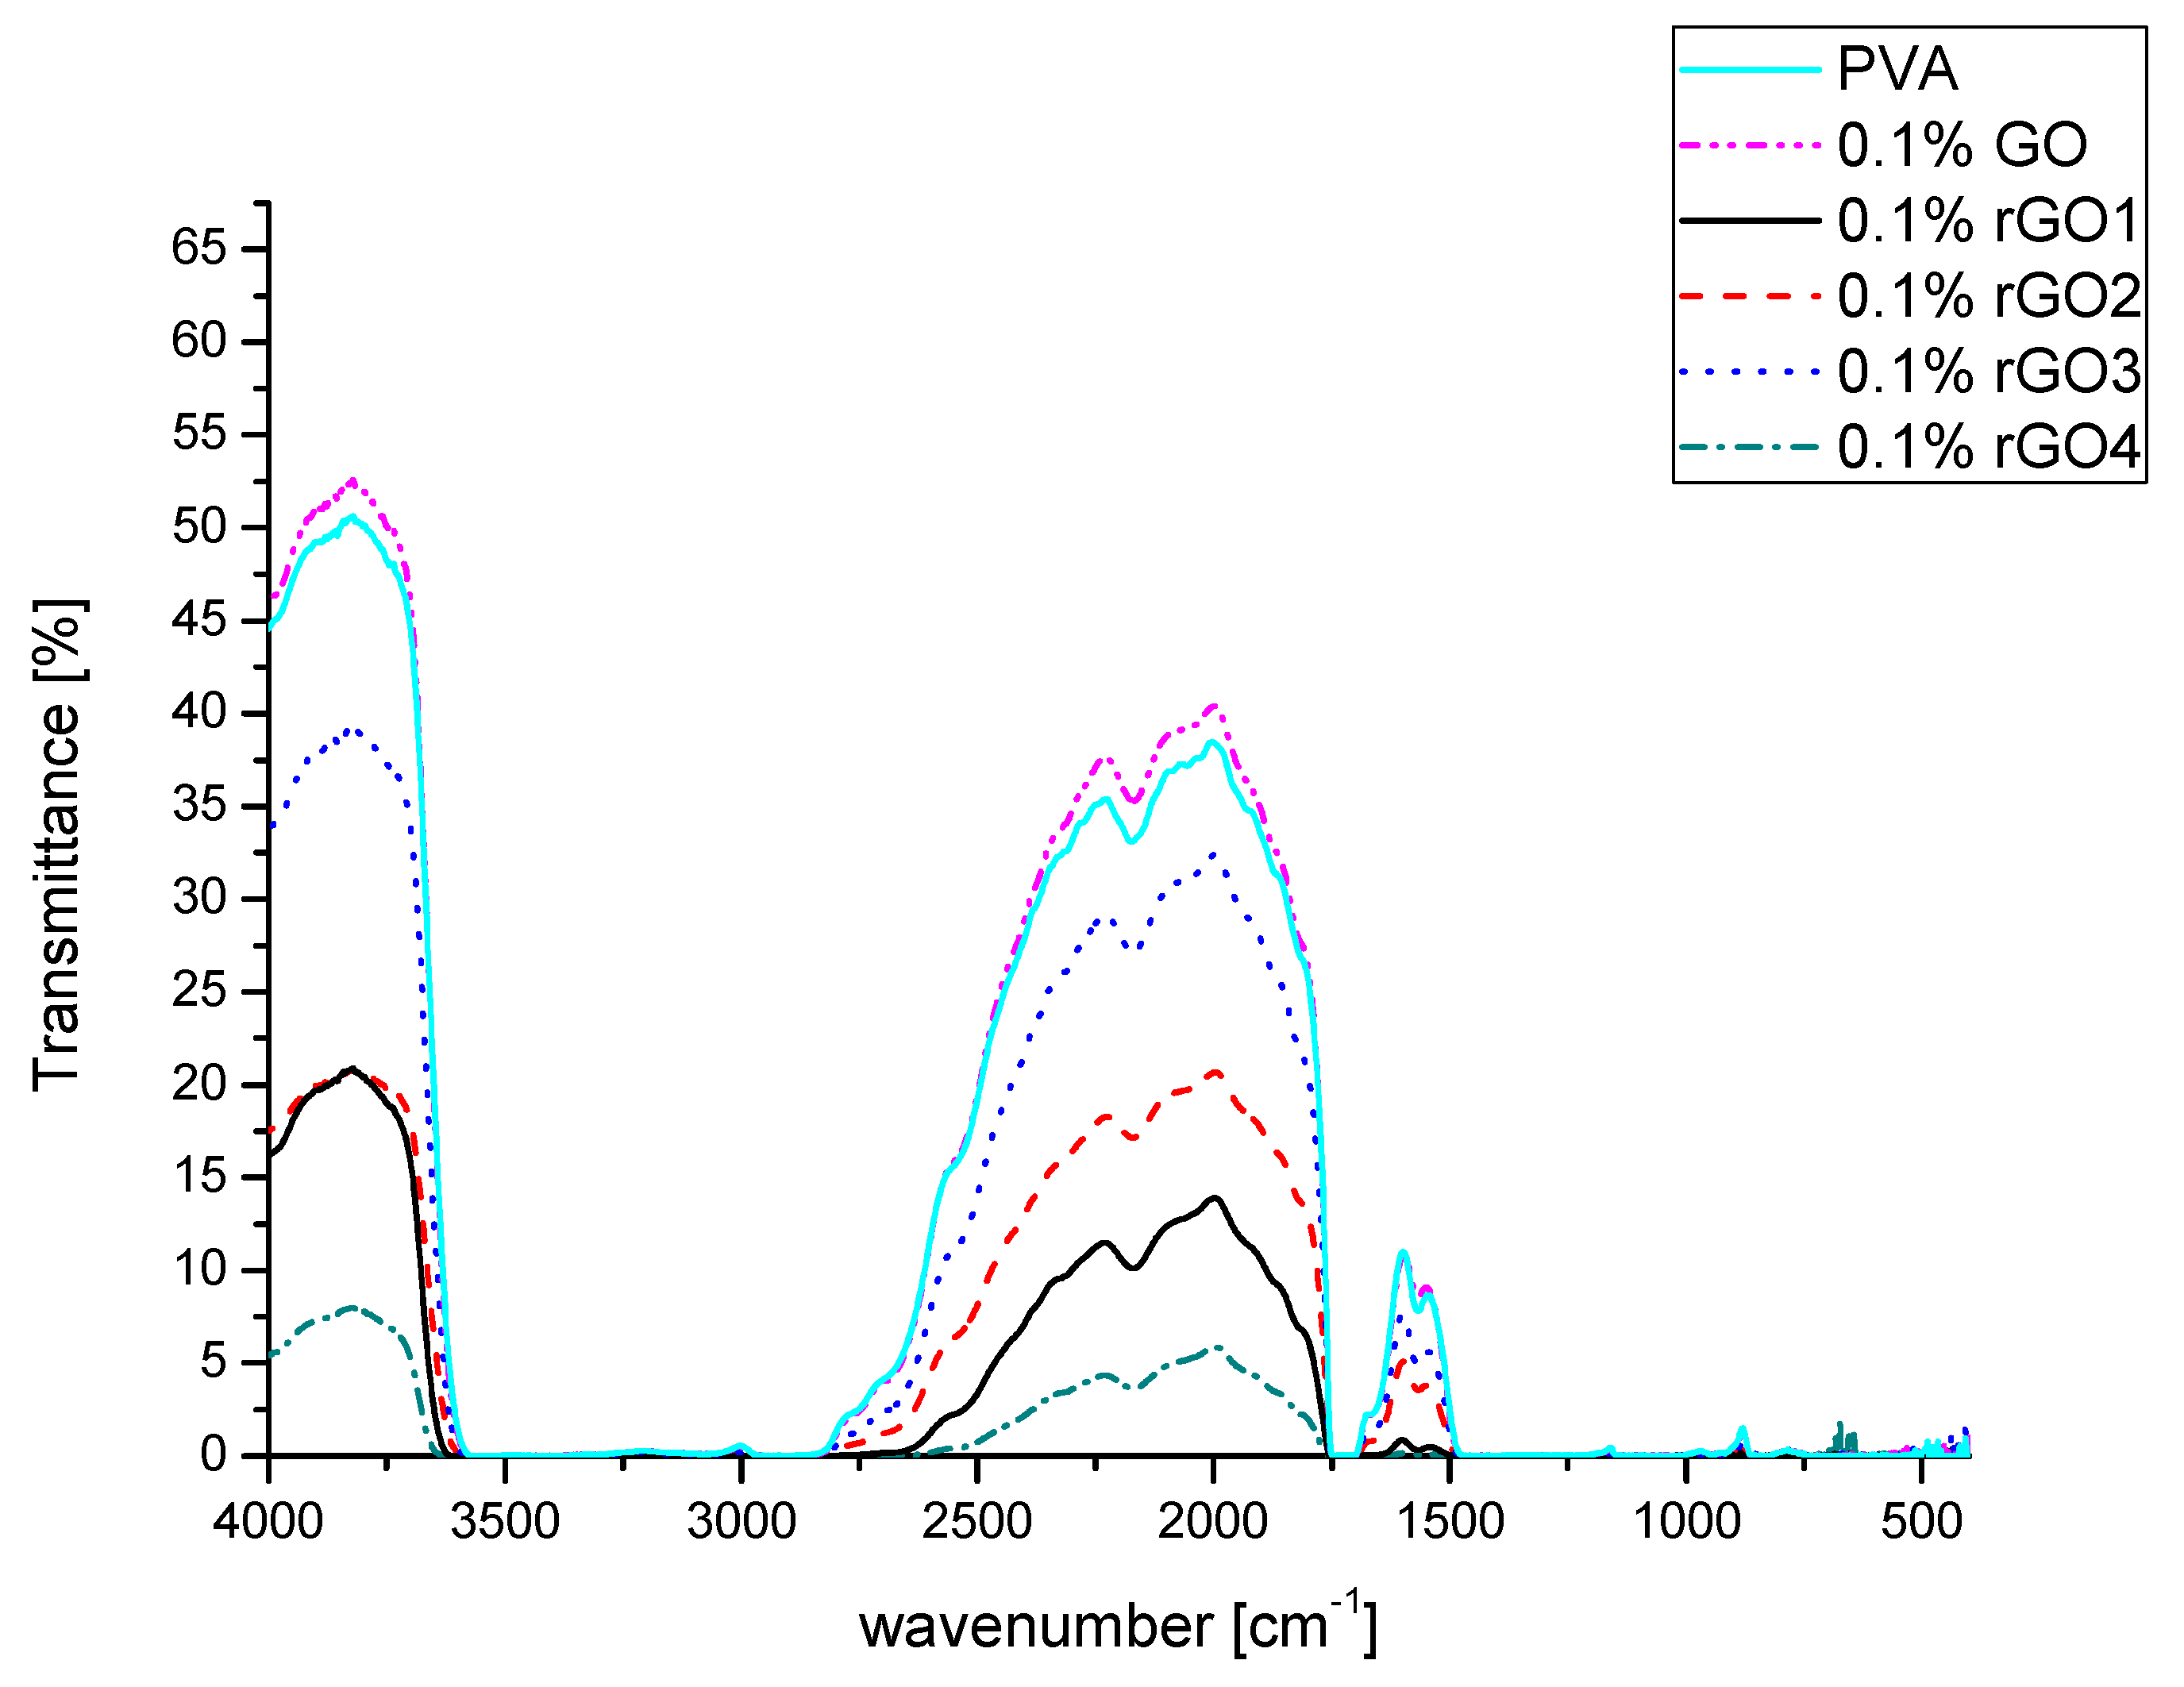
| Sample | Transmittance [%] |
|---|---|
| PVA | 12.25 |
| 0.1% GO | 12.69 |
| 0.1% rGO 1 | 9.54 |
| 0.1% rGO 2 | 3.81 |
| 0.1% rGO 3 | 1.38 |
| 0.1% rGO 4 | 5.58 |
© 2019 by the authors. Licensee MDPI, Basel, Switzerland. This article is an open access article distributed under the terms and conditions of the Creative Commons Attribution (CC BY) license (http://creativecommons.org/licenses/by/4.0/).
Share and Cite
Mazurkiewicz-Pawlicka, M.; Nowak, M.; Malolepszy, A.; Witowski, A.; Wasik, D.; Hu, Y.; Stobinski, L. Graphene Oxide with Controlled Content of Oxygen Groups as a Filler for Polymer Composites Used for Infrared Radiation Shielding. Nanomaterials 2020, 10, 32. https://doi.org/10.3390/nano10010032
Mazurkiewicz-Pawlicka M, Nowak M, Malolepszy A, Witowski A, Wasik D, Hu Y, Stobinski L. Graphene Oxide with Controlled Content of Oxygen Groups as a Filler for Polymer Composites Used for Infrared Radiation Shielding. Nanomaterials. 2020; 10(1):32. https://doi.org/10.3390/nano10010032
Chicago/Turabian StyleMazurkiewicz-Pawlicka, Marta, Maksymilian Nowak, Artur Malolepszy, Andrzej Witowski, Dariusz Wasik, Yi Hu, and Leszek Stobinski. 2020. "Graphene Oxide with Controlled Content of Oxygen Groups as a Filler for Polymer Composites Used for Infrared Radiation Shielding" Nanomaterials 10, no. 1: 32. https://doi.org/10.3390/nano10010032