Article

Research on the Effect of Oriental Fruit Moth Feeding on the Quality Degradation of Chestnut Rose Juice Based on Metabolomics

School of Liquor and Food Engineering, Guizhou University, Guiyang 550025, China
*
Author to whom correspondence should be addressed.
Molecules 2023, 28(20), 7170; https://doi.org/10.3390/molecules28207170
Submission received: 19 August 2023 / Revised: 6 October 2023 / Accepted: 15 October 2023 / Published: 19 October 2023

Abstract

:
As a native fruit of China, chestnut rose (Rosa roxburghii Tratt) juice is rich in bioactive ingredients. Oriental fruit moth (OFM), Grapholita molesta (Busck), attacks the fruits and shoots of Rosaceae plants, and its feeding affects the quality and yield of chestnut rose. To investigate the effects of OFM feeding on the quality of chestnut rose juice, the bioactive compounds in chestnut rose juice produced from fruits eaten by OFM were measured. The electronic tongue senses, amino acid profile, and untargeted metabolomics assessments were performed to explore changes in the flavour and metabolites. The results showed that OFM feeding reduced the levels of superoxide dismutase (SOD), tannin, vitamin C, flavonoid, and condensed tannin; increased those of polyphenols, soluble solids, total protein, bitterness, and amounts of bitter amino acids; and decreased the total amino acid and umami amino acid levels. Furthermore, untargeted metabolomics annotated a total of 426 differential metabolites (including 55 bitter metabolites), which were mainly enriched in 14 metabolic pathways, such as flavonoid biosynthesis, tryptophan metabolism, tyrosine metabolism, and diterpenoid biosynthesis. In conclusion, the quality of chestnut rose juice deteriorated under OFM feeding stress, the levels of bitter substances were significantly increased, and the bitter taste was subsequently enhanced.

Graphical Abstract

1. Introduction

Chestnut rose (Rosa roxburghii Tratt) of the Rosaceae family is a rare and native fruit in China, and its juice is rich in functional active components, such as vitamin C, superoxide dismutase (SOD), and terpenoids. Chestnut rose is also known as the “King of Vitamin C” because of its high vitamin C content [1]. As the geographic origin of chestnut rose, Guizhou Province in China has been focusing on chestnut rose plantation, exploitation and utilization [2,3]. Studies have shown that chestnut rose juice has reproductive protection, antioxidant, anti-inflammatory, anticancer, and immunity enhancement properties [4,5,6]. With the rising social recognition of chestnut rose juice, a variety of chestnut rose products, including chestnut rose drinks, chestnut rose wines, and chestnut rose preserved fruits are attractive for the public. However, chestnut rose juice has a highly bitter taste, since it contains high levels of polyphenols and flavonoids. This has become an obstacle to the consumption of chestnut rose products. Although some enterprises have adopted techniques to remove the astringent and bitter flavours during the processing of chestnut rose products, there are some side effects, such as serious nutrient loss, complicated processing, and poor quality improvement [7]. Plant bitterness is derived from bitter substances. Increasing evidence has shown that in addition to inherent bitter substances, when subjected to external stress, the plant’s defence system activates the synthesis of additional bitter substances and enhances the activity of the original bitter substances to resist invasion from pests, diseases, mechanical injuries, and drought [8,9].
Oriental fruit moth (OFM), Grapholita molesta (Busck) (Lepidoptera: Tortricidae), is a common pest of the roots and fruits of Rosaceae plants [10]. As the main pest of chestnut rose, OFM feeding directly disturbs the quality and yield of chestnut rose [11,12]. Early feeding of OFM is one of the main causes of fruit shedding, and OFM feeding in the middle and late stages of maturity is problematic for chestnut rose processing [11]. Statistical data from Guizhou chestnut rose juice processing enterprises in recent years showed that 20~60% of chestnut rose suffers from OFM feeding stress. Because it is difficult to distinguish chestnut rose fruit undergoing OFM feeding from normal fruit on their appearance, equipment and technology specifically designed for screening fruit eaten by OFM is unavailable. Although OFM feeding did not significantly change the appearance of chestnut rose fruit, the effect on its quality was unclear. Our previous studies have revealed that compared with normal chestnut rose juice, there is significantly increased bitterness, astringency, and decreased storage stability in chestnut rose juice from fruits subjected to OFM feeding stress. However, the mechanism of quality deterioration of juice from chestnut rose eaten by OFM is unclear. Therefore, it is necessary to explore the basis of the nutrient and flavour deterioration in chestnut rose juice under OFM feeding stress. This will provide theoretical guidance for the planting, management, and processing of high-quality chestnut rose.
In this study, function, flavour deterioration, and metabolic pathways of chestnut rose juice deterioration under OFM feeding stress were explored by using physiological and biochemical methods to determine the functional active components of chestnut rose juice after OFM feeding. Sensory evaluations of flavour and amino acid detection were carried out by an electronic tongue and automatic amino acid analyser, and changes in metabolic pathways were revealed through nontargeted metabolomics.

2. Results and Discussion

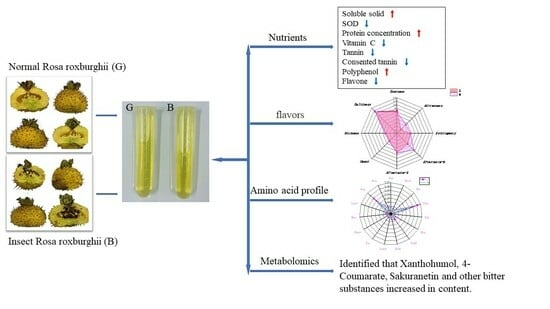
2.1. Effects of OFM Feeding on Functional Active Ingredients in Chestnut Rose Juice

The normal fruit and those subjected to OFM feeding could not be distinguished based on their appearance. However, after cutting the fruit open, it was observed that the inside of the latter was “blackened” (Figure S1), and the worm fruit rate reached 27.68% in these fruits. As shown in Table 1, there was no significant difference in weight, the ratio of transverse to longitudinal diameters, or total colour, but the juice yield of normal fruit (67.19%) was significantly higher than that of fruit subjected to OFM feeding (55.36%). In the fruit juice from fruit subjected to OFM feeding, there was a decrease in SOD and tannin content, especially that of vitamin C, condensed tannins, and flavones; there were also increased levels of polyphenols, soluble solids, and total protein. These results indicate that OFM feeding seriously degraded the quality of chestnut rose juice.

2.2. Effects of OFM Feeding on the Flavour of Chestnut Rose Juice

The sensor signals of samples G and B were collected using an electronic tongue, and the conversion values of eight taste indicators positively related to flavour intensity, including bitterness, astringency, aftertaste-B (bitter aftertaste), aftertaste-A (astringent aftertaste), umami, umami aftertaste, and saltiness, were obtained. The negative values indicate that the taste failed for the detected sensor. A drawing of the radar map from conversion values is shown in Figure 1, which visualizes the difference in taste between the two samples. OFM feeding had no significant effect on the saltiness and umami values of chestnut rose juice, but it decreased the acidity value, improved astringency and aftertaste-A, and significantly enhanced bitterness and aftertaste-B. These results suggest that chestnut rose produces bitter astringent substances to resist OFM feeding stress.

2.3. Effects of OFM Feeding on Amino Acid Profiles in Chestnut Rose Juice

The amino acid profiles of chestnut rose juice were measured using an automatic amino acid analyser (proline content was determined at a wavelength of 440 nm; other amino acid contents were detected at a wavelength of 570 nm). Fifteen amino acids were detected, six of which (threonine, valine, isoleucine, leucine, phenylalanine, lysine) were essential and accounted for 11.50% and 12.27% of the total amino acids in samples G and B, respectively. An amount of 12 amino acids, including threonine, serine, alanine, valine, isoleucine, leucine, tyrosine, phenylalanine, histidine, proline, and especially arginine and glutamic acid, were significantly decreased by OFM feeding, but the amounts of aspartate and lysine were almost unchanged (Figure 2). Therefore, the increased bitterness of the chestnut rose juice may be attributed to decreased umami amino acid content (such as arginine and glutamate), an increased proportion of bitter amino acids (such as histidine, isoleucine, tyrosine, phenylalanine, valine, leucine, etc.), And an increased proportion of bitter amino acids (such as histidine, isoleucine, tyrosine, phenylalanine, valine, leucine, etc.).

2.4. Effects of OFM Feeding on Metabolites in Chestnut Rose Juice

2.4.1. Nontargeted Metabolomics Analysis

Furthermore, to investigate the changes in flavour and in the characteristic substances in chestnut rose juice from fruits subjected to OFM feeding stress, nontargeted metabolomics based on LC-QTOF were performed to analyse metabolite changes in sample G and sample B. A total of 3898 metabolites were identified, 2398 of which were detected in positive ion mode, and 1500 of which were detected in negative ion mode. In this study, FC ≥ 1 (upregulated), FC ≤ 0.5 (downregulated), VIP ≥ 1, and p < 0.05 were set as screening conditions. A total of 426 differential metabolites were identified, including 130 in positive ion mode and 296 in negative ion mode. The identified metabolites were mainly enriched in amino acid metabolism, biosynthesis of other secondary metabolites, and metabolism of terpenes and polyketones. These metabolites may represent the material basis of the chestnut rose juice quality reduction following OFM feeding.

2.4.2. Principal Component Analysis (PCA)

Principal component analysis (PCA) of samples G and B was performed before the differential metabolite analysis. The results showed that there was a high degree of differentiation between the two samples in the positive and negative ion modes (Figure S2). OPLS-DA also showed that there was a large degree of separation between sample G and sample B in positive and negative ion modes. The prediction parameters of the evaluation model include R2X, R2Y, and Q2Y, where R2 represents the interpretability of the model variable, and Q2 represents the predictability of the model. (R2X = 0.934, R2Y = 0.998, Q2Y = 0.958 in positive ion mode, R2X = 0.958, R2Y = 1 in negative ion mode; Q2Y = 0.999), indicating a significant difference in metabolites in the two samples (Figure 3). The permutation test of the OPLS-DA model demonstrated that there was high independence between the training set and the test set, indicating that the OPLS-DA model was reliable (Figure S3).

2.4.3. Cluster Analysis of Differential Metabolites

The volcano plots showed that of the 130 different metabolites identified under the positive ion model, 72 metabolites had significant changes, including 58 upregulated metabolites (such as R.g.-ketol, sphingosyl-phosphocholine, dopamine quinone, and 3-Methylthiopropyl-desulfogluco-sinolate) and 14 downregulated metabolites (such as salicin 6-phosphate). Of the 296 different metabolites identified under the negative ion model, 185 metabolites had significant changes, including 166 upregulated metabolites (such as 4-coumarate, L-normelanephrine, dihydroechinofuran, and bracteatin 6-O-glucoside) and 19 downregulated metabolites (such as 5-hydroxykynurenine) (Figure 4A,B). The clustering heatmaps of differential metabolites showed that metabolites were similar within the groups, but there were differences between the groups (Figure 4C,D), suggesting that sample G and sample B have different metabolic characteristics.

2.4.4. Enrichment Analysis of Differential Metabolites

Enrichment analysis and overrepresentation analysis (ORA) of the metabolic pathways represented by different metabolites were conducted in the Kyoto Encyclopedia of Genes and Genomes (KEGG) database, and it was found that different metabolites in positive and negative ion modes were enriched in amino acid metabolism, secondary metabolite synthesis, carbohydrate metabolism, terpenoid metabolism pathways, and polyketone metabolism pathways (Figure 5).
The components of bitter taste (bitter substances) include phenolic acids, flavonoids, alkaloids, amino acids, and their polypeptides. The KEGG analysis showed that 55 differential bitter metabolites (of which 50 were upregulated and 5 were downregulated) (Table 2) were enriched under positive and negative ion modes. The enrichment factors of differential metabolites in positive and negative ion models are shown in Figure S4. There were 2, 7, 6, 5, 1, 2, 6, 1, 2, 4, 4, 5, 2, and 8 differential metabolites in phenylalanine metabolism; tryptophan metabolism; tyrosine metabolism; histidine metabolism; phenylalanine, tyrosine and tryptophan biosynthesis; valine, leucine and isoleucine degradation; diterpenoid biosynthesis; sesquiterpenoid and triterpenoid biosynthesis; terpenoid backbone biosynthesis; pyrimidine metabolism; phenylpropanoid biosynthesis; caffeine metabolism; flavone and flavonol biosynthesis; and flavonoid biosynthesis, respectively. The order of their enrichment was defined as follows: amino acid metabolism > flavonoid metabolism > alkaloid metabolism > terpenoid metabolism. The bitter taste of chestnut rose juice caused following OFM feeding may be caused by these differential bitter metabolites.
Bitterness is a sensory attribute that is difficult for the public to accept. Bitterness is usually detected by the stimulation of bitterness receptors (TAS2Rs or T2Rs) in the tongue or mouth, which initiates bitterness signal transduction pathways transmitting bitter taste signals to the brain, and the subsequent perception of bitterness [13,14,15,16]. To avoid ingesting toxic and potentially harmful foods, most organisms have evolved sensitive taste receptors for bitterness. Of course, bitterness is not necessarily toxic, and there are some excellent natural foods with strong bitter tastes, such as coffee, cocoa beans, and bitter melon, which are typical bitter foods, but the proportion of bitter foods that are edible is extremely low. Current studies have shown that bitter substances are widely found in plants, fruits, and vegetables, and play a crucial role in defence against external stress [8]. Kant et al. [17] believed that the defence strategy adopted by plants against pests is to change its nutrient contents and release plant hormones and secondary metabolites. Soluble sugars and amino acids are the main osmotic regulatory substances of plants under stress conditions [18,19]. In plants, pest feeding triggers the defence response of plants, affecting the composition of sugars, amino acids, and other nutrients, thus preventing phytophagous insect feeding [20]. Soluble proteins in plants are generally enzymes involved in metabolism. Plants adapt to unfavourable environments through increasing soluble proteins involved in osmotic regulation [21,22]. The release of plant hormone signalling molecules promotes secondary metabolite transfer, and regulates and induces defence against pests. Jasmonic acid and methyl jasmonate play an important role in balancing plant growth and development and responding to stress. Under pest stress, they regulate the expression of defence genes and produce specific inducer proteins to effectively improve the plant defence response to pests [23,24,25]. Studies have shown that the growth, reproduction, and survival rate of phytophagous insects are related to the release of plant secondary metabolites. Phytophagous insect feeding caused plants to produce toxic secondary metabolites such as phenols by regulating the expression of biosynthetic genes. Excessive intake of phenols by insects results in restricted growth and development and increased larval mortality. In addition, the increased intake of tannins and condensed tannins also impairs insect feeding and digestion, subsequently inhibiting the invasion of pests [26,27]. Under pest stress, changes in plant nutrients participate in a series of physiological and biochemical reactions to enhance their defensive abilities.
The secondary metabolites of plants can affect the feeding, growth, development, and reproduction of pests, attract the natural enemies of pests, and alter the biological characteristics of the population, resulting in direct or indirect defence against pests. There are many kinds of plant secondary metabolites related to pest resistance, such as terpenoids, phenolic compounds, and a variety of nitrogen-containing compounds, including alkaloids and amines. S. Mitra et al. [9] claimed that the activities of phenolic compounds (such as guaiacol and pyrogallol) of Ludwigia prostrata Roxb. were significantly increased under Altica cyanea feeding stress. Bosch Marko et al. [8] reported that the feeding of beet armyworm (Spodoptera exigua) on tomato leaves triggered a defence mechanism, leading to increased levels of monoterpenoids and sesquiterpenoids. Phenols and terpenoids are naturally bitter substances in plants [28,29] that are capable of protecting plants from damage caused by pests. Free amino acids not only play a significant role in plant resistance to stress, but are also important taste substances. Bitterness is conferred by the interaction between hydrophobic side chains of free amino acids and bitterness receptors on the human tongue [30]. In this study, amino acids in chestnut rose juice were identified, and it was found that seven (histidine, leucine, tyrosine, isoleucine, lysine, valine and phenylalanine) out of fifteen amino acids were bitter [31,32]. Although the increased proportion of bitter amino acids, caused by decreased contents of umami and sweet amino acids, enhanced the bitterness of chestnut rose juice, the recognition threshold of these bitter amino acids is relatively high. The DoT coefficient of histidine was more than 1 (DoT = 1.66), which may be one of the reasons for the bitterness of chestnut rose juice, and the other six bitter amino acids all had DoT coefficients less than 1, so the overall bitterness enhancement effect of these amino acids was not significant [31,33]. Combined with the increase in soluble proteins, it was suspected that the chestnut rose may be invaded by OFM, and its defence enzyme system may be activated to promote amino acid synthesis of pest-resistant or bitter proteins, thereby enhancing pest resistance.
Metabolites are the final products in the process of cell signal transmission, and are important contributors to the flavour, functional characteristics, and physical properties of foods. Differential metabolite analysis facilitates understanding the mechanism of biological responses to stress [34,35]. In this study, nontargeted metabolomics were used to analyse the metabolites between normal chestnut rose juice and those that were subjected to OFM feeding stress. Different metabolites were identified based on the classification of bitter substances and the screening parameters used. Then, the metabolic pathways in which each metabolite was enriched were obtained. The results showed that the enrichment of bitter compounds involved 14 metabolic pathways, mainly flavonoid biosynthesis, tryptophan metabolism, tyrosine metabolism, and diterpenoid biosynthesis. Flavonoids have functions such as adjusting auxin transport, regulating reactive oxygen species, and preventing ultraviolet irradiation [36], which not only affects fruit colour and flavour, but also help plants resist biological and abiotic stresses such as low temperatures and pathogenic bacteria [37,38]. In the flavonoid biosynthesis metabolic pathway, there were eight flavonoid metabolites, including xanthohumol, pseudobaptigenin, coumestrol, butin, liquiritigenin, (+)-gallocatechin, dihydromyricetin, and sakuranetin. Usually, it is thought that flavonoid monomers, such as xanthohumol, (+)-gallocatechin, and sakuranetin, are bitter. These flavonoid monomers can exist freely and also in the form of glycosides or acyl derivatives after undergoing a polymerization reaction with other flavonoids, sugars, and nonflavonoids. The type of glycoside chain determines the intensity of bitterness. Xanthohumol, with a bitterness threshold of 10 μmol/L, is a chalcone with isopentenyl [39] and can give wine pleasant bitterness [40]. Xanthohumol is similar to alpha-acid and can be isomerized under boiling conditions to form isoxanthohumol (8C) and demethylxanthohumol (12C), which are less bitter. Xanthohumol and isoxanthohumol can undergo oxidation reactions to produce many oxidation products that have an impact on the bitterness of wine [41]. 4-Coumarin-CoA reacts with chalcone synthase (CHS) and chalcone reductase (CHR) to generate isoliquiritigenin, which is isomerized into liquiritigenin by chalcone isomerase (CHI). Liquiritigenin can reduce bitterness without introducing odour [36]. A potent phytoestrogen, coumestrol, with the skeleton of coumarin and isoflavone, has a good regulatory effect on oestrogen receptors [42]. It is also an effective α-glucosidase inhibitor that can exert antioxidant properties by providing hydrogen atoms or electron transfer. Studies have found that the iron-reducing capacity of coumestrol is approximately twice that of other isoflavones and only half that of quercetin. Rutin (7,3′,4′-trihydroxy-dihydroflavone) has an excellent free radical scavenging ability, and its activity is maintained when combined with serum albumin [43], which contributes to the antioxidant function of chestnut rose.
In plants, tryptophan and tyrosine are produced by erythritosaccharide tetraphosphate and phosphoenolpyruvate under the action of chorismic acid [44], which are not only synthetic components of proteins, but are also situated upstream of secondary metabolites and growth hormones, playing a role in protecting plants from biological and abiotic stresses [45]. Tryptophan (beta-indolyl alanine) is an essential amino acid, and tastes slightly bitter. In the tryptophan metabolism pathway, 5-hydroxyindoleacetate, formyl-5-hydroxykynurenine, L-formylkynurenine, 3-hydroxyanthranilic acid, 5-hydroxykynurenine, 2-aminophenoxazin-3-one, and 3-hydroxykynurenine were enriched. Tryptophan, as a precursor of formyl-5-hydroxycanuridine, L-formylcanuridine, and 3-hydroxycanuridine, plays a key role in the regulation of plant growth and development, their immune response, and oxidative stress. It is also a precursor to the synthesis of glucosinolates, which are naturally bitter plant products derived from amino acids [46]. Tryptophan collaborates with threonine, lysine, and methionine to improve the nutritional quality of plant-derived foods [45]. Tyrosine (2-amino-3-p-hydroxyphenylpropionic acid) is an aromatic polar alpha-amino acid with a phenolic hydroxyl group and tastes bitter. It is the hub of a variety of metabolic pathways, as well as the precursor of special metabolites such as vitamin E, isoquinoline alkaloids, and partial phenylpropanol, which have many physiological effects, such as serving as defence compounds, attractants, and nonprotein amino acids [45,47]. In the tyrosine metabolism pathway, gentisic acid, 5-(L-alanine-3-yl)-2-hydroxy-cis, cis-muconate 6-semialdehyde, gentisate aldehyde, acetoacetate, 4-coumarate, and hydroquinone were enriched. Gentisic acid is an isomer of protocatechuic acid with a good reducing ability [48]. Its biosynthetic precursor, salicylic acid, is a defence-signalling molecule that causes plant defence genes to activate signalling molecules under the stress of infectious pathogens and adverse environments, thus promoting the accumulation of salicylic acid and gentian acid, as well as enhancing plant resistance [49]. 4-Coumarate is also known as p-coumaric acid. In the tyrosine metabolic pathway, tyrosine catalysed by tyrosine ammonia-lyase (TAL) produces p-coumaric acid [50] and forms umbelliferone. Then, a bitter substance, coumarin, is formed with the substitution of isopentenyl. Coumarin is recognized by the bitter receptors BmGr16, BmGr53, and BmGr18 of lepidoptera [51]. P-Coumaric acid can be catalysed by 4-coumaryl-Co-A ligase and stilbene synthase to generate resveratrol [52]. Resveratrol is present in the form of slightly bitter resveratrol glycosides in plants, and its bitterness has a deterrent effect on insect feeding.
Colourless needle-like or powdery substances, such as diterpenoids, produce an intense bitter taste without odour characteristics [53]. Diterpenoids are formed by the condensation of four isopentene pyrophosphoric acids and the universal precursor geranylgeranyl diphosphate (GGPP). Under the catalysis of cytochrome P450, the diterpenoid skeleton is modified to form a variety of complex chemical structures with tetracyclic compounds [54]. The diterpenoid biosynthesis pathway is enriched with gibberellin A36, gibberellin A8, ent-copalyl diphosphate, gibberellin A53, GGPP, and gibberellin A29-catabolite. The plant hormone gibberellin is a tetracyclic diterpenoid compound, and its synthetic precursor is ent-kaurene derived from the cyclization of GGPP. Ent-kaurene is oxidized to produce GA12-aldehyde, an important intermediate of gibberellin biosynthesis, and gibberellin A53 is oxidized in the cytoplasmic matrix to form a variety of gibberellins [55]. Free gibberellin is a mono-, di-, or tricarboxylic acid with 19C or 20C, while most bound gibberellin is glucoside or glucosylester. Under the stress of diseases and pests, gibberellin induces resistance responses to enhance the ability of plants to resist stress [56]. In addition, increased gibberellin levels promote the membrane repair of damaged cells to protect plants [57].

3. Materials and Methods

3.1. Main Reagents

Rutin (7,3′,4′-trihydroxy-dihydroflavone) was purchased from Kuer Bioengineering Co., Ltd., Hefei, China. Sodium molybdate, sodium tungstate, lithium sulfate, and sodium nitrite were obtained from Shanghai Macklin Biochemical Technology Co., Ltd., Shanghai, China. Gallic acid monohydrate was purchased from Tianjin Kemio Chemical Reagent Co., Ltd., Tianjin, China. 2-Chloro-L-phenylalanine (≥98%) was purchased from Shanghai Aladdi Co., Ltd., Shanghai, China.

3.2. Collection and Juicing of Chestnut Rose Fruit

Fresh chestnut rose fruit, “Gui Nong No. 5”, was collected from the National Chestnut Rose Demonstration Park in Longli County, Qiannan Buyi, and Miao Autonomous Prefecture, Guizhou Province, China (altitude of 900~1500 m, organic matter content ≥ 2.0%, pH 5.0~7.0). The park was divided into five regions: east, west, south, north, and middle. Five samples were selected from each region using the diagonal method, each sample was ≥20 kg, and a total of 25 samples were sampled from 5 regions. Before juicing, each fruit was divided into two parts with a knife (at 4 °C temperatures) to observe the “blackened” phenomenon inside them. If it is “blackened”, it is identified as a worm fruit (eaten by OFM) (Figure S1B); If it is not “blackened”, it is identified as a normal fruit (Figure S1A). The processing of chestnut rose juice adopts a low-temperature physical pressing method (in a press machine), pre-treatment does not crush without adding pectinase, cellase, and other enzymes, and the juice is filtered and centrifuged (at 4 °C and 12,000 rpm for 15 min) after squeezing. Then, the supernatant was packed in a high-barrier aluminium foil BIB bag and stored at −20 ℃ (normal juice was marketed as “G”; the juice extracted from the chestnut rose fruits eaten by OFM was marked as “B”, n = 25). To ensure that the data in the experiment are representative, we mixed 10 samples from the east and west regions, 10 samples from the north and south regions, and 5 samples from the middle region into 1 sample according to the principle of the diagonal two tops, so as to make 3 sample replicates.

3.3. Determination of the Functional Active Ingredients in Chestnut Rose Juice

Chestnut rose was weighed by an electronic balance (SB 3003, Haining Shengbo Weighing Instrument Co., Ltd., Ningbo, China) The transverse and longitudinal diameters were measured by a Vernier calliper (0–150 mm, Yantai Lvlin Tool Co., Ltd., Yantai, China). The total colour difference was determined using a high-quality computer colour difference metre (SC-10, Shenzhen Sanenshi Technology Co., Ltd., Shenzhen, China). The soluble solid content was determined using a handheld refractometer (WYT-Ⅱ, Optical Instrument Department of Chengdu Youth Federation). Superoxide dismutase (SOD) levels were determined according to the instructions of the SOD assay kit (Nanjing Jiancheng Bioengineering Institute). Total protein was determined with a BCA protein assay kit (Beyotime Biotechnology, Shanghai, China). The vitamin C content was determined using molybdenum blue colorimetry [58]. The tannin content was determined using spectrophotometry in accordance with NY/T1600-2008. Condensed tannins were detected using a vanillin reaction [59]. Polyphenols were determined using the Folin-phenol method [60]. Flavonoid content was determined using the aluminium nitrate chromogenic method [61].

3.4. Electronic Tongue Test

The multifunctional taste nutrition detection system was implemented using the electronic tongue SA402B of Insent company in Japan (TS-5000Z, Insent Company, Fukuoka, Japan). This system has eight taste sensors: sour taste, bitter taste, astringent taste, aftertaste-B (bitter aftertaste), aftertaste-A (astringent aftertaste), umami taste, umami aftertaste, and salty taste. Chestnut rose was mechanically pressed for juice, and the juice was filtered and centrifuged at 4 °C and 12,000 rpm for 15 min. Then, the supernatant was absorbed for electronic tongue testing. Before the detection began, the taste sensor and reference electrode were pretreated to stabilize the potential; all sensors, reference electrodes (3.33 mol/L KCl solution), and the internal solution (3.33 mol/L KCl + saturated silver chloride) were connected to the sensor connector. The reference solution was composed of a 30 mmol/L KCl solution and 0.3 mmol/L of tartaric acid. The negatively charged membrane washing solution was applied to the negatively charged membrane sensors AC0, AN0, and BT0, as well as the hybrid membrane sensors AAE, CT0, and CA0. The positively charged membrane washing solution was applied to the positively charged membrane sensors C00, AE1, and GL1.

3.5. Amino Acid Profile Analysis

The automatic amino acid analyser L-8800 (Hitachi, Tokyo, Japan) was used to investigate the amino acid spectrum of chestnut rose juice. Sample collection and preparation were the same as in the electronic tongue test. Preparation of the amino acid standard curve: 0.2 mL of the mixed amino acid standard was diluted with a buffer (pH 2.2) to a concentration of 5.0 nmol/50 μL. The automatic amino acid analyser went as follows: chromatographic column (4.6 mm ID × 60 mm), packing material (3 μm ion exchange resin), injection volume (0.05 mL), velocity of channel 1 (0.4 mL/min), velocity of channel 2 (0.35 mL/min); the analysis time of each sample was set to 60 min.

3.6. Nontargeted Metabolomics Analysis

An appropriate amount of chestnut rose juice was placed into the extraction solution (equal volume of methanol and acetonitrile, internal standard concentration: 2 mg/L, subjected to ultrasound for 10 min in ice-water bath) and incubated for 1 h at −20 °C. Then, the samples were centrifuged at 4 °C, and 12,000 rpm for 15 min. Then, 500 μL of supernatant was absorbed into an Eppendorf tube and subjected to vacuum drying. An extract solution (160 μL; equal volume of acetonitrile and water) was added and the mixture was vortexed for 30 s, subjected to ultrasound for 10 min in an ice-water bath, and centrifuged at 4 °C and 12,000 rpm for 15 min. Then, 120 μL of supernatant was placed into 2 mL sample bottles, and 10 μL of each sample was mixed into the QC samples for LC-QTOF detection.
The liquid mass system for untargeted metabolomics analysis comprised ultrahigh-performance liquid chromatography (Waters UPLC Acquity I-Class PLUS, Waters, Milford, MA, USA) and a high-resolution mass spectrometer (Waters UPLC Xevo G2-XS QTOF, Waters, Milford, MA, USA). The chromatographic column (Acquity UPLC HSS T3: 2.1 × 100 mm × 1.8 μm, Waters, Milford, MA, USA) [62] was loaded with 1 μL of the sample volume. The electron spray ionization (ESI) source configured by the mass spectrometer had both positive ion (+) (POS) and negative ion (−) (NEG) modes. The POS included mobile phase A (0.1% formic acid aqueous solution) and mobile phase B (0.1% formic acid acetonitrile). The NEG included mobile phase A (0.1% formic acid aqueous solution) and mobile phase B (0.1% formic acid acetonitrile). The conditions of the mobile phase in positive and negative ion modes were the same: the flow rate was always 400 μL/min; at 0 min and 0.25 min, 98% A solution and 2% B solution; 10 min and 13 min, 2% A solution and 98% B solution; 13.1 min and 15 min, 98% A solution and 2% B solution.
Primary and secondary mass spectrometry data were collected using the MSe mode controlled by the acquisition software of the high-resolution mass spectrometer (MassLynx V4.2, Waters, Milford, MA, USA). In each data acquisition cycle, dual-channel data acquisition was conducted for both low impact energy (2 V) and high impact energy intervals (10~40 V), with a scanning frequency of 0.2 s per mass spectrum. The ESI source parameters were as follows [62]: cone-hole voltage (30 V), ion source temperature (100 °C), desolvation temperature (500 °C), blowback gas flow (50 L/h), desolvation gas flow (800 L/h), and collection range of mass-to-charge ratio (50–1200 m/z). The capillary voltages of the POS and NEG were 2.5 kV and 2.0 kV, respectively.

3.7. Data Processing and Statistics

In nontargeted metabolomics analysis, original data collected by MassLynx V4.2 software were processed by Progenesis QI 2.1 software for peak extraction and peak alignment, and the metabolites were identified using Progenesis QI software, online BMKCloud, and METLIN databases. Flavour biosynthetic pathways were explored through Kyoto Encyclopedia of Genes and Genomes (KEGG) analysis, and theoretical fragment recognition was performed to normalize the total peak area of the data. The mass number deviation of the parent ion was within 100 ppm, and that of the fragment ion was within 50 ppm [62]. This means that the ratio of each metabolite in the total peak area of the sample is multiplied by the mean of all peak areas.
Univariate statistical analysis (t-test) and multivariate statistical analysis (including principal component analysis, PCA; fold change, FC; and orthogonal partial least square discriminant analysis, OPLS-DA) were performed through a metabolomic information analysis process using R-3.3.1 software for metabolite classification and functional annotation. PCA was used to investigate the variation between different groups and between samples within groups. After log2 conversion of data, an OPLS-DA model was constructed between comparative analysis groups, with 7-fold cross-validation. To ensure the reliability of the OPLS-DA model, a replacement test (200 times) was needed. The VIP (variable importance projection) values of metabolites were obtained by OPLS-DA, thus initially screening out differential metabolites. The differential metabolites were further filtered by the p value or fold change value (FC) of univariate analysis. The screening criteria were set to p value < 0.05, VIP value ≥ 1, and FC ≥ 1 or <0.5. The upregulation and downregulation of differential metabolites were determined based on the G-mean value.

4. Conclusions

This study analysed the changes in flavour substances in chestnut rose juice produced by fruits subjected to OFM feeding stress. The results indicated that OFM feeding altered the levels of nutrients and amino acids in chestnut rose fruit, and the release of secondary metabolites and plant hormones enhanced the bitterness of chestnut rose fruit to resist OFM feeding. Moreover, this study revealed for the first time the material basis for and metabolic pathway of flavour deterioration in chestnut rose fruit subjected to OFM feeding stress. These results provide a theoretical basis for the study of quality deterioration in other fruit products under pest stress and support the value of conducting further research on the planting, management, and processing of high-quality chestnut rose.

Supplementary Materials

The following supporting information can be downloaded at: https://www.mdpi.com/article/10.3390/molecules28207170/s1, Figure S1: Appearance of chestnut rose. (A) the normal chestnut rose fruit; (B) the worm chestnut rose fruit; Figure S2: PCA analysis of metabolites identified from ‘G’ and ‘B’.(A) Positive ion model; (B) Negative ion model; Figure S3: Permutation test of OPLS-DA.(A) Positive ion model; (B) Negative ion model; Figure S4: Enrichment factors of differential metabolites in positive and negative ion models.(The X-axis is the enrichment factor (Rich factor) of differential metabolites enriched in the pathway; The Y-axis is the P-value pathway; Dot size represents the number of differentially expressed metabolites annotated to this Pathway). (A) Positive ion model; (B) Negative ion model.

Author Contributions

T.R. and B.L. performed most of investigation, bioinformatic analysis, and writing of the original draft; F.X., Z.C. and M.L. provided some assistance in non-targeted metabolomics analysis and helped prepare all figures; T.R. also provided funding support, designed and supervised this study; S.T. helped design the study. All authors have read and agreed to the published version of the manuscript.

Funding

This work was financially supported by Key Laboratory of Environmental Pollution Monitoring and Disease Control (Guizhou Medical University), Ministry of Education (GMU-2022-HJZ-05), Industry and Information of Guizhou Province, Rosa Roxburghii Special Project No. [2020]307, Science and Technology Project of Forestry Bureau of Guizhou Province, No. [2020]11.

Institutional Review Board Statement

The study did not involve ethical experiments.

Informed Consent Statement

The study did not involve ethical experiments.

Data Availability Statement

The data are available from the corresponding author on reasonable request.

Conflicts of Interest

The authors declare no conflict of interest.

Sample Availability

Samples of the compounds are not available.

References

  1. Wang, Y.; Wang, J.; Cai, Z.; Huang, H.; Zhang, S.; Fu, L.; Zhao, P.; Yan, X.; Fu, Y. Improved physicochemical and functional properties of dietary fiber from Rosa roxburghii pomace fermented by bacillus natto. Food Biosci. 2022, 50, 102030. [Google Scholar] [CrossRef]
  2. Li, J.; Luo, Y.; Lu, M.; Wu, X.; An, H. The pathogen of top rot disease in Rosa roxburghii and its effective control fungicides. Horticulturae 2022, 8, 1036. [Google Scholar] [CrossRef]
  3. Lu, M.; Zhang, H.; An, H. Chloroplast dna-based genetic variation of Rosa roxburghii in southwest china: Phylogeography and conservation implications. Hortic. Plant J. 2021, 7, 286–294. [Google Scholar] [CrossRef]
  4. Chen, G.; Kan, J. Characterization of a novel polysaccharide isolated from Rosa roxburghii tratt fruit and assessment of its antioxidant in vitro and in vivo. Int. J. Biol. Macromol. 2018, 107, 166–174. [Google Scholar] [CrossRef] [PubMed]
  5. Wang, L.; Shen, C.; Li, C.; Chen, J. Physicochemical, functional and antioxidant properties of dietary fiber from Rosa roxburghii tratt fruit modified by physical, chemical and biological-enzyme treatments. J. Food Process. Preserv. 2020, 44, e14858. [Google Scholar] [CrossRef]
  6. Ayati, Z.; Amiri, M.S.; Ramezani, M.; Delshad, E.; Sahebkar, A.; Emami, S.A. Phytochemistry, traditional uses and pharmacological profile of rose hip: A review. Curr. Pharm. Design 2018, 24, 4101–4124. [Google Scholar] [CrossRef]
  7. Wei, W.; Fan, J.; Zhenhui, Y.; Ming, L.I. Effects of different fermentation methods on the quality of Rosa roxburghii wine. Food Sci. Technol. 2020, 45, 105–113. [Google Scholar] [CrossRef]
  8. Marko, B.; Sonja, B.; Andreas, S.; Annick, S. Jasmonate-dependent induction of polyphenol oxidase activity in tomato foliage is important for defense against spodoptera exigua but not against manduca sexta. BMC Plant Biol. 2014, 14, 257. [Google Scholar] [CrossRef]
  9. Mitra, S.; Mobarak, S.H.; Karmakar, A.; Barik, A. Activities of antioxidant enzymes in three species of Ludwigia weeds on feeding by Altica cyanea. J. King Saud Univ.—Sci. 2019, 31, 1522–1527. [Google Scholar] [CrossRef]
  10. Ming, L.C.; Supannee, P.; Wanida, A.; Shigeru, M.; Yooichi, K. Oviposition preferences of the oriental fruit moth Grapholita molesta (Lepidoptera: Tortricidae) to pear hipvs. Arthropod-Plant Interact. 2022, 16, 517–523. [Google Scholar] [CrossRef]
  11. Huang, W.; Li, X.; Han, L.; Liu, X.; An, H.; Wu, X. Research progress on occurrence and control of diseases and pests of Rosa roxburghii. China Plant Prot. 2020, 40, 24–30. [Google Scholar] [CrossRef]
  12. Jiaohong, L.; Zhenxiang, G.; Yue, L.; Xiaomao, W.; Huaming, A. Chitosan can induce Rosa roxburghii tratt. against Sphaerotheca sp. and enhance its resistance, photosynthesis, yield, and quality. Horticulturae 2021, 7, 289. [Google Scholar] [CrossRef]
  13. Akiyuki, T.; Kengo, N.; Tsukasa, K.; Zhongming, M.; Osamu, N.; Kevin, F.J. Taste transduction and channel synapses in taste buds. Pflug. Arch. Eur. J. Physiol. 2021, 473, 3–13. [Google Scholar] [CrossRef]
  14. Bloxham, C.J.; Foster, S.R.; Thomas, W.G. A bitter taste in your heart. Front. Physiol. 2020, 11, 431. [Google Scholar] [CrossRef]
  15. Chaudhari, N.; Roper, S.D. The cell biology of taste. J. Cell Biol. 2010, 190, 285–296. [Google Scholar] [CrossRef] [PubMed]
  16. Kinnamon, S.C.; Finger, T.E. Recent advances in taste transduction and signaling. F1000Research 2019, 8, F1000–F2117. [Google Scholar] [CrossRef]
  17. Kant, M.R.; Jonckheere, W.; Knegt, B.; Lemos, F.; Liu, J.; Schimmel, B.C.J.; Villarroel, C.A.; Ataide, L.M.S.; Dermauw, W.; Glas, J.J.; et al. Mechanisms and ecological consequences of plant defence induction and suppression in herbivore communities. Ann. Bot. 2015, 115, 1015–1051. [Google Scholar] [CrossRef]
  18. Jiao, D.-Z.; Zhao, Z.-L. Research progress on influences of saline-alkali stress on plant morphology, physiology and biochemisttry and response of plants to saline-alkali stress. Jiangsu Agric. Sci. 2019, 47, 1–4. [Google Scholar] [CrossRef]
  19. Yokoi, S.; Bressan, R.A.; Hasegawa, P.M. Salt stress tolerance of plants. In JIRCAS Working Report; Japan International Research Center for Agricultural Sciences: Tsukuba, Japan, 2002; pp. 25–33. Available online: https://www.researchgate.net/publication/225040559 (accessed on 6 January 2023).
  20. Staley, J.T.; Stewart-Jones, A.; Pope, T.W.; Wright, D.J.; Leather, S.R.; Hadley, P.; Rossiter, J.T.; Emden, H.; Poppy, G.M. Varying responses of insect herbivores to altered plant chemistry under organic and conventional treatments. Proc. R. Soc. B Biol. Sci. 2009, 1682, 779–786. [Google Scholar] [CrossRef]
  21. Bo, L. Study on the chilling requirment and some physiological and biochemiscal changes of tree peony during dormancy release. Master’s Thesis, Shandong Agricultural University, Taian, China, 2004. [Google Scholar]
  22. Pedrol, N.; Ramos, P.; Reigosa, M.J. Phenotypic plasticity and acclimation to water deficits in velvet-grass: A long-term greenhouse experiment. Changes in leaf morphology, photosynthesis and stress-induced metabolites. J. Plant Physiol. 2000, 157, 383–393. [Google Scholar] [CrossRef]
  23. Howe, G.A.; Koo, A.J.; Major, I.T. Modularity in jasmonate signaling for multistress resilience. Annu. Rev. Plant Biol. 2018, 69, 387–415. [Google Scholar] [CrossRef]
  24. Liechti, R.; Farmer, E.E. The jasmonate pathway. Science 2002, 296, 1649–1650. [Google Scholar] [CrossRef] [PubMed]
  25. Zhou, Y.; Zeng, L.; Hou, X.; Liao, Y.; Yang, Z. Low temperature synergistically promotes wounding-induced indole accumulation by inducer of cbf expression-mediated alterations of jasmonic acid signaling in Camellia sinensis. J. Exp. Bot. 2020, 71, 2172–2185. [Google Scholar] [CrossRef] [PubMed]
  26. Huang, W.; Siemann, E.; Xiao, L.; Yang, X.; Ding, J. Species-specific defence responses facilitate conspecifics and inhibit heterospecifics in above-belowground herbivore interactions. Nat. Commun. 2014, 5, 4851. [Google Scholar] [CrossRef] [PubMed]
  27. Qin, Q.-J.; Gao, X.-W. Plant defense responses induced by insect herbivory. Acta Entomol. Sin. 2005, 58, 125–134. [Google Scholar] [CrossRef]
  28. Asakawa, Y.; Kenmoku, H. Dietary diterpenoids. In Handbook of Dietary Phytochemicals; Xiao, J., Sarker, S.D., Asakawa, Y., Eds.; Springer: Singapore, 2021; pp. 733–927. [Google Scholar]
  29. Sibel, K. Bioavailability of phenolic compounds. Crit. Rev. Food Sci. Nutr. 2004, 44, 453–464. [Google Scholar] [CrossRef]
  30. Luo, Y.; Kong, L.; Xue, R.; Wang, W.; Xia, X. Bitterness in alcoholic beverages: The profiles of perception, constituents, and contributors. Trends Food Sci. Technol. 2020, 96, 222–232. [Google Scholar] [CrossRef]
  31. Sonntag, T.; Kunert, C.; Dunkel, A.; Hofmann, T. Sensory-guided identification of n-(1-methyl-4-oxoimidazolidin-2-ylidene)-α-amino acids as contributors to the thick-sour and mouth-drying orosensation of stewed beef juice. J. Agric. Food Chem. 2010, 58, 6341–6350. [Google Scholar] [CrossRef]
  32. Zhou, C.; Le, Y.; Zheng, Y.; Wang, J.; Li, G.; Bai, Y.; Li, C.; Xu, X.; Zhou, G.; Cao, J. Characterizing the effect of free amino acids and volatile compounds on excessive bitterness and sourness in defective dry-cured ham. LWT 2020, 123, 109071. [Google Scholar] [CrossRef]
  33. Yu, H.; Li, Q.; Xie, J.; Chen, C.; Lou, X.; Ai, L.; Tian, H. Characterization of bitter compounds in Shaoxing Huangjiu by quantitative measurements, taste recombination, and omission experiments. J. Agric. Food Chem. 2022, 70, 12907–12915. [Google Scholar] [CrossRef]
  34. Chen, Q.; Liang, X.; Wu, T.; Jiang, J.; Jiang, Y.; Zhang, S.; Ruan, Y.; Zhang, H.; Zhang, C.; Chen, P.; et al. Integrative analysis of metabolomics and proteomics reveals amino acid metabolism disorder in sepsis. J. Transl. Med. 2022, 20, 123. [Google Scholar] [CrossRef]
  35. Suh, J.H.; Madden, R.T.; Sung, J.; Chambers, A.H.; Crane, J.; Wang, Y. Pathway-based metabolomics analysis reveals biosynthesis of key flavor compounds in mango. J. Agric. Food Chem. 2022, 70, 10389–10399. [Google Scholar] [CrossRef] [PubMed]
  36. Sugiyama, A.; Yamazaki, Y.; Hamamoto, S.; Takase, H.; Yazaki, K. Synthesis and secretion of isoflavones by field-grown soybean. Plant Cell Physiol. 2017, 58, 1594–1600. [Google Scholar] [CrossRef]
  37. Hamamouch, N.; Winkel, B.S.J.; Li, C.; Davis, E.L. Modulation of arabidopsis flavonol biosynthesis genes by cyst and root-knot nematodes. Plants 2020, 9, 253. [Google Scholar] [CrossRef] [PubMed]
  38. Torregrosa, C.; Cluzet, S.; Fournier, J.L.; Huguet, T.; Gamas, P.; Prospéri, J.; Esquerré-Tugayé, M.; Dumas, B.; Jacquet, C. Cytological, genetic, and molecular analysis to characterize compatible and incompatible interactions between Medicago truncatula and Colletotrichum trifolii. Mol. Plant-Microbe Interact. 2004, 17, 909–920. [Google Scholar] [CrossRef]
  39. Almaguer, C.; Schönberger, C.; Gastl, M.; Arendt, E.K.; Becker, T. Humulus lupulus—A story that begs to be told. A review. J. Inst. Brew. 2014, 120, 289–314. [Google Scholar] [CrossRef]
  40. Vicente De Andrade Silva, G.; Demaman Arend, G.; Antonio Ferreira Zielinski, A.; Di Luccio, M.; Ambrosi, A. Xanthohumol properties and strategies for extraction from hops and brewery residues: A review. Food Chem. 2023, 404, 134629. [Google Scholar] [CrossRef]
  41. Dresel, M.; Dunkel, A.; Hofmann, T. Sensomics analysis of key bitter compounds in the hard resin of hops (Humulus lupulus L.) and their contribution to the bitter profile of pilsner-type beer. J. Agric. Food Chem. 2015, 63, 3402–3418. [Google Scholar] [CrossRef] [PubMed]
  42. Ndebele, K.; Graham, B.; Tchounwou, P. Estrogenic activity and molecular mechanisms of coumestrol-induced biological effects. In Isoflavones: Chemistry, Analysis, Function and Effects; The Royal Society of Chemistry: London, UK, 2012; pp. 518–528. [Google Scholar] [CrossRef]
  43. Boulebd, H. Computational analysis of peroxyl radical scavenging capacity of coumestrol: Insights into kinetics and reaction mechanisms. J. Phys. Org. Chem. 2022, 35, e4421. [Google Scholar] [CrossRef]
  44. Liu, S.P.; Zhang, L.; Mao, J.; Ding, Z.Y.; Shi, G.Y. Metabolic engineering of Escherichia coli for the production of phenylpyruvate derivatives. Metab. Eng. 2015, 32, 55–65. [Google Scholar] [CrossRef]
  45. Tzin, V.; Galili, G. New insights into the shikimate and aromatic amino acids biosynthesis pathways in plants. Mol. Plant 2010, 3, 956–972. [Google Scholar] [CrossRef]
  46. Halkier, B.A.; Gershenzon, J. Biology and biochemistry of glucosinolates. Annu. Rev. Plant Biol. 2006, 57, 303–333. [Google Scholar] [CrossRef] [PubMed]
  47. Schenck, C.A.; Maeda, H.A. Tyrosine biosynthesis, metabolism, and catabolism in plants. Phytochemistry 2018, 149, 82–102. [Google Scholar] [CrossRef] [PubMed]
  48. Hosokawa, S.; Shukuya, K.; Sogabe, K.; Ejima, Y.; Tokuhara, Y. Novel absorbance peak of gentisic acid following the oxidation reaction. PLoS ONE 2020, 15, e232263. [Google Scholar] [CrossRef] [PubMed]
  49. Poulami, G.; De, B. Influence of calcium channel modulators on the production of serotonin, gentisic acid, and a few other biosynthetically related phenolic metabolites in seedling leaves of salt tolerant rice variety nonabokra. Plant Signal. Behav. 2021, 16, 1929732. [Google Scholar] [CrossRef]
  50. Vannelli, T.; Qi, W.W.; Sweigard, J.; Gatenby, A.A.; Sariaslani, F.S. Production of p-hydroxycinnamic acid from glucose in Saccharomyces cerevisiae and Escherichia coli by expression of heterologous genes from plants and fungi. Metab. Eng. 2007, 9, 142–151. [Google Scholar] [CrossRef]
  51. Chen, Y.; Wang, P.-C.; Zhang, S.-S.; Yang, J.; Li, G.-C.; Huang, L.-Q.; Wang, C.-Z. Functional analysis of a bitter gustatory receptor highly expressed in the larval maxillary galea of Helicoverpa armigera. PLoS Genet. 2022, 18, e1010455. [Google Scholar] [CrossRef] [PubMed]
  52. Ferrer, J.L.; Austin, M.B.; Stewart, C.; Noel, J.P. Structure and function of enzymes involved in the biosynthesis of phenylpropanoids. Plant Physiol. Biochem. 2008, 46, 356–370. [Google Scholar] [CrossRef]
  53. Asakawa, Y.; Kenmoku, H. Dietary diterpenoids. In Handbook of Dietary Phytochemicals; Xiao, J., Sarker, S.D., Asakawa, Y., Eds.; Springer: Singapore, 2020; pp. 1–195. [Google Scholar]
  54. MAlfieri, M.; Ambrosone, A.; Vaccaro, M.; De Tommasi, N.; Leone, A. Overcoming metabolic constraints in the mep-pathway enrich Salvia sclarea hairy roots in therapeutic abietane diterpenes. Appl. Sci. 2022, 12, 7116. [Google Scholar] [CrossRef]
  55. Yamaguchi, S. Gibberellin metabolism and its regulation. Annu. Rev. Plant Biol. 2008, 59, 225–251. [Google Scholar] [CrossRef]
  56. Tanaka, N.; Matsuoka, M.; Kitano, H.; Asano, T.; Kaku, H.; Komatsu, S. Gid1, a gibberellin-insensitive dwarf mutant, shows altered regulation of probenazole-inducible protein (pbz1) in response to cold stress and pathogen attack. Plant Cell Environ. 2006, 29, 619–631. [Google Scholar] [CrossRef] [PubMed]
  57. Wei, Z.-H.; Su, A.-Q.; Wang, Y.-G.; Geng, G. Effects of foliar spraying gibberellin and brassicin on physiological characteristics of sugar beet. J. Eng. Heilongjiang Univ. 2022, 13, 91–96. [Google Scholar] [CrossRef]
  58. Li, J. Determination of reduced vitamin c by key blue colorimetry. Food Sci. 2000, 21, 42–45. [Google Scholar]
  59. Wu, Y.; Guo, Y. Determination of tannin in cotton plant. Chin. J. Appl. Ecol. 2000, 11, 243–245. [Google Scholar] [CrossRef]
  60. Li, J.; Ni, J.-Y.; Li, H.-F.; Xu, G.-F.; Wang, X.-D.; Wu, Y.-L.; Wang, Z.-X. On determination conditions for total polyphenols in fruits and its derived products by folin-phenol methods. J. Fruit Sci. 2008, 25, 126–131. [Google Scholar]
  61. Zhang, L.-P.; Zhou, L.; Guan, B.-F.; Wang, F.-Y.; Liu, H.-W.; Gao, H.-L.; Jia, Y.; Luo, B.-B.; Li, P.-C. Ultrasound-assisted extraction process of total flavonoids from persimmon leaves. Food Res. Dev. 2018, 39, 87–91. [Google Scholar] [CrossRef]
  62. Wang, J.; Zhang, T.; Shen, X.; Liu, J.; Zhao, D.; Sun, Y.; Wang, L.; Liu, Y.; Gong, X.; Liu, Y.; et al. Serum metabolomics for early diagnosis of esophageal squamous cell carcinoma by uhplc-qtof/ms. Metabolomics 2016, 12, 116. [Google Scholar] [CrossRef]
Figure 1. Radar chart of electronic tongue taste measurements of chestnut rose juice.
Molecules 28 07170 g001
Figure 2. Comparison of the amino acid content of chestnut rose juice. ‘*’ represents essential amino acids.
Molecules 28 07170 g002
Figure 3. OPLS_DA analyse. The x_axis (t1) represents the prediction component (inter_group difference component), the y_axis (t2) represents the orthogonal component (intra_group difference component), and the transverse y_axis percentage represents the proportion of this component in the total variance. (A) Positive ion model; (B) Negative ion model.
Molecules 28 07170 g003
Figure 4. (A,B) Differentially accumulating metabolites between ‘G’ and ‘B’. A total of 426 metabolites were identified on the volcanic plot. (C,D) Cluster analysis of metabolites from samples of ‘G’ and ‘B’. The colour indicates the level of accumulation of each metabolite, from low (green) to high (orange). (C) Positive ion model; (B,D) Negative ion model.
Molecules 28 07170 g004
Figure 5. Classification of different metabolite pathways in each group. (A) Positive ion model; (B) Negative ion model.
Molecules 28 07170 g005
Table 1. Basic indexes of chestnut rose fruit and bioactive components of its juice.
IndexGB
Weight (g)20.34 ± 4.37 a21.88 ± 4.05 a
Transverse and longitudinal ratio1.37 ± 0.13 a1.30 ± 0.12 b
Total color difference52.40 ± 2.20 a52.55 ± 1.77 a
Juice yield (%)67.19 ± 1.05 a55.36 ± 5.95 b
Bad fruit rate (%)27.68 ± 1.27
Soluble solid (%)9.39 ± 0.06 b11.07 ± 0.06 a
SOD (U/mL)118.41 ± 1.04 a117.23 ± 0.51 a
Protein concentration (mg/mL)20.64 ± 0.52 b22.81 ± 1.24 a
Vitamin C (mg/100 g)2038.93 ± 134.36 a1971.22 ± 139.85 a
Tannin (mg/mL)4.47 ± 0.12 a4.12 ± 0.21 a
Consented tannin (mg/mL)36.62 ± 0.87 a28.35 ± 5.64 a
Polyphenol (mg/mL)1.91 ± 0.12 a1.93 ± 0.02 a
Flavone (mg/mL)25.15 ± 0.97 a17.93 ± 0.68 b
Note: Significant level p < 0.05. When there is significance between groups, the large number is marked with “a” and the small number is marked with “b”.
Table 2. Potential bitter metabolites screened out by untargeted metabolomics.
PathwayMetaboliteFormulapVIPFold
Change
Regulated
Phenylalanine metabolismPhenylacetyl-CoAMolecules 28 07170 i001
C29H42N7O17P3S
0.0031.0391.572Up
2-HydroxyphenylacetateMolecules 28 07170 i002
C8H8O3
0.0051.0251.462Up
Tryptophan metabolism5-HydroxyindoleacetateMolecules 28 07170 i003
C10H9NO3
0.0041.0191.626Up
Formyl-5-hydroxykynurenamineMolecules 28 07170 i004
C10H12N2O3
0.0061.0201.245Up
L-FormylkynurenineMolecules 28 07170 i005
C11H12N2O4
0.0011.0241.199Up
3-Hydroxyanthranilic acidMolecules 28 07170 i006
C7H7NO3
0.0121.0211.227Up
5-HydroxykynurenamineMolecules 28 07170 i007C9H12N2O2
0.0000021.0520.460Down
2-Aminophenoxazin-3-oneMolecules 28 07170 i008
C12H8N2O2
0.0121.0021.392Up
3-HydroxykynurenamineMolecules 28 07170 i009
C9H12N2O2
0.00051.0452.288Up
Tyrosine metabolismGentisic acidMolecules 28 07170 i010
C7H6O4
0.0021.0191.169Up
5-(L-Alanin-3-yl)-2-hydroxy-cis,cis-muconate 6-semialdehydeMolecules 28 07170 i011
C9H11NO6
0.0011.0421.118Up
Gentisate aldehydeMolecules 28 07170 i012
C7H6O3
0.0161.0141.084Up
AcetoacetateMolecules 28 07170 i013
C4H6O3
0.0011.0261.446Up
HydroquinoneMolecules 28 07170 i014
C6H6O2
0.0071.0111.449Up
4-CoumarateMolecules 28 07170 i015
C9H8O3
0.0000041.0521.780Up
Histidine metabolismN-Formimino-L-glutamateMolecules 28 07170 i016
C6H10N2O4
0.0021.0311.352Up
L-Histidinol phosphateMolecules 28 07170 i017
C6H12N3O4P
0.0111.0061.820Up
DihydrourocanateMolecules 28 07170 i018
C6H8N2O2
0.0051.0171.163Up
Hydantoin-5-propionateMolecules 28 07170 i019
C6H8N2O4
0.00031.0381.357Up
D-erythro-1-(Imidazol-4-yl)glycerol 3-phosphateMolecules 28 07170 i020
C6H11N2O6P
0.0011.0463.296Up
Phenylalanine, tyrosine, and tryptophan biosynthesisQuinateMolecules 28 07170 i021
C7H12O6
0.0131.0230.440Down
Valine, leucine, and isoleucine degradation2-Methyl-1-hydroxypropyl-ThPPMolecules 28 07170 i022
C16H27N4O8P2S+
0.0061.0331.450Up
(S)-3-Methyl-2-oxopentanoic acidMolecules 28 07170 i023
C6H10O3
0.0061.0361.225Up
Diterpenoid biosynthesisGibberellin A36Molecules 28 07170 i024
C20H26O6
0.00041.0481.199Up
Gibberellin A8Molecules 28 07170 i025
C19H24O7
0.0011.0251.404Up
ent-Copalyl diphosphateMolecules 28 07170 i026
C20H36O7P2
0.0021.0351.265Up
Gibberellin A53Molecules 28 07170 i027
C20H28O5
0.000061.0511.643Up
Gibberellin A29-cataboliteMolecules 28 07170 i028
C19H22O6
0.0171.0121.433Up
Geranylgeranyl diphosphateMolecules 28 07170 i029
C20H36O7P2
0.005 1.0121.242Up
Sesquiterpenoid and triterpenoid biosynthesis(−)-Germacrene DMolecules 28 07170 i030
C15H24
0.0011.0502.007Up
Terpenoid backbone biosynthesisall-trans-Hexaprenyl diphosphateMolecules 28 07170 i031
C30H52O7P2
0.0021.0162.209Up
4-(Cytidine 5′-diphospho)-2-C-methyl-D-erythritolMolecules 28 07170 i032
C14H25N3O14P2
0.0061.0100.377Down
Pyrimidine metabolismdCMPMolecules 28 07170 i033
C9H14N3O7P
0.0131.0191.184Up
PseudouridineMolecules 28 07170 i034
C9H12N2O6
0.0131.0081.166Up
3-HydroxypropanoateMolecules 28 07170 i035
C3H6O3
0.00031.0431.312Up
CytidineMolecules 28 07170 i036
C9H13N3O5
0.0091.0151.175Up
Phenylpropanoid biosynthesisCaffeyl alcoholMolecules 28 07170 i037
C9H10O3
0.0141.0191.462Up
1-O-Sinapoyl-beta-D-glucoseMolecules 28 07170 i038
C17H22O10
0.0011.0451.331Up
5-HydroxyconiferaldehydeMolecules 28 07170 i039
C10H10O4
0.0041.0661.252Up
Coniferyl aldehydeMolecules 28 07170 i040
C10H10O3
0.0031.0261.249Up
Caffeine metabolism7-MethylxanthineMolecules 28 07170 i041
C6H6N4O2
0.0071.0081.548Up
N,N’-DimethylureaMolecules 28 07170 i042
C3H8N2O
0.0061.0291.487Up
1-Methyluric acidMolecules 28 07170 i043
C6H6N4O3
0.0011.0311.530Up
5-Acetylamino-6-formylamino-3-methyluracilMolecules 28 07170 i044
C8H10N4O4
0.0041.0432.943Up
7-MethylxanthosineMolecules 28 07170 i045
C11H15N4O6
0.00041.0383.267Up
Flavone and flavonol biosynthesisQuercetin 3-sulfateMolecules 28 07170 i046
C15H10O10S
0.0041.0660.466Down
Lampranthin IIMolecules 28 07170 i047
C34H34N2O16
0.0031.0490.426Down
Flavonoid biosynthesisXanthohumolMolecules 28 07170 i048
C21H22O5
0.00051.0441.336Up
PseudobaptigeninMolecules 28 07170 i049
C16H10O5
0.0071.0311.512Up
CoumestrolMolecules 28 07170 i050
C15H8O5
0.000071.0531.193Up
ButinMolecules 28 07170 i051
C15H12O5
0.0041.0041.143Up
LiquiritigeninMolecules 28 07170 i052
C15H12O4
0.0061.0041.282Up
(+)-GallocatechinMolecules 28 07170 i053
C15H14O7
0.0041.0021.195Up
DihydromyricetinMolecules 28 07170 i054
C15H12O8
0.0031.0231.969Up
SakuranetinMolecules 28 07170 i055
C16H14O5
0.000071.0462.763Up
Note: The difference-accumulating compounds were identified by t-test, p < 0.05 (significant), FC ≥ 1 (up-regulated), FC < 0.5 (down-regulated), VIP ≥ 1.
Disclaimer/Publisher’s Note: The statements, opinions and data contained in all publications are solely those of the individual author(s) and contributor(s) and not of MDPI and/or the editor(s). MDPI and/or the editor(s) disclaim responsibility for any injury to people or property resulting from any ideas, methods, instructions or products referred to in the content.

