
Photochemical Implications of Changes in the Spectral Properties of Chromophoric Dissolved Organic Matter: A Model Assessment for Surface Waters

Dipartimento di Chimica, Università di Torino, Via Pietro Giuria 5, 10125 Torino, Italy
*
Author to whom correspondence should be addressed.
Molecules 2023, 28(6), 2664; https://doi.org/10.3390/molecules28062664
Submission received: 16 February 2023
/
Revised: 8 March 2023
/
Accepted: 9 March 2023
/
Published: 15 March 2023
(This article belongs to the Special Issue Current Advances in Photochemistry)
Abstract
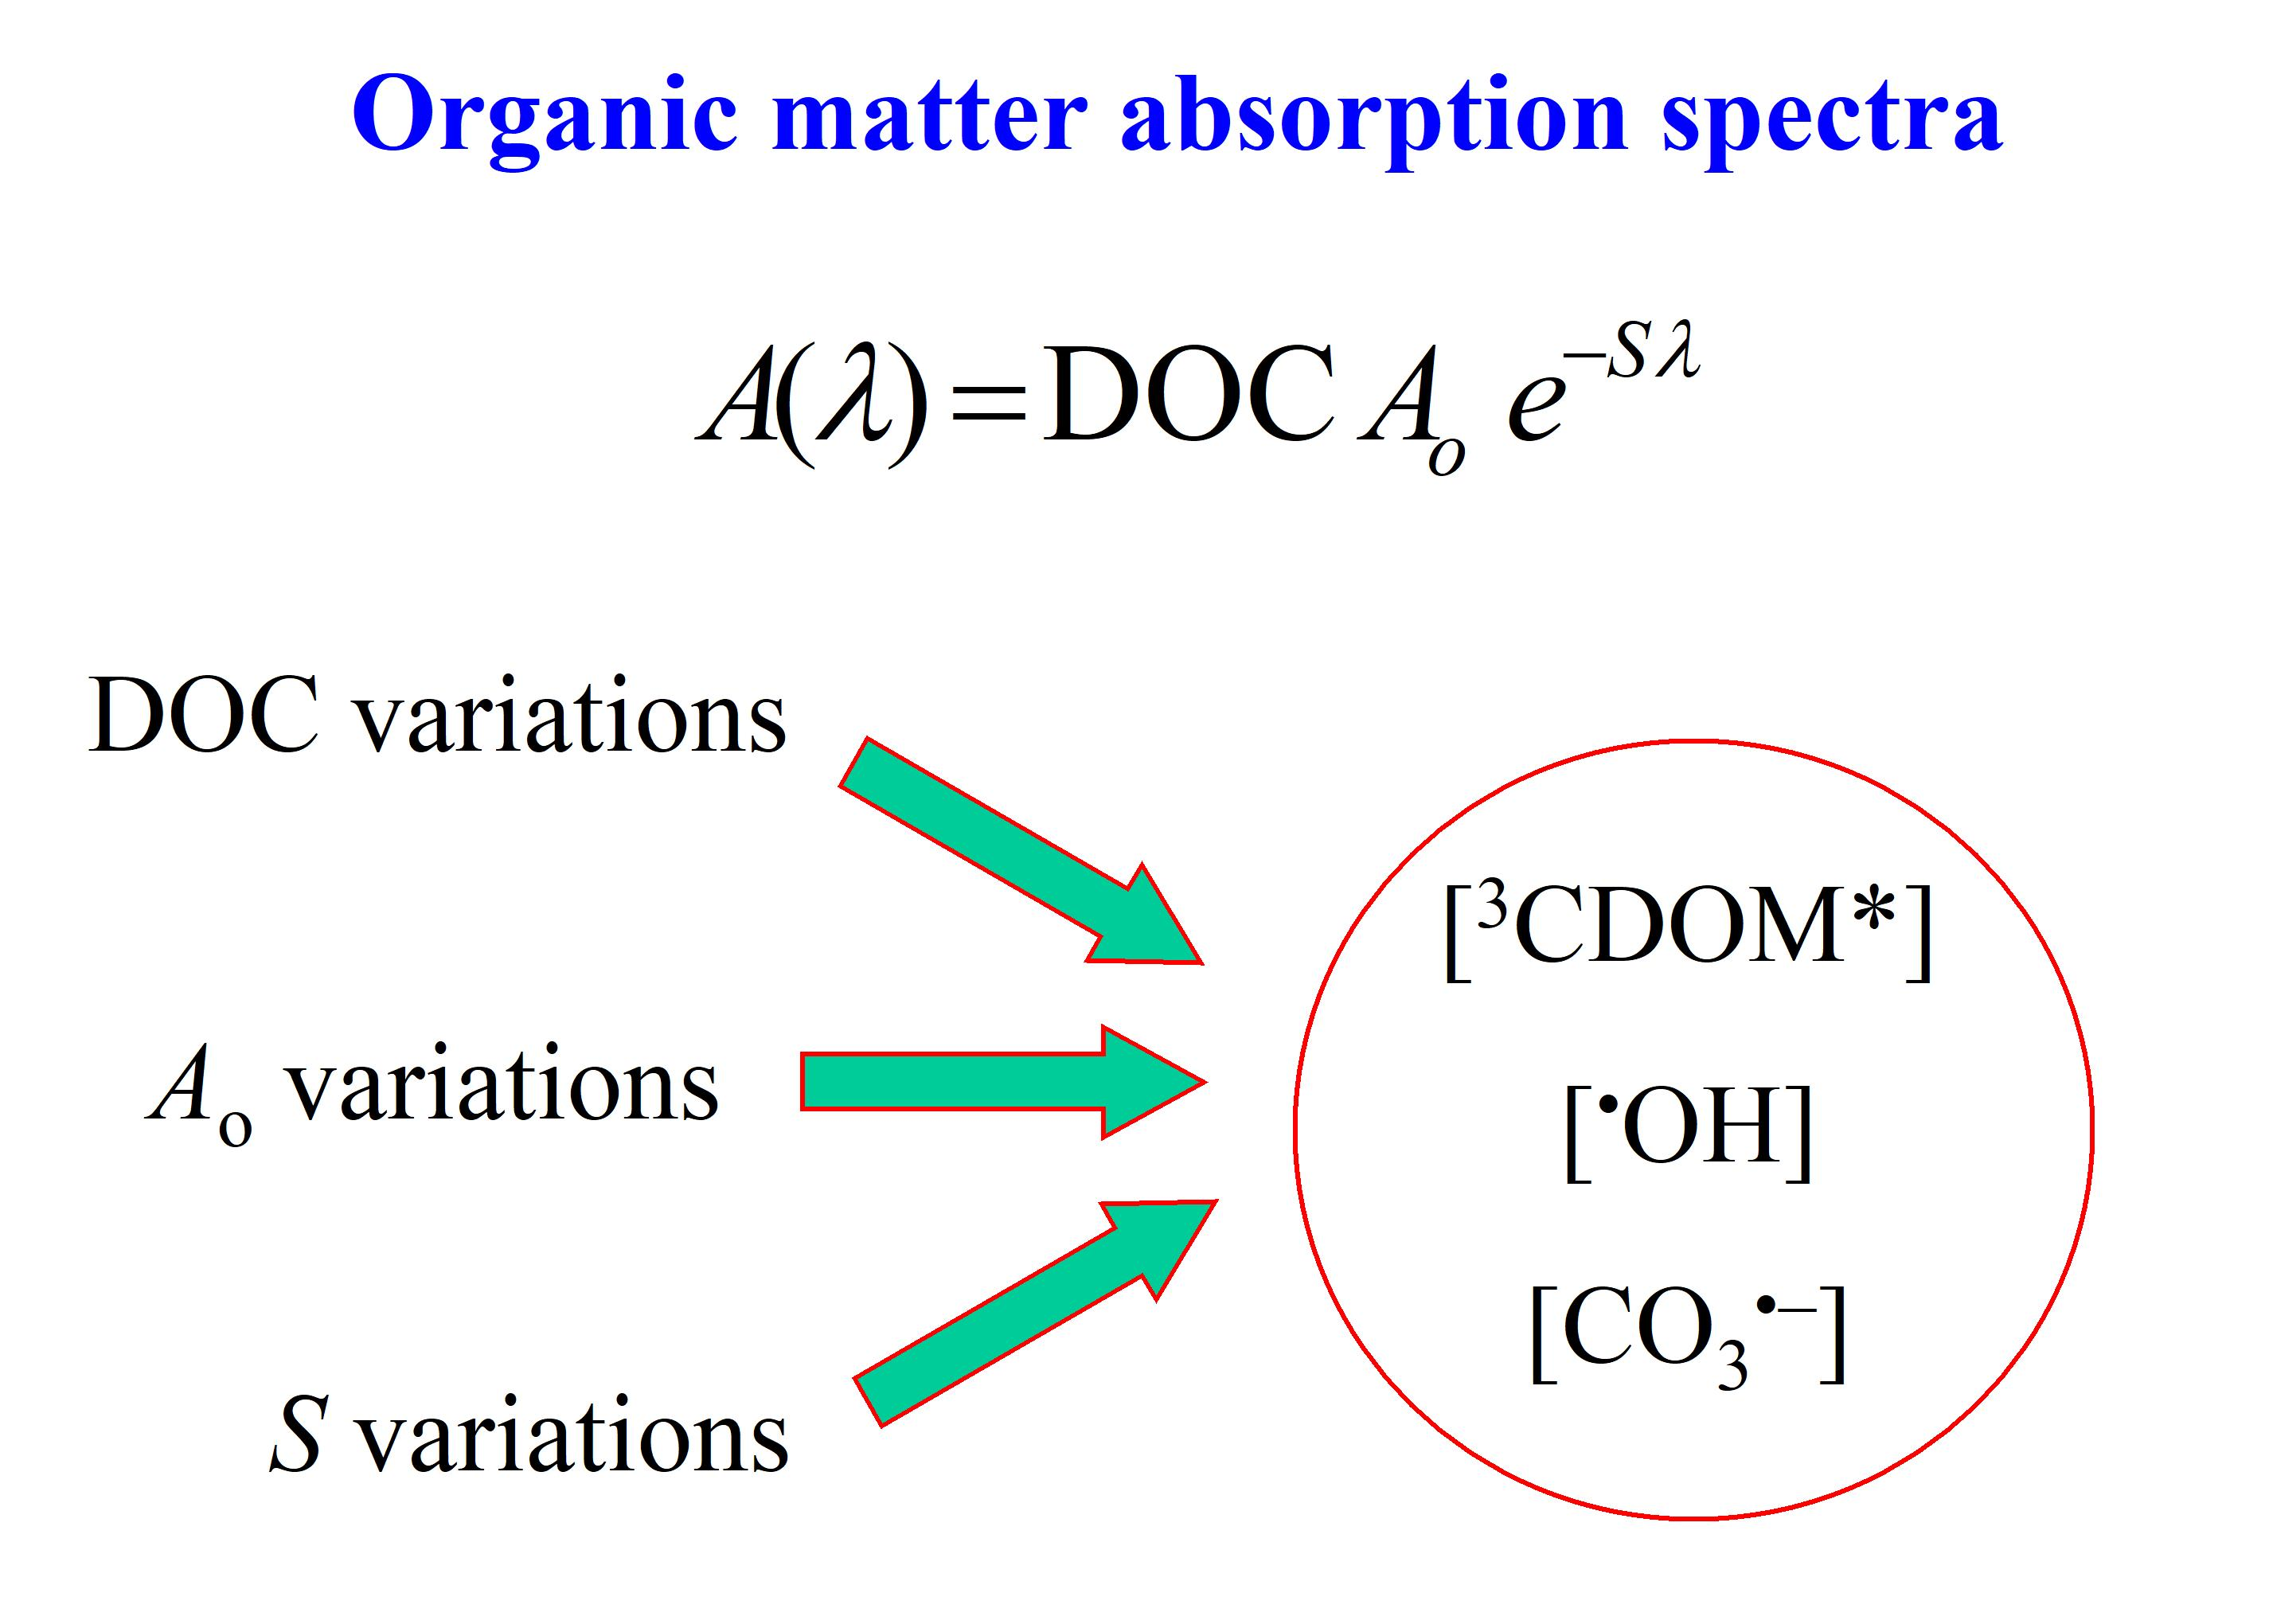
:Chromophoric dissolved organic matter (CDOM) is the main sunlight absorber in surface waters and a very important photosensitiser towards the generation of photochemically produced reactive intermediates (PPRIs), which take part in pollutant degradation. The absorption spectrum of CDOM (ACDOM(λ), unitless) can be described by an exponential function that decays with increasing wavelength: ACDOM(λ) = 100 d DOC Ao e− S λ, where d [m] is water depth, DOC [mgC L−1] is dissolved organic carbon, Ao [L mgC−1 cm−1] is a pre-exponential factor, and S [nm−1] is the spectral slope. Sunlight absorption by CDOM is higher when Ao and DOC are higher and S is lower, and vice versa. By the use of models, here we investigate the impact of changes in CDOM spectral parameters (Ao and S) on the steady-state concentrations of three PPRIs: the hydroxyl radical (•OH), the carbonate radical (CO3•−), and CDOM excited triplet states (3CDOM*). A first finding is that variations in both Ao and S have impacts comparable to DOC variations on the photochemistry of CDOM, when reasonable parameter values are considered. Therefore, natural variability of the spectral parameters or their modifications cannot be neglected. In the natural environment, spectral parameters could, for instance, change because of photobleaching (prolonged exposure of CDOM to sunlight, which decreases Ao and increases S) or of the complex and still poorly predictable effects of climate change. A second finding is that, while the steady-state [3CDOM*] would increase with increasing ACDOM (increasing Ao, decreasing S), the effect of spectral parameters on [•OH] and [CO3•−] depends on the relative roles of CDOM vs. NO3− and NO2− as photochemical •OH sources.

1. Introduction
Photoinduced processes play a very important role in the degradation of biorecalcitrant contaminants in sunlit surface freshwaters [1,2,3,4]. Many contaminants of emerging concern (CECs), including several pharmaceuticals and personal care products (PPCPs), are able to survive conventional wastewater treatment due to a combination of biorecalcitrance, which slows down or prevents biodegradation by activated sludge, and water solubility, which hampers an additional pathway of elimination from the aqueous phase (partitioning on biosolids) [5,6,7,8]. These features are also an obstacle to the biological attenuation of the same CECs in natural water bodies. In these cases, photochemistry can play a key role in natural decontamination [1,2,9,10].
Photochemical reactions are usually divided into direct photolysis and indirect photochemistry. In the case of direct photolysis, pollutants absorb sunlight (i.e., radiation with λ > 280–290 nm), and the absorption process triggers transformation by ionisation, bond-breaking, or excited-state reactivity. In the case of indirect photochemistry, sunlight is absorbed by natural compounds called photosensitisers (most notably, nitrate, nitrite, and chromophoric dissolved organic matter, CDOM) that produce reactive transient species (photochemically produced reactive intermediates, or PPRIs). CECs degradation by indirect photochemistry takes place upon reaction with PPRIs, the main ones being the hydroxyl (•OH) and carbonate (CO3•−) radicals, the excited triplet states of CDOM (3CDOM*), and singlet oxygen (1O2) [11,12].
Irradiated nitrate and nitrite yield •OH, which can, in turn, produce CO3•− by oxidising HCO3− and CO32−. A secondary pathway to CO3•− is the oxidation of CO32− by 3CDOM*. The irradiation of CDOM yields all the PPRIs; namely, 3CDOM*, 1O2, •OH, and (indirectly, through •OH and 3CDOM*) CO3•−. PPRIs are involved in pollutant degradation, but most PPRI removal from natural waters is usually accounted for by other processes not involving the contaminants. In fact, •OH is mainly scavenged by DOM (dissolved organic matter, not necessarily chromophoric) and, usually to a lesser extent, by inorganic carbon (HCO3− and CO32−). CO3•− is also mainly scavenged by DOM, while 3CDOM* in aerated waters is mostly quenched by O2 to produce 1O2 with ~50% yield. Finally, 1O2 is quenched by collision with the water solvent [1,13,14,15].
CDOM is the main sunlight absorber in natural waters, at least below 500 nm, which is the most important spectral range from a photochemical point of view [16]. For the same reason, CDOM is a very important photosensitiser [17,18]. The absorption spectrum of natural waters in general, and of CDOM in particular, can be described by an exponential function [19] that decreases with increasing wavelength λ [nm], as follows:
here, A(λ) refers to an optical path length of 1 cm and has units of [cm−1]. Therefore, the absorbance of a water column of depth d [m] is given by Ad(λ) = 100 d DOC Ao e−S λ, where 100 is the conversion factor between [m] and [cm]. Furthermore, DOC [mgC L−1] is the dissolved organic carbon, Ao is the pre-exponential factor of the absorbance [units of L mgC−1 cm−1, the same as A1(λ), which is the absorbance per unit depth and DOC], and S [nm−1] is the spectral slope. As shown in Equation (1), the absorbance of CDOM at unit depth depends both on the total amount of organic matter (quantified as the DOC value) and on its spectral features (Ao and S). All these parameters can vary depending on environmental conditions and processes, including climate change. For instance, increased precipitation in the Scandinavian peninsula has enhanced the leaching of organic matter from soil and its transport to surface waters. At the same time, gradual recovery from acidification has progressively increased the pH of rainwater, thereby increasing the leaching efficiency of humic and fulvic acids, the ionised fractions of which are more soluble in water [20]. The resulting effect is the phenomenon of water browning [21,22,23,24] as surface waters become richer in (C)DOM. Browning has a considerable impact on the way water absorbs sunlight. Moreover, photochemical processes triggered by 3CDOM* and 1O2 (which are generated by irradiated CDOM) are enhanced in brownified waters at the expense of •OH, CO3•−, and direct photolysis [25]. In fact, increasing DOC enhances scavenging of •OH and CO3•−, while direct photolysis is inhibited as CDOM absorbs sunlight to a higher extent, which decreases the available irradiance for photolysis processes [11].
Increases in DOC from enhanced soil runoff might be observed even if average precipitation does not increase, in case intense rain events become more frequent, as predicted by climate models [26]. However, evidence suggests that increasing DOC might not always be the outcome of climate change. It has been found in several cases that inconsistent and, sometimes, negligible DOC variations have taken place alongside important changes in CDOM spectral properties, which could be quantified as modifications (either increase or decrease) of Ao and S [27]. To our best knowledge, quantitative photochemical implications of changes in CDOM spectral properties have not been investigated in depth, while considerable attention has been devoted to the photochemical impact of DOC changes [25,28]. We use a model approach to fill this knowledge gap and determine how changes in the spectral parameters Ao and S might affect the photochemistry of surface-water photosensitisers (CDOM, NO3−, and NO2−) and, therefore, steady-state concentrations of •OH, CO3•−, and 3CDOM*. The case of 1O2 was not investigated separately because both 1O2 and 3CDOM* are produced by similar phenomena that involve irradiated CDOM. Furthermore, the reaction between 3CDOM* and O2 produces 1O2 with ~50% yield, while the quenching constant of 3CDOM* (by O2) is about twice higher than that of 1O2 (by collision with H2O). The overall outcome is [3CDOM*] ~ [1O2]; thus, the [3CDOM*] values are also representative of [1O2] [14,15].
2. Results and Discussion
2.1. Effect of CDOM Spectral Features on the Steady-State [3CDOM*]
The absorption spectrum of CDOM was described here by means of Equation (1). Freshwater absorbance between 290 and 500 nm is largely dominated by CDOM absorption [29]; thus, the value of A(λ) represents both the absorption spectrum of natural waters and that of the CDOM they contain. Representative values for surface freshwaters are Ao = 0.45 L mgC−1 cm−1 and S = 0.015 nm−1 [30]. However, there is environmental variability for both quantities. Moreover, climate change has the potential to alter the spectral features of CDOM, thereby modifying both Ao and S [27]. In order to assess the possible implications of CDOM spectral changes on the photochemistry of freshwaters, the couple (Ao, S) = (0.45, 0.015) was taken as the central point of a 7 × 7 variation matrix, where Ao ranged from 0.30 to 0.60 L mgC−1 cm−1, at 0.05 steps, and S ranged from 0.012 to 0.018 nm−1, at steps of 0.001 nm−1. The variation intervals were chosen so as to cover a reasonable range of spectral values, valid for the majority of surface freshwaters [31].
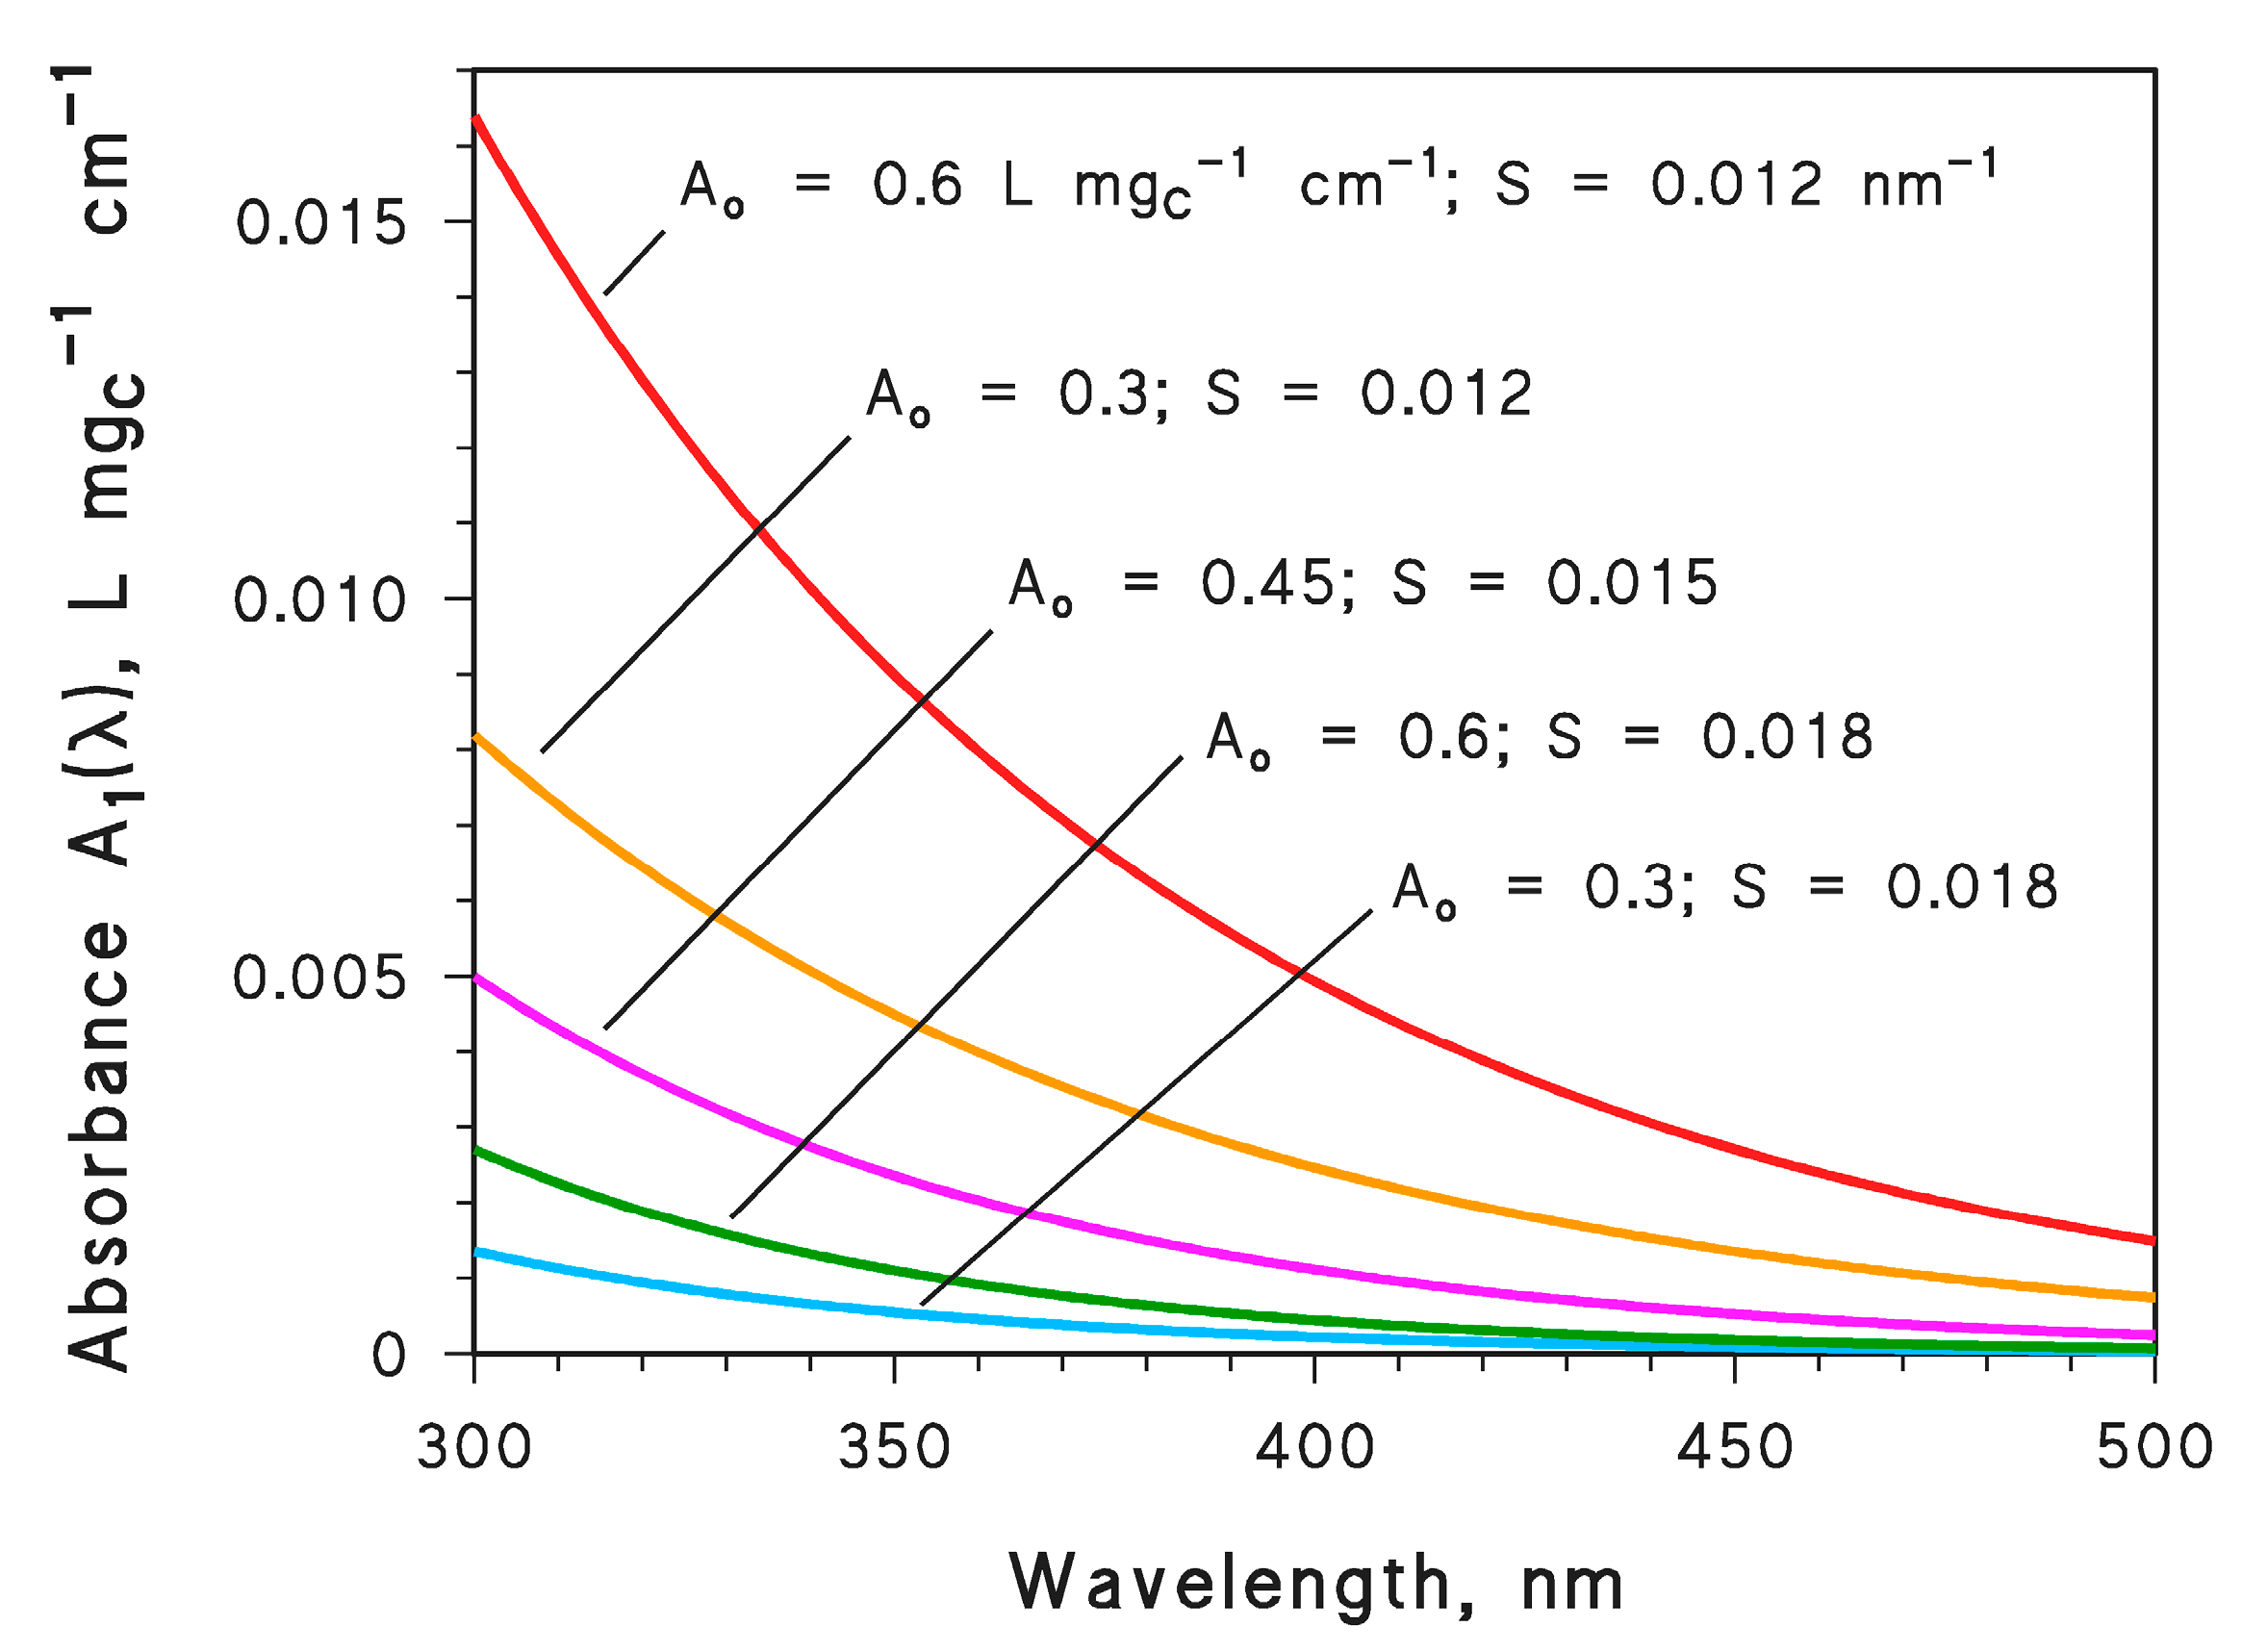
In Figure 1, A1(λ) = Ao e−S λ is plotted as a function of wavelength for different values of (Ao[L mgC−1 cm−1], S[nm−1]) = (0.60, 0.012), (0.30, 0.012), (0.45, 0.015), (0.60, 0.018), and (0.30, 0.018). It is apparent that A1(λ) is higher as Ao is higher and S is lower. Because S is part of an exponent, variations in S have a higher impact on the values of water absorbance than variations in Ao. On the one side, radiation absorption by CDOM is responsible for the photochemical generation of 3CDOM*, •OH, and 1O2 [1,2]. On the other side, CDOM competes for sunlight irradiance with the •OH sources nitrate and nitrite [11]. All these issues were taken into account by means of photochemical simulations carried out with the APEX software, which predicts the steady-state concentrations of PPRIs as a function of water chemistry, depth, and sunlight irradiance [30]. The spectral features of CDOM (both Ao and S) are additional input data for the software.
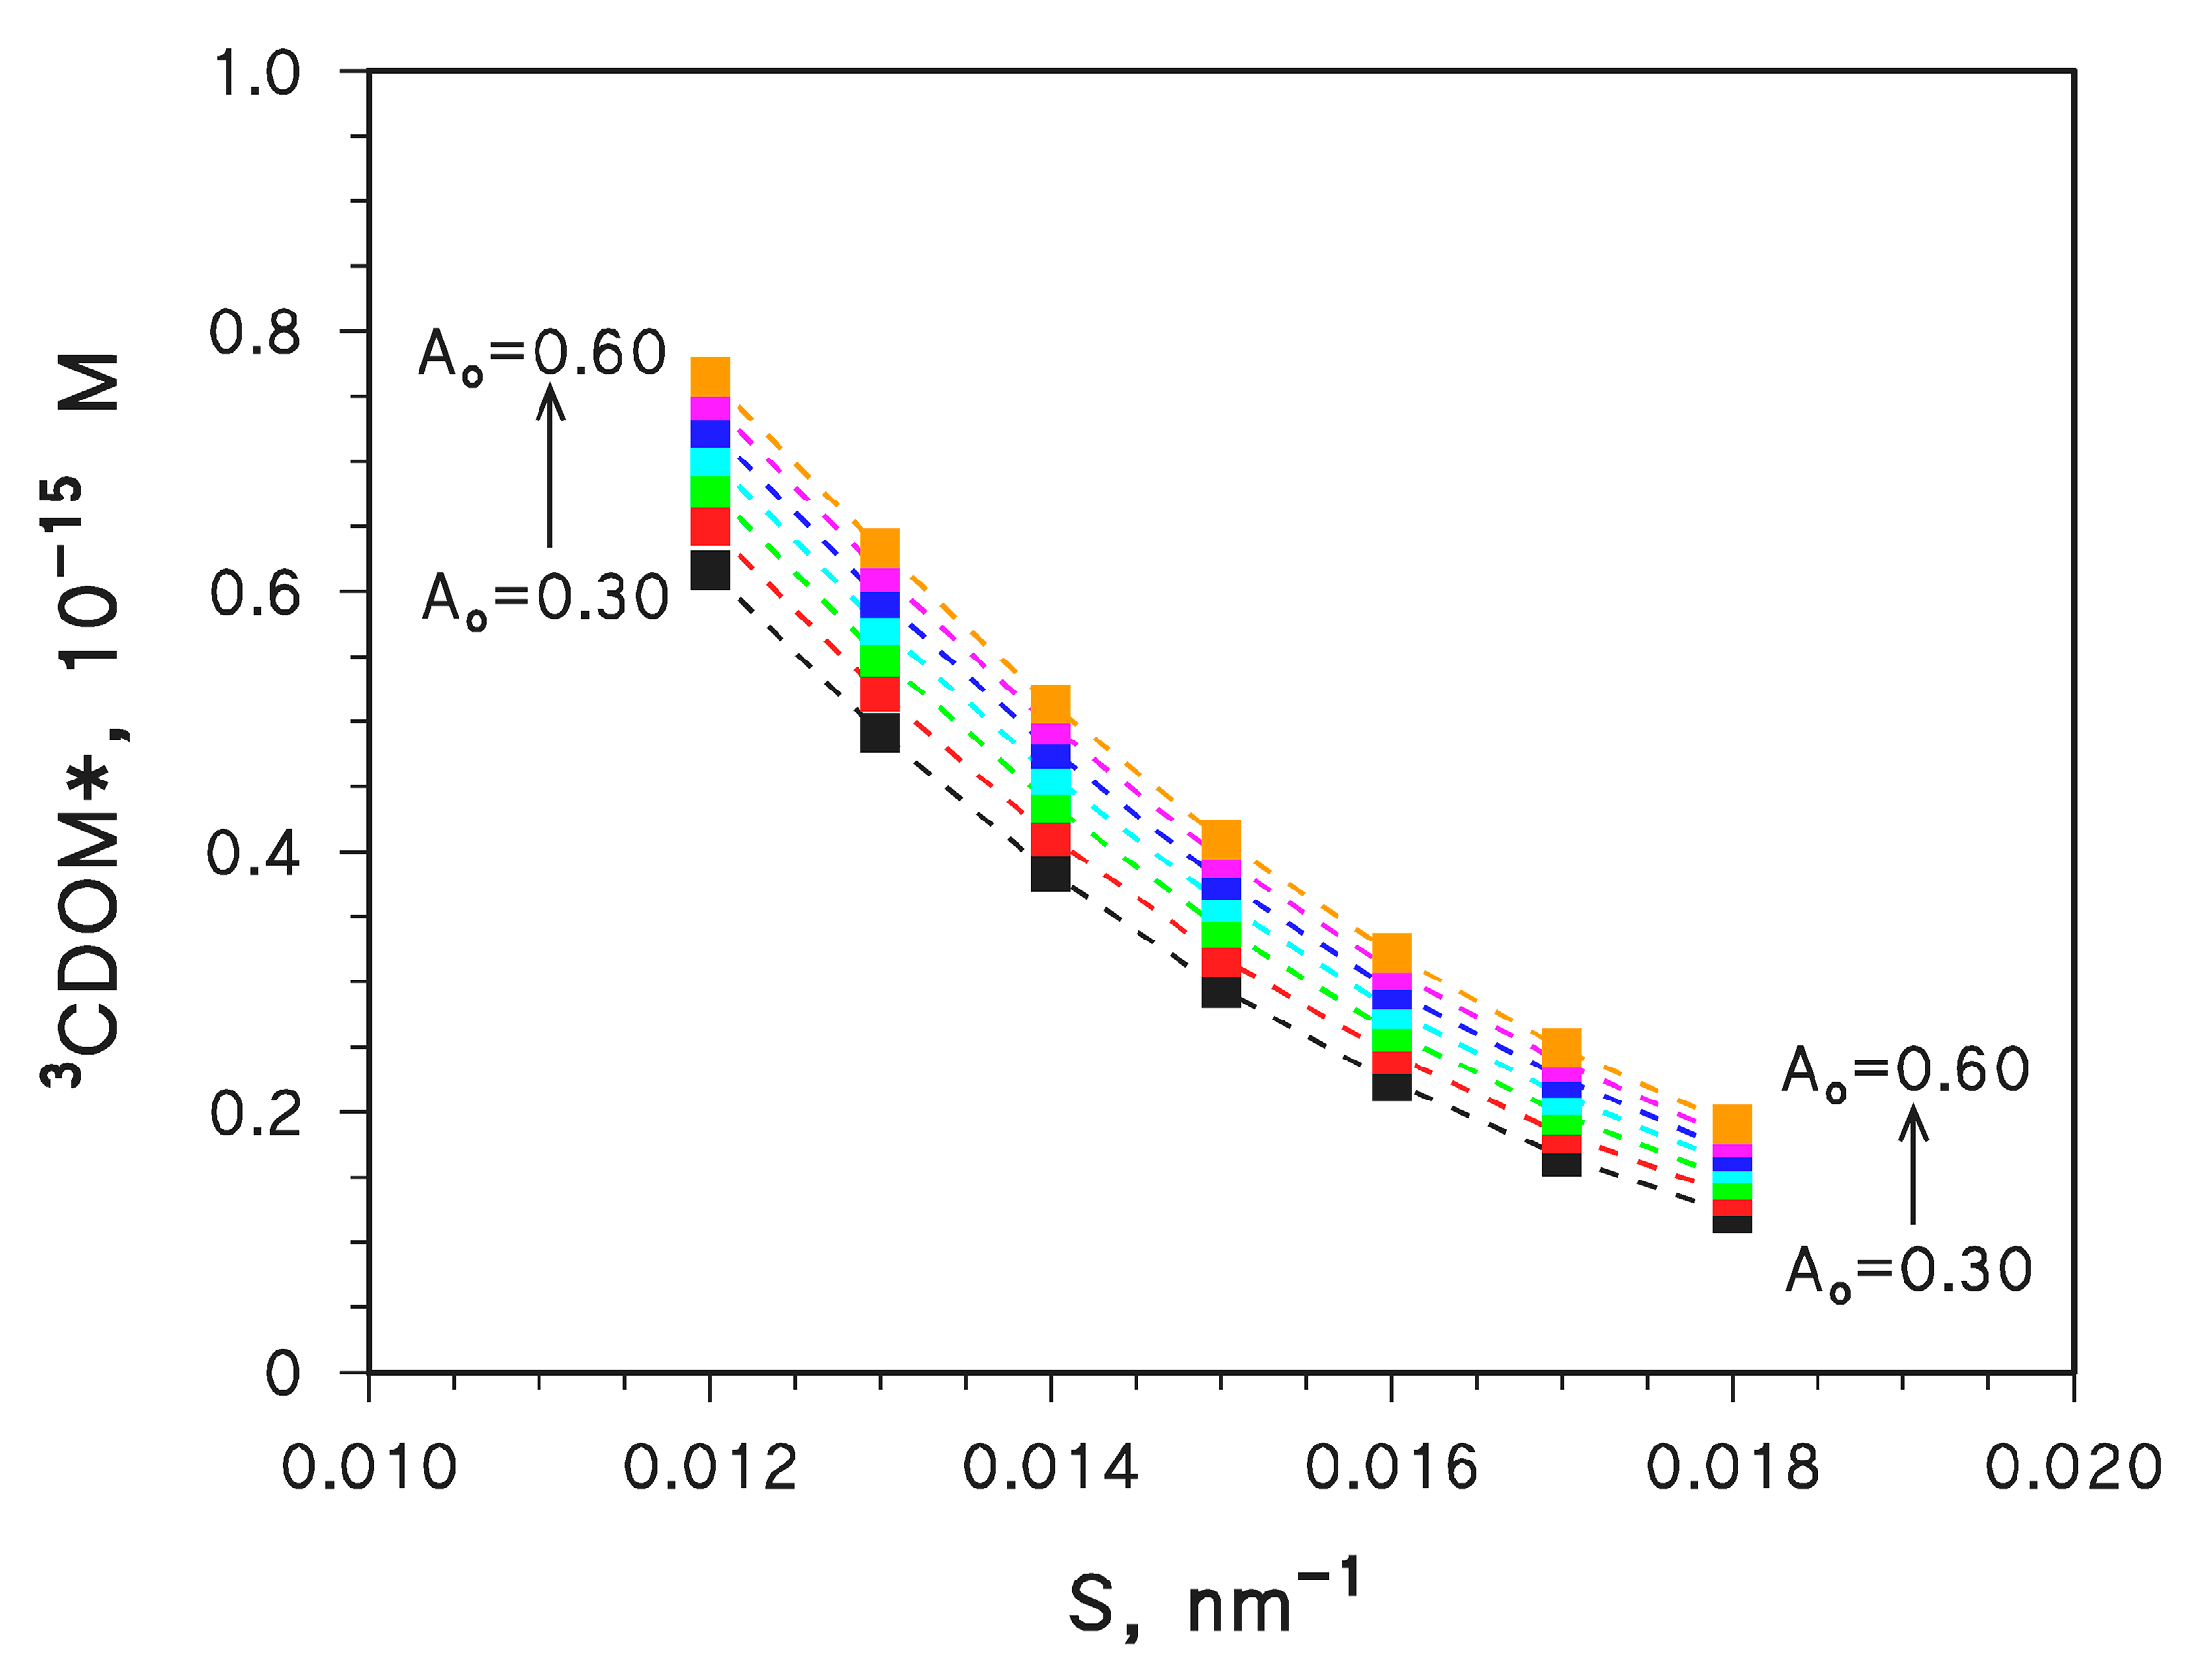
Figure 2 reports the computed steady-state [3CDOM*] for different values of Ao and S, with d = 3 m and DOC = 5 mgC L−1. It is shown that [3CDOM*] would be higher when Ao is higher and S is lower, thereby following the direction of increasing CDOM absorbance (Figure 1). This is reasonable, considering that the formation rate of 3CDOM* from CDOM is described by the following integral equation [32]:
where (mol Einstein−1) is the quantum yield of 3CDOM* formation, p°(λ) [Einstein L−1 s−1 nm−1] is the spectral photon flux density of sunlight, and ACDOM(λ) = 100 d DOC Ao e− S λ (unitless). According to Equation (2), [mol L−1 s−1] increases with increasing ACDOM. Furthermore, it is clear from Figure 2 that a variation of S has a much larger impact on [3CDOM*] than a variation of Ao.
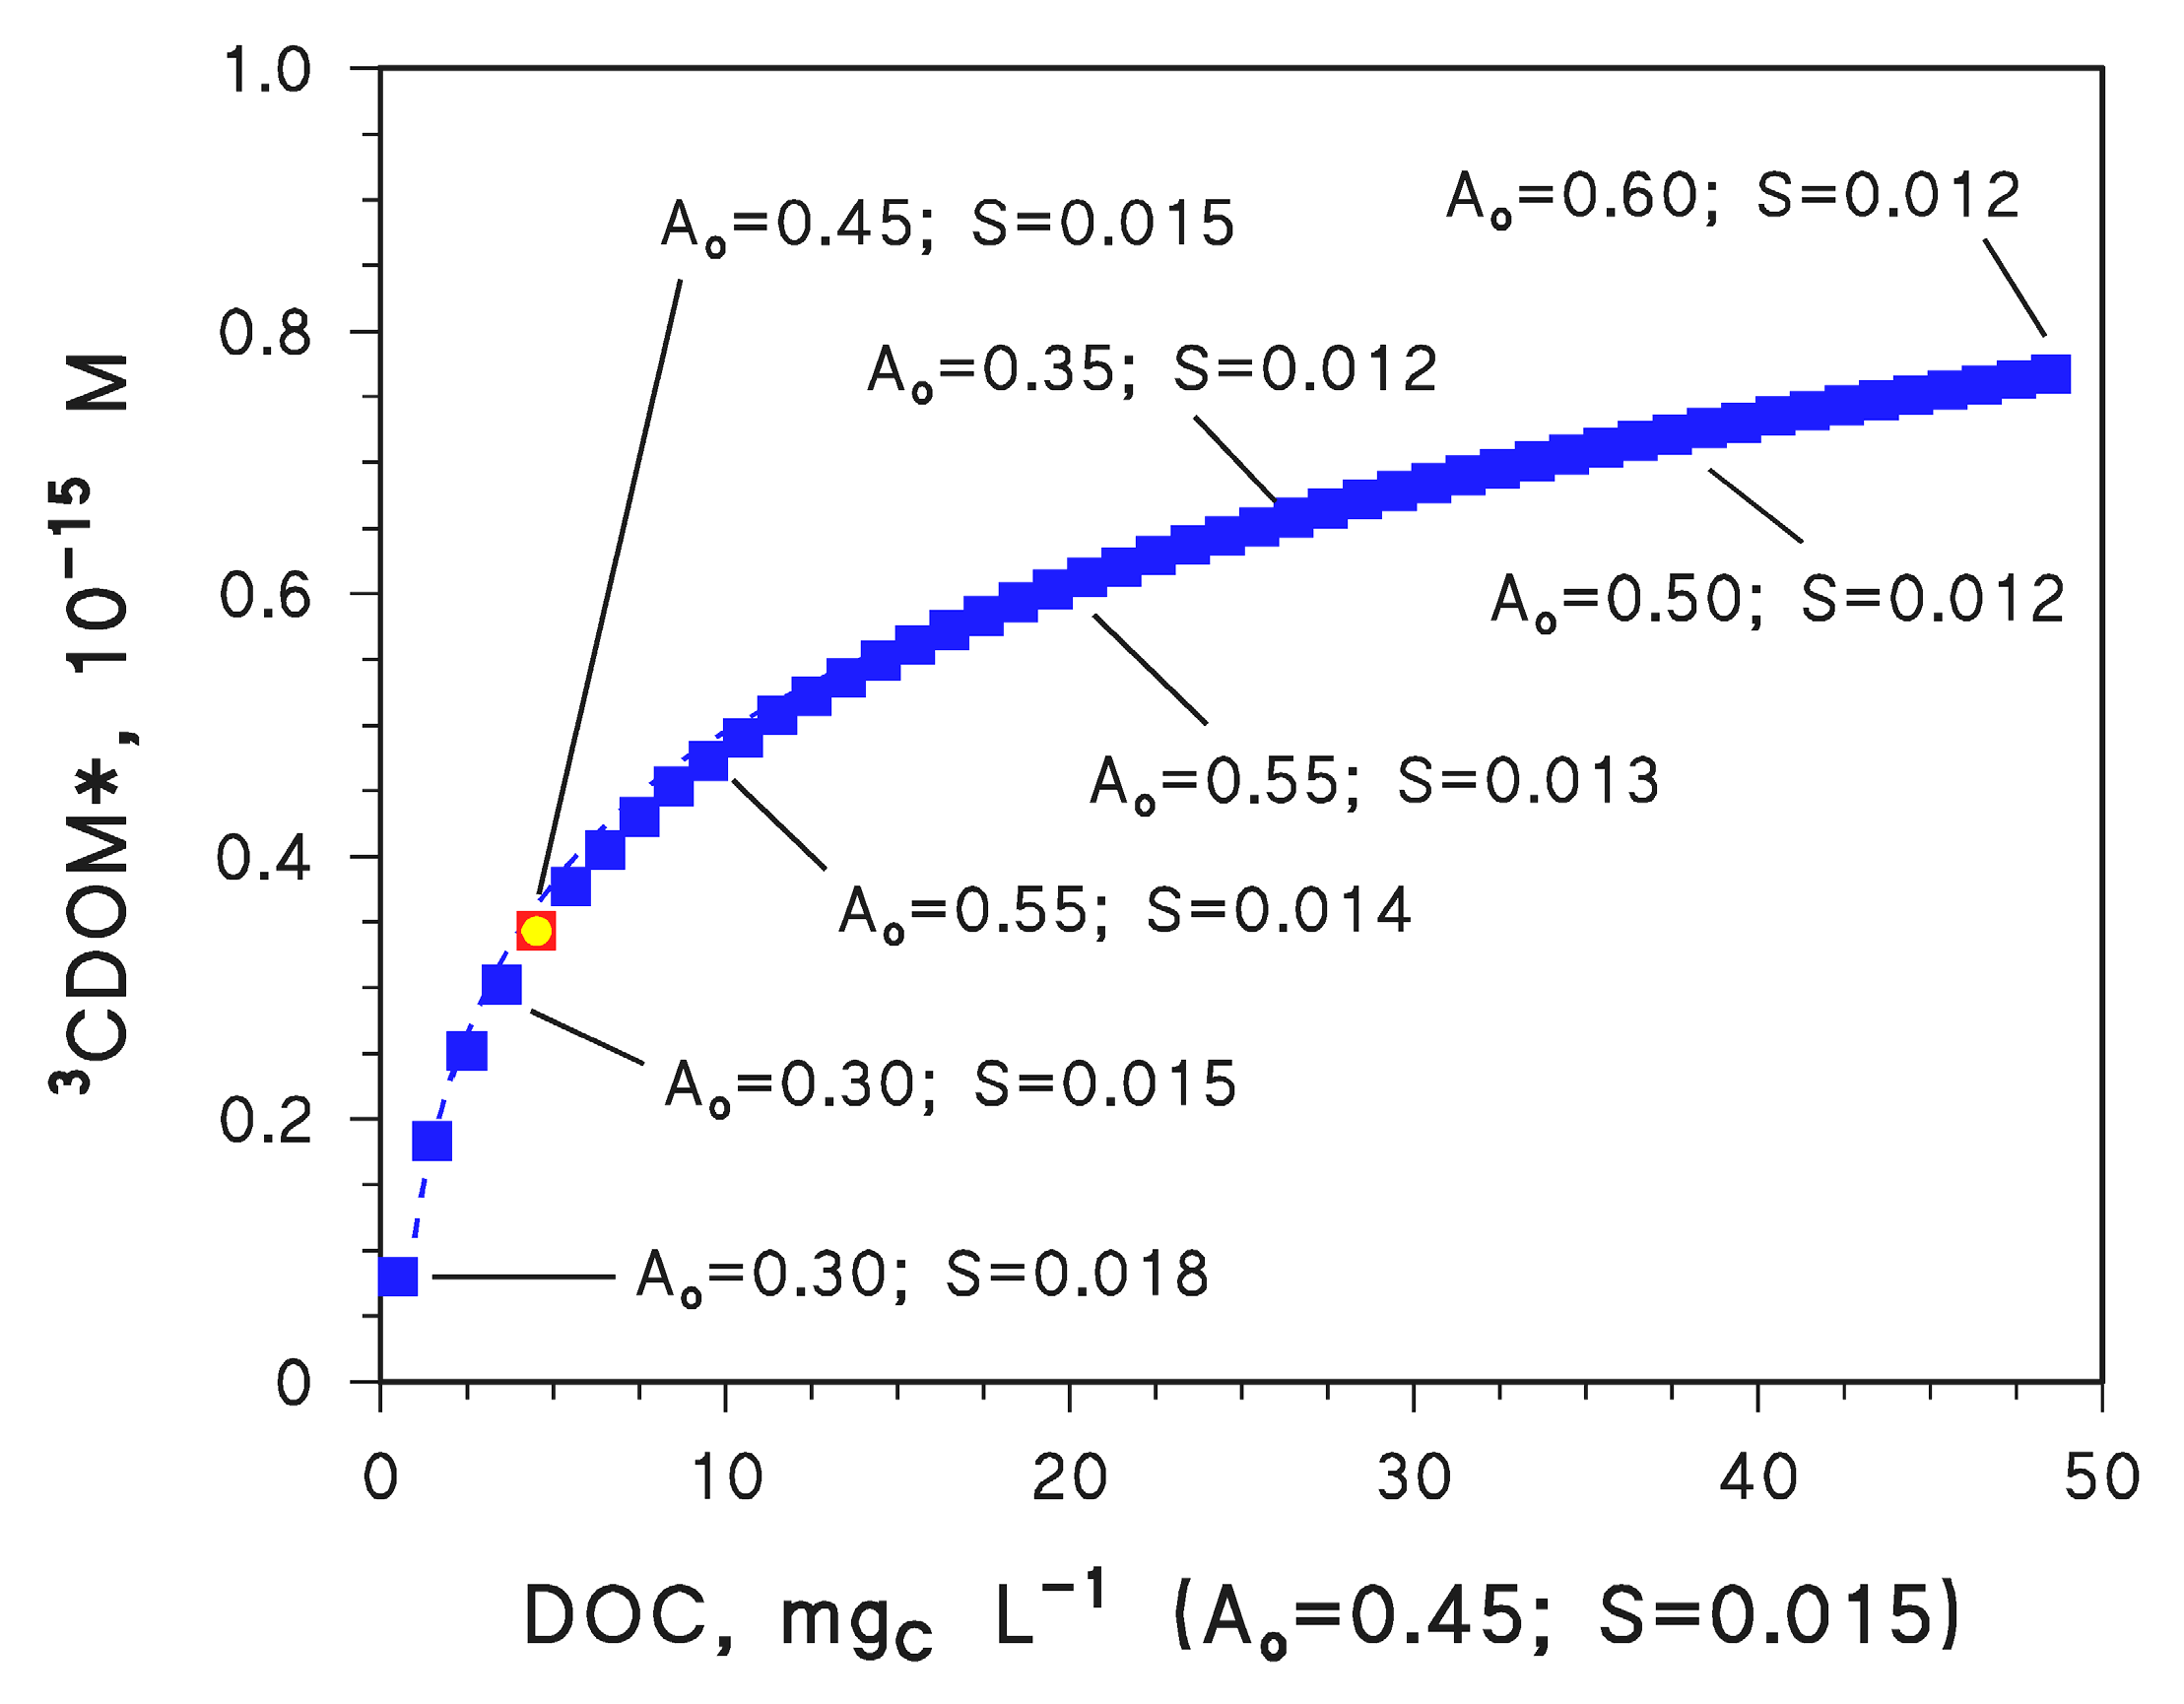
The results shown in Figure 2 suggest how [3CDOM*] would vary at constant DOC (5 mgC L−1) as a function of the spectral parameters Ao and S. The DOC value is another important factor affecting [3CDOM*] [11], and it is thus interesting to see how the same variation range (1 × 10⁻¹⁶ M < [3CDOM*] < 7.5 × 10⁻¹⁶ M; see Figure 2) could be attained by varying DOC at constant Ao and S. To this purpose, the DOC value was varied at fixed Ao = 0.45 L mgC−1 cm−1 and S = 0.015 nm−1.
The results of the mentioned simulations are reported in Figure 3. It is shown that to have the same [3CDOM*] value found for DOC = 5 mgC L−1 and (Ao, S) = (0.30, 0.018), one needs DOC = 0.5 mgC L−1 if (Ao, S) = (0.45, 0.015). At the same time, DOC = 5 mgC L−1 and (Ao, S) = (0.60, 0.012) give the same [3CDOM*] value as DOC = 50 mgC L−1 and (Ao, S) = (0.45, 0.015). In other words, a change ΔAo = ±0.15 L mgC−1 cm−1 (i.e., ±33%) plus ΔS = ±0.003 nm−1 (i.e., ±20%) is equivalent to an order-of-magnitude variation of the DOC value. Interestingly, the DOC range 0.5–50 mgC L−1 covers the vast majority of surface-water environments in a similar way as the studied intervals of Ao (0.30–0.60) and S (0.012–0.018) [31]. Therefore, CDOM spectral features have the potential to affect surface-water photochemistry in a way comparable to the DOC values.
This issue has environmental significance because, for instance, variations in either (or both) DOC values and/or CDOM spectral properties have been observed as a consequence of climate change [20,21,22,27]. It also means that both qualitative (Ao, S) and quantitative (DOC) modifications of organic matter are potentially important for their impact on photochemical reactions. In particular, Ao depends on CDOM chromophores, while S is inversely related to the molecular weight of CDOM [34].
2.2. Effect of CDOM Spectral Features on the Steady-State [•OH] and [CO3•−]
The radical •OH, which is also a major driver of CO3•− production, is generated by irradiation of CDOM, nitrate, and nitrite. Because the three photosensitisers compete for sunlight irradiance, high CDOM absorbance would decrease the production of •OH by both nitrate and nitrite, while favouring •OH photoproduction by CDOM itself. The opposite happens when the absorbance of CDOM is low [1,2,11,12].
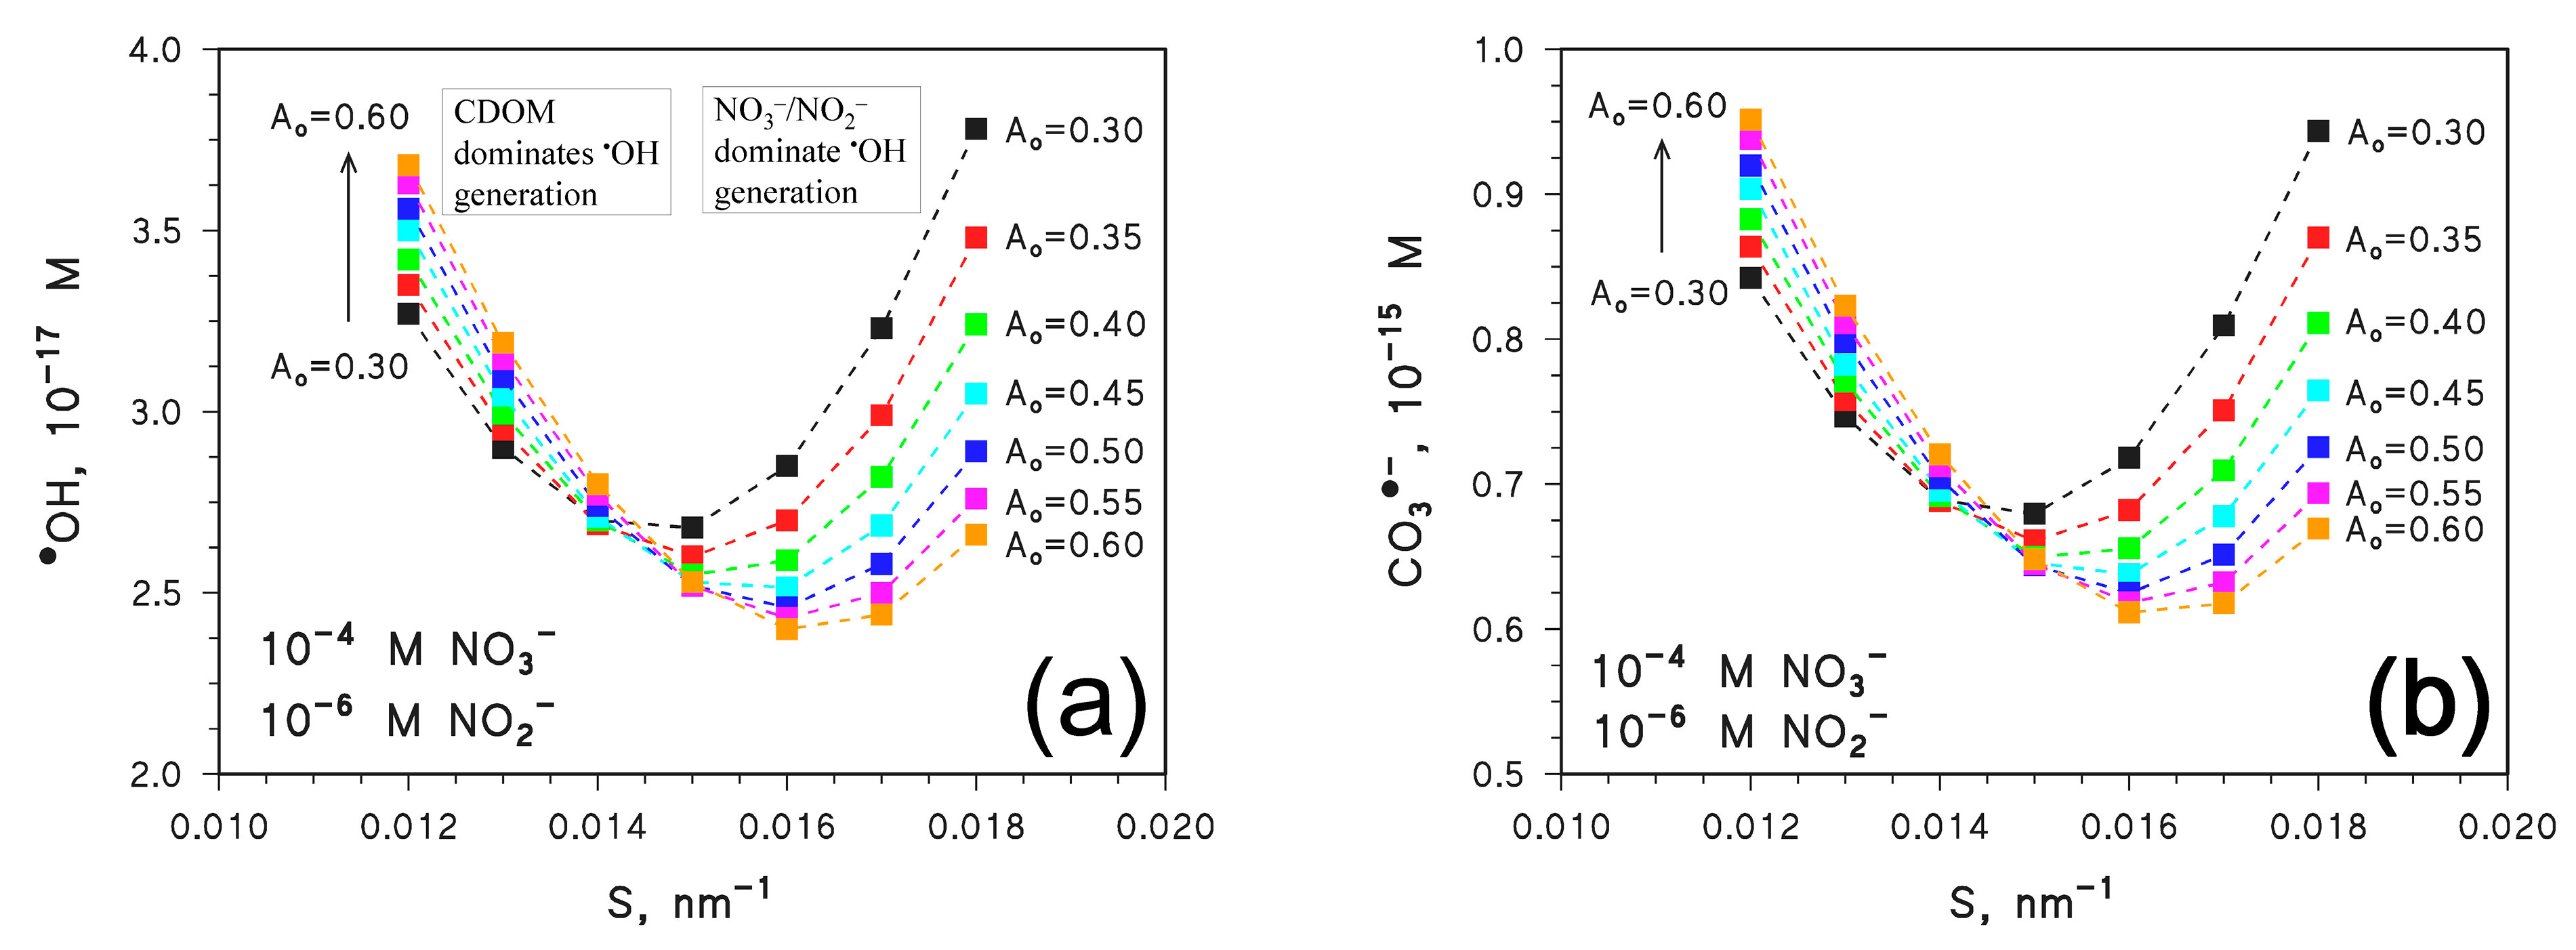
Values of [•OH] and [CO3•−] were first calculated for the same water conditions (including constant DOC) used to derive [3CDOM*] in Figure 2. The results are shown in Figure 4 for different values of Ao and S. A trend with a minimum is observed for both [•OH] (Figure 4a) and [CO3•−] (Figure 4b) as a function of S, which is noteworthy and deserves explanation.
First of all, note that to the left-hand side of the minimum in Figure 4 (S < 0.015 nm−1, which means high ACDOM), both [•OH] and [CO3•−] increase with increasing Ao and decrease with increasing S, which is similar behaviour as that seen for [3CDOM*] in Figure 2. In contrast, to the right-hand side of the minimum (S > 0.015 nm−1, low ACDOM), the values of [•OH] and [CO3•−] decrease with increasing Ao and increase with increasing S.
When ACDOM is high, •OH production by nitrate and nitrite is inhibited due to light screening by CDOM. In these conditions, CDOM is the main •OH source, and a further increase in ACDOM (Ao increase, S decrease) mainly enhances CDOM photochemistry (inhibition of nitrate/nitrite photolysis has minor role) and leads to higher [•OH] and, therefore, [CO3•−]. Discussion here only focuses on •OH (and CO3•−) generation because scavenging of •OH and CO3•− would not change at constant DOC, HCO3−, and CO32− [11,12].
When ACDOM is low (right-hand side of the Figure 4 minimum), there is limited production of •OH by CDOM and lesser inhibition of NO3−/NO2− photolysis; thus, nitrate and nitrite play comparatively more important roles as •OH sources. In these conditions, an increase in ACDOM would mainly inhibit the photolysis of nitrate and nitrite, and the corresponding decrease in •OH photogeneration by NO3−/NO2− would not be offset by the still low (albeit enhanced) photoproduction of •OH by CDOM. This issue explains why, if S > 0.015 nm−1, [•OH] and [CO3•−] both decrease as Ao increases and S decreases.
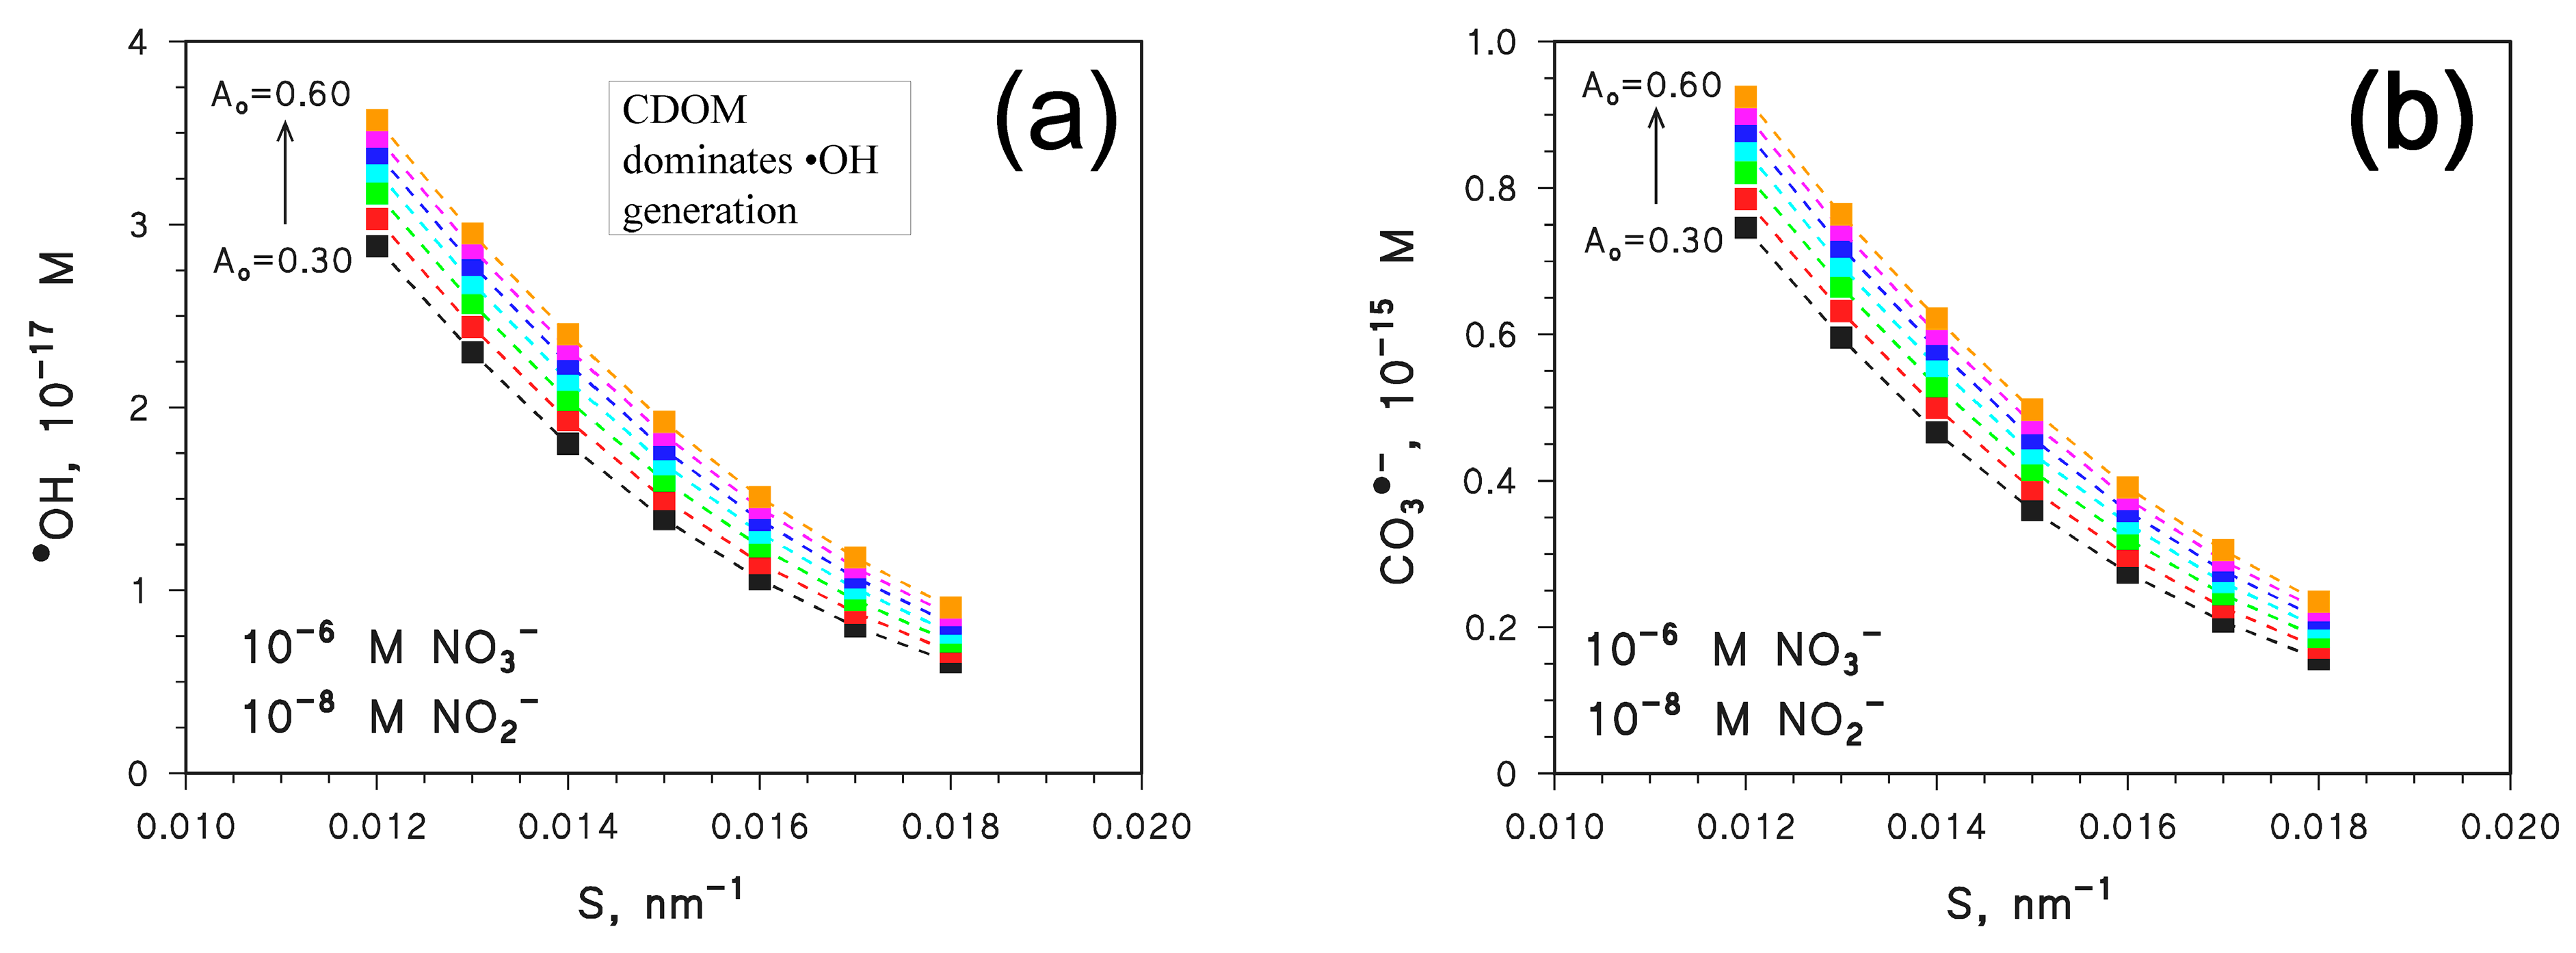
To obtain better insight into the trends shown in Figure 4, the input concentration values of NO3− and NO2− were modified so as to make the two nitrogen species either consistently minor photosensitisers or the main sources of •OH and CO3•−. Figure 5 reports the calculated steady-state [•OH] (Figure 5a) and [CO3•−] (Figure 5b) in the presence of 10−6 M NO3− and 10−8 M NO2−, as a function of S and for different values of Ao. The concentration values of NO3− and NO2− are 100 times lower than before, and they ensure that the photochemistry of nitrate and nitrite plays a minor role when compared to CDOM [11,12,30]. As shown in Figure 5, [•OH] and [CO3•−] decrease with increasing S and they are higher as Ao is higher. These trends resemble quite closely the trend of [3CDOM*] shown in Figure 2, and they mirror the photochemistry of CDOM that is enhanced as ACDOM is higher.
The same trends also bear similarity with those reported on the left-hand side of Figure 4a,b (low S values). In this case as well, CDOM irradiation played the main role as the direct •OH source and, indirectly, as the source of CO3•−.
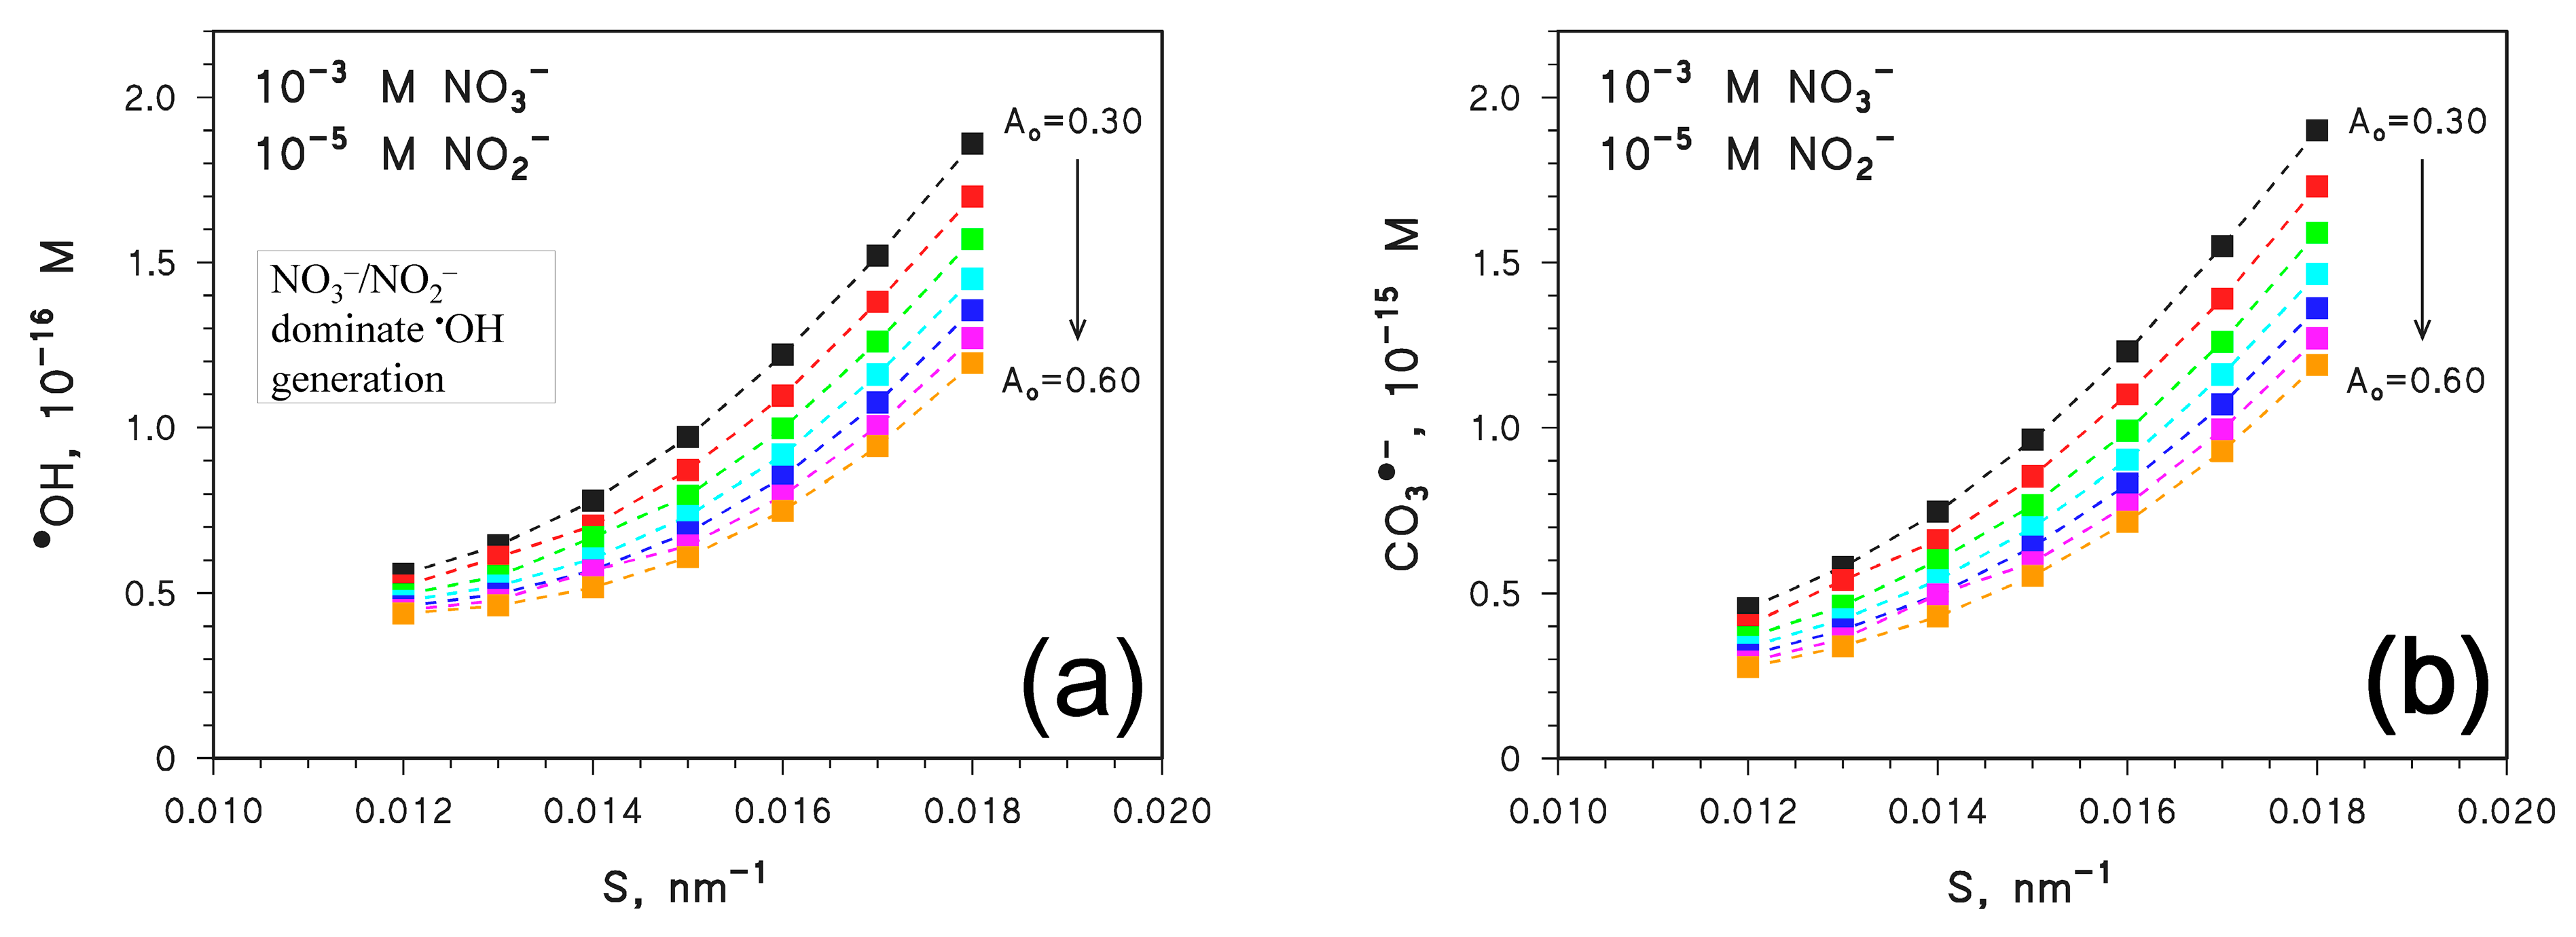
The opposite case (nitrate and nitrite as major •OH and CO3•− sources) is shown in Figure 6, in which circumstance it was assumed 10−3 M NO3− and 10−5 M NO2−. In this case, both [•OH] and [CO3•−] increase with increasing S, and they are higher as Ao is lower. Such trends resemble those of the right-hand side of Figure 4a,b (high S values), in that high values of [•OH] and [CO3•−] are obtained when ACDOM is low. This is reasonable, because when NO3− and NO2− are the main sources of •OH and CO3•−, the values of [•OH] and [CO3•−] are enhanced by a lower light-screening effect of CDOM, which produces lesser inhibition of the photochemistry of nitrate and nitrite. In these conditions, the effect of ACDOM on CDOM photochemistry only plays a secondary role.
Low concentration values of nitrate and nitrite (Figure 5) are, for instance, representative of hypertrophic lakes, where nitrogen is the limiting element for algal growth and its inorganic forms are quickly assimilated by algae [35]. In contrast, high NO3− and NO2− concentrations (Figure 6) are quite near the guideline values for drinking-water quality (maximum admissible concentrations) and might apply, for instance, to a surface water body receiving inputs from contaminated groundwater [36]. Moreover, increasing Ao and decreasing S mean that CDOM is more aromatic and has higher molecular mass [37]. These circumstances favour sunlight absorption by CDOM (higher ACDOM values). The opposite happens when CDOM is less aromatic and has lower molecular mass, which decreases Ao and increases S, causing ACDOM to be lower. The latter circumstance may be observed when CDOM undergoes prolonged exposure to sunlight, which causes photobleaching with inactivation of chromophores (which lowers Ao) and fragmentation of large molecules (which increases S) [34,38].
3. Materials and Methods
The steady-state concentrations of •OH, CO3•−, and 3CDOM* were assessed by means of the APEX software (version 1.1 [30]), which computes PPRI concentrations as a function of solar irradiance and spectrum, water absorption spectrum, water chemistry, and depth [30,39]. The default solar irradiance in APEX is 22 W m−2 in the UV (290–400 nm), which can be observed in fair-weather conditions at mid-latitude during summer (15 July, 9 am or 3 pm), or at noon on the spring equinox [30]. APEX is able to compute seasonal variations in photochemical reaction rates and PPRI steady-state concentrations [40], but conditions chosen for this study were fixed and corresponded to the mid-latitude spring equinox.
Water depth d was fixed at 3 m, which is representative of well-illuminated water environments where photochemistry can play an important role in transformation reactions [32]. The concentration of inorganic carbon species was taken as 10−3 M HCO3− and 10−5 M CO32−, which is observed in several water environments [33]. In a first series of runs, it was additionally assumed DOC = 5 mgC L−1, [NO3−] = 10−4 M, and [NO2−] = 10−6 M.
Water absorption spectrum is modelled in APEX as Ad(λ) = 100 d DOC Ao e− Sλ, with default values of Ao = 0.45 L mgC−1 cm−1 and S = 0.015 nm−1 [30]. The quantum yields of •OH, 3CDOM*, and CO3•− photoproduction by irradiated CDOM were assumed not to vary and were left at their default values.
The APEX output data include the relative roles played by nitrate, nitrite, and CDOM in •OH photoproduction [30], which largely reflect the roles of the three photosensitisers in the generation of CO3•−. The (secondary) contribution to CO3•− from the oxidation of CO32− by 3CDOM* [41] is also taken into account by APEX.
4. Conclusions
Variations in the spectral parameters Ao and S strongly affect radiation absorption by CDOM. Considering the typical ranges of Ao, S, and the DOC values that are observed in natural waters [31,33,42], it can be envisaged that the variability of CDOM spectral properties has a comparable impact as DOC variability, and cannot thus be overlooked.
The effects of spectral properties on [3CDOM*] depend on the resulting ACDOM values, because [3CDOM*] increases as ACDOM is higher. In contrast, variations in CDOM spectral properties affect [•OH] and [CO3•−] differently, depending on the relative roles of CDOM vs. NO3−/NO2− as •OH and CO3•− sources. In particular, for a given DOC value, CDOM dominates •OH and CO3•− photoproduction when the concentration values of NO3− and NO2− are low, and the opposite happens when these concentrations are high [43]. At intermediates values of [NO3−] and [NO2−], the relative roles of CDOM vs. NO3−/NO2− as •OH and CO3•− sources depend on CDOM spectral properties and, therefore, on ACDOM. High ACDOM decreases [•OH] and [CO3•−] when nitrate and nitrite are the main •OH/CO3•− sources, and the opposite happens when CDOM is the main •OH/CO3•− source.
The described variations are important as far as pollutant phototransformation is concerned. In particular, 3CDOM* and CO3•− are highly involved in the degradation of phenols, aromatic amines, and sulphur-containing compounds [44]. 3CDOM* also takes part in the transformation of phenylurea herbicides, sulphonamide antibiotics, and cyanobacterial toxins, such as microcystin-LR [44,45,46]. Highly reactive •OH plays important roles in the degradation of recalcitrant pollutants such as hydrocarbons, some pesticides (e.g., atrazine), and PPCPs including carbamazepine and acesulfame K [47,48,49,50].
In environmental waters, CDOM photobleaching destroys chromophores (lower Ao) and causes molecular fragmentation (higher S), thereby decreasing CDOM absorbance [34,37]. The steady-state [3CDOM*] would be decreased as a consequence, while [•OH] and [CO3•−] would decrease when nitrate and nitrite are low (the main effect being the inhibition of CDOM photochemistry) or increase when nitrate and nitrite are high (the main effect being enhanced photochemistry of NO3− and NO2−, due to lower sunlight screening by CDOM). Therefore, photobleaching would amplify the photochemical role of NO3− and NO2− concentrations. As far as climate-change effects are concerned, variations in Ao and S would be highly environment-specific, and they should be assessed on a case-by-case basis.
Author Contributions
Conceptualization, D.V.; methodology, N.A. and D.V.; software, D.V.; validation, N.A. and D.V.; formal analysis, N.A.; investigation, N.A.; resources, D.V.; data curation, N.A. and D.V.; writing—original draft preparation, N.A. and D.V.; writing—review and editing, D.V.; supervision, D.V.; project administration, D.V.; funding acquisition, D.V. All authors have read and agreed to the published version of the manuscript.
Funding
This research was funded by MIUR—PNRR—Next Generation EU, Growing Resilient, INclusive and Sustainable (GRINS)—PE9-6 (Low carbon policies) (PE00000018-CUP D13C22002160001).
Institutional Review Board Statement
Not applicable.
Informed Consent Statement
Not applicable.
Data Availability Statement
The data presented in this study are available on request from the corresponding author.
Conflicts of Interest
The authors declare no conflict of interest.
Sample Availability
Samples of the compounds are not available from the authors.
References
- Remucal, C.K. The role of indirect photochemical degradation in the environmental fate of pesticides: A review. Environ. Sci.-Process. Impacts 2014, 16, 628–653. [Google Scholar] [CrossRef] [PubMed]
- Vione, D.; Minella, M.; Maurino, V.; Minero, C. Indirect photochemistry in sunlit surface waters: Photoinduced production of reactive transient species. Chem.-Eur. J. 2014, 20, 10590–10606. [Google Scholar] [CrossRef] [PubMed]
- Young, R.B.; Latch, D.E.; Mawhinney, D.B.; Nguyen, T.-H.; Davis, J.C.C.; Borch, T. Direct photodegradation of androstenedione and testosterone in natural sunlight: Inhibition by dissolved organic matter and reduction of endocrine disrupting potential. Environ. Sci. Technol. 2013, 47, 8416–8424. [Google Scholar] [CrossRef]
- Prasse, C.; Wenk, J.; Jasper, J.T.; Ternes, T.A.; Sedlak, D.L. Co-occurrence of photochemical and microbiological transformation processes in open-water unit process wetlands. Environ. Sci. Technol. 2015, 49, 14136–14145. [Google Scholar] [CrossRef] [PubMed] [Green Version]
- Castiglioni, S.; Bagnati, R.; Fanelli, R.; Pomati, F.; Calamari, D.; Zuccato, E. Removal of pharmaceuticals in sewage treatment plants in Italy. Environ. Sci. Technol. 2006, 40, 357–363. [Google Scholar] [CrossRef]
- Gao, P.; Ding, Y.; Li, H.; Xagoraraki, I. Occurrence of pharmaceuticals in a municipal wastewater treatment plant: Mass balance and removal processes. Chemosphere 2012, 88, 17–24. [Google Scholar] [CrossRef]
- Richardson, S.D.; Ternes, T.A. Water analysis: Emerging contaminants and current issues. Anal. Chem. 2014, 86, 2813–2848. [Google Scholar] [CrossRef]
- Knopp, G.; Prasse, C.; Ternes, T.A.; Cornel, P. Elimination of micropollutants and transformation products from a wastewater treatment plant effluent through pilot scale ozonation followed by various activated carbon and biological filters. Water Res. 2016, 100, 580–592. [Google Scholar] [CrossRef]
- Fang, H.; Ling, Z.; Guan, F.; Liao, W.; Lai, F.; Liang, X. Photophysical and photochemical insights into the photodegradation of tricyclazole and pymetrozine in water bodies of a rice field. Environ. Chem. 2020, 17, 436–444. [Google Scholar] [CrossRef]
- Liang, X.; Guan, F.; Ling, Z.; Wang, H.; Tao, Y.; Kraka, E.; Huang, H.; Yu, C.; Li, D.; He, J.; et al. Pivotal role of water molecules in the photodegradation of pymetrozine: New insights for developing green pesticides. J. Hazard. Mater. 2022, 423 (Pt B), 127197. [Google Scholar] [CrossRef]
- Vione, D.; Scozzaro, A. Photochemistry of surface fresh waters in the framework of climate change. Environ. Sci. Technol. 2019, 53, 7945–7963. [Google Scholar] [CrossRef] [PubMed]
- Vione, D. Photochemical reactions and the self-depuration of sunlit freshwaters. Environ. Res. Ecol. 2023, 2, 012001. [Google Scholar] [CrossRef]
- Rosario-Ortiz, F.L.; Canonica, S. Probe compounds to assess the photochemical activity of dissolved organic matter. Environ. Sci. Technol. 2016, 50, 12532–12547. [Google Scholar] [CrossRef] [PubMed] [Green Version]
- Mc Neill, K.; Canonica, S. Triplet state dissolved organic matter in aquatic photochemistry: Reaction mechanisms, substrate scope, and photophysical properties. Environ. Sci.-Process. Impacts 2016, 18, 1381–1399. [Google Scholar] [CrossRef] [PubMed] [Green Version]
- Ossola, R.; Jönsson, O.M.; Moor, K.; McNeill, K. Singlet oxygen quantum yields in environmental waters. Chem. Rev. 2021, 121, 4100–4146. [Google Scholar] [CrossRef]
- Loiselle, S.; Vione, D.; Minero, C.; Maurino, V.; Tognazzi, A.; Dattilo, A.M.; Rossi, C.; Bracchini, L. Chemical and optical phototransformation of dissolved organic matter. Water Res. 2012, 46, 3197–3207. [Google Scholar] [CrossRef]
- Zhou, H.; Yan, S.; Lian, L.; Song, W. Triplet-state photochemistry of dissolved organic matter: Triplet-state energy distribution and surface electric charge conditions. Environ. Sci. Technol. 2019, 53, 2482–2490. [Google Scholar] [CrossRef]
- Sha, H.; Yan, S.; Deng, Y.; Song, W. Photosensitized transformation of hydrogen peroxide in dissolved organic matter solutions under simulated solar irradiation. Environ. Sci. Technol. 2022, 56, 14080–14090. [Google Scholar] [CrossRef]
- Galgani, L.; Tognazzi, A.; Rossi, C.; Ricci, M.; Angel Galvez, J.; Dattilo, A.M.; Cozar, A.; Bracchini, L.; Loiselle, S.A. Assessing the optical changes in dissolved organic matter in humic lakes by spectral slope distributions. J. Photochem. Photobiol. B Biol. 2011, 102, 132–139. [Google Scholar] [CrossRef]
- Solomon, C.T.; Jones, S.E.; Weidel, B.C.; Buffam, I.; Fork, M.L.; Karlsson, J.; Larsen, S.; Lennon, J.T.; Read, J.S.; Sadro, S.; et al. Ecosystem consequences of changing inputs of terrestrial dissolved organic matter to lakes: Current knowledge and future challenges. Ecosystems 2015, 18, 376–389. [Google Scholar] [CrossRef]
- Weyhenmeyer, G.A.; Müller, R.A.; Norman, M.; Tranvik, L.J. Sensitivity of freshwaters to browning in response to future climate change. Clim. Chang. 2016, 134, 225–239. [Google Scholar] [CrossRef]
- Sobek, S.; Tranvik, L.J.; Prairie, Y.T.; Kortelainen, P.; Cole, J.J. Patterns and regulation of dissolved organic carbon: An analysis of 7500 widely distributed lakes. Limnol. Oceanogr. 2007, 58, 1208–1219. [Google Scholar] [CrossRef] [Green Version]
- Williamson, C.E.; Overholt, E.P.; Pilla, R.M.; Leach, T.H.; Brentrup, J.A.; Knoll, L.B.; Mette, E.M.; Moeller, R.E. Ecological consequences of long-term browning in lakes. Sci. Rep. 2015, 5, 18666. [Google Scholar] [CrossRef] [PubMed] [Green Version]
- Futter, M.N.; Starr, M.; Forsius, M.; Holmberg, M. Modelling the effects of climate on long-term patterns of dissolved organic carbon concentrations in the surface waters of a boreal catchment. Hydrol. Earth Syst. Sci. 2008, 12, 437–447. [Google Scholar] [CrossRef] [Green Version]
- Koehler, B.; Barsotti, F.; Minella, M.; Landelius, T.; Minero, C.; Tranvik, L.J.; Vione, D. Simulation of photoreactive transients and of photochemical transformation of organic pollutants in sunlit boreal lakes across 14 degrees of latitude: A photochemical mapping of Sweden. Water Res. 2018, 129, 94–104. [Google Scholar] [CrossRef]
- Sperotto, A.; Molina, J.L.; Torresan, S.; Critto, A.; Pulido-Velazquez, M.; Marcomini, A. Water quality sustainability evaluation under uncertainty: A multi-scenario analysis based on Bayesian networks. Sustainability 2019, 11, 4764. [Google Scholar] [CrossRef] [Green Version]
- Jane, S.F.; Winslow, L.A.; Remucal, C.K.; Rose, K.C. Long-term trends and synchrony in dissolved organic matter characteristics in Wisconsin, USA, lakes: Quality, not quantity, is highly sensitive to climate. J. Geophys. Res. Biogeosci. 2017, 122, 546–561. [Google Scholar] [CrossRef]
- Calderaro, F.; Vione, D. Possible effect of climate change on surface-water photochemistry: A model assessment of the impact of browning on the photodegradation of pollutants in lakes during summer stratification. Epilimnion vs. whole-lake phototransformation. Molecules 2020, 25, 2795. [Google Scholar] [CrossRef]
- Bracchini, L.; Loiselle, S.; Dattilo, A.M.; Mazzuoli, S.; Cozar, A.; Rossi, C. The spatial distribution of optical properties in the ultraviolet and visible in an aquatic ecosystem. Photochem. Photobiol. 2004, 80, 139–149. [Google Scholar] [CrossRef]
- Vione, D. A critical view of the application of the APEX software (Aqueous Photochemistry of Environmentally-occurring Xenobiotics) to predict photoreaction kinetics in surface freshwaters. Molecules 2020, 25, 9. [Google Scholar] [CrossRef] [Green Version]
- Wetzel, R.G. Limnology: Lake and River Ecosystems, 3rd ed.; Academic Press: San Diego, CA, USA, 2001. [Google Scholar]
- Vione, D. The modelling of surface-water photoreactions made easier: Introducing the concept of ‘equivalent monochromatic wavelengths’. Water Res. 2021, 190, 116675. [Google Scholar] [CrossRef] [PubMed]
- Minero, C.; Chiron, S.; Falletti, G.; Maurino, V.; Pelizzetti, E.; Ajassa, R.; Carlotti, M.E.; Vione, D. Photochemical processes involving nitrite in surface water samples. Aquat. Sci. 2007, 69, 71–85. [Google Scholar] [CrossRef]
- Helms, J.R.; Stubbins, A.; Ritchie, J.D.; Minor, E.C.; Kieber, D.J.; Mopper, K. Absorption spectral slopes and slope ratios as indicators of molecular weight, source, and photobleaching of chromophoric dissolved organic matter. Limnol. Oceanogr. 2008, 53, 955–969. [Google Scholar] [CrossRef] [Green Version]
- Maberly, S.C.; Pitt, J.-A.; Davies, P.S.; Carvalho, L. Nitrogen and phosphorus limitation and the management of small productive lakes. Inland Waters 2020, 10, 159–172. [Google Scholar] [CrossRef] [Green Version]
- Lasagna, M.; De Luca, D.A.; Franchino, E. Nitrate contamination of groundwater in the western Po Plain (Italy): The effects of groundwater and surface water interactions. Environ. Earth Sci. 2016, 75, 240. [Google Scholar] [CrossRef]
- Da Silva, M.P.; De Carvalho, L.A.S.; Novo, E.; Jorge, D.S.F.; Barbosa, C.C.F. Use of optical absorption indices to assess seasonal variability of dissolved organic matter in Amazon floodplain lakes. Biogeosciences 2020, 17, 5355–5364. [Google Scholar] [CrossRef]
- Zhang, Y.; Liu, X.; Osburn, C.L.; Wang, M.; Qin, B.; Zhou, Y. Photobleaching response of different sources of chromophoric dissolved organic matter exposed to natural solar radiation using absorption and excitation-emission matrix spectra. PLoS ONE 2013, 8, e77515. [Google Scholar]
- Silva, M.P.; Mostafa, S.; McKay, G.; Rosario-Ortiz, F.L.; Teixeira, A.C.S.C. Photochemical fate of amicarbazone in aqueous media: Laboratory measurement and simulations. Environ. Engin. Sci. 2015, 32, 730–740. [Google Scholar] [CrossRef]
- Vione, D. Insights into the time evolution of slowly photodegrading contaminants. Molecules 2021, 26, 5223. [Google Scholar] [CrossRef]
- Yan, S.; Liu, Y.; Lian, L.; Li, R.; Ma, J.; Zhou, H.; Song, W. Photochemical formation of carbonate radical and its reaction with dissolved organic matters. Water Res. 2019, 161, 288–296. [Google Scholar] [CrossRef]
- Del Vecchio, R.; Blough, N.V. On the origin of the optical properties of humic substances. Environ. Sci. Technol. 2004, 38, 3885–3891. [Google Scholar] [CrossRef] [PubMed]
- Carena, L.; Minella, M.; Barsotti, F.; Brigante, M.; Milan, M.; Ferrero, A.; Berto, S.; Minero, C.; Vione, D. Phototransformation of the herbicide propanil in paddy field water. Environ. Sci. Technol. 2017, 51, 2695–2704. [Google Scholar] [CrossRef]
- Canonica, S. Oxidation of aquatic organic contaminants induced by excited triplet states. Chimia 2007, 61, 641–644. [Google Scholar] [CrossRef] [Green Version]
- Kurtz, T.; Zeng, T.; Rosario-Ortiz, F.L. Photodegradation of cyanotoxins in surface waters. Water Res. 2021, 192, 116804. [Google Scholar] [CrossRef]
- Vione, D.; Rosario-Ortiz, F.L. Foreseen effects of climate-impacted scenarios on the photochemical fate of selected cyanotoxins in surface freshwaters. Environ. Sci. Technol. 2021, 55, 10928–10934. [Google Scholar] [CrossRef] [PubMed]
- Buxton, G.V.; Greenstock, C.L.; Helman, P.W.; Ross, A.B. Critical review of rate constants for reactions of hydrated electrons, hydrogen atoms and hydroxyl radicals (·OH/O−) in aqueous solution. J. Phys. Chem. Ref. Data 1988, 17, 513–886. [Google Scholar] [CrossRef] [Green Version]
- Marchetti, G.; Minella, M.; Maurino, V.; Minero, C.; Vione, D. Photochemical transformation of atrazine and formation of photointermediates under conditions relevant to sunlit surface waters: Laboratory measures and modelling. Water Res. 2013, 47, 6211–6222. [Google Scholar] [CrossRef]
- De Laurentiis, E.; Chiron, S.; Kouras-Hadef, S.; Richard, C.; Minella, M.; Maurino, V.; Minero, C.; Vione, D. Photochemical fate of carbamazepine in surface freshwaters: Laboratory measures and modeling. Environ. Sci. Technol. 2012, 46, 8164–8173. [Google Scholar] [CrossRef] [Green Version]
- Minella, M.; Giannakis, S.; Mazzavillani, A.; Maurino, V.; Minero, C.; Vione, D. Phototransformation of Acesulfame K in surface waters: Comparison of two techniques for the measurement of the second-order rate constants of indirect photodegradation, and modelling of photoreaction kinetics. Chemosphere 2017, 186, 185–192. [Google Scholar] [CrossRef]
Disclaimer/Publisher’s Note: The statements, opinions and data contained in all publications are solely those of the individual author (s) and contributor (s) and not of MDPI and/or the editor (s). MDPI and/or the editor (s) disclaim responsibility for any injury to people or property resulting from any ideas, methods, instructions or products referred to in the content. |
Figure 1.
Specific water (CDOM) absorbance A1(λ) = Ao e− S λ (DOC = 1 mgC L−1, 1 cm optical path length), plotted for different values of Ao and the spectral slope S. Note that the measurement units are always [L mgC−1 cm−1] for Ao and [nm−1] for S.
Figure 1.
Specific water (CDOM) absorbance A1(λ) = Ao e− S λ (DOC = 1 mgC L−1, 1 cm optical path length), plotted for different values of Ao and the spectral slope S. Note that the measurement units are always [L mgC−1 cm−1] for Ao and [nm−1] for S.

Figure 2.
APEX-computed values of [3CDOM*] as a function of S [nm−1] and Ao [L mgC−1 cm−1]. Water conditions (reasonable values for aquatic environments [33]): 3 m depth, DOC = 5 mgC L−1, 10−4 M NO3−, 10−6 M NO2−, 10−3 M HCO3−, and 10−5 M CO32−. Irradiation as per fair-weather, spring equinox noon at mid latitude.

Figure 3.
APEX-computed values of [3CDOM*] as a function of varying DOC, with constant Ao = 0.45 L mgC−1 cm−1 and S = 0.015 nm−1. The highlighted points and annotations indicate how the same values of [3CDOM*] were obtained with fixed DOC = 5 mgC L−1 and different values of Ao and S (note that the point with Ao = 0.45 L mgC−1 cm−1, S = 0.015 nm−1, and DOC = 5 mgC L−1 has a different symbol because conditions are exactly the same in both cases). Other water conditions: 3 m depth, 10−4 M NO3−, 10−6 M NO2−, 10−3 M HCO3−, and 10−5 M CO32−. Irradiation as per fair-weather, spring equinox noon at mid-latitude.

Figure 4.
APEX-computed values of (a) [•OH] and (b) [CO3•−] as a function of S for different values of Ao. Water conditions: 3 m depth, DOC = 5 mgC L−1, 10−4 M NO3−, 10−6 M NO2−, 10−3 M HCO3−, and 10−5 M CO32−. Irradiation as per fair-weather, spring equinox noon at mid-latitude.
Figure 4.
APEX-computed values of (a) [•OH] and (b) [CO3•−] as a function of S for different values of Ao. Water conditions: 3 m depth, DOC = 5 mgC L−1, 10−4 M NO3−, 10−6 M NO2−, 10−3 M HCO3−, and 10−5 M CO32−. Irradiation as per fair-weather, spring equinox noon at mid-latitude.

Figure 5.
APEX-computed values of (a) [•OH] and (b) [CO3•−] as a function of S for different values of Ao. Water conditions: 3 m depth, DOC = 5 mgC L−1, 10−6 M NO3−, 10−8 M NO2−, 10−3 M HCO3−, and 10−5 M CO32−. Irradiation as per fair-weather, spring equinox noon at mid-latitude.
Figure 5.
APEX-computed values of (a) [•OH] and (b) [CO3•−] as a function of S for different values of Ao. Water conditions: 3 m depth, DOC = 5 mgC L−1, 10−6 M NO3−, 10−8 M NO2−, 10−3 M HCO3−, and 10−5 M CO32−. Irradiation as per fair-weather, spring equinox noon at mid-latitude.

Figure 6.
APEX-computed values of (a) [•OH] and (b) [CO3•−] as a function of S for different values of Ao. Water conditions: 3 m depth, DOC = 5 mgC L−1, 10−3 M NO3−, 10−5 M NO2−, 10−3 M HCO3−, and 10−5 M CO32−. Irradiation as per fair-weather, spring equinox noon at mid-latitude.
Figure 6.
APEX-computed values of (a) [•OH] and (b) [CO3•−] as a function of S for different values of Ao. Water conditions: 3 m depth, DOC = 5 mgC L−1, 10−3 M NO3−, 10−5 M NO2−, 10−3 M HCO3−, and 10−5 M CO32−. Irradiation as per fair-weather, spring equinox noon at mid-latitude.

Disclaimer/Publisher’s Note: The statements, opinions and data contained in all publications are solely those of the individual author(s) and contributor(s) and not of MDPI and/or the editor(s). MDPI and/or the editor(s) disclaim responsibility for any injury to people or property resulting from any ideas, methods, instructions or products referred to in the content. |
© 2023 by the authors. Licensee MDPI, Basel, Switzerland. This article is an open access article distributed under the terms and conditions of the Creative Commons Attribution (CC BY) license (https://creativecommons.org/licenses/by/4.0/).
Share and Cite
MDPI and ACS Style
Altare, N.; Vione, D. Photochemical Implications of Changes in the Spectral Properties of Chromophoric Dissolved Organic Matter: A Model Assessment for Surface Waters. Molecules 2023, 28, 2664. https://doi.org/10.3390/molecules28062664
AMA Style
Altare N, Vione D. Photochemical Implications of Changes in the Spectral Properties of Chromophoric Dissolved Organic Matter: A Model Assessment for Surface Waters. Molecules. 2023; 28(6):2664. https://doi.org/10.3390/molecules28062664
Chicago/Turabian StyleAltare, Nicole, and Davide Vione. 2023. "Photochemical Implications of Changes in the Spectral Properties of Chromophoric Dissolved Organic Matter: A Model Assessment for Surface Waters" Molecules 28, no. 6: 2664. https://doi.org/10.3390/molecules28062664