

Phytochemical Analysis and Antiproliferative Activity of Ulex gallii Planch. (Fabaceae), a Medicinal Plant from Galicia (Spain)
 , , , ,
  , , and
Abstract
:1. Introduction
2. Results
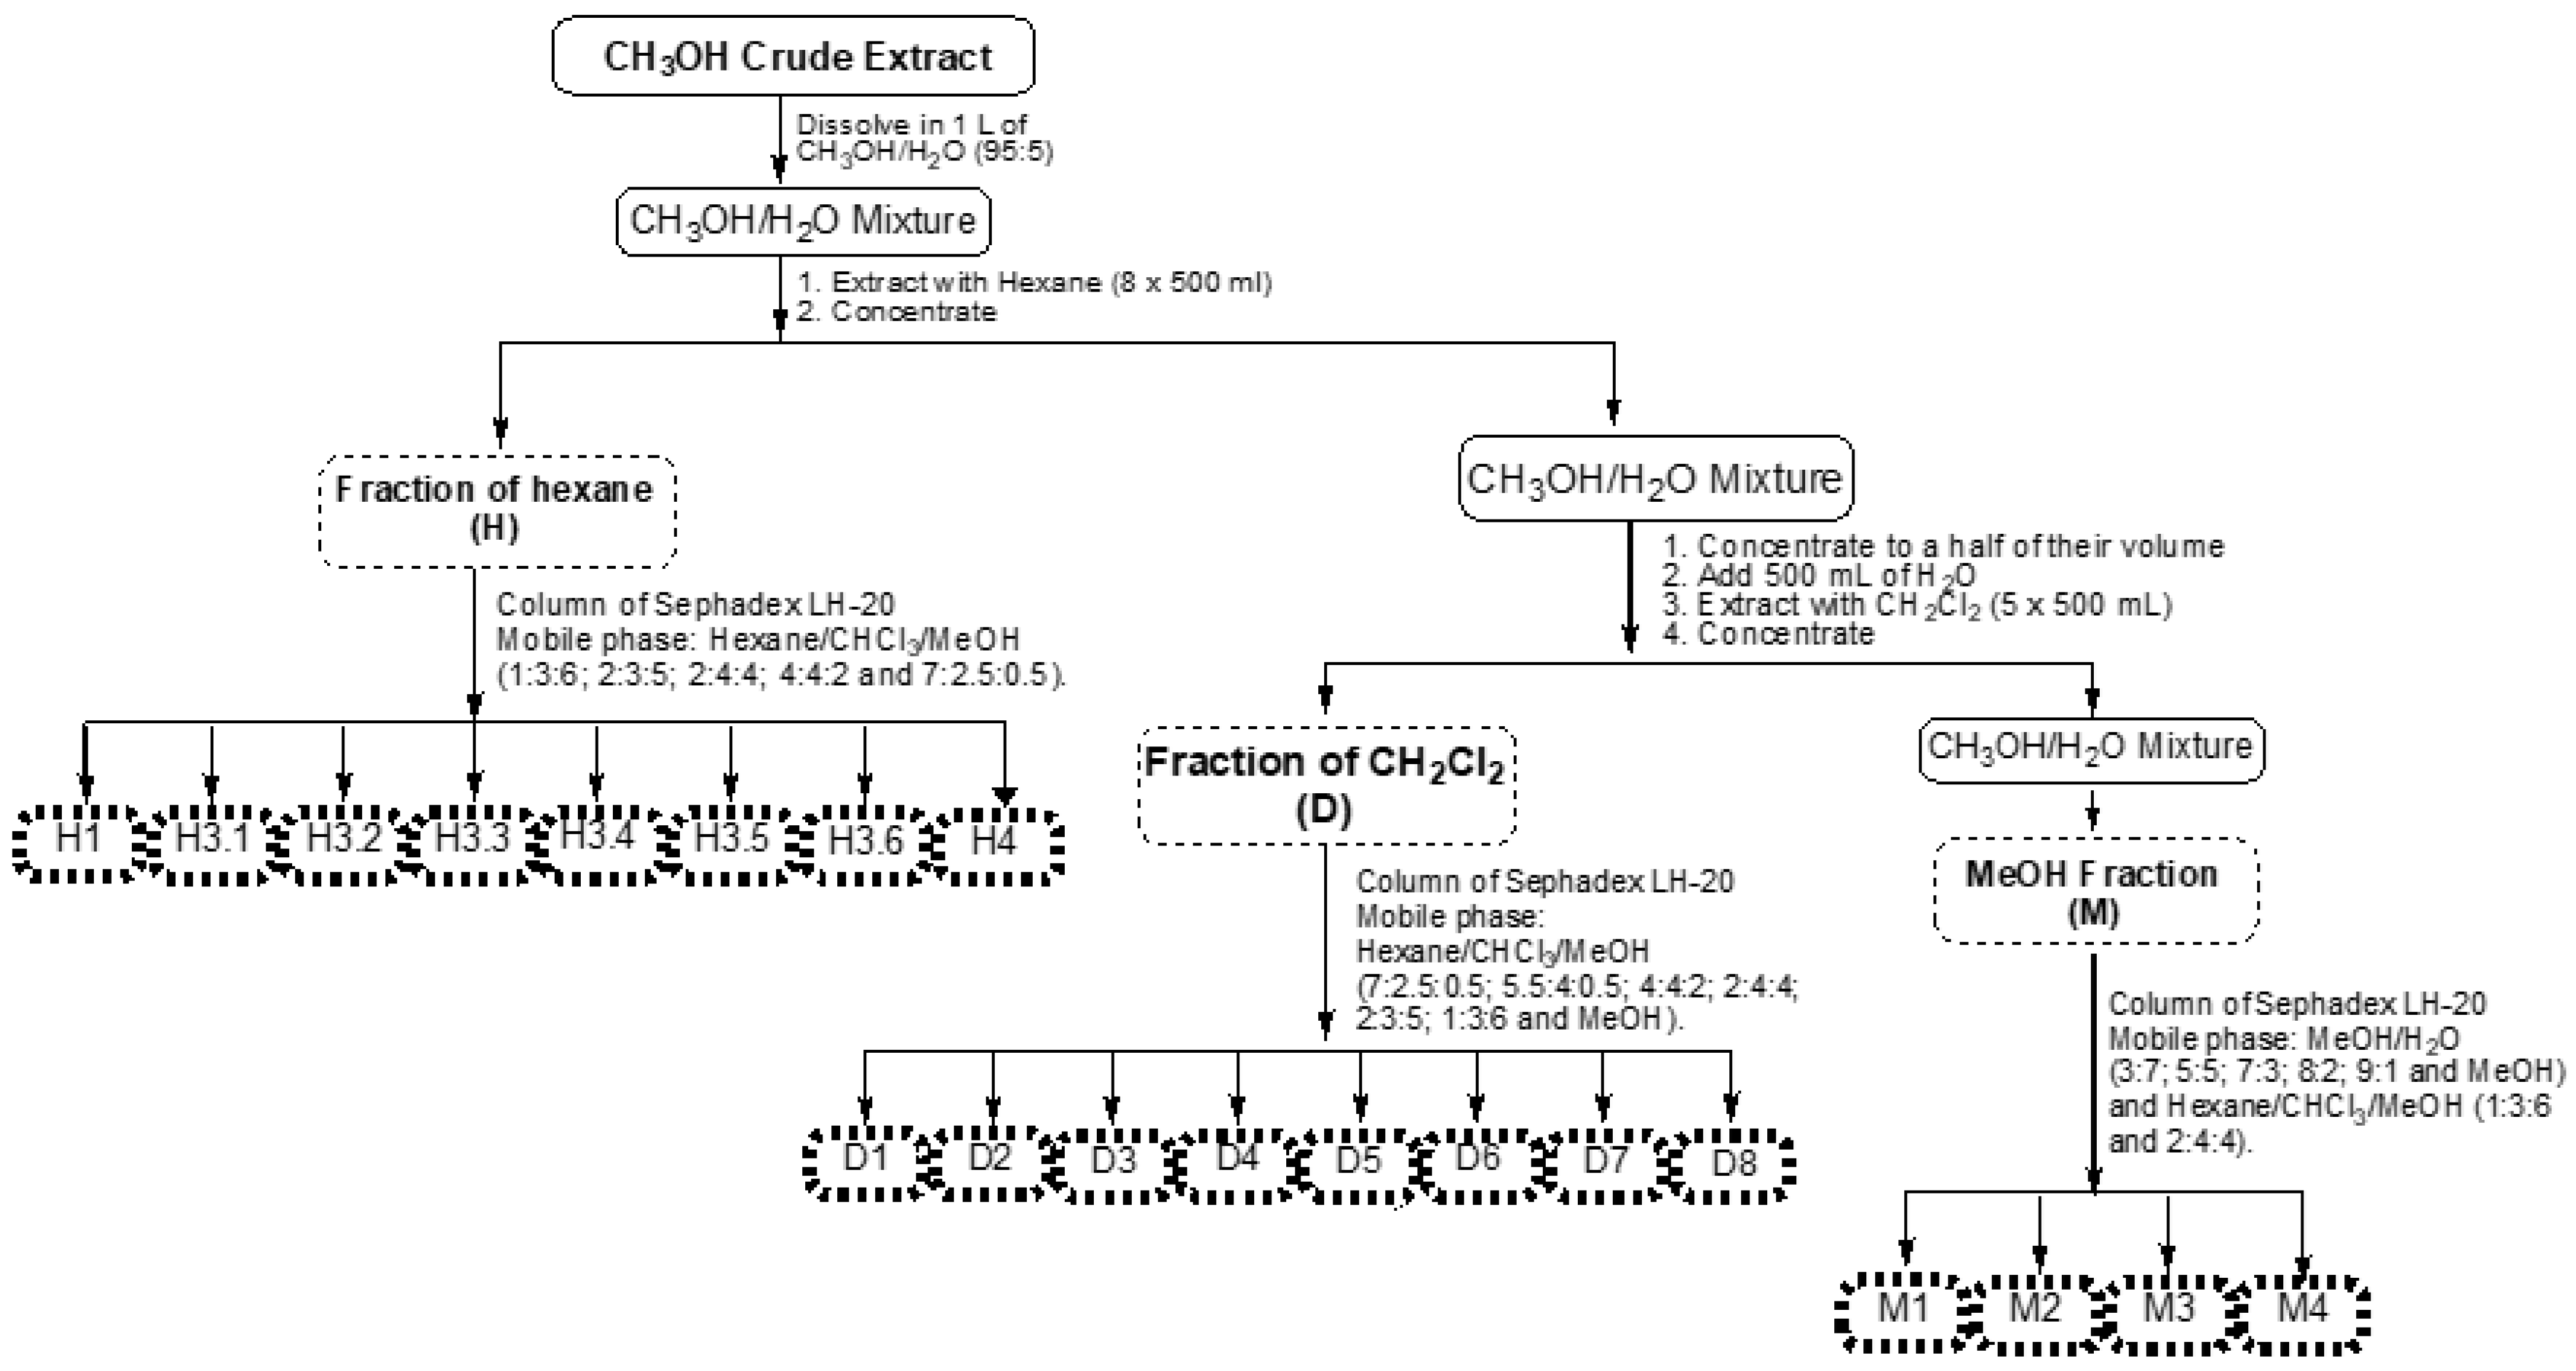
2.1. Extraction Yield
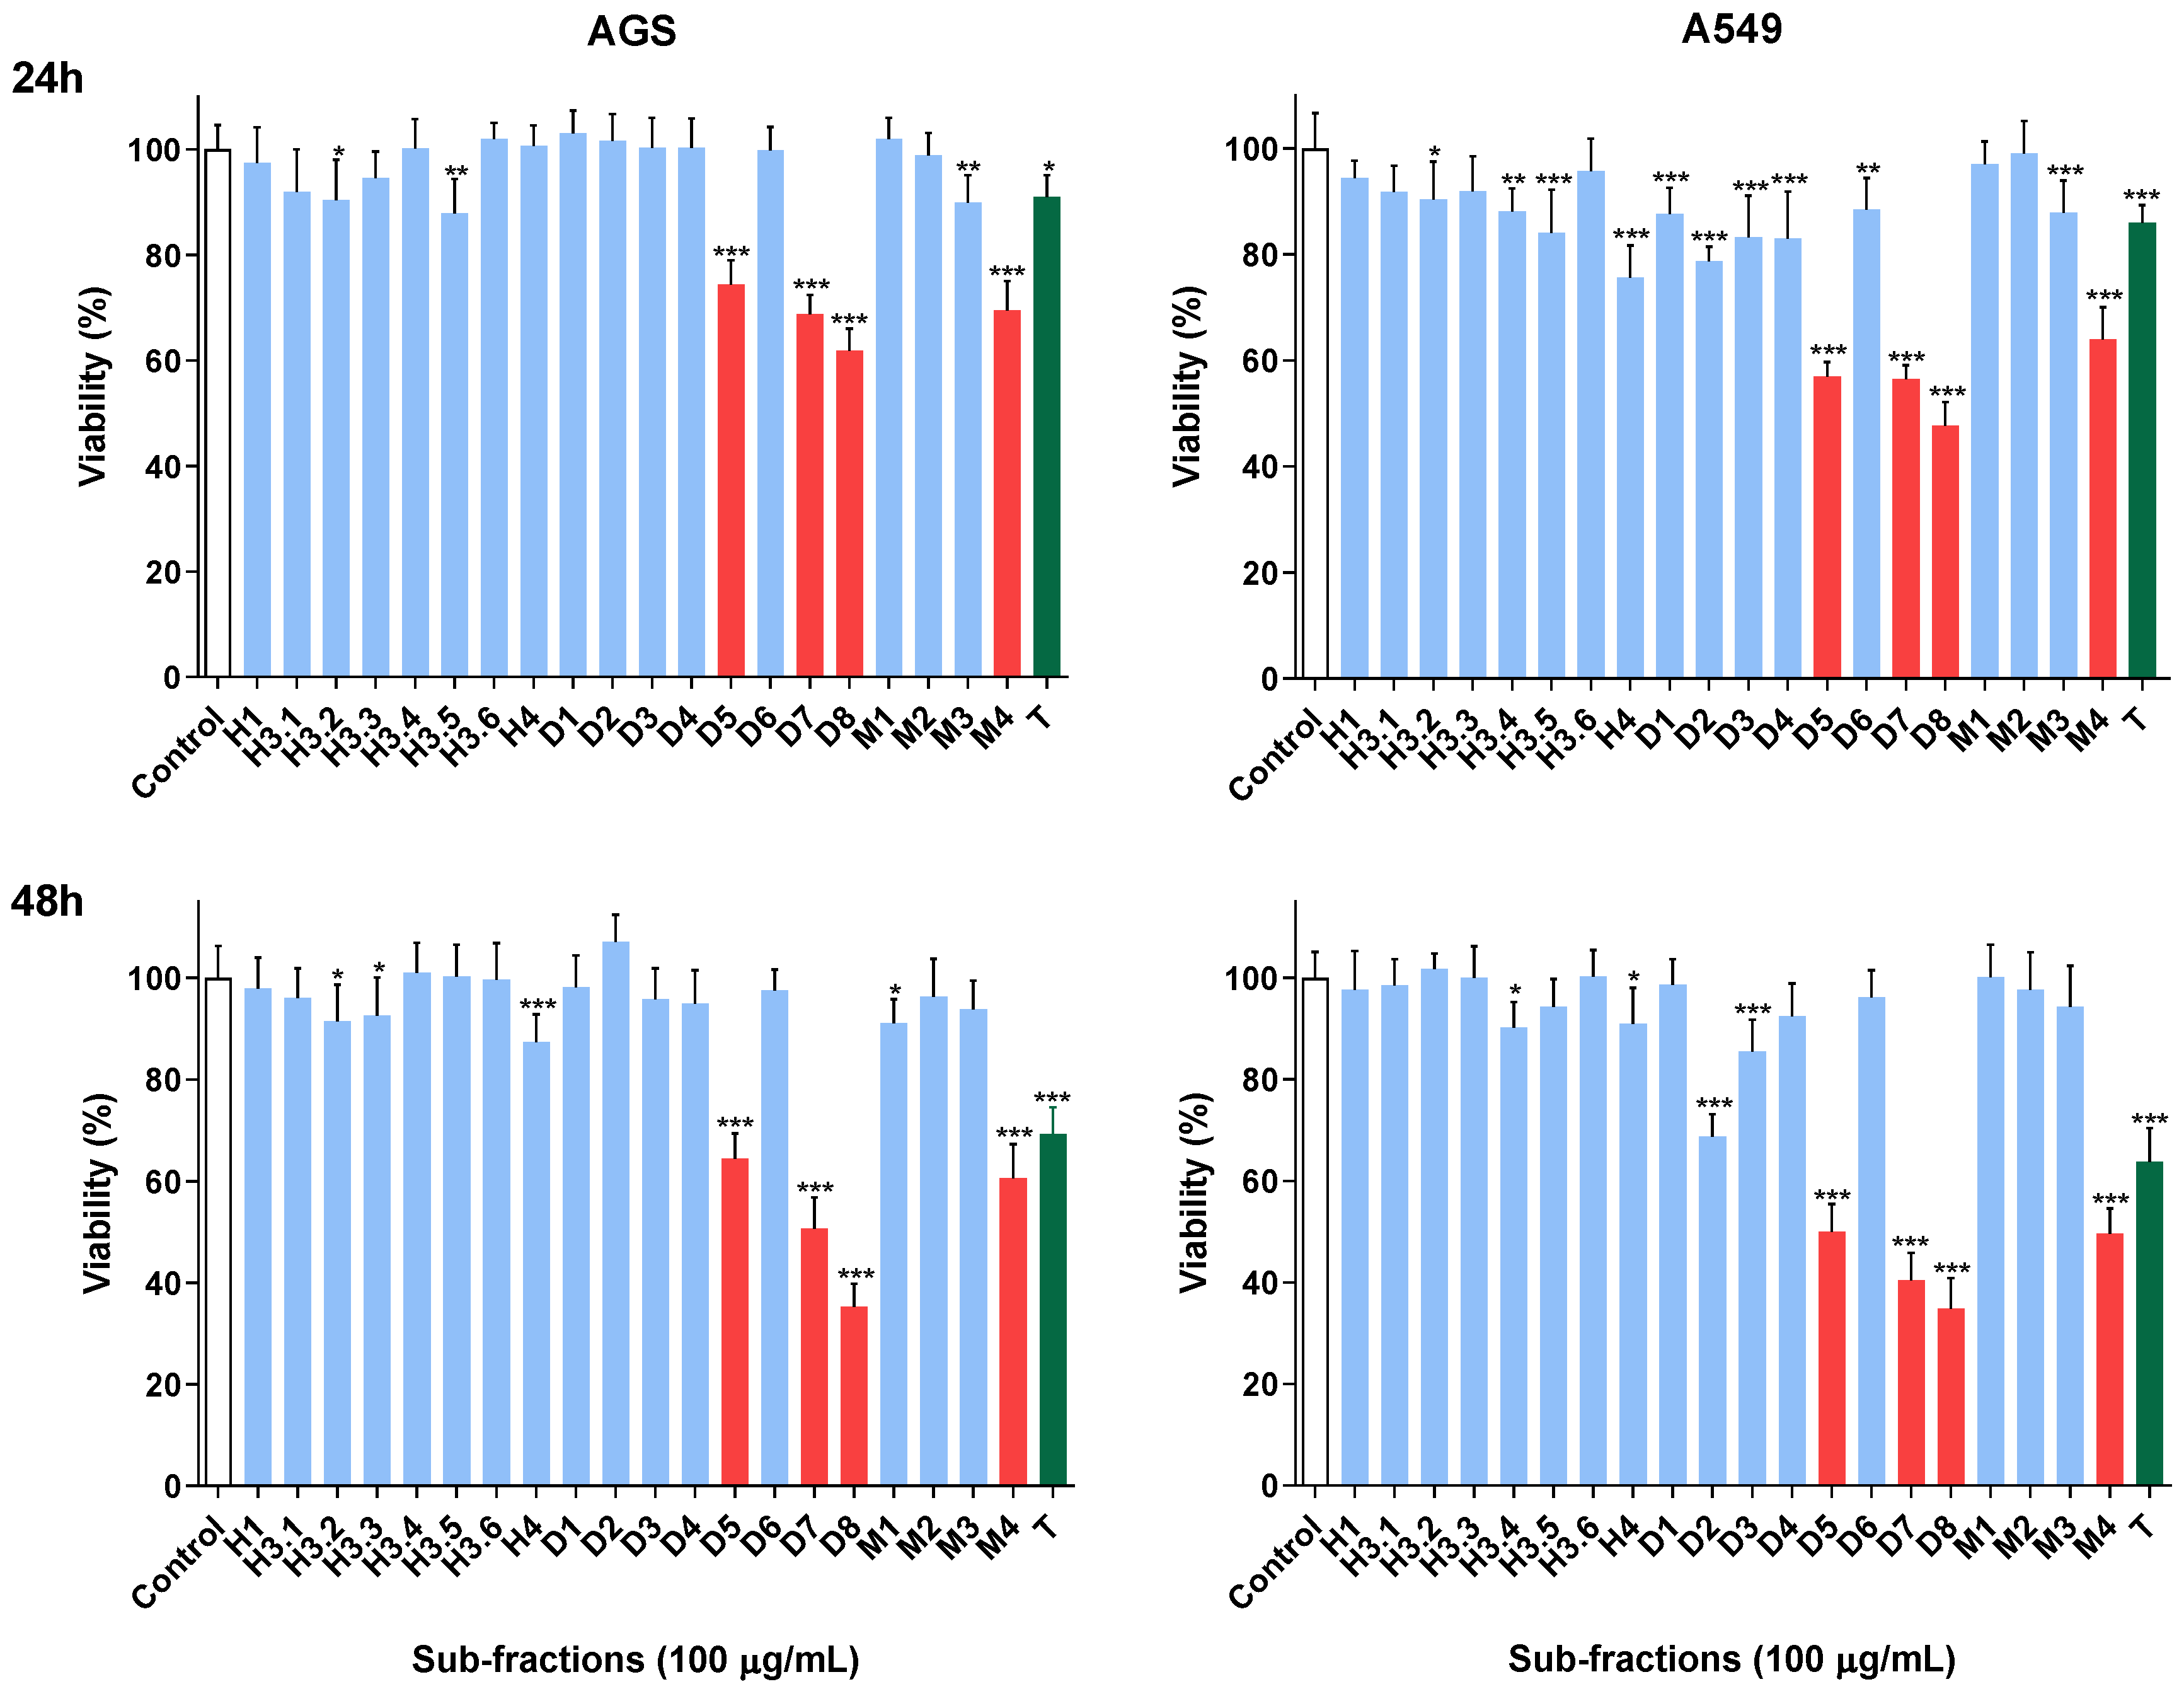
2.2. Viability Assessment
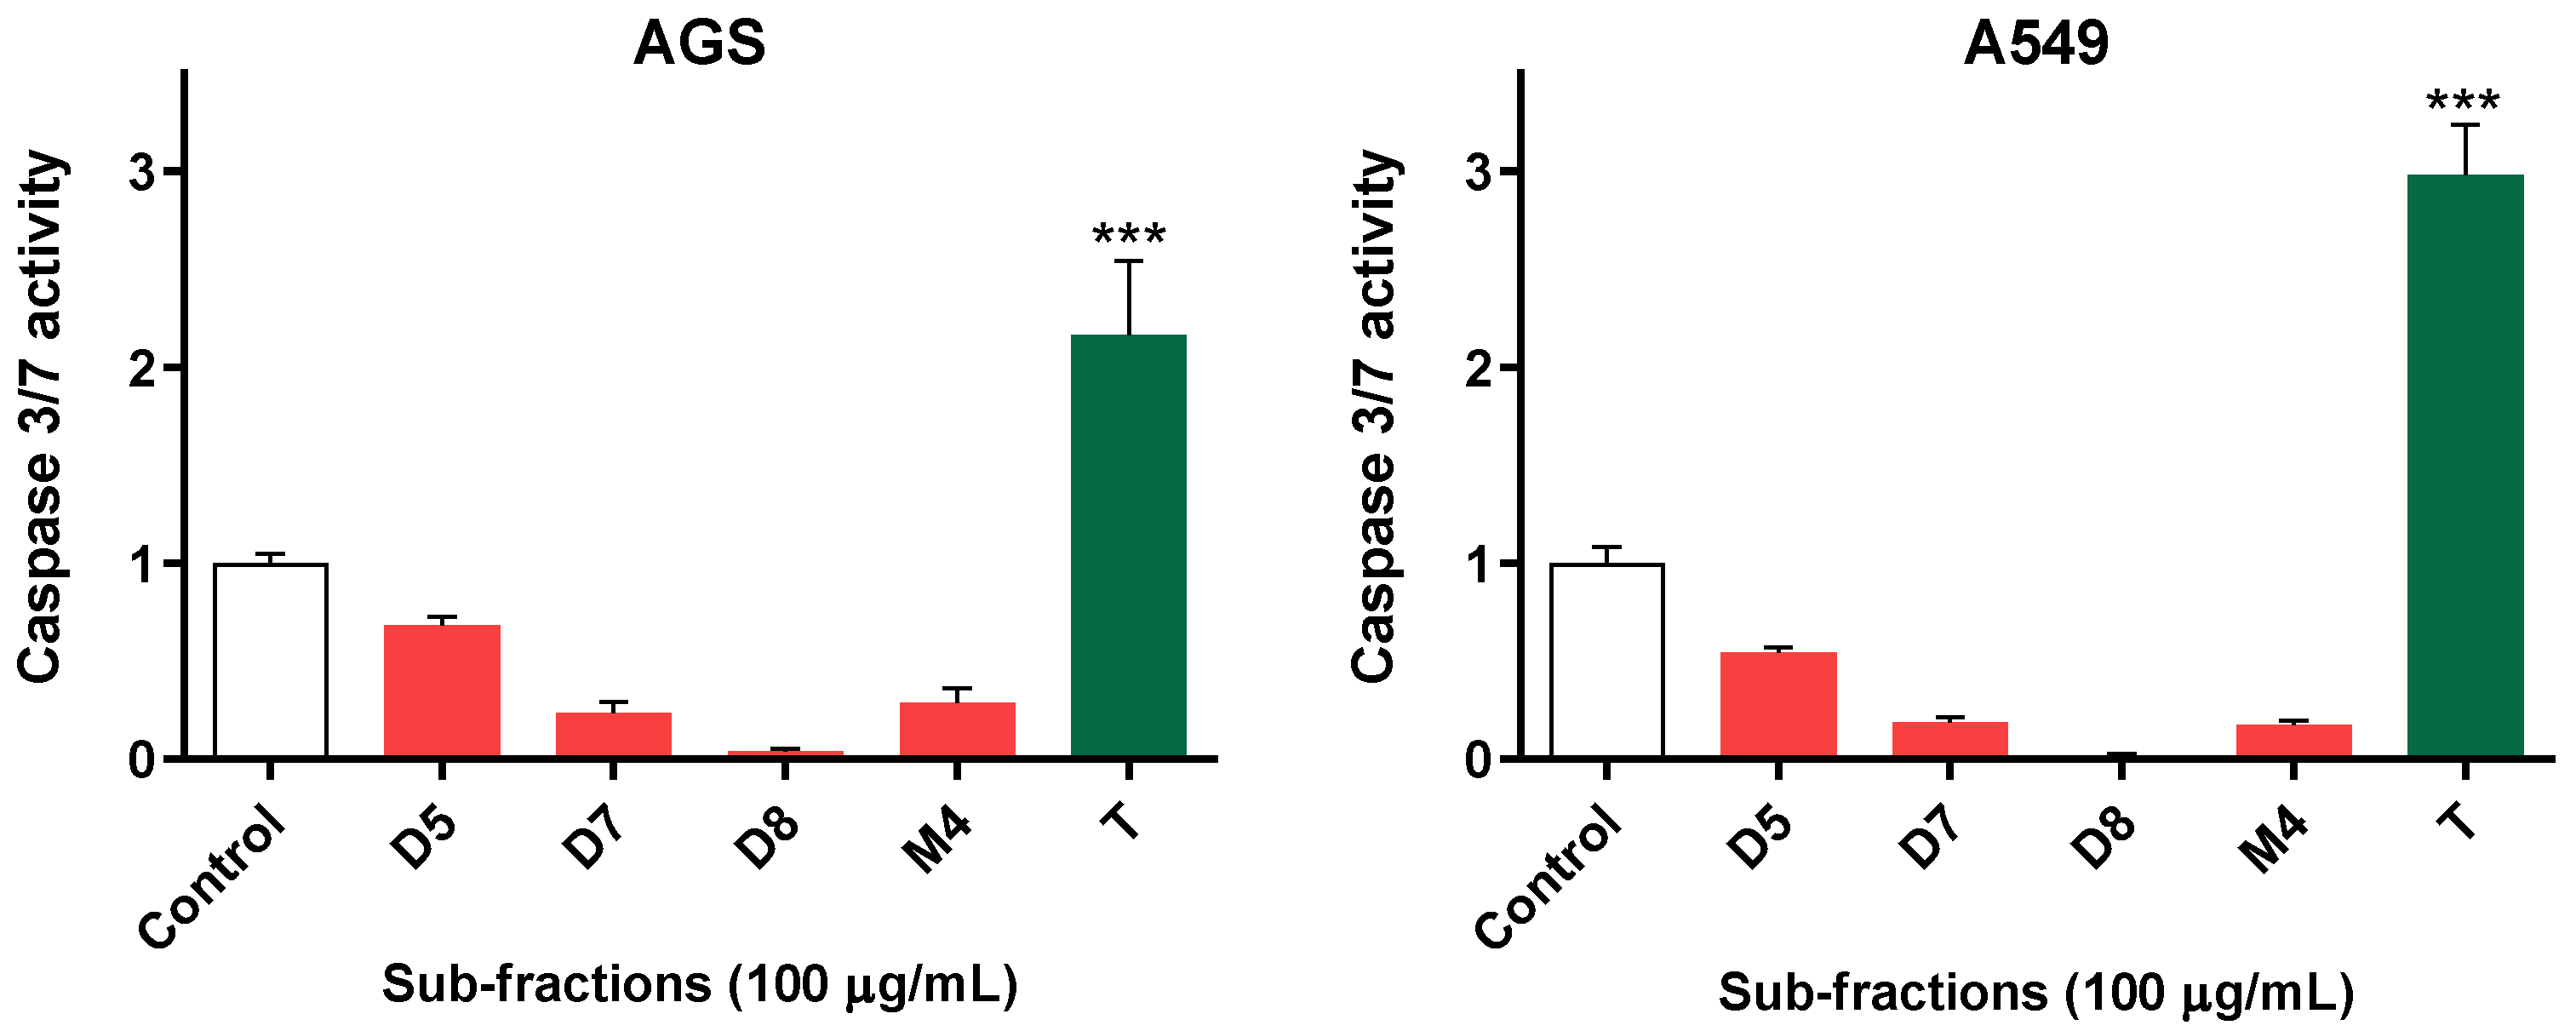
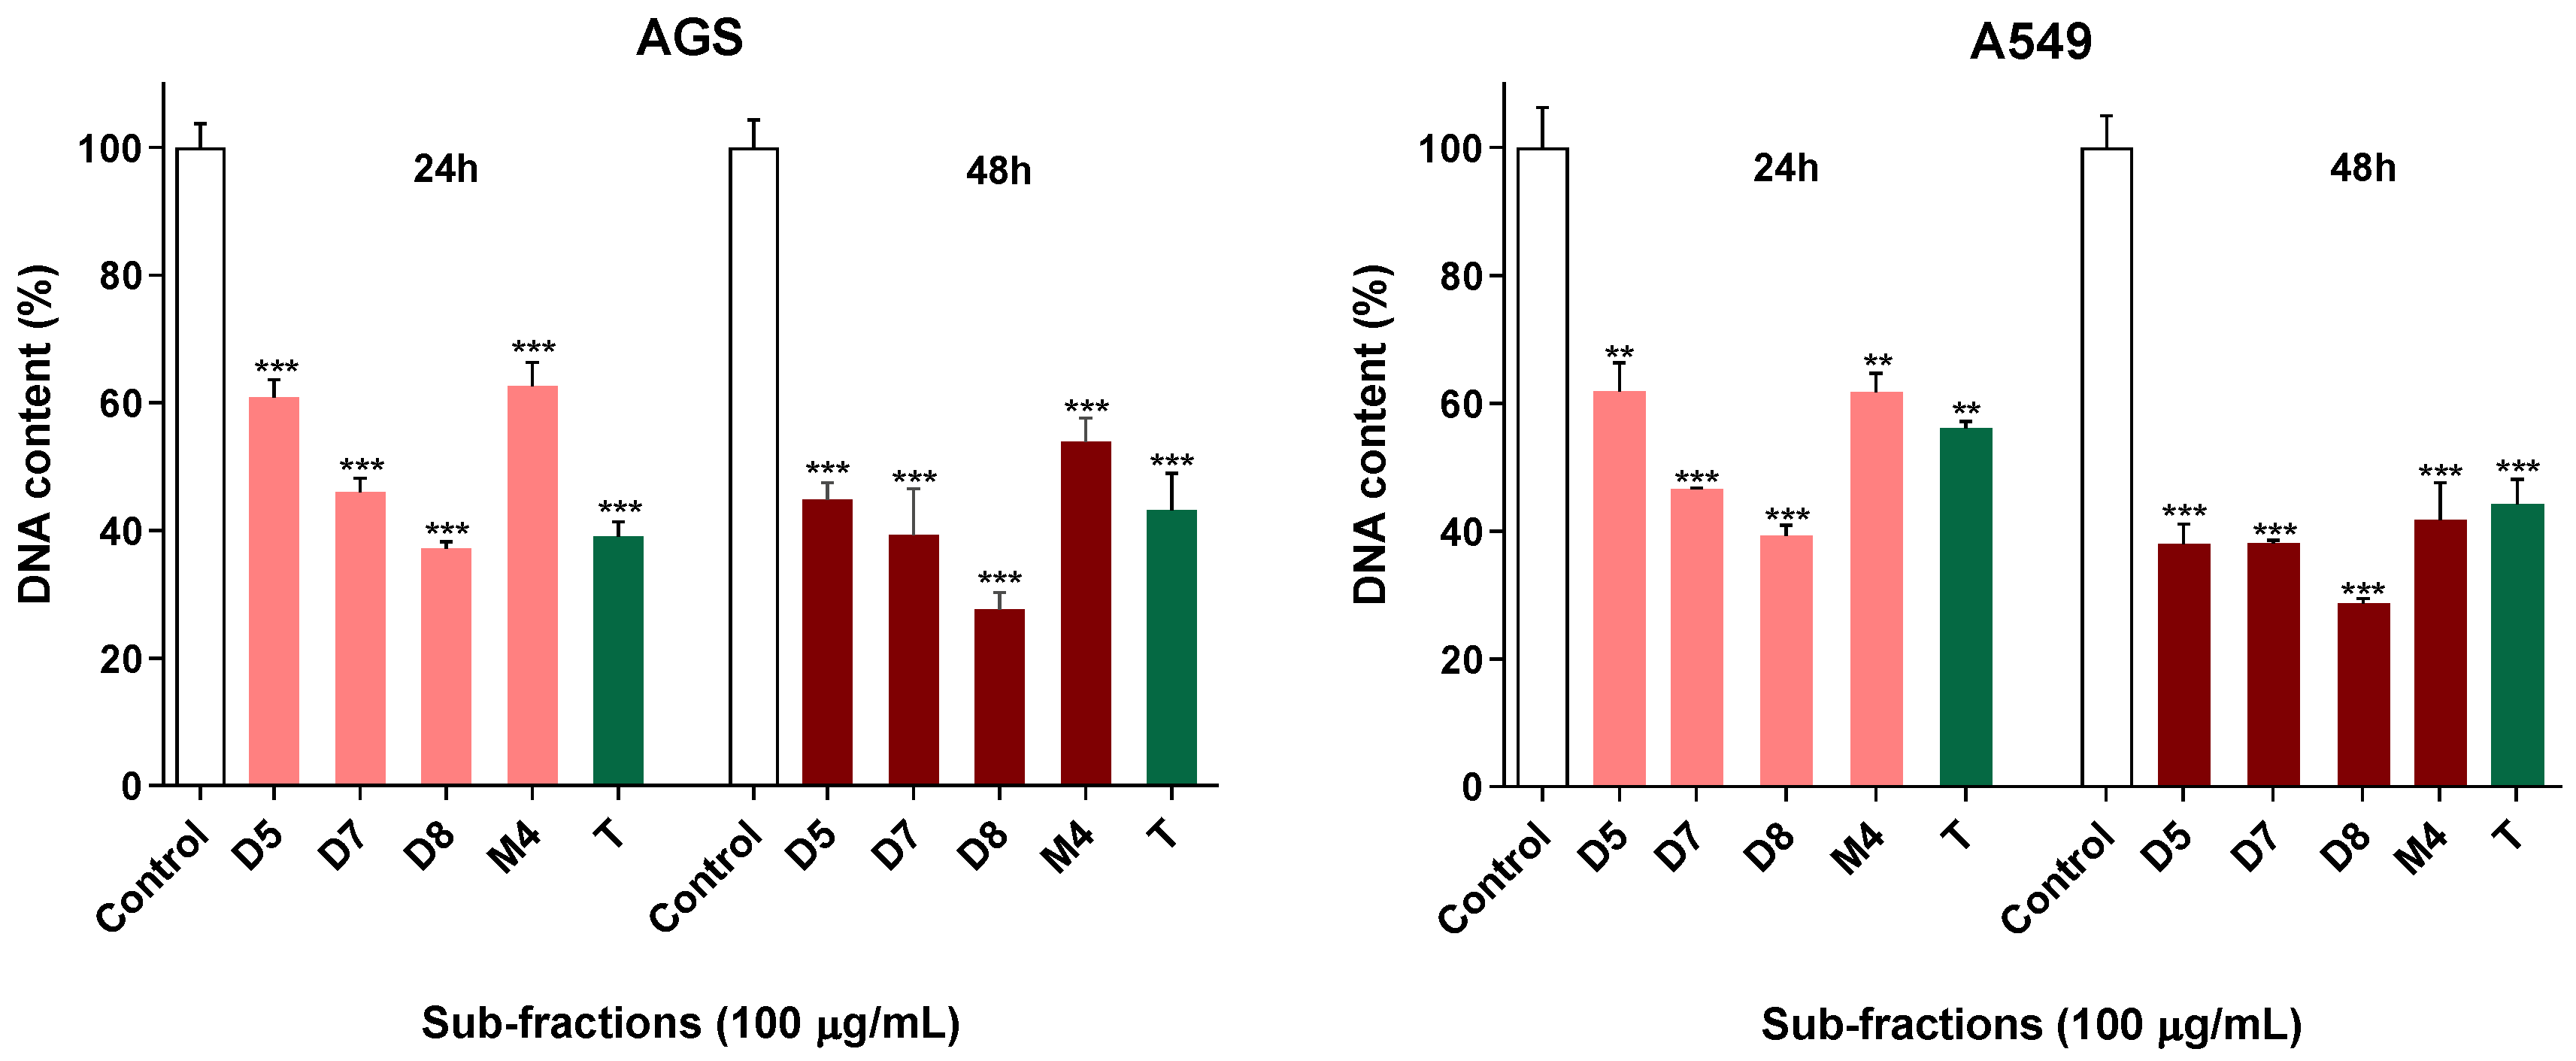
2.3. Active Sub-Fractions Do Not Activate Effector Caspases but Reduce Proliferation
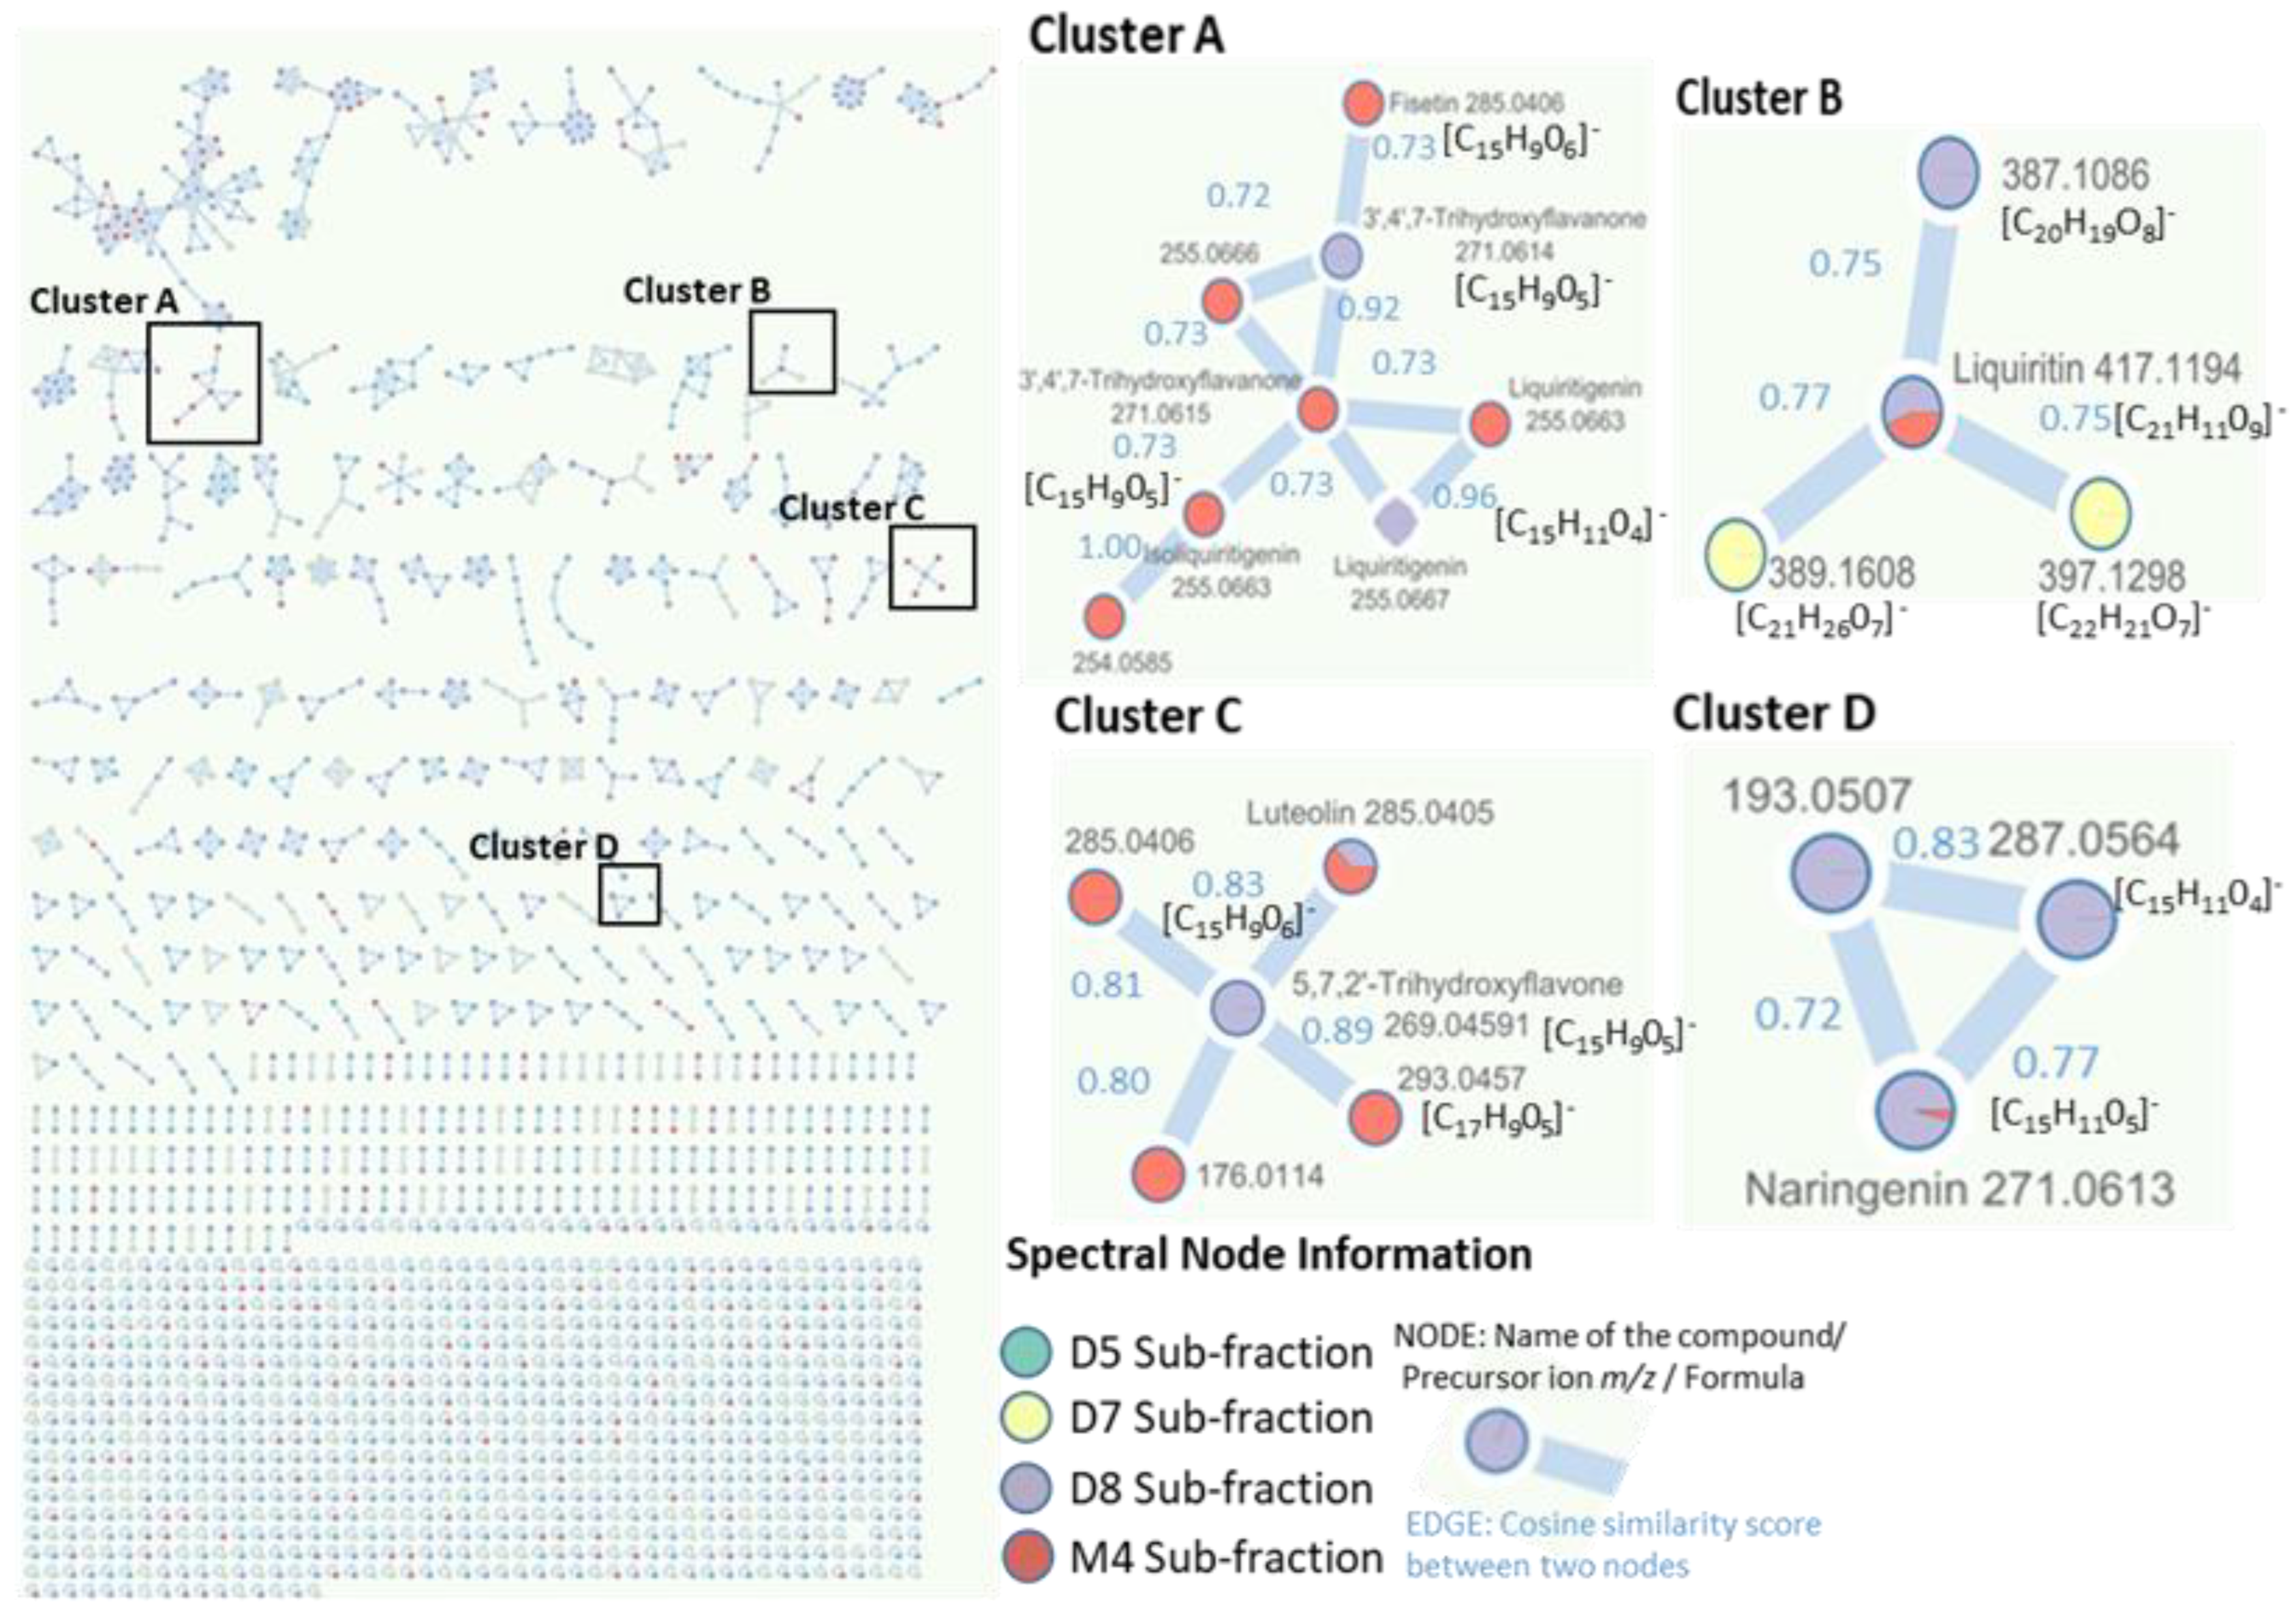
2.4. Identification of Metabolites via UHPLC-QToF Using Targeted/Untargeted Approaches
3. Discussion
4. Materials and Methods
4.1. Chemicals and Reagents
4.2. Plant Material Collection, Preparation of Extract and Fractionation
4.3. Cell Culture
4.4. Determination of Cell Viability
4.5. Caspase-3/7 Activity
4.6. DNA Quantification
4.7. Ultra-High-Performance Liquid Chromatography Quadrupole Time-of-Flight Mass Spectrometry Analysis (UHPLC-QToF)
4.7.1. Targeted Screening
4.7.2. Untargeted Screening
4.8. Statistical Analysis
5. Conclusions
Supplementary Materials
Author Contributions
Funding
Institutional Review Board Statement
Informed Consent Statement
Data Availability Statement
Conflicts of Interest
Sample Availability
References
- Catalá, J.A. Etnobotánica de la Provincia de la Coruña. Ph.D. Thesis, Universitat de València, Valencia, Spain, 2008. [Google Scholar]
- Osorio, M.J.A. Plantas Medicinales: Del uso Tradicional al Criterio Científico. Acte D’ingrés de L’acadèmica a la Reial Acadèmia de Farmàcia de Catalunya; Royal Academy of Pharmacy of Catalonia: Barcelona, Spain, 2010. [Google Scholar]
- Blanco, E.; Macía, M.J.; Morales, R. Medicinal and veterinary plants of El Caurel (Galicia, northwest Spain). J. Ethnopharmacol. 1999, 65, 113–124. [Google Scholar] [CrossRef] [PubMed] [Green Version]
- Blonski, K.; Milde-Langosch, K.; Bamberger, A.-M.; Osterholz, T.; Utler, C.; Berger, J.; Löning, T.; Schumacher, U. Ulex europeus agglutinin-I binding as a potential prognostic marker in ovarian cancer. Anticancer Res. 2007, 27, 2785–2790. [Google Scholar] [PubMed]
- Stephenson, T.J.; Griffiths, D.W.R.; Mills, P.M. Comparison of Ulex europaeus I lectin binding and factor VIII-related antigen as markers of vascular endothelium in follicular carcinoma of the thyroid. Histopathology 1986, 10, 251–260. [Google Scholar] [CrossRef] [PubMed]
- Syed, P.; Gidwani, K.; Kekki, H.; Leivo, J.; Pettersson, K.; Lamminmäki, U. Role of lectin microarrays in cancer diagnosis. Proteomics 2016, 16, 1257–1265. [Google Scholar] [CrossRef] [PubMed]
- Pirofsky, B.; Ingebo, K.R.; Hefeneider, S.H. Noncytotoxic inhibition of malignant cell growth by Ulex seed extracts. J. Biol. Response Modif. 1983, 2, 175–185. [Google Scholar]
- Ralph, P.; Nakoinz, I. Inhibitory effects of lectins and lymphocyte mitogens on murine lymphomas and myelomas. Gynecol. Oncol. 1973, 51, 883–890. [Google Scholar] [CrossRef]
- Calderón-Montaño, J.M.; Martínez-Sánchez, S.M.; Jiménez-González, V.; Burgos-Morón, E.; Guillén-Mancina, E.; Jiménez-Alonso, J.J.; Díaz-Ortega, P.; García, F.; Aparicio, A.; López-Lázaro, M. Screening for selective anticancer activity of 65 extracts of plants collected in Western Andalusia, Spain. Plants 2021, 10, 2193. [Google Scholar] [CrossRef]
- Spínola, V.; Llorent-Martínez, E.J.; Gouveia-Figueira, S.; Castilho, P.C. Ulex europaeus: From noxious weed to source of valuable isoflavones and flavanones. Ind. Crop. Prod. 2016, 90, 9–27. [Google Scholar] [CrossRef]
- Veitch, N.C. Isoflavonoids of the Leguminosae. Nat. Prod. Rep. 2007, 24, 417–464. [Google Scholar] [CrossRef]
- Abotaleb, M.; Samuel, S.M.; Varghese, E.; Varghese, S.; Kubatka, P.; Liskova, A.; Büsselberg, D. Flavonoids in cancer and apoptosis. Cancers 2018, 11, 28. [Google Scholar] [CrossRef] [Green Version]
- Salem, M.A.; de Souza, L.P.; Serag, A.; Fernie, A.R.; Farag, M.A.; Ezzat, S.M.; Alseekh, S. Metabolomics in the context of plant natural products research: From sample preparation to metabolite analysis. Metabolites 2020, 10, 37. [Google Scholar] [CrossRef] [PubMed]
- Peñaloza, E.; Holandino, C.; Scherr, C.; Araujo, P.; Borges, R.; Urech, K.; Baumgartner, S.; Garrett, R. Comprehensive metabolome analysis of fermented aqueous extracts of Viscum album L. by liquid chromatography-high resolution tandem mass spectrometry. Molecules 2020, 25, 4006. [Google Scholar] [CrossRef] [PubMed]
- Ben Hassine, A.; Rocchetti, G.; Zhang, L.; Senizza, B.; Zengin, G.; Mahomoodally, M.; Ben-Attia, M.; Rouphael, Y.; Lucini, L.; El-Bok, S. Untargeted phytochemical profile, antioxidant capacity and enzyme inhibitory activity of cultivated and wild lupin seeds from Tunisia. Molecules 2021, 26, 3452. [Google Scholar] [CrossRef] [PubMed]
- da Silva, M.A.C.N.; Costa, J.H.; Pacheco-Fill, T.; Ruiz, A.; Vidal, F.; Borges, K.; Guimarães, S.; Azevedo-Santos, A.; Buglio, K.; Foglio, M.; et al. Açai (Euterpe oleracea mart.) seed extract induces ros production and cell death in mcf-7 breast cancer cell line. Molecules 2021, 26, 3546. [Google Scholar] [CrossRef] [PubMed]
- Ferlay, J.; Colombet, M.; Soerjomataram, I.; Parkin, D.M.; Piñeros, M.; Znaor, A.; Bray, F. Cancer statistics for the year 2020: An overview. Int. J. Cancer 2021, 149, 778–789. [Google Scholar] [CrossRef]
- Galluzzi, L.; Vitale, I.; Aaronson, S.A.; Abrams, J.M.; Adam, D.; Agostinis, P.; Alnemri, E.S.; Altucci, L.; Amelio, I.; Andrews, D.W.; et al. Molecular mechanisms of cell death: Recommendations of the Nomenclature Committee on Cell Death 2018. Cell Death Differ. 2018, 25, 486–541. [Google Scholar] [CrossRef]
- Zhao, W.; Shang, Z.; Li, Q.; Huang, M.; He, W.; Wang, Z.; Zhang, J. Rapid screening and identification of daidzein metabolites in rats based on UHPLC-LTQ-orbitrap mass spectrometry coupled with data-mining technologies. Molecules 2018, 23, 151. [Google Scholar] [CrossRef] [Green Version]
- Zhao, X.; Zhang, S.; Liu, D.; Yang, M.; Wei, J. Analysis of flavonoids in dalbergia odorifera by ultra-performance liquid chromatography with tandem mass spectrometry. Molecules 2020, 25, 389. [Google Scholar] [CrossRef] [Green Version]
- Human Metabolome Database. Available online: https://hmdb.ca/spectra/ms_ms/148638 (accessed on 8 June 2021).
- MoNA-MassBank of North America. Available online: https://mona.fiehnlab.ucdavis.edu/spectra/display/RIKENPlaSMA005697 (accessed on 8 June 2021).
- Kramberger, K.; Barlič-Maganja, D.; Bandelj, D.; Arbeiter, A.B.; Peeters, K.; Višnjevec, A.M.; Pražnikar, Z.J. HPLC-DAD-ESI-QToF-MS determination of bioactive compounds and antioxidant activity comparison of the hydroalcoholic and water extracts from two Helichrysum italicum species. Metabolites 2020, 10, 403. [Google Scholar] [CrossRef]
- Song, K.; Oh, J.-H.; Lee, M.Y.; Lee, S.-G.; Ha, I.J. Molecular network-guided alkaloid profiling of aerial parts of Papaver nudicaule L. Using LC-HRMS. Molecules 2020, 25, 2636. [Google Scholar] [CrossRef]
- Zhivotovsky, B.; Orrenius, S. Calcium and cell death mechanisms: A perspective from the cell death community. Cell Calcium 2011, 50, 211–221. [Google Scholar] [CrossRef]
- Mori, H.; Sugie, S.; Yoshimi, N.; Hara, A.; Tanaka, T. Control of cell proliferation in cancer prevention. Mutat. Res.-Fundam. Mol. Mech. Mutagen. 1999, 428, 291–298. [Google Scholar] [CrossRef]
- Quent, V.M.; Loessner, D.; Friis, T.E.; Reichert, J.C.; Hutmacher, D.W. Discrepancies between metabolic activity and DNA content as tool to assess cell proliferation in cancer research. J. Cell. Mol. Med. 2010, 14, 1003–1013. [Google Scholar] [CrossRef] [PubMed] [Green Version]
- Ng, K.W.; Leong, D.T.; Hutmacher, D.W. The challenge to measure cell proliferation in two and three dimensions. Tissue Eng. 2005, 11, 182–191. [Google Scholar] [CrossRef] [PubMed]
- Romero, J.C.T.; Torres, M.J.O.; Pinzón, D.M.R.; Infante-Betancour, J.A.; Mejía, L.Y.L. Identificación de ácidos grasos y compuestos fenólicos de los aceites extraídos a partir de semillas de Ulex europaeus. RIAA 2017, 8, 71–77. [Google Scholar] [CrossRef] [Green Version]
- Schön, K. Studies on carotenoids: An isomeride of lutein isolated from the furze (Ulex europaeus). Biochem. J. 1936, 30, 1960–1965. [Google Scholar] [CrossRef]
- Máximo, P.; Lourenço, A.; Feio, S.S.; Roseiro, J.C. Flavonoids from Ulex species. Z. Naturforsch. C J. Biosci. 2000, 55, 506–510. [Google Scholar] [CrossRef] [Green Version]
- Máximo, P.; Lourenço, A. A pterocarpan from Ulex parviflorus. Phytochemistry 1998, 48, 359–362. [Google Scholar] [CrossRef]
- Máximo, P.; Lourenço, A. New Quinolizidine Alkaloids from Ulex jussiaei. J. Nat. Prod. 2000, 63, 201–204. [Google Scholar] [CrossRef]
- Tsugawa, H.; Cajka, T.; Kind, T.; Ma, Y.; Higgins, B.; Ikeda, K.; Kanazawa, M.; VanderGheynst, J.; Fiehn, O.; Arita, M. MS-DIAL: Data-independent MS/MS deconvolution for comprehensive metabolome analysis. Nat. Methods 2015, 12, 523–526. [Google Scholar] [CrossRef]
- Wen, L.; Zhou, T.; Jiang, Y.; Chang, S.K.; Yang, B. Prenylated flavonoids in foods and their applications on cancer prevention. Crit. Rev. Food Sci. Nutr. 2021, 62, 5067–5080. [Google Scholar] [CrossRef] [PubMed]
- Ahmed, S.A.; Kamel, E.M. Cytotoxic activities of flavonoids from Centaurea scoparia. Sci. World J. 2014, 2014, 274207. [Google Scholar] [CrossRef] [PubMed] [Green Version]
- Wu, P.-L.; Hsu, Y.-L.; Zao, C.-W.; Damu, A.G.; Wu, T.-S. Constituents of Vittaria anguste-elongata and their biological activities. J. Nat. Prod. 2005, 68, 1180–1184. [Google Scholar] [CrossRef] [PubMed]
- Kao, S.-J.; Lee, W.-J.; Chang, J.-H.; Chow, J.-M.; Chung, C.-L.; Hung, W.-Y.; Chien, M.-H. Suppression of reactive oxygen species-mediated ERK and JNK activation sensitizes dihydromyricetin-induced mitochondrial apoptosis in human non-small cell lung cancer. Environ. Toxicol. 2017, 32, 1426–1438. [Google Scholar] [CrossRef]
- Li, C.-H.; Ding, H.; Shi, J.-L.; Huang, B.; Ding, H.; Lin, H.-G.; Zeng, J.-C.; Zhao, Y.; Luo, G.-Q. Dihydromyricetin promotes apoptosis, suppresses proliferation and tumor necrosis factor-α-mediated nuclear factor kappa-B activation in nasopharyngeal carcinoma CNE-2 cell. J. Tradit. Chin. Med. 2021, 41, 367–375. [Google Scholar] [CrossRef]
- Molčanová, L.; Janošíková, D.; Dall´acqua, S.; Šmejkal, K. C-prenylated flavonoids with potential cytotoxic activity against solid tumor cell lines. Phytochem. Rev. 2019, 18, 1051–1100. [Google Scholar] [CrossRef]
- Yoon, K.H.; Park, K.J.; Yin, J.; Lee, J.Y.; Hwang, Y.J.; Lee, D.I.; Choi, Y.W.; Lee, M.W. Antioxidative and Antitumor Effects of Isoflavones Isolated from the Leaves of Maackia fauriei. Rec. Nat. Prod. 2016, 10, 441. [Google Scholar]
- Liu, J.; Song, C.; Liang, Z.; Long, X.; Guo, M.; Xu, J. Licoflavanone exerts anticancer effects on human nasopharyngeal cancer cells via caspase activation, suppression of cell migration and invasion, and inhibition of m-TOR/PI3K/AKT pathway. Trop. J. Pharm. Res. 2021, 20, 1387–1393. [Google Scholar] [CrossRef]
- Tay, K.-C.; Tan, L.T.-H.; Chan, C.K.; Hong, S.L.; Chan, K.G.; Yap, W.H.; Pusparajah, P.; Lee, L.-H.; Goh, B.-H. Formononetin: A review of its anticancer potentials and mechanisms. Front. Pharmacol. 2019, 10, 820. [Google Scholar] [CrossRef] [Green Version]
- Tuli, H.S.; Tuorkey, M.J.; Thakral, F.; Sak, K.; Kumar, M.; Sharma, A.K.; Sharma, U.; Jain, A.; Aggarwal, V.; Bishayee, A. Molecular mechanisms of action of genistein in cancer: Recent advances. Front. Pharmacol. 2019, 10, 1336. [Google Scholar] [CrossRef] [Green Version]
- Choi, E.J.; Kim, G.-H. Antiproliferative activity of daidzein and genistein may be related to ERα/c-erbB-2 expression in human breast cancer cells. Mol. Med. Rep. 2013, 7, 781–784. [Google Scholar] [CrossRef] [PubMed] [Green Version]
- Yang, Y.; Zang, A.; Jia, Y.; Shang, Y.; Zhang, Z.; Ge, K.; Zhang, J.; Fan, W.; Wang, B. Genistein inhibits A549 human lung cancer cell proliferation via miR-27a and MET signaling. Oncol. Lett. 2016, 12, 2189–2193. [Google Scholar] [CrossRef] [PubMed]
- Lee, S.M.; Kwon, J.I.; Choi, Y.H.; Eom, H.S.; Chi, G.Y. Induction of G2/M arrest and apoptosis by water extract of Strychni Semen in human gastric carcinoma AGS cells. Phytotherapy Res. 2008, 22, 752–758. [Google Scholar] [CrossRef]
- Liang, F.; Zhang, H.; Gao, H.; Cheng, D.; Zhang, N.; Du, J.; Yue, J.; Du, P.; Zhao, B.; Yin, L. Liquiritigenin decreases tumorigenesis by inhibiting DNMT activity and increasing BRCA1 transcriptional activity in triple-negative breast cancer. Exp. Biol. Med. 2021, 246, 459–466. [Google Scholar] [CrossRef]
- Raha, S.; Yumnam, S.; Hong, G.E.; Lee, H.J.; Saralamma, V.V.G.; Park, H.-S.; Heo, J.D.; Lee, S.J.; Kim, E.H.; Kim, J.-A.; et al. Naringin induces autophagy-mediated growth inhibition by downregulating the PI3K/Akt/mTOR cascade via activation of MAPK pathways in AGS cancer cells. Int. J. Oncol. 2015, 47, 1061–1069. [Google Scholar] [CrossRef] [Green Version]
- Lu, W.-L.; Yu, C.-T.R.; Lien, H.-M.; Sheu, G.-T.; Cherng, S.-H. Cytotoxicity of naringenin induces Bax-mediated mitochondrial apoptosis in human lung adenocarcinoma A549 cells. Environ. Toxicol. 2020, 35, 1386–1394. [Google Scholar] [CrossRef] [PubMed]
- Ackland, M.L.; Van De Waarsenburg, S.; Jones, R. Synergistic antiproliferative action of the flavonols quercetin and kaempferol in cultured human cancer cell lines. Vivo 2005, 19, 69–76. [Google Scholar]
- He, S.-H.; Liu, H.-G.; Zhou, Y.-F.; Yue, Q.-F. Liquiritin (LT) exhibits suppressive effects against the growth of human cervical cancer cells through activating Caspase-3 in vitro and xenograft mice in vivo. Biomed. Pharmacother. 2017, 92, 215–228. [Google Scholar] [CrossRef]
- Zhang, Y.; Yan, G.; Sun, C.; Li, H.; Fu, Y.; Xu, W. Apoptosis effects of dihydrokaempferol isolated from Bauhinia championii on synoviocytes. Evid.-Based Complement. Altern. Med. 2018, 2018, 9806160. [Google Scholar] [CrossRef] [Green Version]
- Zeng, N.; Qiu, H.; Wu, M.; Xu, Y.; Wang, H.-P.; Zhan, Y. Anti-cancer effect of dihydrokaempferol in human malignant melanoma cell is mediated via inhibition of cell migration and invasion and up-regulation of NF-kB/MAPK signalling pathways. Bangladesh J. Pharmacol. 2016, 11, 810. [Google Scholar] [CrossRef]
- Costa-Lotufo, L.V.; Jimenez, P.C.; Wilke, D.V.; Leal, L.K.; Cunha, G.M.A.; Silveira, E.R.; Canuto, K.M.; Viana, G.S.B.; Moraes, M.E.A.; de Moraes, M.O.; et al. Antiproliferative effects of several compounds isolated from Amburana cearensis A. C. Smith. Z. Naturforsch. C J. Biosci. 2003, 58, 675–680. [Google Scholar] [CrossRef] [PubMed]
- Wu, B.; Zhang, Q.; Shen, W.; Zhu, J. Anti-proliferative and chemosensitizing effects of luteolin on human gastric cancer AGS cell line. Mol. Cell. Biochem. 2008, 313, 125–132. [Google Scholar] [CrossRef] [PubMed]


| Sub-Fractions | Sub-Fraction Weight (g) | Yield (%) |
|---|---|---|
| H1 | 0.70 | 1.90 |
| H3.1 | 0.243 | 0.66 |
| H3.2 | 0.110 | 0.30 |
| H3.3 | 0.316 | 0.85 |
| H3.4 | 0.118 | 0.32 |
| H3.5 | 0.048 | 0.13 |
| H3.6 | 0.292 | 0.79 |
| H4 | 0.185 | 0.50 |
| D1 | 0.232 | 0.63 |
| D2 | 0.177 | 0.48 |
| D3 | 0.141 | 0.38 |
| D4 | 0.473 | 1.28 |
| D5 | 0.229 | 0.62 |
| D6 | 0.477 | 1.29 |
| D7 | 1.333 | 3.61 |
| D8 | 0.310 | 0.84 |
| M1 | 6.296 | 17.06 |
| M2 | 6.777 | 18.36 |
| M3 | 6.796 | 18.42 |
| M4 | 3.812 | 10.33 |
| Flavonoids in D5 | Rt (min) | Formula | m/z Measured | m/z Expected | Ion | mSigma | Δm/z (mDa) | Peak Area (%) | Peak |
|---|---|---|---|---|---|---|---|---|---|
| Dihydromyricetin | 7.00 | C15H12O8 | 319.0461 | 319.0459 | C15H11O8− | 3.7 | 0.05 | 1.56 | 26 |
| Isoprunetin | 8.95 | C16H12O5 | 283.0613 | 283.0612 | C16H11O5− | 2.8 | 0.06 | - | - |
| Daidzein | 9.70 | C15H10O4 | 253.0509 | 253.0506 | C15H9O4− | 5.6 | 0.29 | - | - |
| Genistein | 14.30 | C15H10O5 | 269.0457 | 269.0455 | C15H9O5− | 1.9 | 0.09 | 0.27 | 52 |
| Liquiritigenin | 18.75 | C15H12O4 | 255.0665 | 255.0663 | C15H11O4− | 12 | 0.20 | - | - |
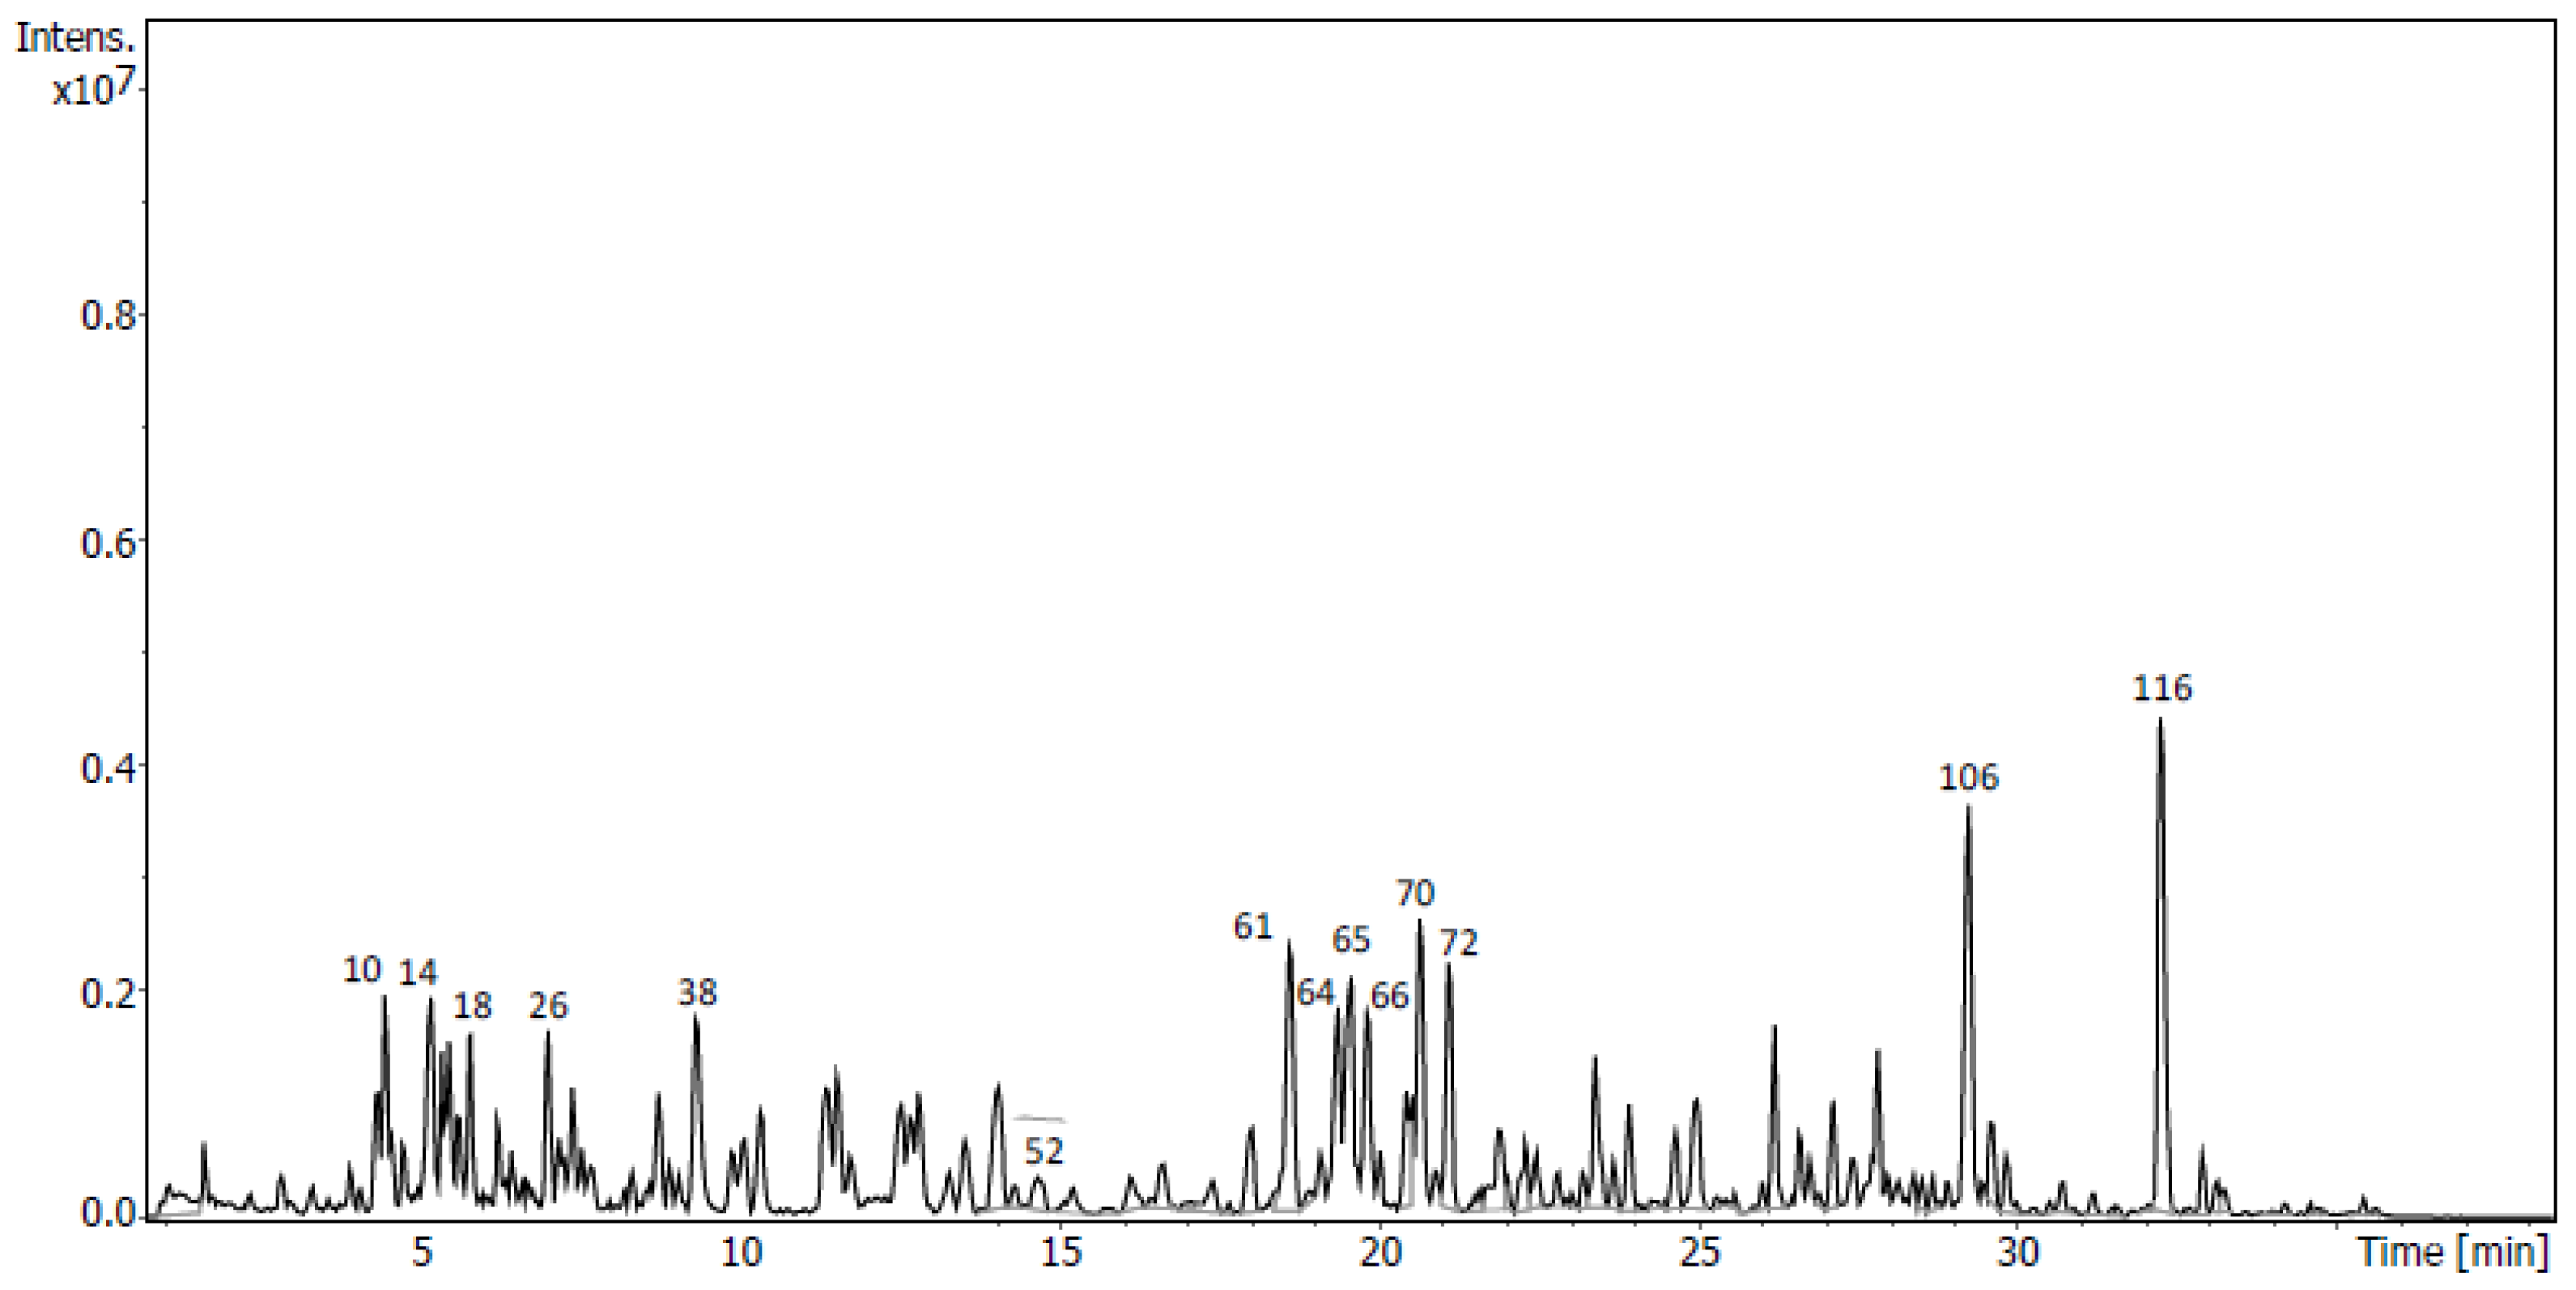
| Flavonoids in D7 | Rt (min) | Formula | m/z Measured | m/z Expected | Ion | mSigma | Δm/z (mDa) | Peak Area (%) | Peak |
|---|---|---|---|---|---|---|---|---|---|
| Isoprunetin-7-O-glucoside | 5.43 | C22H22O10 | 445.1142 | 445.1140 | C22H21O10− | 6.6 | 0.18 | - | - |
| Quercetin-3,7-diglucoside | 6.52 | C27H30O17 | 625.1409 | 625.1410 | C27H29O17− | 7.7 | −0.15 | - | - |
| Isoprunetin | 8.95 | C16H12O5 | 283.0613 | 283.0612 | C16H11O5− | 5.9 | 0.2 | 11.72 | 35 |
| Liquiritin | 9.33 | C21H22O9 | 417.1191 | 417.1191 | C21H21O9− | 28.5 | 0.26 | - | - |
| Daidzein | 9.70 | C15H10O4 | 253.0507 | 253.0507 | C15H9O4− | 7.2 | 0.17 | 3.97 | 38 |
| Formononetin | 18.40 | C16H12O4 | 267.0664 | 267.0663 | C16H11O4− | 3.4 | 0.17 | 5.26 | 61 |
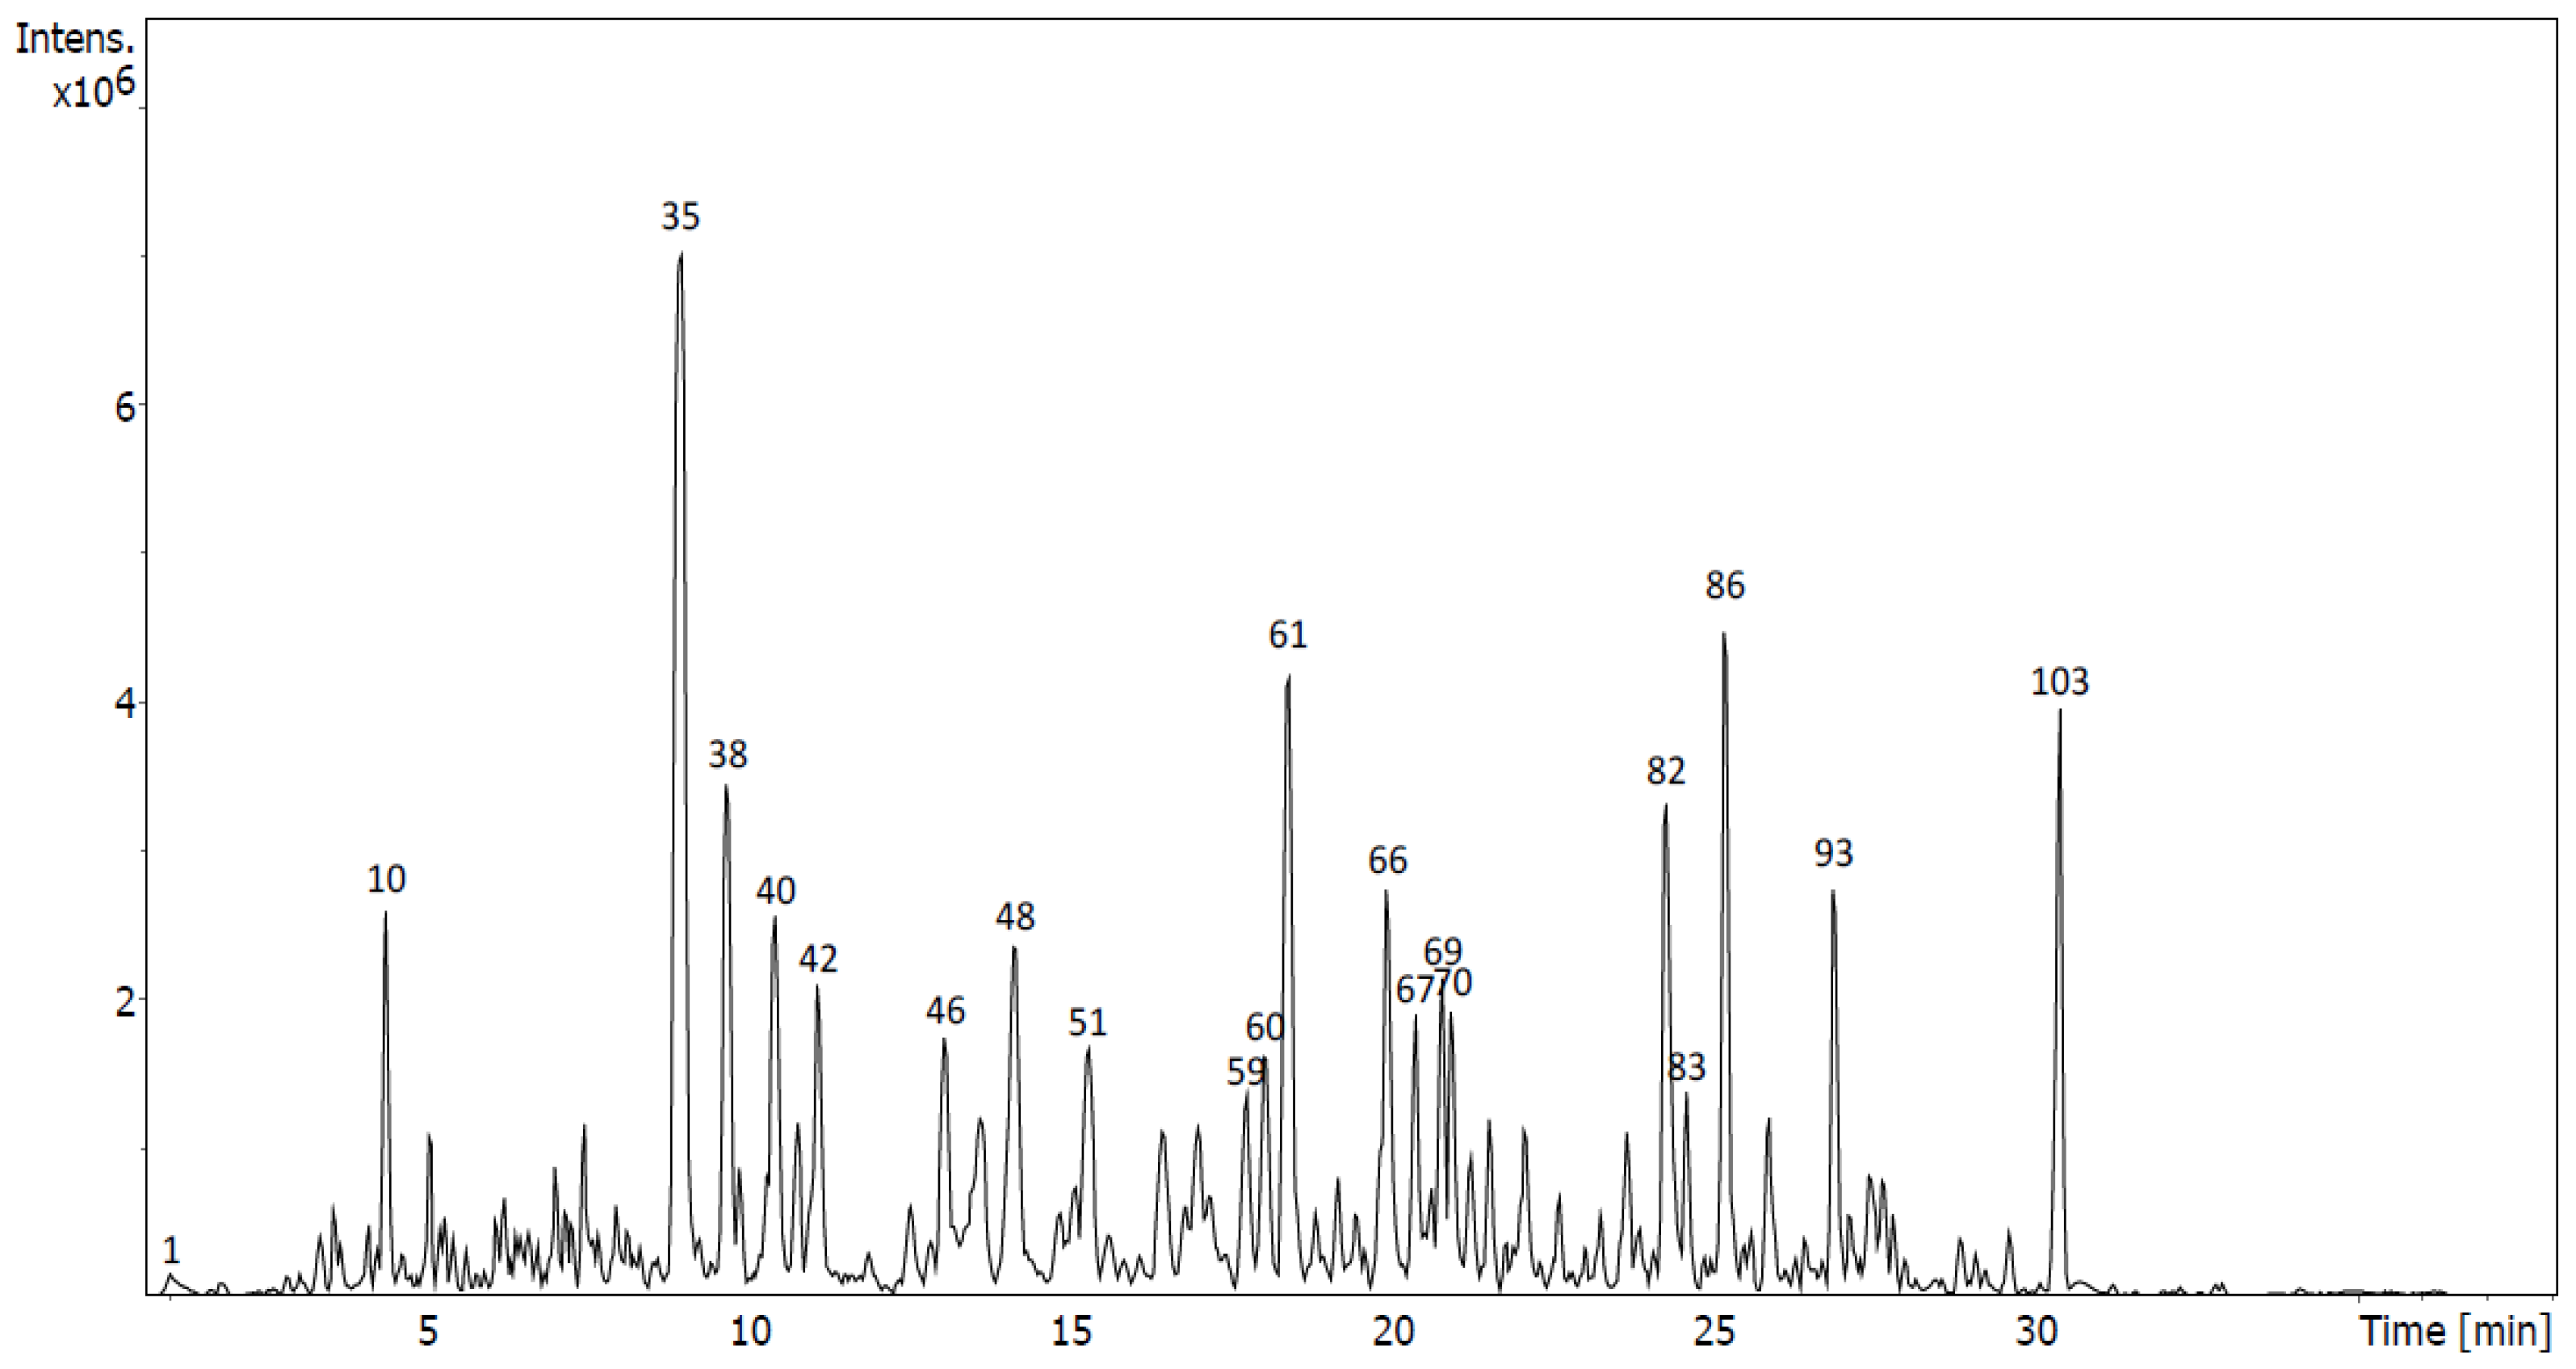
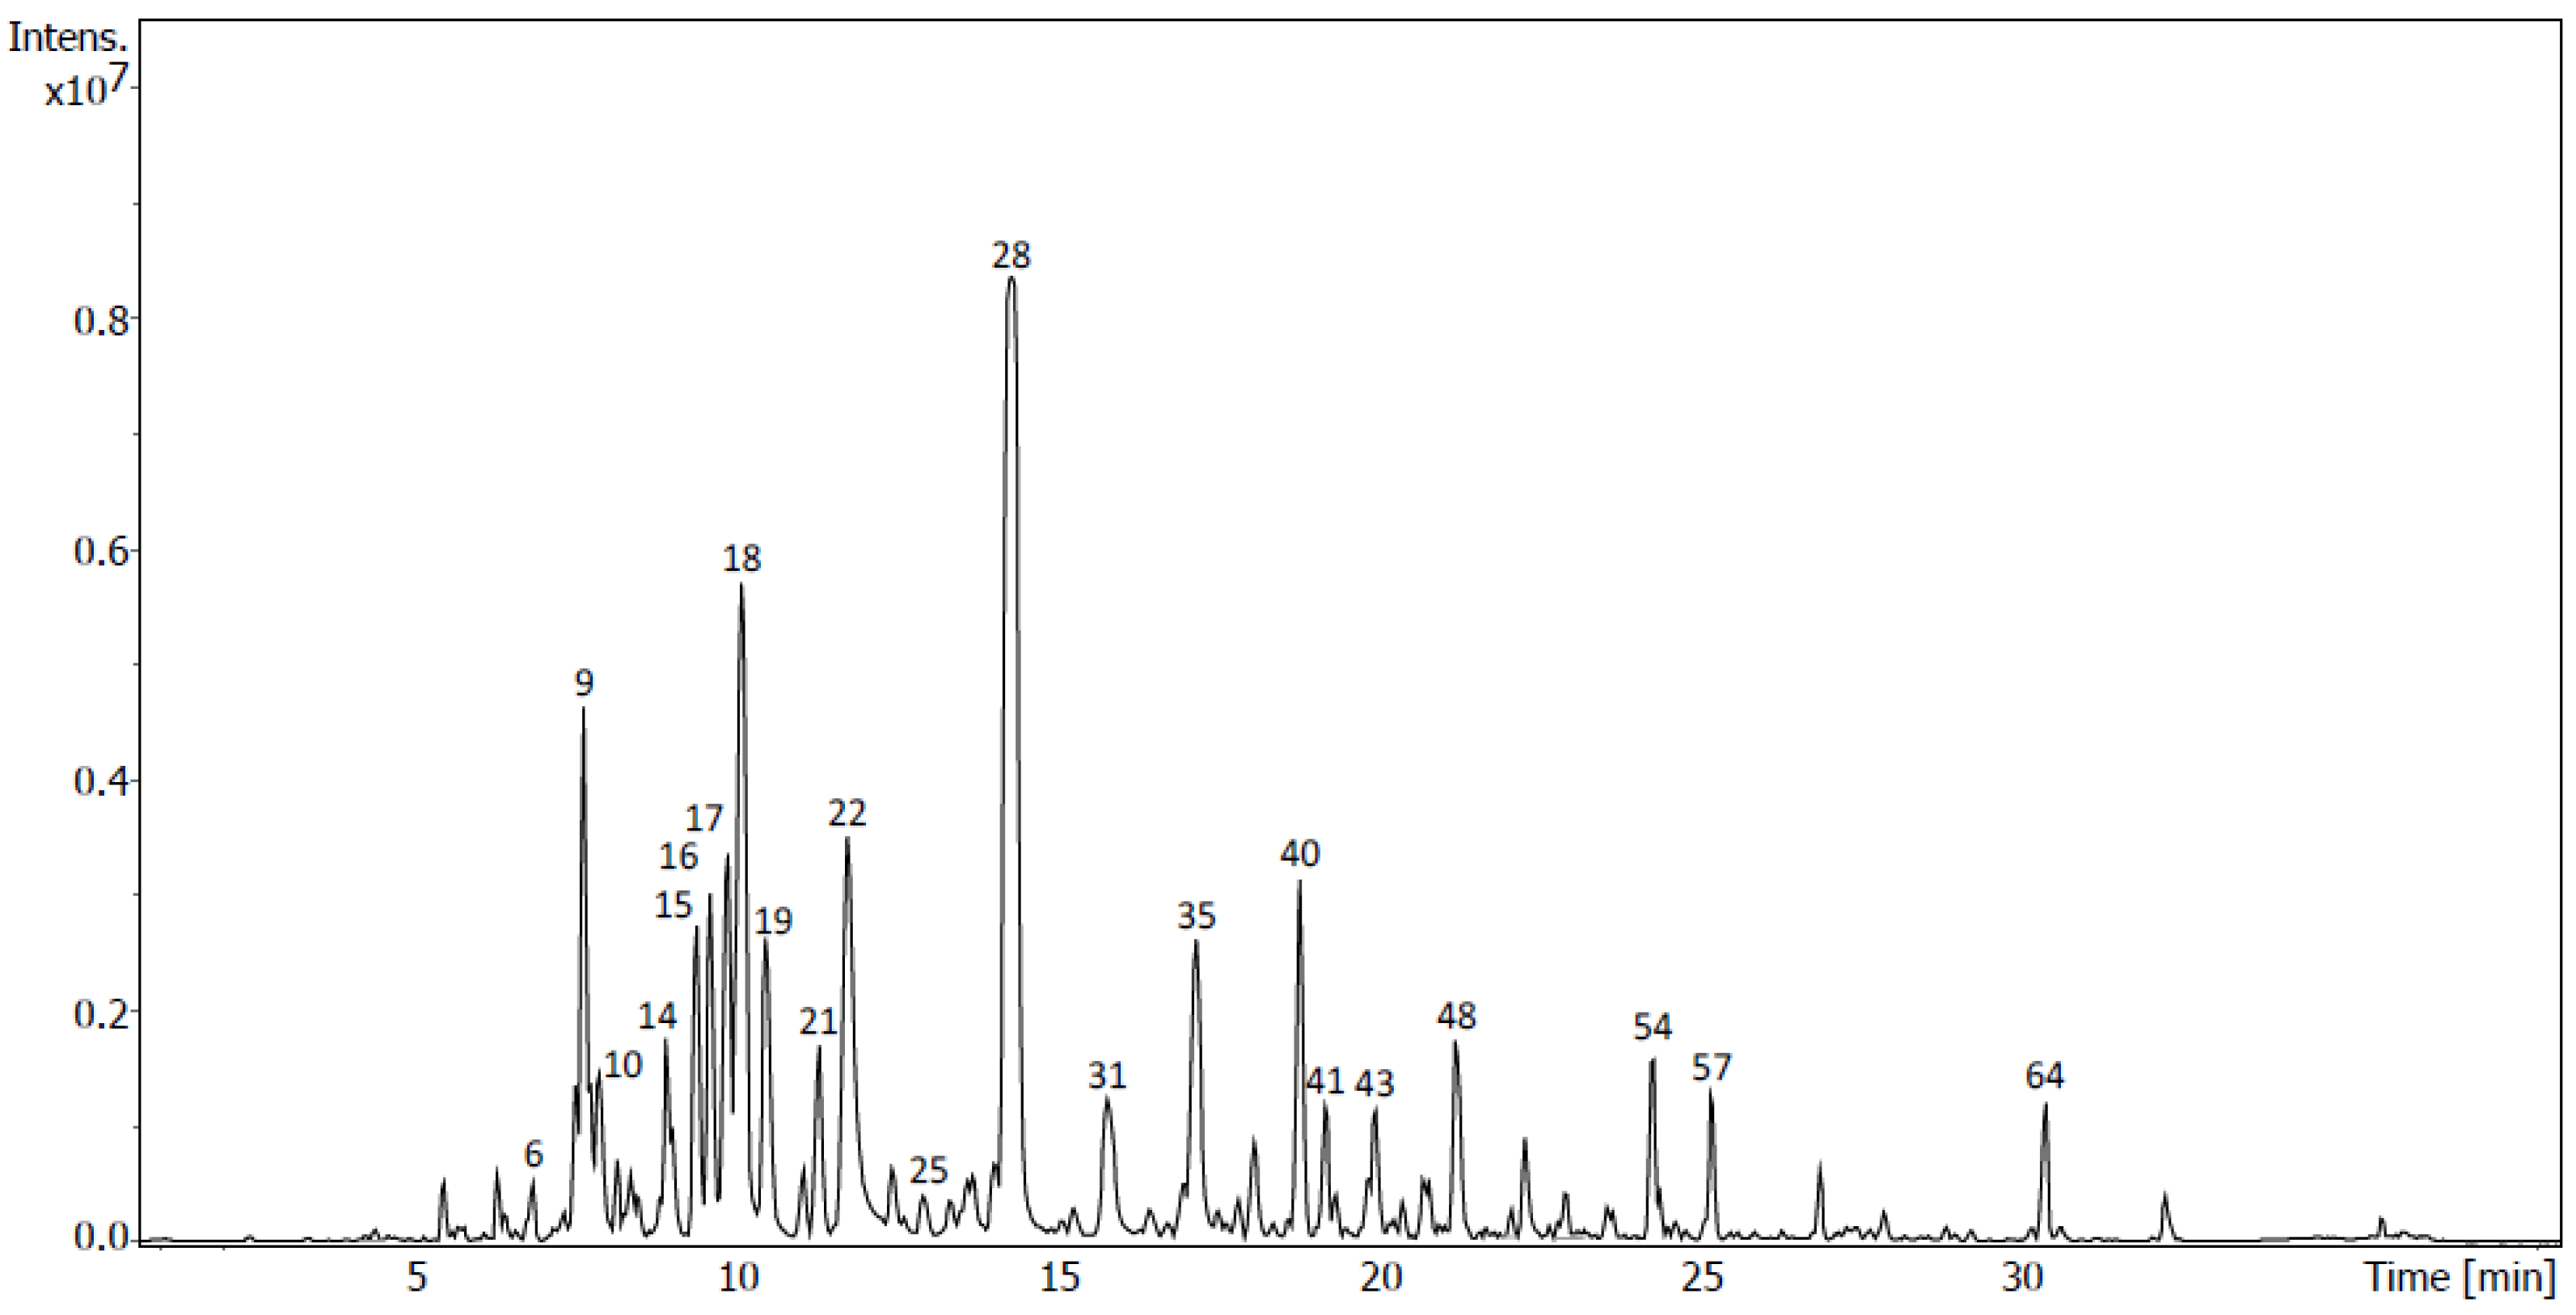
| Flavonoids in D8 | Rt (min) | Formula | m/z Measured | m/z Expected | Ion | mSigma | Δm/z (mDa) | Peak Area (%) | Peak |
|---|---|---|---|---|---|---|---|---|---|
| Genistin | 4.70 | C21H20O10 | 431.0988 | 431.0984 | C21H19O10− | 14.4 | 0.48 | - | - |
| Isoprunetin-7-O-glucoside | 5.46 | C22H22O10 | 445.1146 | 445.1140 | C22H21O10− | 6.6 | 0.62 | - | - |
| Neoisoliquiritin | 6.10 | C21H22O9 | 417.1193 | 417.1191 | C21H21O9− | 1.7 | 0.33 | 0.21 | 16 |
| Apigenin-4-O-glucoside | 6.87 | C21H20O10 | 431.0988 | 431.0984 | C21H19O10− | 13.0 | 0.41 | - | - |
| Luteolin-4-O-glucoside | 7.89 | C21H20O11 | 447.0938 | 447.0933 | C21H19O11− | 4.6 | 0.52 | - | - |
| Isoprunetin | 8.94 | C16H12O5 | 283.0614 | 283.0612 | C16H11O5− | 2.5 | 0.48 | 0.04 | 29 |
| Liquiritin | 9.40 | C21H22O9 | 417.1193 | 417.1191 | C21H21O9− | 4.9 | 0.51 | 0.89 | 31 |
| Apigenin | 10.50 | C15H10O5 | 269.0458 | 269.0455 | C15H9O5− | 4.4 | 0.45 | 0.42 | 37 |
| Genistein | 14.20 | C15H10O5 | 269.0459 | 269.0455 | C15H9O5− | 4.4 | 0.45 | 9.38 | 50 |
| Formononetin | 18.38 | C16H12O4 | 267.0664 | 267.0663 | C16H11O4− | 18.4 | 0.14 | - | - |
| Liquiritigenin | 18.70 | C15H12O4 | 255.0666 | 255.0663 | C15H11O4− | 17.9 | 0.31 | 4.60 | 62 |
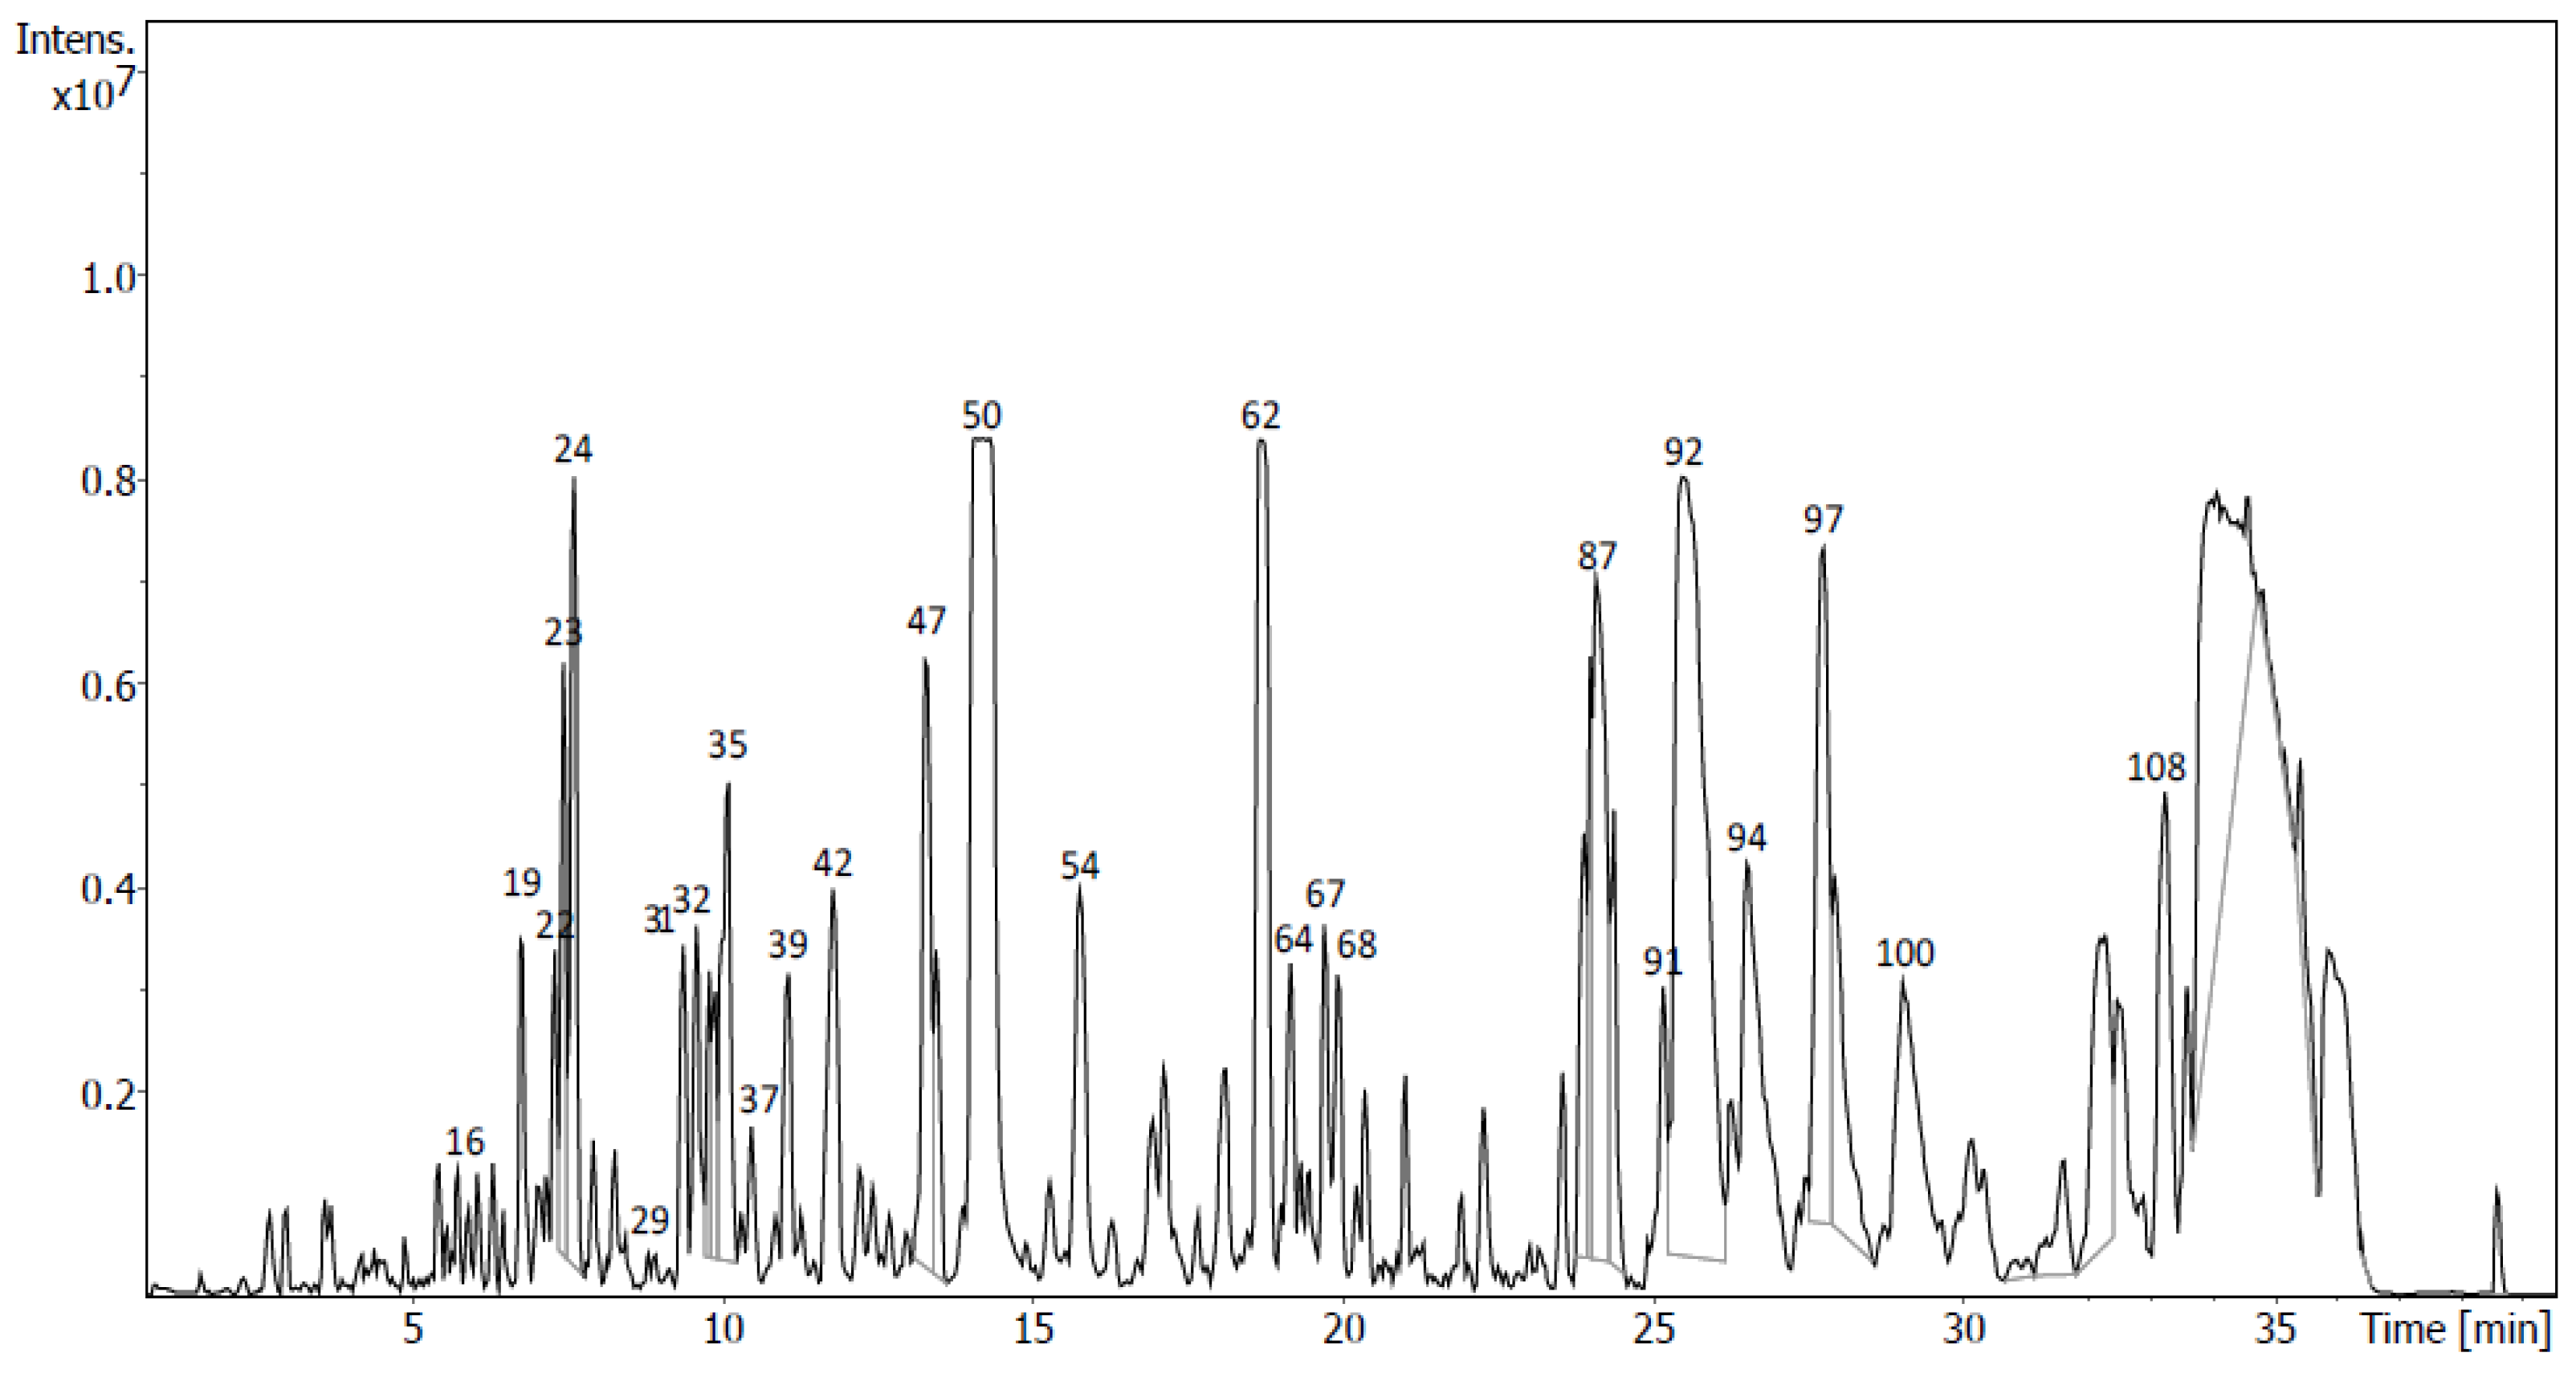
| Flavonoids in M4 | Rt (min) | Formula | m/z Measured | m/z Expected | Ion | mSigma | Δm/z (mDa) | Peak Area (%) | Peak |
|---|---|---|---|---|---|---|---|---|---|
| Genistin | 4.71 | C21H20O10 | 431.0982 | 431.0984 | C21H19O10− | 7.5 | −0.13 | - | - |
| Isoprunetin-7-O-glucoside | 5.46 | C22H22O10 | 445.1139 | 445.1140 | C22H21O10− | 4.5 | −0.16 | - | - |
| Neoisoliquiritin | 6.10 | C21H22O9 | 417.1190 | 417.1191 | C21H21O9− | 6.3 | −0.08 | - | - |
| Apigenin-4-O-glucoside | 6.80 | C21H20O10 | 431.0986 | 431.0984 | C21H19O10− | 2.2 | −0.13 | 0.55 | 6 |
| Luteolin-4-O-glucoside | 7.90 | C21H20O11 | 447.0935 | 447.0933 | C21H19O11− | 2.8 | −0.12 | 1.51 | 10 |
| Formononetin-O-glucoside | 8.82 | C22H22O9 | 429.1186 | 429.1191 | C22H21O9− | 32.8 | −0.55 | - | - |
| Isoprunetin | 8.90 | C16H12O5 | 283.0612 | 283.0612 | C16H11O5− | 7.2 | 0.01 | 2.55 | 14 |
| Liquiritin | 9.40 | C21H22O9 | 417.1193 | 417.1191 | C21H21O9− | 6.8 | −0.01 | 2.84 | 15 |
| Apigenin | 10.50 | C15H10O5 | 269.0457 | 269.0455 | C15H9O5− | 7.0 | 0.03 | 3.50 | 19 |
| Naringenin | 13.30 | C15H12O5 | 271.0613 | 271.0612 | C15H11O5− | 7.3 | 0.05 | 0.26 | 25 |
| Genistein | 14.28 | C15H10O5 | 269.0457 | 269.0455 | C15H9O5− | 15.0 | 0.12 | 21.05 | 28 |
| Limonianin | 18.42 | C20H16O5 | 381.0097 | 381.0980 | C20H15O5− | 9.8 | −0.04 | - | - |
| Liquiritigenin | 18.77 | C15H12O4 | 255.0664 | 255.0663 | C15H11O4− | 10.5 | 0.08 | 3.97 | 40 |
| Tentative Identification | Rt (min) | Formula | Ion | m/z | Fragment Ions (m/z) | Family | Peak Area (%) | Sub- Fraction | Peak |
|---|---|---|---|---|---|---|---|---|---|
| 4-Hydroxybenzaldehyde | 4.40 | C7H6O2 | C7H5O2− | 121.0296 | 122.0329 | Hydroxybenzaldehydes | 2.28 | D7 | 10 |
| 7-Ethoxy-4-methylcoumarin | 4.50 | C12H12O3 | C12H11O3− | 203.0714 | 204.0748,188.0479, 159.0454 | Coumarins | 2.00 | D5 | 10 |
| 3,4,5-Trihydroxy-6-[(4-methyl-2-oxo-2H-chromen-7-yl)oxy]oxane-2-carboxylic acid | 5.20 | C16H16O9 | C16H15O9− | 351.0726 | 352.0759, 307.0826, 293.0670, 276.0597, 275.0563, 249.0770, 231.0664, 205.0872, 136.0168 | Coumarin glycosides | 2.55 | D5 | 14 |
| Dihydroisorhamnetin | 5.80 | C16H14O7 | C16H13O7− | 317.0669 | 318.0703, 293.0669, 289.0721, 245.0820, 230.0585, 205.0871, 190.0636 | Flavanones | 1.53 | D5 | 18 |
| 3,4,9-Trihydroxypterocarpan | 6.8 | C15H12O5 | C15H11O5− | 271.0613 | 272.0647, 243.0663 | Pterocarpans | 0.86 | D8 | 19 |
| Dihydromyricetin | 7.00 | C15H12O8 | C15H11O8− | 319.0461 | 320.0495, 275.0562, 231.0663, 216.0428, 151.0036 | Flavanones | 1.56 | D5 | 26 |
| Unknown | 7.30 | C16H12O6 | C16H11O6− | 299.0562 | 300.0596 | - | 0.65 | D8 | 22 |
| Rhamnocitrin | 7.50 | C16H12O6 | C16H11O6− | 299.0562 | 599.1199, 300.0597 | Flavonols | 1.32 | D8 | 23 |
| Dihydrokaempferol | 7.60 | C15H12O6 | C15H11O6− | 287.0563 | 575.1198, 288.0597, 259.0613,125.0244 | Flavanones | 2.31/4.94 | D8/M4 | 24/9 |
| Isoprunetin | 9.00 | C16H12O5 | C16H11O5− | 283.0613 | 284.0647, 271.0613 | Isoflavones | 11.72/2.55 | D7/M4 | 35/14 |
| 2-(3,4,5-Trihydroxyphenyl)-4H-chromene-3,4,5,7-tetrol | 9.30 | C15H12O8 | C15H11O8− | 319.0461 | 320.0495, 194.0176, 193.0142 | Flavenes | 2.86 | D5 | 38 |
| Liquiritin | 9.40 | C21H12O9 | C21H11O9− | 417.1193 | 835.2460, 418.1227, 329.0669, 255.0663 | Flavone glycoside | 0.89/2.84 | D8/M4 | 31/15 |
| Unknown | 9.60 | C15H10O6 | C15H9O6− | 285.0405 | 571.0885, 286.0440 | - | 0.95 | D8 | 32 |
| Unknown | 9.60 | C15H10O6 | C15H9O5− | 285.0406 | 571.0884, 286.0441 | - | 3.01 | M4 | 16 |
| Daidzein | 9.70 | C15H10O4 | C15H9O4− | 253.0507 | 507.1088, 254.0541 | Isoflavones | 3.97 | D7 | 38 |
| Isokaempferide | 9.90 | C16H12O6 | C16H11O6− | 299.0563 | 599.1195, 300.0597, 255.0664 | Flavanones | 3.59 | M4 | 17 |
| Kaempferol | 10.10 | C15H10O6 | C15H9O6− | 285.0405 | 571.0883, 286.0439 | Flavonols | 2.06/8.52 | D8/M4 | 35/18 |
| Oroxylin A | 10.40 | C16H12O5 | C16H11O5− | 283.0614 | 284.0648 | Flavones | 3.28 | D7 | 40 |
| Apigenin | 10.50 | C15H10O5 | C15H9O5− | 269.0457 | 539.0986, 270.0491 | Flavones | 3.50 | M4 | 19 |
| Maackiain | 11.10 | C16H12O5 | C16H11O5− | 283.0613 | 284.0648 | Pterocarpans | 2.44 | D7 | 42 |
| Quercetin 3,3′-dimethyl ether | 11.10 | C17H14O7 | C17H13O7− | 329.0669 | 659.1409, 330.0703 | Flavones | 0.91 | D8 | 39 |
| 8-Hydroxy-7-(2-hydroxyphenyl)-9-methoxy-[1,3]dioxolo[4,5-g]chromen-6-one | 11.3 | C17H12O7 | C17H11O7− | 327.0512 | 655.1094, 328.0546, 283.0613 | Coumarin | 2.12 | M4 | 21 |
| Luteolin | 11.70 | C15H10O6 | C15H9O6− | 285.0405 | 571.0883, 286.0440 | Flavones | 7.79 | M4 | 22 |
| Ermanin | 11.80 | C17H14O6 | C17H13O6− | 313.0719 | 627.1509, 314.0754, 285.0406 | Flavones | 1.85 | D8 | 42 |
| Cryptostrobin | 13.10 | C16H14O4 | C16H13O4− | 269.0820 | 539.1711, 270.0854 | Flavanones | 2.34 | D7 | 46 |
| Naringenin | 13.3 | C15H12O5 | C15H11O5− | 271.0613 | 543.1296, 272.0648, 163.0038 | Flavanones | 2.41 | D8 | 47 |
| Rhamnazin | 14.10 | C17H14O7 | C17H13O7− | 329.0670 | 659.1409, 330.0703, 327.0513 | Flavonols | 3.86/0.91 | D7/D8 | 48/39 |
| Genistein | 14.30 | C15H10O5 | C15H9O5− | 269.0459 | 539.0988, 270.0491 | Isoflavones | 9.38/21.05 | D8/M4 | 50/28 |
| Dinatin | 15.30 | C16H12O6 | C16H11O6− | 299.0562 | 599.1197, 300.0597 | Flavones | 2.22 | D7 | 51 |
| 3,3′,4′-Trihydroxyflavone | 15.8 | C15H10O5 | C15H9O5− | 269.0457 | 539.0985, 285.0406, 270.0490 | Flavonol | 2.57 | M4 | 31 |
| 5,7,2′-Trihydroxyflavone | 15.8 | C15H10O5 | C15H9O5− | 269.0457 | 539.0989, 270.0492 | Flavones | 1.79 | D8 | 54 |
| 5,7-Dihydroxy-3-(6-hydroxy-1,3-benzodioxol-5-yl)chromen-4-one | 17.2 | C16H10O7 | C16H9O7- | 313.0354 | 627.0781, 314.0389 | Isoflavones | 4.27 | M4 | 35 |
| Pseudobabtigenin | 17.70 | C16H10O5 | C16H9O5− | 281.0457 | 282.0492 | Isoflavones | 1.64 | D7 | 59 |
| 2,3-Dehydrokievitol | 18.00 | C20H18O7 | C20H17O7− | 369.0983 | 739.2034, 370.1018 | Isoflavones | 2.02 | D7 | 60 |
| Formononetin | 18.40 | C16H12O4 | C16H11O4− | 267.0664 | 268.0698 | Isoflavones | 5.26 | D7 | 61 |
| 11-Hydroxy-9,10-dihydrojasmonic acid 11-beta-D-glucoside | 18.60 | C18H30O9 | C18H29O8− | 389.1820 | 390.1855 | Fatty acyl glycosides | 3.89 | D5 | 61 |
| Liquiritigenin | 18.80 | C15H12O4 | C15H11O4− | 255.0666 | 511.1402, 256.0698, 135.0088 | Flavanones | 4.60/3.97 | D8/M4 | 62/40 |
| Neotenone | 19.20 | C19H14O6 | C19H13O6− | 337.0719 | 675.1506, 338.0753, 283.0613 | Isoflavones | 0.84 1.31 | D8 M4 | 64 41 |
| 6-Hydroxy-7,4′-dimethoxyisoflavone | 19.40 | C17H14O5 | C17H13O5− | 297.0771 | 298.0805 | Isoflavones | 2.18 | D5 | 64 |
| 2′,7-Dihydroxy-4′, 5′-dimethoxyflavone | 19.60 | C17H14O6 | C17H13O6− | 313.0720 | 314.0754, 299.0520, 298.0486 | Isoflavone | 3.24 | D5 | 65 |
| Justisolin | 19.70 | C20H18O7 | C20H17O7− | 369.0981 | 739.2033, 370.1015 | Furanoid lignans | 0.93 | D8 | 67 |
| 5,7-Dihydroxy-3′,4′,5′-trimethoxyflavone | 19.80 | C18H16O7 | C18H16O6− | 343.0827 | 344.0860, 322.2029, 297.0408 | Flavones | 2.23 | D5 | 66 |
| 2,3-Dehydrokievitone | 19.90 | C20H18O6 | C20H17O6− | 353.1033 | 707.2137, 354.1068, 351.0879, 297.0407 | Isoflavones | 3.66/0.9/1.7 | D7/D8/ M4 | 66/68/43 |
| Licoflavonol | 20.40 | C20H18O6 | C20H17O6− | 353.1034 | 707.2140, 354.1069 | Flavonols | 1.69 | D7 | 67 |
| UnKnown | 20.60 | C19H34O5 | C19H33O6− | 341.2337 | 683.4747, 342.2371 | - | 3.34 | D5 | 70 |
| Unknown | 20.80 | C20H16O6 | C20H15O6− | 351.0876 | 703.1824, 352.0910 | - | 1.66 | D7 | 69 |
| 8-Prenylkaempferol | 20.90 | C20H18O6 | C20H17O6− | 353.1034 | 707.2141, 354.1069 | Flavonols | 1.52 | D7 | 70 |
| UnKnown | 21.10 | C19H34O5 | C19H33O6− | 341.2336 | 342.2370 | - | 2.82 | D5 | 72 |
| 3,6a,7,10-Tetrahydroxy-4,9-dioxo-4,5,6,6a,6b,7,8,9-octahydroperylene | 21.2 | C20H16O6 | C20H15O6− | 351.0876 | 703.1823, 352.0910 | Perylenequinones | 2.50 | M4 | 48 |
| 13-Hydroxy-10-oxooctadec-11-enoic acid | 23.40 | C18H32O4 | C18H31O4− | 311.2232 | 312.2266, 247.0977 | Lineolic acids and derivatives | 1.85 | D5 | 81 |
| N-(2-methylpropyl)-3-phenyl-2-(3-{2,5,9-trimethyl-7-oxo-3-phenyl-7H-furo[3,2-g]chromen-6-yl}propanamido)propanamide | 24.1 | C36H38N2O5 | C36H37N2O5− | 577.2698 | 578.2729, 279.1640 | Phenylbenzofurans | 3.88 | D8 | 87 |
| 6-Prenylapigenin | 24.2 | C20H18O5 | C20H17O5− | 337.1084 | 675.2238, 338.1118 | Flavones | 1.75 | M4 | 54 |
| Demethoxycurcumin | 24.30 | C20H18O5 | C20H17O5− | 337.1086 | 675.2242, 338.1120 | Curcuminoids | 4.36 | D7 | 82 |
| Gancaonin N | 24.60 | C21H20O6 | C21H19O6− | 367.1191 | 735.2450, 368.1225 | Isoflavones | 1.06 | D7 | 83 |
| Licoflavone C | 25.20 | C20H18O5 | C20H17O5− | 337.1084 | 675.2241, 338.1118 | Flavones | 4.55 | D7 | 86 |
| p-Hydroxycinnamoyl-feruloylmethane | 25.20 | C20H18O5 | C20H17O5− | 377.1086 | 633.1410, 338.1121 | Curcuminoids | 1.41 | M4 | 57 |
| Unknown | 25.20 | C31H40N4O7 | C31H39N4O7− | 579.2850 | 580.2884, 476.2786, 339.1243 | - | 0.77 | D8 | 91 |
| Unknown | 25.5 | C34H40N2O5 | C34H39N2O5− | 555.2848 | 1111.5769, 556.2881, 353.2006 | - | 10.68 | D8 | 92 |
| Candidusin C | 26.20 | C21H18O6 | C21H17O6− | 365.1033 | 366.1067 | Phenylbenzofurans | 1.84 | D5 | 92 |
| Unknown | 26.50 | C25H30N6O2 | C25H29N6O2− | 445.2363 | 891.4801, 446.2398, 323.1292, 277.2176 | - | 3.63 | D8 | 94 |
| Alpinumisoflavone | 26.90 | C20H16O5 | C20H15O5− | 335.0929 | 671.1932, 336.0964 | Isoflavone | 2.59 | D7 | 93 |
| Unknown | 27.70 | C25H32N6O2 | C25H31N6O2− | 447.2520 | 895.5114, 448.2553, 279.2332 | - | 3.95 | D8 | 97 |
| 3-Hydroxyhexadecanoic acid | 27.80 | C16H32O3 | C16H32O3− | 271.2280 | 272.2314 | Long-chain fatty acids | 1.83 | D5 | 99 |
| 15-(4-Hydroxy-2,2,6-trimethyl-7-oxabicyclo[4.1.0]heptan-1-yl)-4,9,13-trimethyl-14-oxopentadeca-2,4,6,8,10,12-hexaenal | 29.0 | C27H36O4 | C27H35O4− | 423.2521 | 424.2555, 255.2332 | Sesterterpenoids | 2.96 | D8 | 100 |
| Cyclomulberrin | 29.20 | C25H24O6 | C25H23O6− | 419.1504 | 420.1538, 388.1488, 387.1453 | Flavones | 5.04 | D5 | 106 |
| Honyucitrin | 30.40 | C25H26O5 | C25H25O5− | 405.1710 | 406.1744 | Flavones | 3.95/1.23 | D7/M4 | 103/64 |
| Mammeigin | 32.20 | C25H24O5 | C25H23O5− | 403.1552 | 404.1586, 807.3179 | Coumarins | 6.62 | D5 | 116 |
| UnKnown | 33.20 | C51H58N12 | C51H58N12− | 837.4838 | 838.4871 | - | 2.45 | D8 | 108 |
Disclaimer/Publisher’s Note: The statements, opinions and data contained in all publications are solely those of the individual author(s) and contributor(s) and not of MDPI and/or the editor(s). MDPI and/or the editor(s) disclaim responsibility for any injury to people or property resulting from any ideas, methods, instructions or products referred to in the content. |
© 2023 by the authors. Licensee MDPI, Basel, Switzerland. This article is an open access article distributed under the terms and conditions of the Creative Commons Attribution (CC BY) license (https://creativecommons.org/licenses/by/4.0/).
Share and Cite
Bada, L.; Pereira, R.B.; Pereira, D.M.; Lores, M.; Celeiro, M.; Quezada, E.; Uriarte, E.; Gil-Longo, J.; Viña, D. Phytochemical Analysis and Antiproliferative Activity of Ulex gallii Planch. (Fabaceae), a Medicinal Plant from Galicia (Spain). Molecules 2023, 28, 351. https://doi.org/10.3390/molecules28010351
Bada L, Pereira RB, Pereira DM, Lores M, Celeiro M, Quezada E, Uriarte E, Gil-Longo J, Viña D. Phytochemical Analysis and Antiproliferative Activity of Ulex gallii Planch. (Fabaceae), a Medicinal Plant from Galicia (Spain). Molecules. 2023; 28(1):351. https://doi.org/10.3390/molecules28010351
Chicago/Turabian StyleBada, Lucía, Renato B. Pereira, David M. Pereira, Marta Lores, María Celeiro, Elías Quezada, Eugenio Uriarte, José Gil-Longo, and Dolores Viña. 2023. "Phytochemical Analysis and Antiproliferative Activity of Ulex gallii Planch. (Fabaceae), a Medicinal Plant from Galicia (Spain)" Molecules 28, no. 1: 351. https://doi.org/10.3390/molecules28010351