
Protective Effects of Protopanaxatriol Saponins on Ulcerative Colitis in Mouse Based on UPLC-Q/TOF-MS Serum and Colon Metabolomics

 , ,
, ,
Abstract
: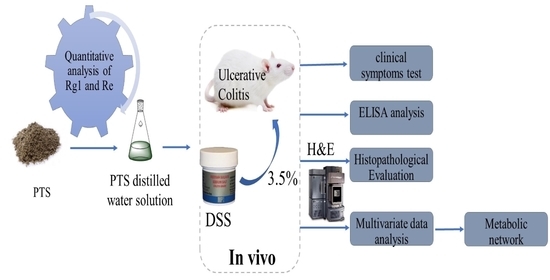
1. Introduction
2. Results
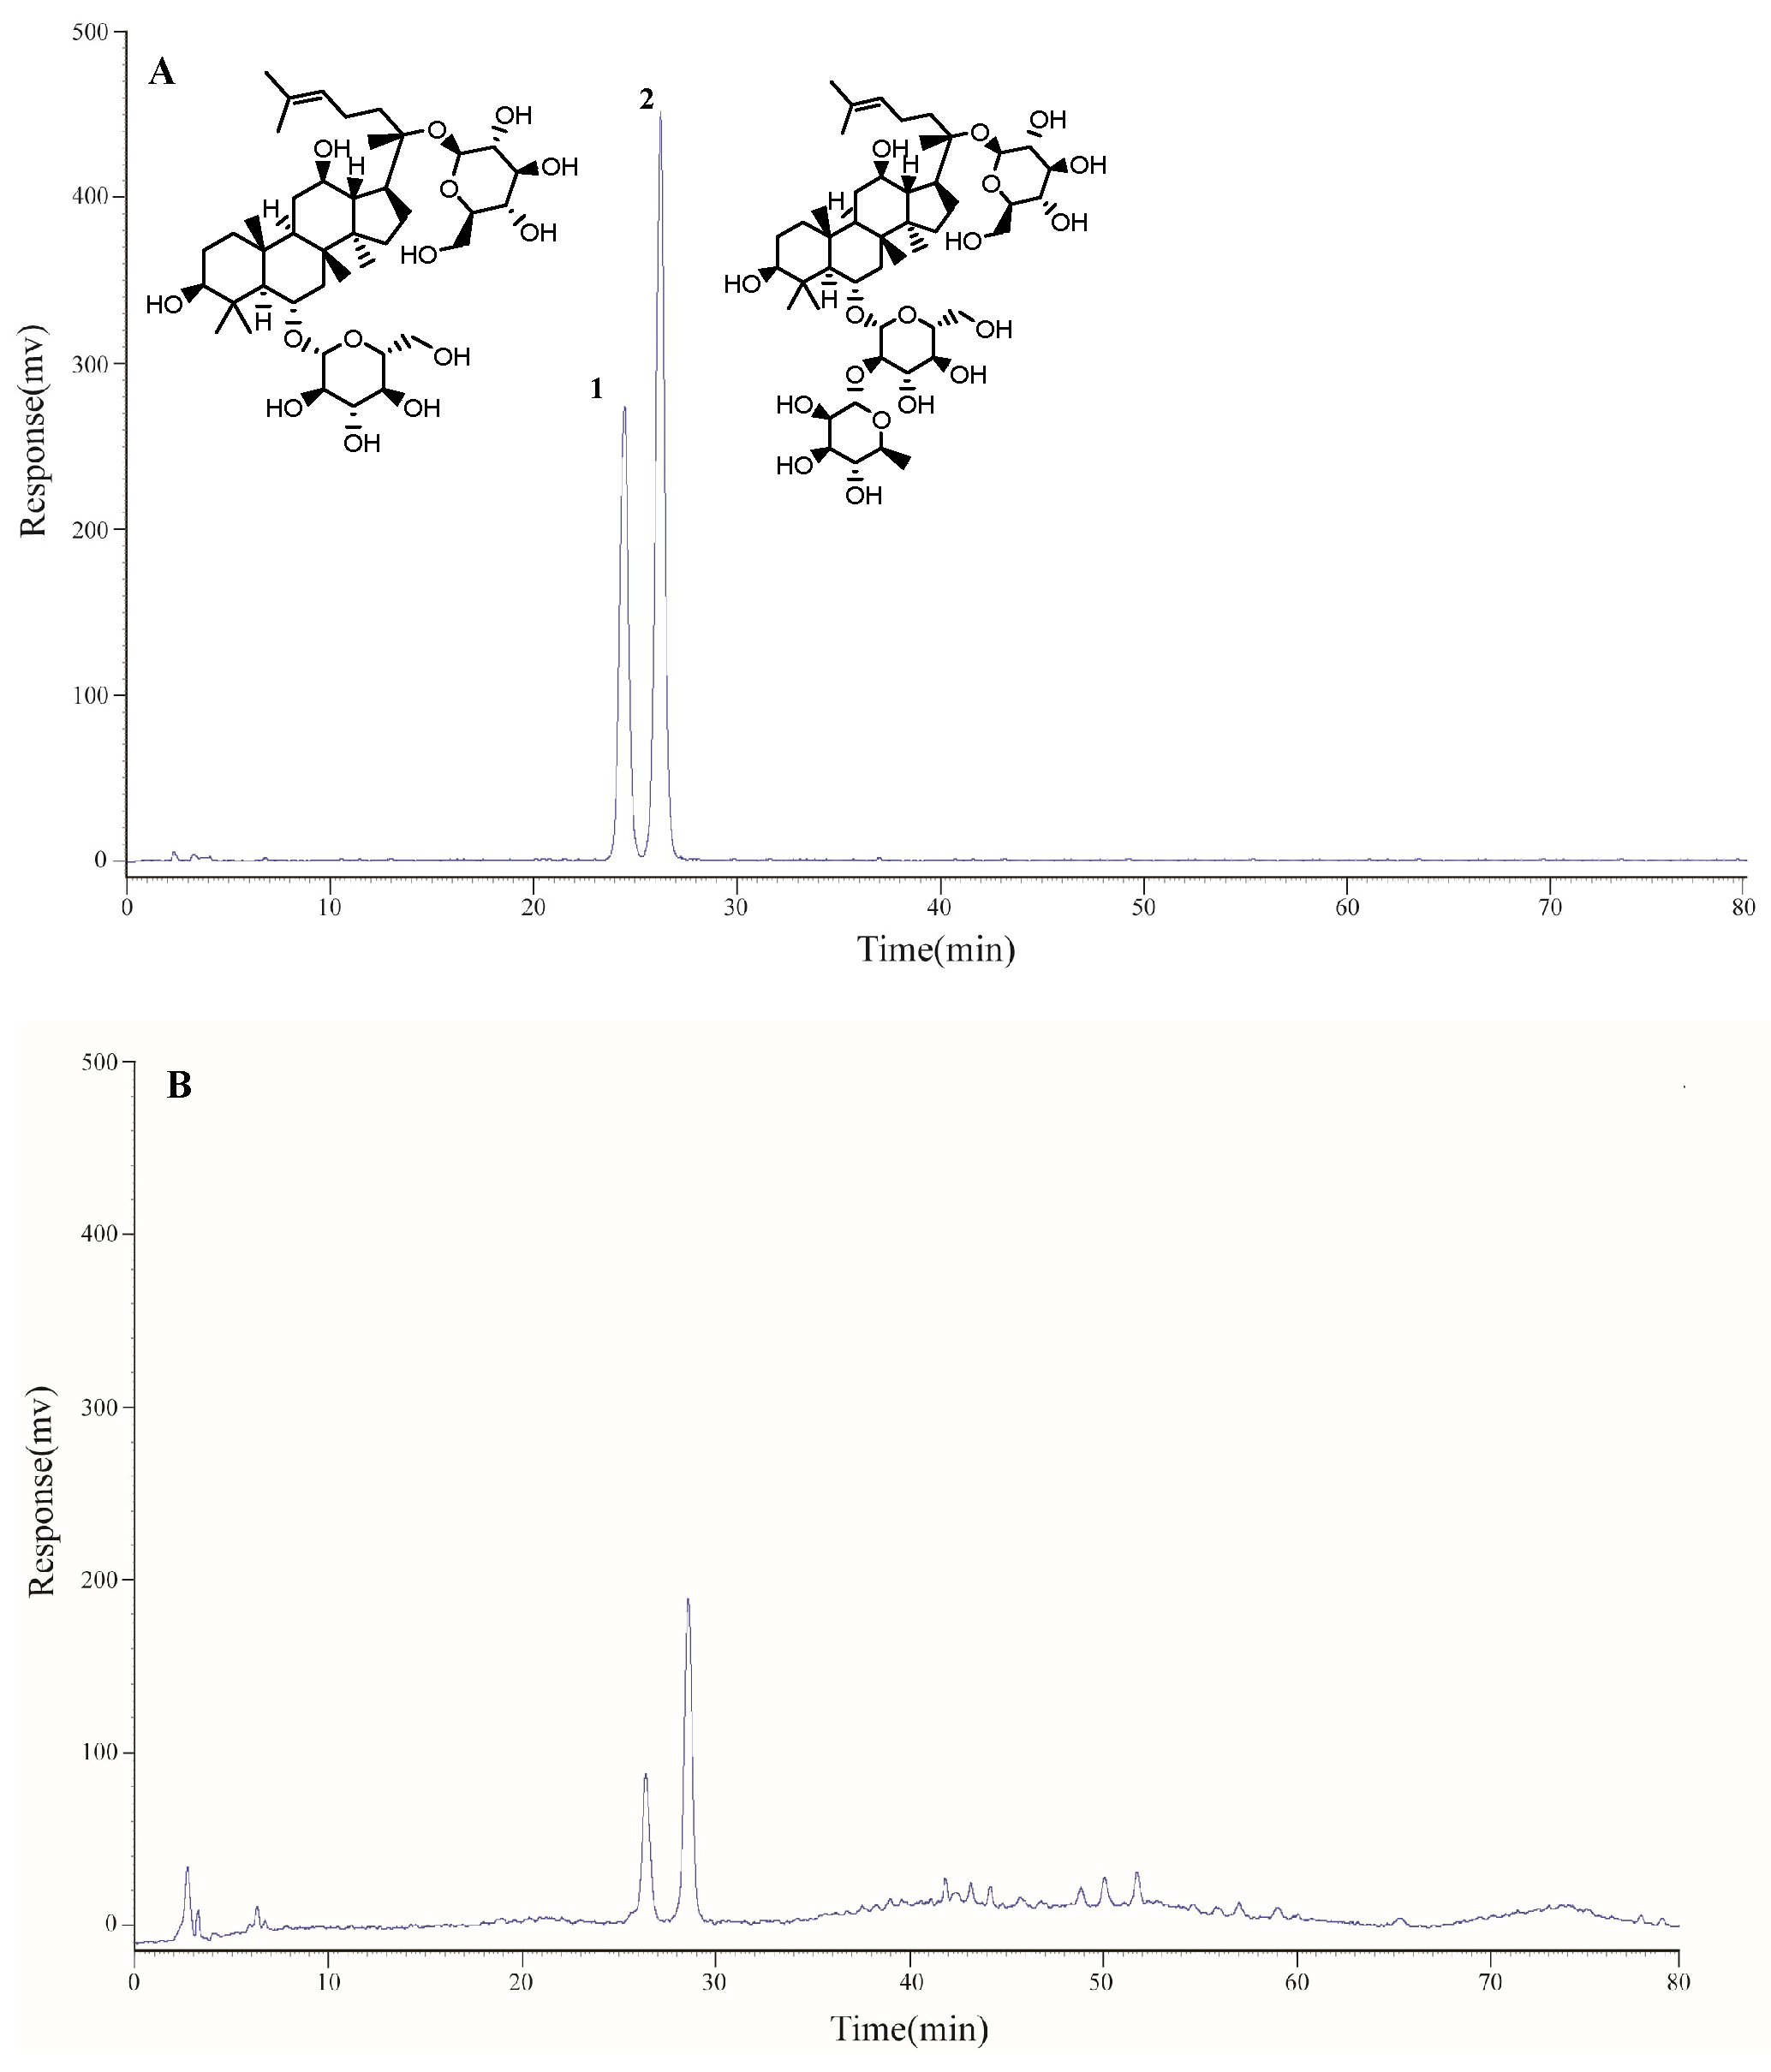
2.1. Determination of the Main Components of Triol Saponins
2.1.1. Calibration Curves and Limits of Detection and Quantification
2.1.2. Precision, Repeatability, Stability, and Accuracy
2.1.3. Contents of Two Components of Triol Saponins
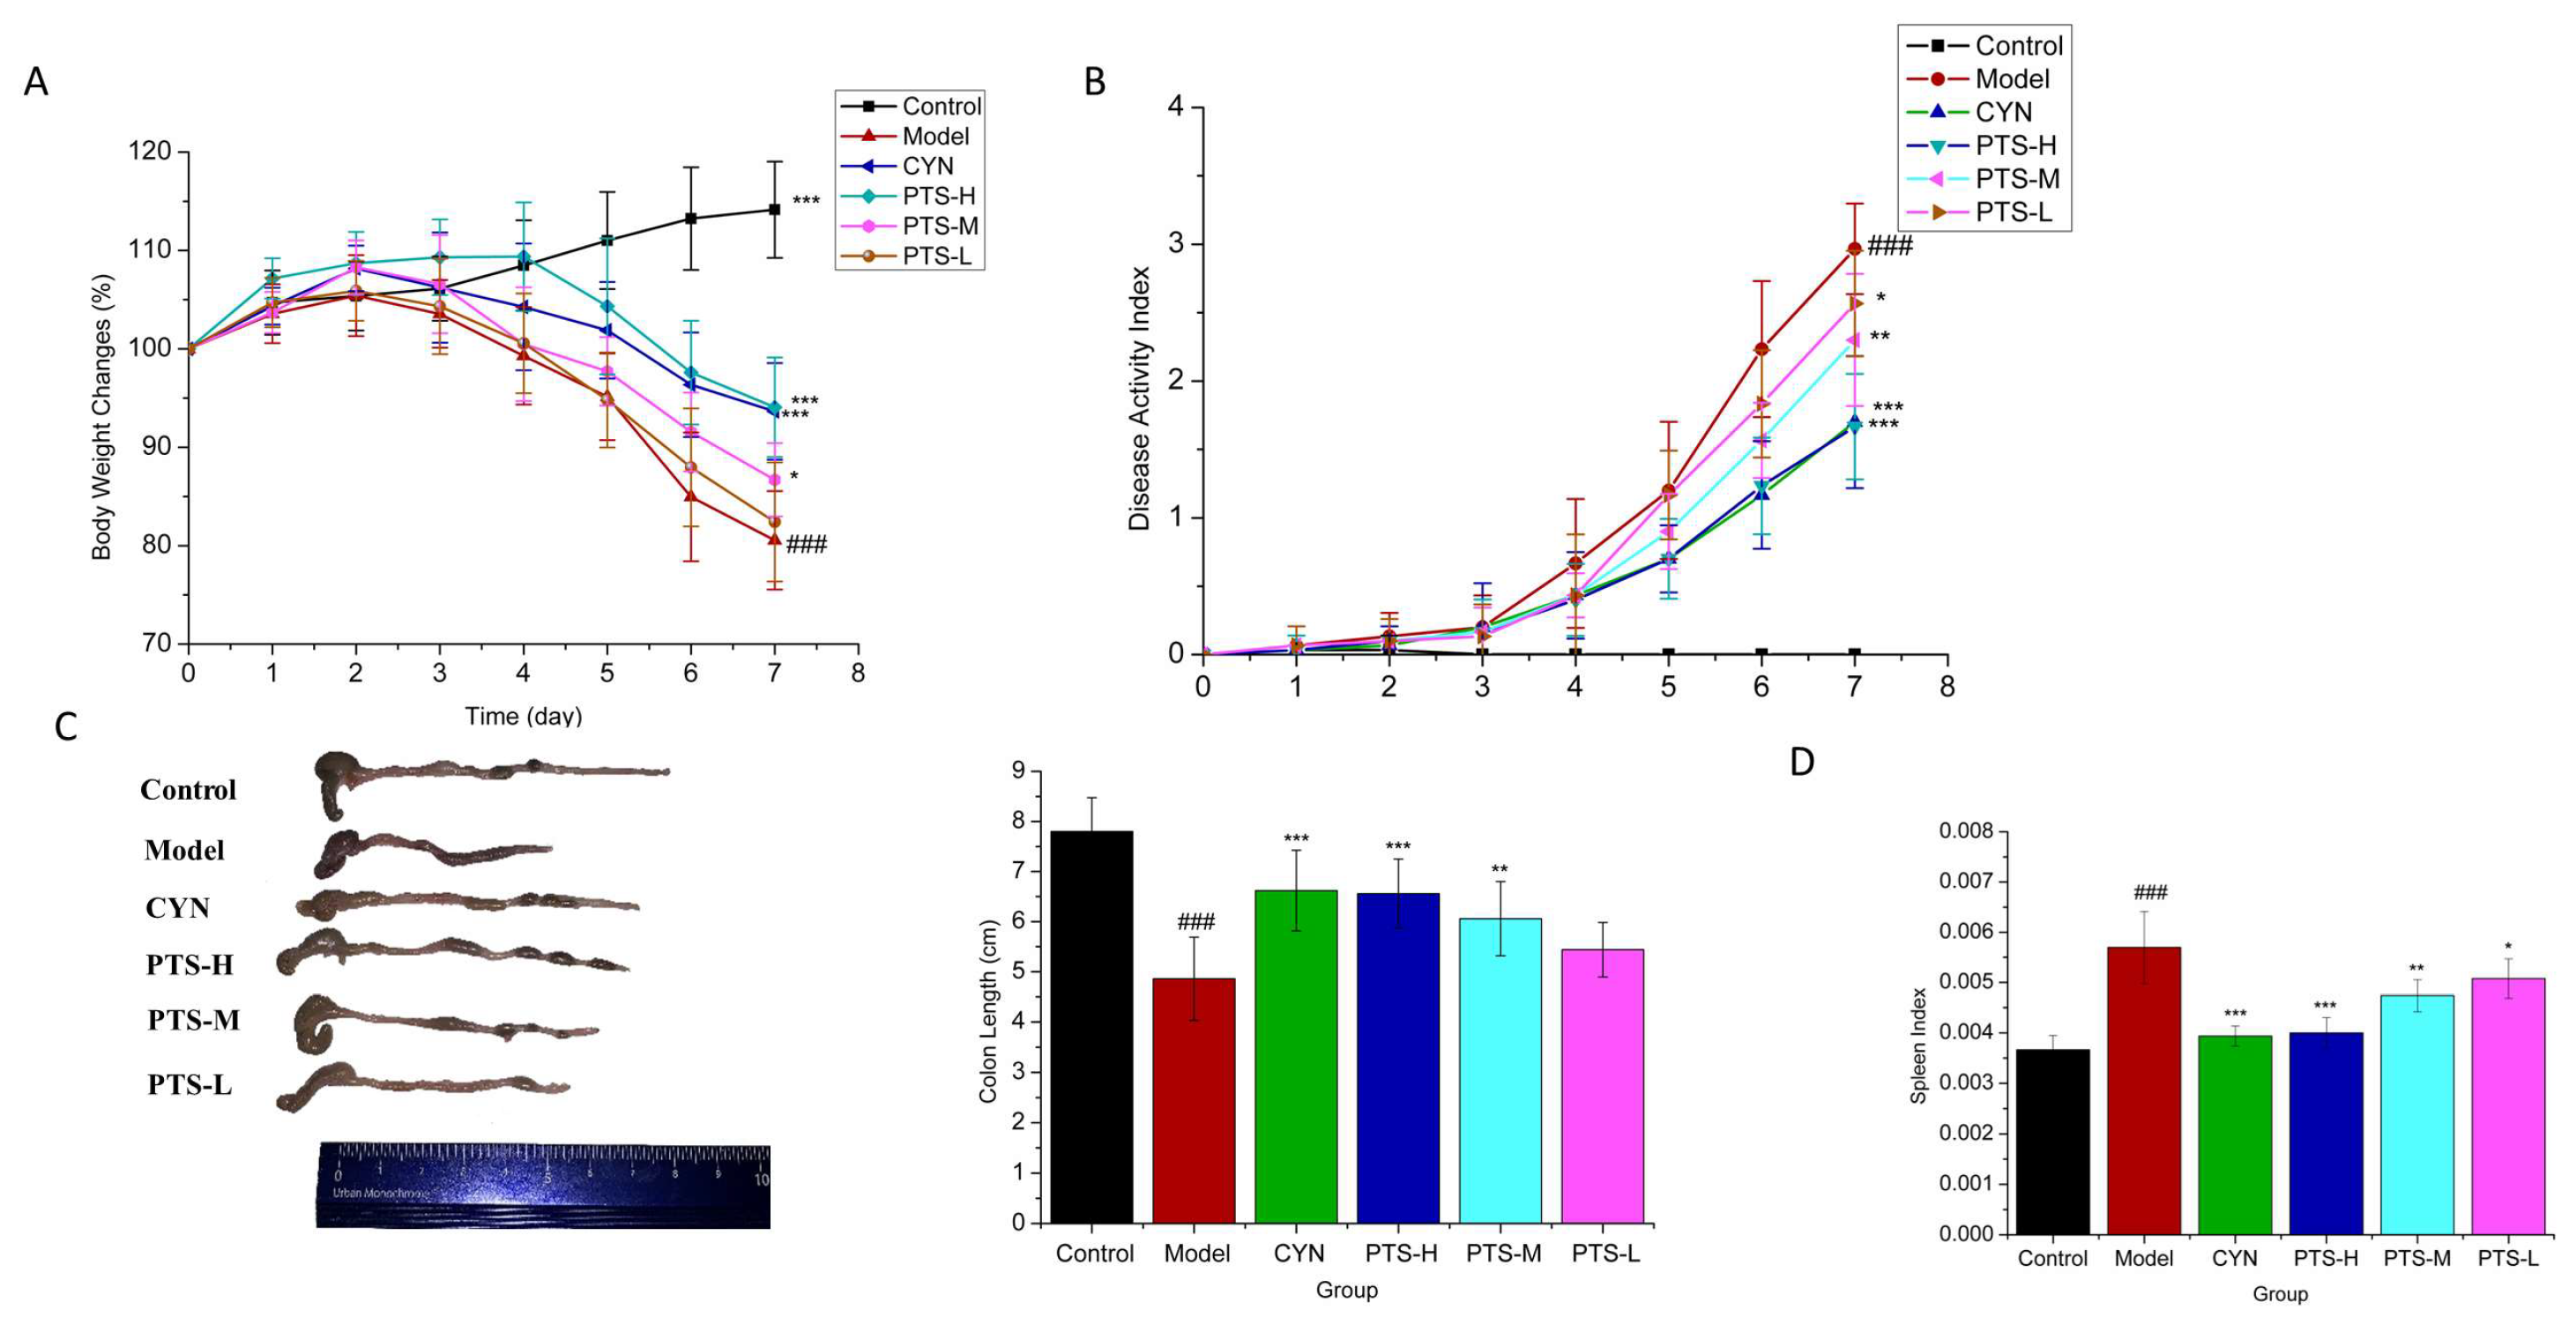
2.2. Therapeutic Effect of PTS on DSS-Induced UC Mice
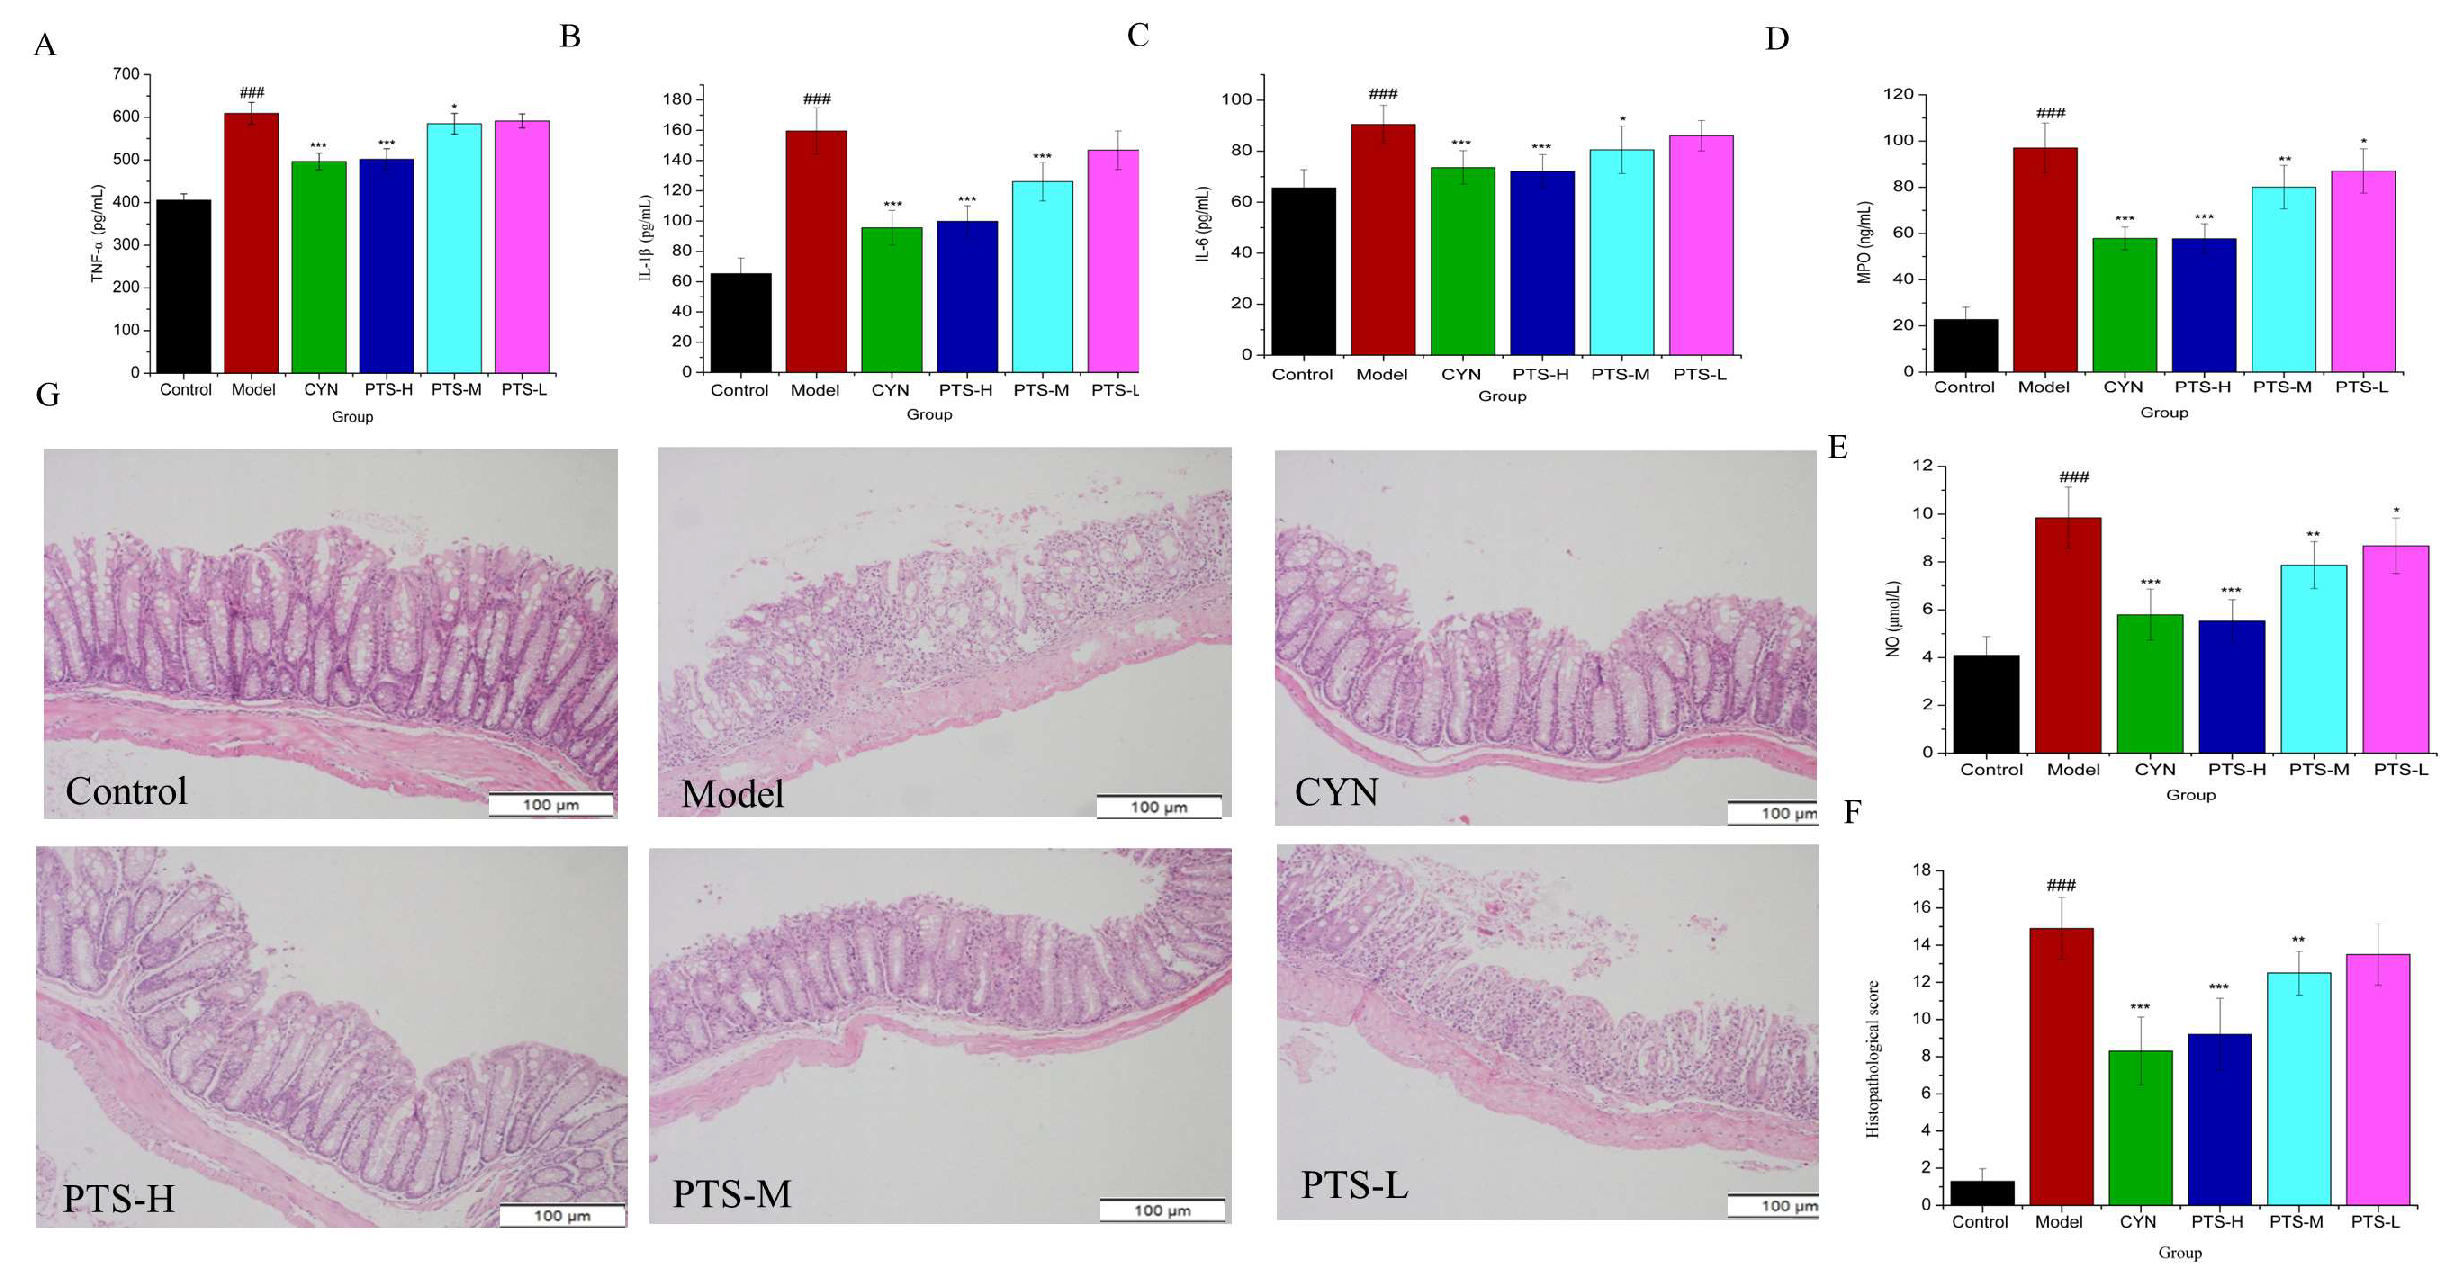
2.3. Results of ELISA Analysis
2.4. Histopathological Evaluation
2.5. Results of Serum and Colon Tissue Metabolomics
2.5.1. Validation of UPLC-QTOF-MS
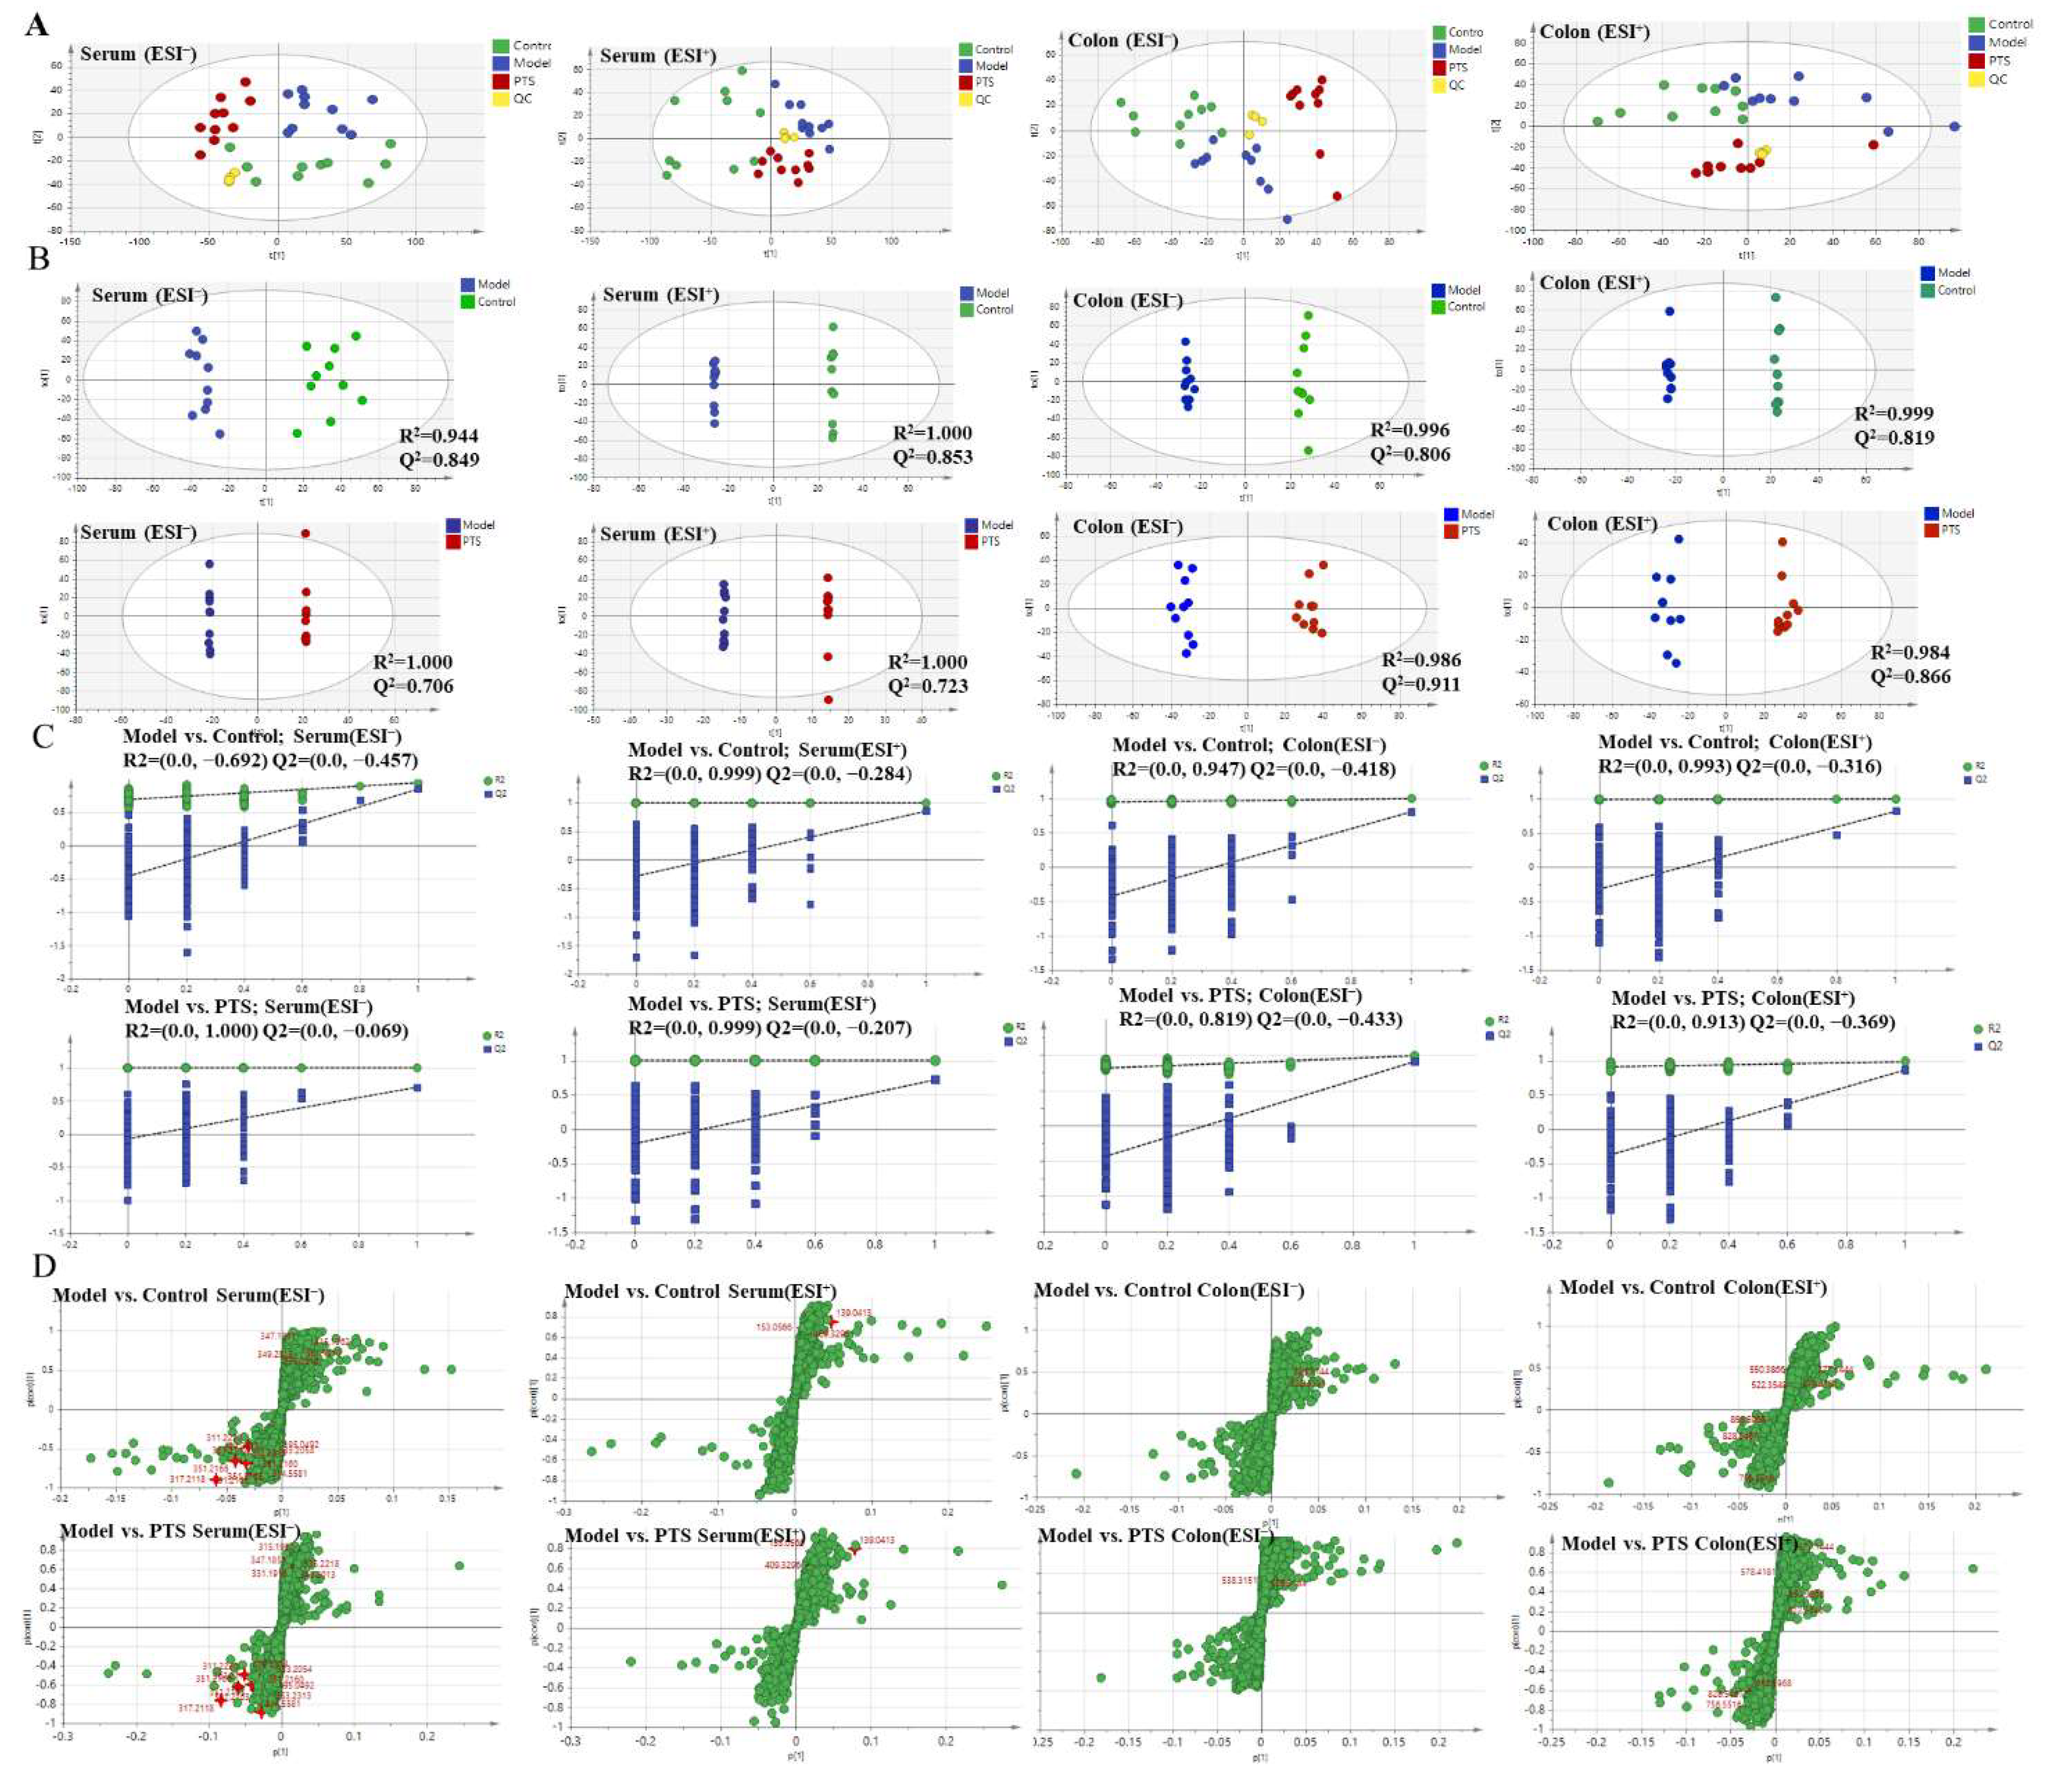
2.5.2. Multivariate Statistical Analyses
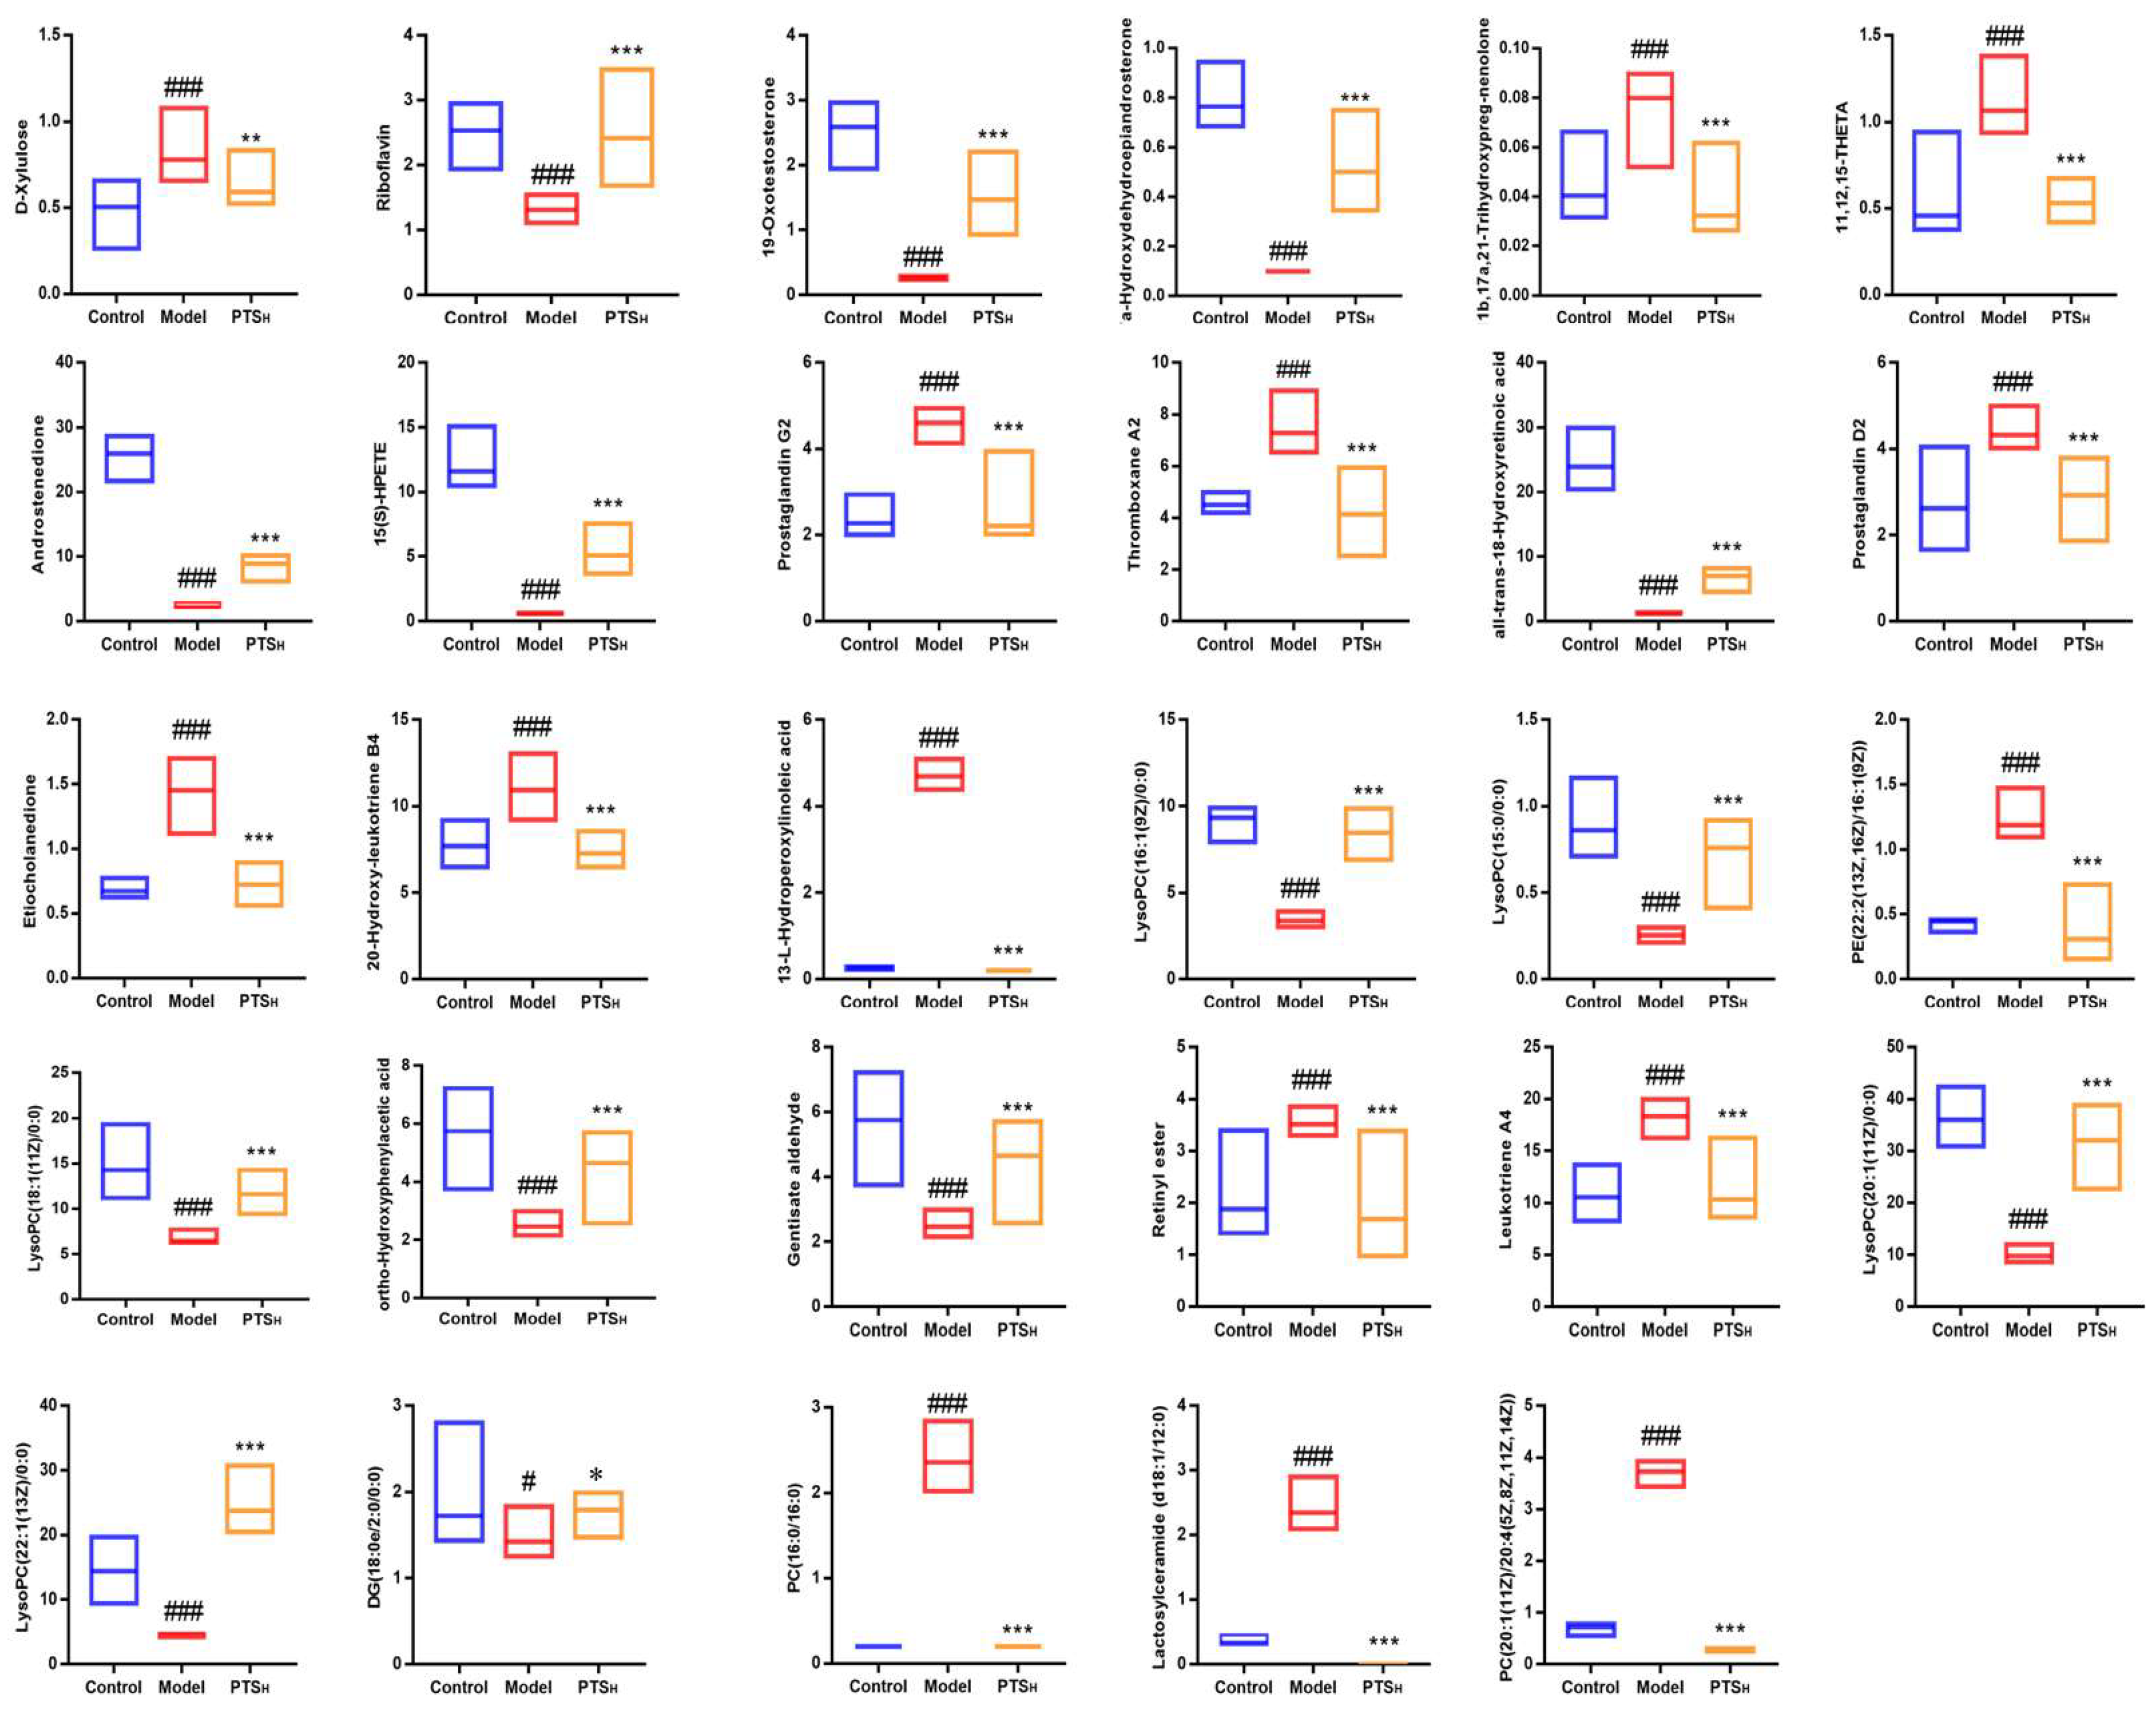
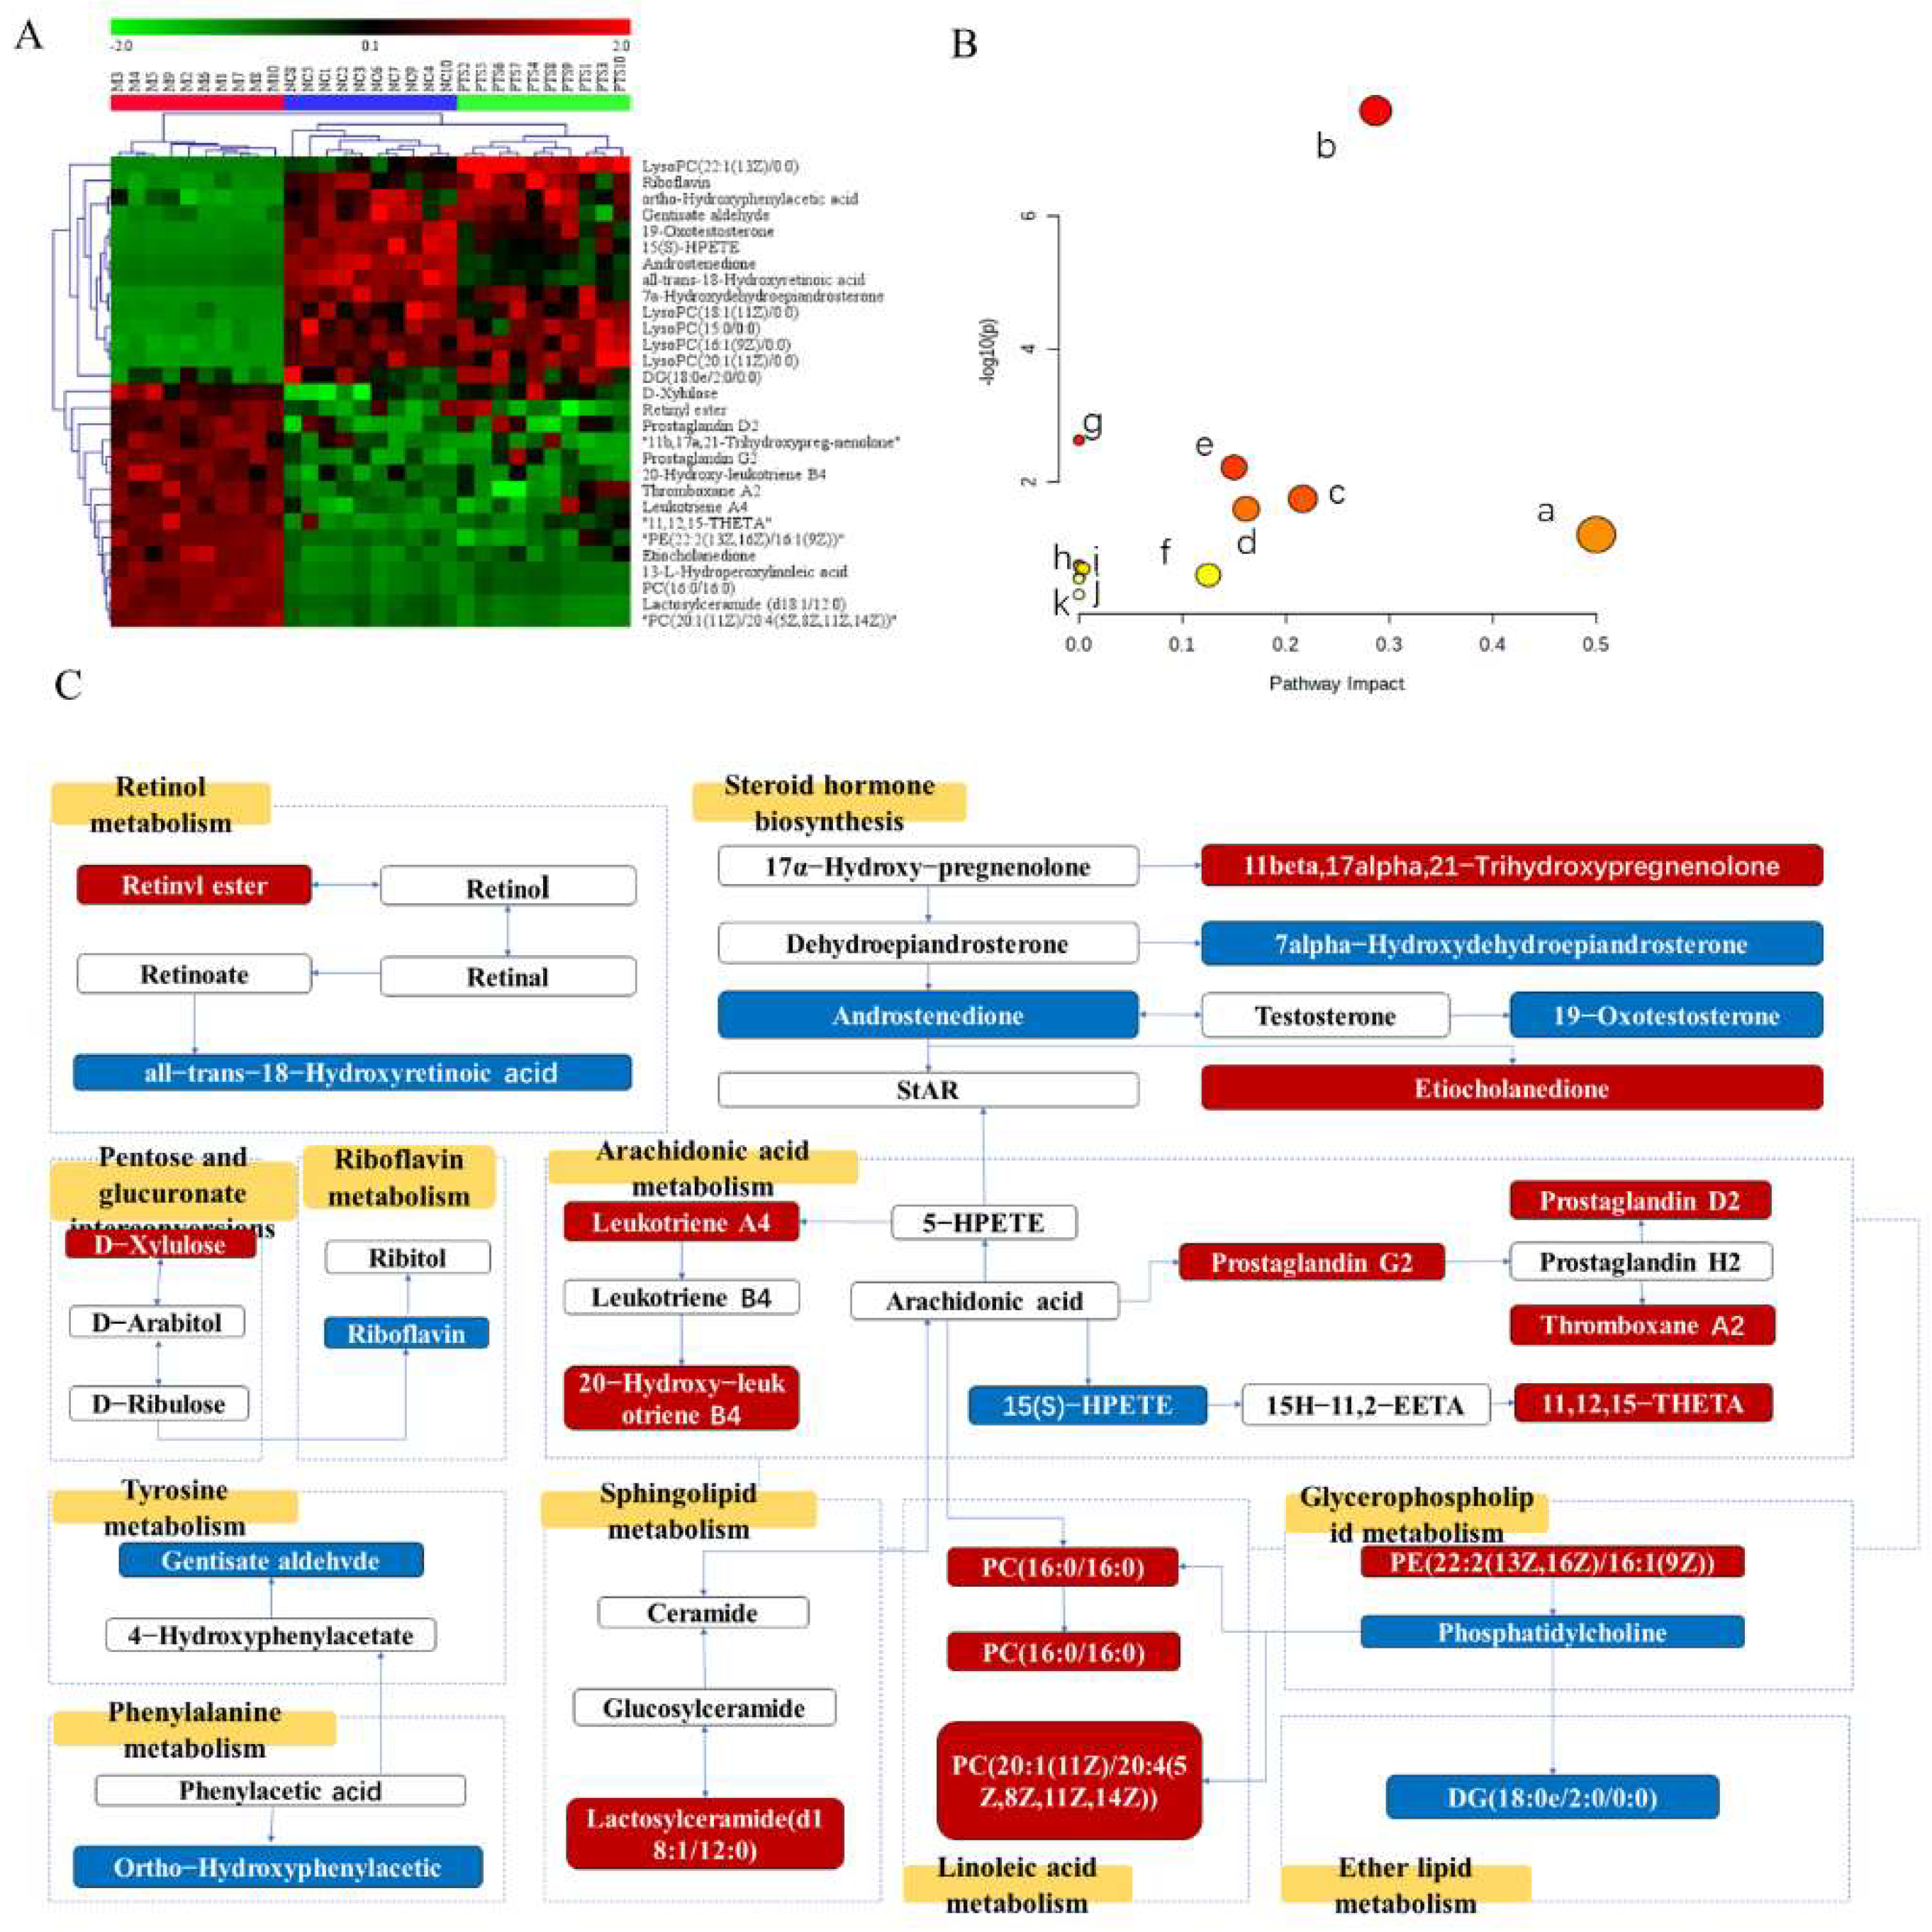
2.5.3. Screening and Identification of Metabolites
3. Discussion
4. Materials and Methods
4.1. Medical Materials and Reagents
4.2. Quantitative and Qualitative Analyses of Protopanaxatriol Saponin
4.3. Animals
4.4. Animal Model Establishment and Treatment Procedures
4.5. Disease Activity Index Score and Sample Collection
4.6. Histological Examination of Colonic Tissues
4.7. Serum and Colon Tissue Cytokine Detection
4.8. Metabolomics Sample Preparation
4.9. UPLC-Q/TOF-MS Detection Conditions
4.10. Validation of UPLC-QTOF-MS
4.11. Data Processing and Multivariate Analysis
4.12. Statistical Analysis
5. Conclusions
Supplementary Materials
Author Contributions
Funding
Institutional Review Board Statement
Informed Consent Statement
Data Availability Statement
Conflicts of Interest
Sample Availability
Abbreviations
| BPI | Base peak intensity |
| CYN | Changyanning tables |
| DAI | Disease activity index |
| DSS | Dextran sulfate sodium |
| ELISA | Enzyme-linked immunosorbent assay |
| ESI | Electrospray ionization |
| H&E | Hematoxylin and eosin stain |
| IL-6 | Interleukin-6 |
| IL-1β | Interleukin-1β |
| MPO | Myeloperoxidase |
| NO | Nitric oxide |
| OPLS-DA | Orthogonal projections to latent structures discriminant analysis |
| PC | Phosphatidyl-choline |
| PCA | Principle component analysis |
| PE | Phosphatidylethanolamine |
| PI | Peak intensities |
| PTS | Protopanaxatriol saponins |
| PTS-H | High-dosage PTS |
| PTS-L | Low-dosage PTS |
| PTS-M | Middle-dosage PTS |
| PBS | Phosphate-buffered saline |
| QC | Quality control |
| QTOF-MS | Quadrupole time-of-flight mass spectrometry |
| RSD | Relative standard deviation |
| RT | Retention time |
| SD | Standard deviation |
| TNF-α | Tumor necrosis factor-α |
| TNBS | 2,4,6-Trinitro-Benzenesulfonic acid |
| UC | Ulcerative colitis |
| UPLC | Ultra-high-performance liquid chromatography |
| VIP | Variable importance in the projection |
References
- Wang, W.W.; Xu, C.C.; Li, X.Y.; Wang, Z.B.; Yang, J.C.A.; Shen, Y.; Shi, M.G.; Chen, L.X.; Zhang, L.L.; Guo, Y.L.; et al. Exploration of the potential mechanism of Banxia Xiexin Decoction for the effects on TNBS-induced ulcerative colitis rats with the assistance of network pharmacology analysis. J. Ethnopharmacol. 2021, 277, 114197. [Google Scholar] [CrossRef] [PubMed]
- Tian, M.; Ma, P.; Zhang, Y.; Mi, Y.; Fan, D. Ginsenoside Rk3 alleviated DSS-induced ulcerative colitis by protecting colon barrier and inhibiting NLRP3 inflammasome pathway. Int. Immunopharmacol. 2020, 85, 106645. [Google Scholar] [CrossRef] [PubMed]
- Wei, S.-C.; Sollano, J.; Hui, Y.T.; Yu, W.; Santos Estrella, P.V.; Llamado, L.J.Q.; Koram, N. Epidemiology, burden of disease, and unmet needs in the treatment of ulcerative colitis in Asia. Expert Rev. Gastroenterol. Hepatol. 2021, 15, 275–289. [Google Scholar] [CrossRef] [PubMed]
- Le Berre, C.; Ananthakrishnan, A.N.; Danese, S.; Singh, S.; Peyrin-Biroulet, L. Ulcerative Colitis and Crohn’s Disease Have Similar Burden and Goals for Treatment. Clin. Gastroenterol. Hepatol. 2020, 18, 14–23. [Google Scholar] [CrossRef] [PubMed]
- Chen, X.; Xu, T.; Lv, X.; Zhang, J.; Liu, S. Ginsenoside Rh2 alleviates ulcerative colitis by regulating the STAT3/miR-214 signaling pathway. J. Ethnopharmacol. 2021, 274, 113997. [Google Scholar] [CrossRef]
- Vogler, B.K.; Pittler, M.H.; Ernst, E. The efficacy of ginseng. A systematic review of randomised clinical trials. Eur. J. Clin. Pharmacol. 1999, 55, 567–575. [Google Scholar] [CrossRef]
- Attele, A.S.; Wu, J.A.; Yuan, C.-S. Ginseng pharmacology: Multiple constituents and multiple actions. Biochem. Pharmacol. 1999, 58, 1685–1693. [Google Scholar] [CrossRef]
- Li, Z.; Ji, G.E. Ginseng and obesity. J. Ginseng Res. 2018, 42, 1–8. [Google Scholar] [CrossRef]
- Im, D.-S. Pro-Resolving Effect of Ginsenosides as an Anti-Inflammatory Mechanism of Panax ginseng. Biomolecules 2020, 10, 444. [Google Scholar] [CrossRef] [Green Version]
- Qu, Q.; Yang, F.; Zhao, C.; Liu, X.; Yang, P.; Li, Z.; Han, L.; Shi, X. Effects of fermented ginseng on the gut microbiota and immunity of rats with antibiotic-associated diarrhea. J. Ethnopharmacol. 2021, 267, 113594. [Google Scholar] [CrossRef]
- Wang, D.; Shao, S.; Zhang, Y.; Zhao, D.; Wang, M. Insight into Polysaccharides from Panax ginseng C. A. Meyer in Improving Intestinal Inflammation: Modulating Intestinal Microbiota and Autophagy. Front. Immunol. 2021, 12, 683911. [Google Scholar] [CrossRef]
- Zhang, J.; Cao, L.; Wang, H.; Cheng, X.; Wang, L.; Zhu, L.; Yan, T.; Xie, Y.; Wu, Y.; Zhao, M.; et al. Ginsenosides Regulate PXR/NF-κB Signaling and Attenuate Dextran Sulfate Sodium–Induced Colitis. Drug Metab. Dispos. 2015, 43, 1181. [Google Scholar] [CrossRef] [PubMed] [Green Version]
- Dong, J.; Liang, W.; Wang, T.; Sui, J.; Wang, J.; Deng, Z.; Chen, D. Saponins regulate intestinal inflammation in colon cancer and IBD. Pharmacol. Res. 2019, 144, 66–72. [Google Scholar] [CrossRef] [PubMed]
- Chen, L.; Meng, Y.; Sun, Q.; Zhang, Z.; Guo, X.; Sheng, X.; Tai, G.; Cheng, H.; Zhou, Y. Ginsenoside compound K sensitizes human colon cancer cells to TRAIL-induced apoptosis via autophagy-dependent and -independent DR5 upregulation. Cell Death Dis. 2016, 7, e2334. [Google Scholar] [CrossRef] [PubMed] [Green Version]
- Wang, J.; Tian, L.; Khan, M.N.; Zhang, L.; Chen, Q.; Zhao, Y.; Yan, Q.; Fu, L.; Liu, J. Ginsenoside Rg3 sensitizes hypoxic lung cancer cells to cisplatin via blocking of NF-kappa B mediated epithelial-mesenchymal transition and sternness. Cancer Lett. 2017, 415, 73–85. [Google Scholar] [CrossRef]
- Shi, R.; Zhang, S.; Cheng, G.; Yang, X.; Zhao, N.; Chen, C. Ginsenoside Rg1 and Acori Graminei Rhizoma Attenuates Neuron Cell Apoptosis by Promoting the Expression of miR-873-5p in Alzheimer’s Disease. Neurochem. Res. 2018, 43, 1529–1538. [Google Scholar] [CrossRef]
- Xu, T.-Z.; Shen, X.-Y.; Sun, L.-L.; Chen, Y.-L.; Zhang, B.-Q.; Huang, D.-K.; Li, W.-Z. Ginsenoside Rg1 protects against H2O2-induced neuronal damage due to inhibition of the NLRP1 inflammasome signalling pathway in hippocampal neurons in vitro. Int. J. Mol. Med. 2019, 43, 717–726. [Google Scholar] [CrossRef] [PubMed] [Green Version]
- Lee, I.-A.; Hyam, S.R.; Jang, S.-E.; Han, M.J.; Kim, D.-H. Ginsenoside Re Ameliorates Inflammation by Inhibiting the Binding of Lipopolysaccharide to TLR4 on Macrophages. J. Agric. Food Chem. 2012, 60, 9595–9602. [Google Scholar] [CrossRef]
- Lee, S.Y.; Jeong, J.J.; Eun, S.H.; Kim, D.H. Anti-inflammatory effects of ginsenoside Rg1 and its metabolites ginsenoside Rh1 and 20(S)-protopanaxatriol in mice with TNBS-induced colitis. Eur. J. Pharmacol. 2015, 762, 333–343. [Google Scholar] [CrossRef]
- Wang, Y.; Liu, Y.; Zhang, X.Y.; Xu, L.H.; Ouyang, D.Y.; Liu, K.P.; Pan, H.; He, J.; He, X.H. Ginsenoside Rg1 regulates innate immune responses in macrophages through differentially modulating the NF-kappa B and PI3K/Akt/mTOR pathways. Int. Immunopharmacol. 2014, 23, 77–84. [Google Scholar] [CrossRef]
- Liu, K.; Song, Y.; Liu, Y.; Peng, M.; Li, H.; Li, X.; Feng, B.; Xu, P.; Su, D. An integrated strategy using UPLC-QTOF-MSE and UPLC-QTOF-MRM (enhanced target) for pharmacokinetics study of wine processed Schisandra Chinensis fructus in rats. J. Pharm. Biomed. Anal. 2017, 139, 165–178. [Google Scholar] [CrossRef] [PubMed] [Green Version]
- Want, E.J. LC-MS Untargeted Analysis. In Metabolic Profiling: Methods and Protocols; Theodoridis, G.A., Gika, H.G., Wilson, I.D., Eds.; Springer: New York, NY, USA, 2018; pp. 99–116. [Google Scholar]
- Johnson, C.H.; Ivanisevic, J.; Siuzdak, G. Metabolomics: Beyond biomarkers and towards mechanisms. Nat. Rev. Mol. Cell Biol. 2016, 17, 451–459. [Google Scholar] [CrossRef] [PubMed] [Green Version]
- Schrimpe-Rutledge, A.C.; Codreanu, S.G.; Sherrod, S.D.; McLean, J.A. Untargeted Metabolomics Strategies-Challenges and Emerging Directions. J. Am. Soc. Mass Spectrom. 2016, 27, 1897–1905. [Google Scholar] [CrossRef] [Green Version]
- Su, B.; Luo, P.; Yang, Z.; Yu, P.; Li, Z.; Yin, P.; Zhou, L.; Fan, J.; Huang, X.; Lin, X.; et al. A novel analysis method for biomarker identification based on horizontal relationship: Identifying potential biomarkers from large-scale hepatocellular carcinoma metabolomics data. Anal. Bioanal. Chem. 2019, 411, 6377–6386. [Google Scholar] [CrossRef]
- Chassaing, B.; Aitken, J.D.; Malleshappa, M.; Vijay-Kumar, M. Dextran Sulfate Sodium (DSS)-Induced Colitis in Mice. Curr. Protoc. Immunol. 2014, 104, 15.25.11–15.25.14. [Google Scholar] [CrossRef] [PubMed] [Green Version]
- Ali, T.; Shakir, F.; Morton, J. Curcumin and inflammatory bowel disease: Biological mechanisms and clinical implication. Digestion 2012, 85, 249–255. [Google Scholar] [CrossRef] [PubMed]
- Hsiang, C.Y.; Lo, H.Y.; Huang, H.C.; Li, C.C.; Wu, S.L.; Ho, T.Y. Ginger extract and zingerone ameliorated trinitrobenzene sulphonic acid-induced colitis in mice via modulation of nuclear factor-κB activity and interleukin-1β signalling pathway. Food Chem. 2013, 136, 170–177. [Google Scholar] [CrossRef] [PubMed]
- Langmead, L.; Makins, R.J.; Rampton, D.S. Anti-inflammatory effects of aloe vera gel in human colorectal mucosa in vitro. Aliment. Pharmacol. Ther. 2004, 19, 521–527. [Google Scholar] [CrossRef]
- Peng, Y.; Yan, Y.; Wan, P.; Chen, D.; Ding, Y.; Ran, L.; Mi, J.; Lu, L.; Zhang, Z.; Li, X.; et al. Gut microbiota modulation and anti-inflammatory properties of anthocyanins from the fruits of Lycium ruthenicum Murray in dextran sodium sulfate-induced colitis in mice. Free Radic. Biol. Med. 2019, 136, 96–108. [Google Scholar] [CrossRef]
- Corsi, L. Effects of the Novel Non-Peptidyl Low Molecular Weight Radical Scavenger IAC in Different Models of Inflammation: A New Perspective in Anti-Inflammatory Therapy. Curr. Med. Chem. 2010, 17, 3918–3924. [Google Scholar] [CrossRef]
- Li, H.; Wu, W.K.K.; Li, Z.J.; Chan, K.M.; Wong, C.C.M.; Ye, C.G.; Yu, L.; Sung, J.J.Y.; Cho, C.H.; Wang, M. 2,3′,4,4′,5′-Pentamethoxy-trans-stilbene, a resveratrol derivative, inhibits colitis-associated colorectal carcinogenesis in mice. Br. J. Pharmacol. 2010, 160, 1352–1361. [Google Scholar] [CrossRef] [PubMed] [Green Version]
- Krawisz, J.E.; Sharon, P.; Stenson, W.F. Quantitative assay for acute intestinal inflammation based on myeloperoxidase activity. Assessment of inflammation in rat and hamster models. Gastroenterology 1984, 87, 1344–1350. [Google Scholar] [CrossRef] [PubMed]
- Probert, F.; Walsh, A.; Jagielowicz, M.; Yeo, T.; Claridge, T.D.W.; Simmons, A.; Travis, S.; Anthony, D.C. Plasma Nuclear Magnetic Resonance Metabolomics Discriminates Between High and Low Endoscopic Activity and Predicts Progression in a Prospective Cohort of Patients with Ulcerative Colitis. J. Crohn’s Colitis 2018, 12, 1326–1337. [Google Scholar] [CrossRef] [PubMed]
- Powers, H.J. Riboflavin (vitamin B-2) and health. Am. J. Clin. Nutr. 2003, 77, 1352–1360. [Google Scholar] [CrossRef] [PubMed] [Green Version]
- Cumming, R.G.; Mitchell, P.; Smith, W. Diet and cataract—The Blue Mountains Eye Study. Ophthalmology 2000, 107, 450–456. [Google Scholar] [CrossRef] [PubMed]
- Alam, M.M.; Iqbal, S.; Naseem, I. Ameliorative effect of riboflavin on hyperglycemia, oxidative stress and DNA damage in type-2 diabetic mice: Mechanistic and therapeutic strategies. Arch. Biochem. Biophys. 2015, 584, 10–19. [Google Scholar] [CrossRef]
- LeBlanc, J.G.; Levit, R.; de Giori, G.S.; de Moreno de LeBlanc, A. Application of vitamin-producing lactic acid bacteria to treat intestinal inflammatory diseases. Appl. Microbiol. Biotechnol. 2020, 104, 3331–3337. [Google Scholar] [CrossRef]
- Tallima, H.; El Ridi, R. Arachidonic acid: Physiological roles and potential health benefits—A review. J. Adv. Res. 2018, 11, 33–41. [Google Scholar] [CrossRef]
- Guan, S.; Jia, B.; Chao, K.; Zhu, X.; Tang, J.; Li, M.; Wu, L.; Xing, L.; Liu, K.; Zhang, L.; et al. UPLC-QTOF-MS-Based Plasma Lipidomic Profiling Reveals Biomarkers for Inflammatory Bowel Disease Diagnosis. J. Proteome Res. 2020, 19, 600–609. [Google Scholar] [CrossRef]
- Hamabata, T.; Nakamura, T.; Masuko, S.; Maeda, S.; Murata, T. Production of lipid mediators across different disease stages of dextran sodium sulfate-induced colitis in mice. J. Lipid Res. 2018, 59, 586–595. [Google Scholar] [CrossRef]
- Zhang, J.; Liang, S.; Ning, R.; Jiang, J.; Zhang, J.; Shen, H.; Chen, R.; Duan, J.; Sun, Z. PM2.5-induced inflammation and lipidome alteration associated with the development of atherosclerosis based on a targeted lipidomic analysis. Environ. Int. 2020, 136, 105444. [Google Scholar] [CrossRef] [PubMed]
- Fabisiak, N.; Fabisiak, A.; Watala, C.; Fichna, J. Fat-soluble Vitamin Deficiencies and Inflammatory Bowel Disease Systematic Review and Meta-Analysis. J. Clin. Gastroenterol. 2017, 51, 878–889. [Google Scholar] [CrossRef] [PubMed]
- Yang, H.; Tao, Y.; Zhang, M.; Ma, P.; Li, L.; Diao, Q. Effects of 9-cis-retinoic acid on the proliferation and apoptosis of cutaneous T-cell lymphoma cells. Anti-Cancer Drugs 2019, 30, 56–64. [Google Scholar] [CrossRef] [PubMed]
- Goto, Y.; Ivanov, I.I. Intestinal epithelial cells as mediators of the commensal-host immune crosstalk. Immunol. Cell Biol. 2013, 91, 204–214. [Google Scholar] [CrossRef] [Green Version]
- Peterson, L.W.; Artis, D. Intestinal epithelial cells: Regulators of barrier function and immune homeostasis. Nat. Rev. Immunol. 2014, 14, 141–153. [Google Scholar] [CrossRef]
- Bouguen, G.; Langlois, A.; Djouina, M.; Branche, J.; Koriche, D.; Dewaeles, E.; Mongy, A.; Auwerx, J.; Colombel, J.-F.; Desreumaux, P.; et al. Intestinal steroidogenesis controls PPAR expression in the colon and is impaired during ulcerative colitis. Gut 2015, 64, 901–910. [Google Scholar] [CrossRef]
- Danese, S.; Fiocchi, C. Ulcerative colitis. N. Engl. J. Med. 2011, 365, 1713–1725. [Google Scholar] [CrossRef] [Green Version]
- Huck, J.H.J.; Roos, B.; Jakobs, C.; van der Knaap, M.S.; Verhoeven, N.M. Evaluation of pentitol metabolism in mammalian tissues provides new insight into disorders of human sugar metabolism. Mol. Genet. Metab. 2004, 82, 231–237. [Google Scholar] [CrossRef]
- Ramsden, C.E.; Ringel, A.; Feldstein, A.E.; Taha, A.Y.; MacIntosh, B.A.; Hibbeln, J.R.; Majchrzak-Hong, S.F.; Faurot, K.R.; Rapoport, S.I.; Cheon, Y.; et al. Lowering dietary linoleic acid reduces bioactive oxidized linoleic acid metabolites in humans. Prostaglandins Leukot. Essent. Fat. Acids 2012, 87, 135–141. [Google Scholar] [CrossRef] [Green Version]
- Hong, Z.; Cai, Q.; Duan, X.; Yang, Y.; Wu, H.; Jiang, N.; Fan, H. Effect of compound Sophorae decoction in the treatment of ulcerative colitis by tissue extract metabolomics approach. J. Tradit. Chin. Med. 2021, 41, 414–423. [Google Scholar] [CrossRef]
- Hisamatsu, T.; Okamoto, S.; Hashimoto, M.; Muramatsu, T.; Andou, A.; Uo, M.; Kitazume, M.T.; Matsuoka, K.; Yajima, T.; Inoue, N.; et al. Novel, Objective, Multivariate Biomarkers Composed of Plasma Amino Acid Profiles for the Diagnosis and Assessment of Inflammatory Bowel Disease. PLoS ONE 2012, 7, e31131. [Google Scholar] [CrossRef] [PubMed] [Green Version]
- Nong, F.; Luo, S.; Liang, Y.; Zhao, Z.; Xing, S.; Wen, B.; Zhou, L. Evaluation of the effect of Dahuang-Mudan decoction on TNBS-induced colitis using UPLC-QTOF/MS-based metabolomic analysis. Biomed. Chromatogr. 2020, 35, e5003. [Google Scholar] [CrossRef] [PubMed]
- Fahy, E.; Subramaniam, S.; Brown, H.A.; Glass, C.K.; Merrill, A.H.; Murphy, R.C.; Raetz, C.R.H.; Russell, D.W.; Seyama, Y.; Shaw, W.; et al. A comprehensive classification system for lipids. J. Lipid Res. 2005, 46, 839–861. [Google Scholar] [CrossRef] [PubMed] [Green Version]
- Bauer, J.; Liebisch, G.; Hofmann, C.; Huy, C.; Schmitz, G.; Obermeier, F.; Bock, J. Lipid Alterations in Experimental Murine Colitis: Role of Ceramide and Imipramine for Matrix Metalloproteinase-1 Expression. PLoS ONE 2009, 4, e7197. [Google Scholar] [CrossRef] [Green Version]
- Diab, J.; Hansen, T.; Goll, R.; Stenlund, H.; Ahnlund, M.; Jensen, E.; Moritz, T.; Florholmen, J.; Forsdahl, G. Lipidomics in Ulcerative Colitis Reveal Alteration in Mucosal Lipid Composition Associated with the Disease State. Inflamm. Bowel Dis. 2019, 25, 1780–1787. [Google Scholar] [CrossRef]
- Cooper, H.S.; Murthy, S.N.; Shah, R.S.; Sedergran, D.J. Clinicopathologic study of dextran sulfate sodium experimental murine colitis. Lab. Investig. J. Tech. Methods Pathol. 1993, 69, 238–249. [Google Scholar]
- Majumder, K.; Fukuda, T.; Zhang, H.; Sakurai, T.; Taniguchi, Y.; Watanabe, H.; Mitsuzumi, H.; Matsui, T.; Mine, Y. Intervention of Isomaltodextrin Mitigates Intestinal Inflammation in a Dextran Sodium Sulfate-Induced Mouse Model of Colitis via Inhibition of Toll-like Receptor-4. J. Agric. Food Chem. 2017, 65, 810–817. [Google Scholar] [CrossRef]


| Compound | Contents (%) |
|---|---|
| Ginsenoside Rg1 | 18.68 ± 0.64 |
| Ginsenoside Re | 29.01 ± 0.85 |
| No. | RT (min) | Metabolite | Formula | m/z | Δm (PPM) | Adducts | HMDB ID | KEGG ID | Source | Trend | |
|---|---|---|---|---|---|---|---|---|---|---|---|
| M vs. C | PTS-H vs. M | ||||||||||
| 1a | 0.69 | D-Xylulose | C5H10O5 | 195.0492 | −9.23 | [M+FA-H]− | HMDB01644 | C00310 | Serum | ↑ | ↓ |
| 2 * | 3.40 | Riboflavin | C17H20N4O6 | 377.1444 | −3.18 | [M+H]+ | HMDB00244 | C00255 | Colon | ↓ | ↑ |
| 3a | 8.46 | 19-Oxotestosterone | C19H26O3 | 347.1851 | −3.74 | [M+FA-H]− | HMDB03959 | C05295 | Serum | ↓ | ↑ |
| 4a | 9.05 | 7a-Hydroxydehydroepiandrosterone | C19H28O3 | 349.2013 | −2.00 | [M+FA-H]− | HMDB04611 | C18045 | Serum | ↓ | ↑ |
| 5a | 9.98 | 11b,17a,21-Trihydroxypreg-nenolone | C21H32O5 | 409.2213 | −4.64 | [M+FA-H]− | HMDB06760 | C05489 | Serum | ↑ | ↓ |
| 6a | 10.33 | 11,12,15-THETA | C20H34O5 | 353.2313 | −5.66 | [M-H]− | HMDB04684 | C14782 | Serum | ↑ | ↓ |
| 7a | 10.50 | Androstenedione | C19H26O2 | 331.191 | −1.51 | [M+FA-H]− | HMDB00053 | C00280 | Serum | ↓ | ↑ |
| 8a | 12.01 | 15(S)-HPETE | C20H32O4 | 335.2218 | −2.98 | [M-H]− | HMDB04244 | C05966 | Serum | ↓ | ↑ |
| 9a | 12.78 | Prostaglandin G2 | C20H32O6 | 367.2112 | −3.81 | [M-H]− | HMDB03235 | C05956 | Serum | ↑ | ↓ |
| 10a | 13.03 | Thromboxane A2 | C20H32O5 | 351.2165 | −3.42 | [M-H]− | HMDB01452 | C02198 | Serum | ↑ | ↓ |
| 11a | 13.27 | all-trans-18-Hydroxyretinoic acid | C20H28O3 | 315.1962 | −1.27 | [M-H]− | HMDB12452 | C16679 | Serum | ↓ | ↑ |
| 12 * | 13.71 | Prostaglandin D2 | C20H32O5 | 351.216 | −4.84 | [M-H]− | HMDB01403 | C00696 | Serum | ↑ | ↓ |
| 13a | 14.05 | Etiocholanedione | C19H28O2 | 333.2054 | 3.59 | [M+FA-H]− | HMDB03769 | C03772 | Serum | ↑ | ↓ |
| 14 * | 14.57 | 20-Hydroxy-leukotriene B4 | C20H32O5 | 351.2166 | −3.13 | [M-H]− | HMDB01509 | C04853 | Serum | ↑ | ↓ |
| 15a | 15.07 | 13-L-Hydroperoxylinoleic acid | C18H32O4 | 311.223 | 0.64 | [M-H]− | HMDB03871 | C04717 | Serum | ↑ | ↓ |
| 16a | 16.37 | LysoPC (16:1(9Z)/0:0) | C24H48NO7P | 538.3151 | 0.19 | [M+FA-H]− | HMDB10383 | C04230 | Colon | ↓ | ↑ |
| 17a | 16.39 | LysoPC (15:0/0:0) | C23H48NO7P | 526.3144 | −1.14 | [M+FA-H]− | HMDB10381 | C04230 | Colon | ↓ | ↑ |
| 18a | 17.59 | PE (22:2(13Z,16Z)/16:1(9Z)) | C43H80NO8P | 814.5581 | −2.82 | [M+FA-H]− | HMDB09551 | C00350 | Serum | ↑ | ↓ |
| 19a | 18.26 | LysoPC (18:1(11Z)/0:0) | C26H52NO7P | 522.3548 | −1.15 | [M+H]+ | HMDB10385 | C04230 | Colon | ↓ | ↑ |
| 20a | 18.55 | ortho-Hydroxyphenylacetic acid | C8H8O3 | 153.0566 | 1.31 | [M+H]+ | HMDB00669 | C05852 | Serum | ↓ | ↑ |
| 21a | 18.59 | Gentisate aldehyde | C7H6O3 | 139.0413 | 1.65 | [M+H]+ | HMDB04062 | C05585 | Serum | ↓ | ↑ |
| 22a | 18.72 | Retinyl ester | C20H30O2 | 301.2163 | −3.32 | [M-H]− | HMDB0003598 | C02075 | Serum | ↑ | ↓ |
| 23a | 19.70 | Leukotriene A4 | C20H30O3 | 317.2118 | −1.26 | [M-H]− | HMDB01337 | C00909 | Serum | ↑ | ↓ |
| 24a | 21.15 | LysoPC (20:1(11Z)/0:0) | C28H56NO7P | 550.3866 | −0.18 | [M+H]+ | HMDB10391 | C04230 | Colon | ↓ | ↑ |
| 25a | 23.65 | LysoPC (22:1(13Z)/0:0) | C30H60NO7P | 578.4181 | 0.17 | [M+H]+ | HMDB10399 | C04230 | Colon | ↓ | ↑ |
| 26a | 25.00 | DG (18:0e/2:0/0:0) | C23H46O4 | 409.3296 | 1.95 | [M+Na]+ | HMDB11147 | C03820 | Serum | ↓ | ↑ |
| 27 * | 25.05 | PC (16:0/16:0) | C40H80NO8P | 756.5516 | 0.26 | [M+Na]+ | HMDB00564 | C00157 | Colon | ↑ | ↓ |
| 28a | 25.62 | Lactosylceramide (d18:1/12:0) | C42H79NO13 | 828.5467 | 2.78 | [M+Na]+ | HMDB04866 | C01290 | Colon | ↑ | ↓ |
| 29a | 26.18 | PC (20:1(11Z)/20:4(5Z,8Z,11Z,14Z)) | C48H86NO8P | 858.5968 | −1.75 | [M+Na]+ | HMDB08312 | C00157 | Colon | ↑ | ↓ |
Publisher’s Note: MDPI stays neutral with regard to jurisdictional claims in published maps and institutional affiliations. |
© 2022 by the authors. Licensee MDPI, Basel, Switzerland. This article is an open access article distributed under the terms and conditions of the Creative Commons Attribution (CC BY) license (https://creativecommons.org/licenses/by/4.0/).
Share and Cite
Wu, F.; Lai, S.; Feng, H.; Liu, J.; Fu, D.; Wang, C.; Wang, C.; Liu, J.; Li, Z.; Li, P. Protective Effects of Protopanaxatriol Saponins on Ulcerative Colitis in Mouse Based on UPLC-Q/TOF-MS Serum and Colon Metabolomics. Molecules 2022, 27, 8346. https://doi.org/10.3390/molecules27238346
Wu F, Lai S, Feng H, Liu J, Fu D, Wang C, Wang C, Liu J, Li Z, Li P. Protective Effects of Protopanaxatriol Saponins on Ulcerative Colitis in Mouse Based on UPLC-Q/TOF-MS Serum and Colon Metabolomics. Molecules. 2022; 27(23):8346. https://doi.org/10.3390/molecules27238346
Chicago/Turabian StyleWu, Fulin, Sihan Lai, Hao Feng, Juntong Liu, Dongxing Fu, Caixia Wang, Cuizhu Wang, Jinping Liu, Zhuo Li, and Pingya Li. 2022. "Protective Effects of Protopanaxatriol Saponins on Ulcerative Colitis in Mouse Based on UPLC-Q/TOF-MS Serum and Colon Metabolomics" Molecules 27, no. 23: 8346. https://doi.org/10.3390/molecules27238346