
Revisiting Non-Conventional Crystallinity-Induced Effects on Molecular Mobility in Sustainable Diblock Copolymers of Poly(propylene adipate) and Polylactide

 ,
, 
 , , ,
, , , 
Abstract
:1. Introduction
2. Experimental
2.1. Materials
2.2. Experimental Methods
2.2.1. Differential Scanning Calorimetry
2.2.2. Polarized Light Microscopy
2.2.3. Broadband Dielectric Spectroscopy
3. Results and Discussion
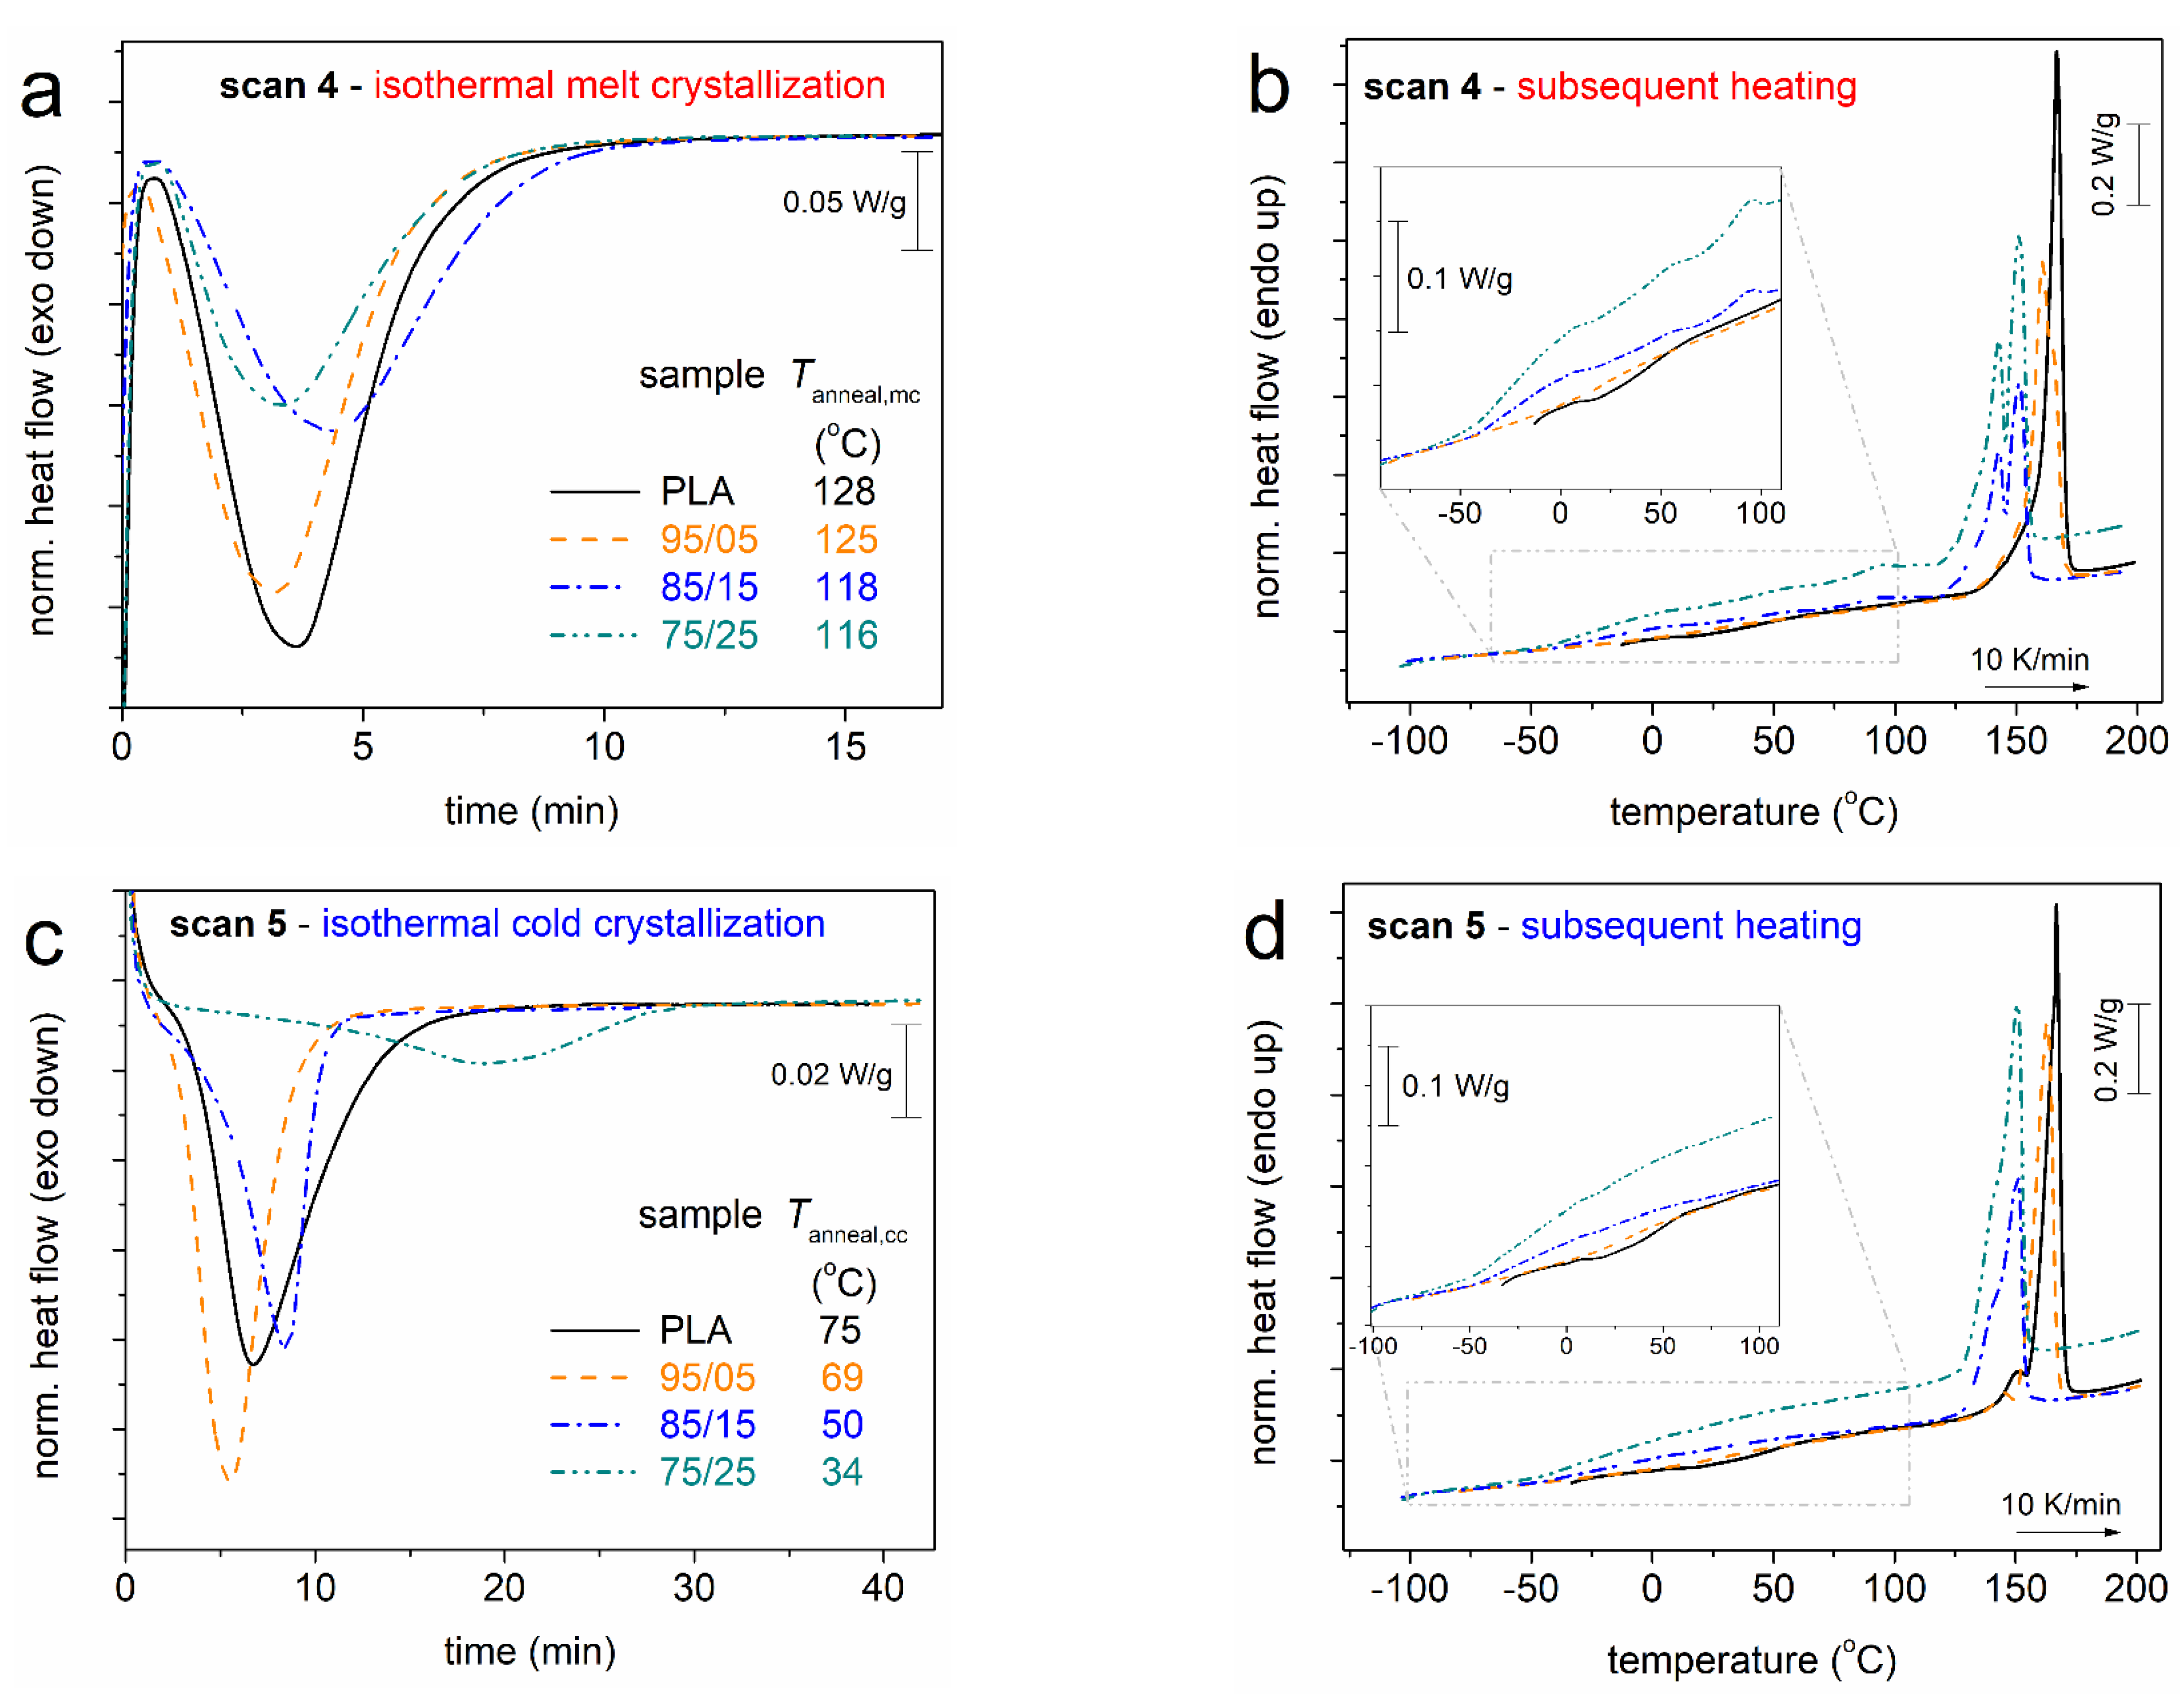
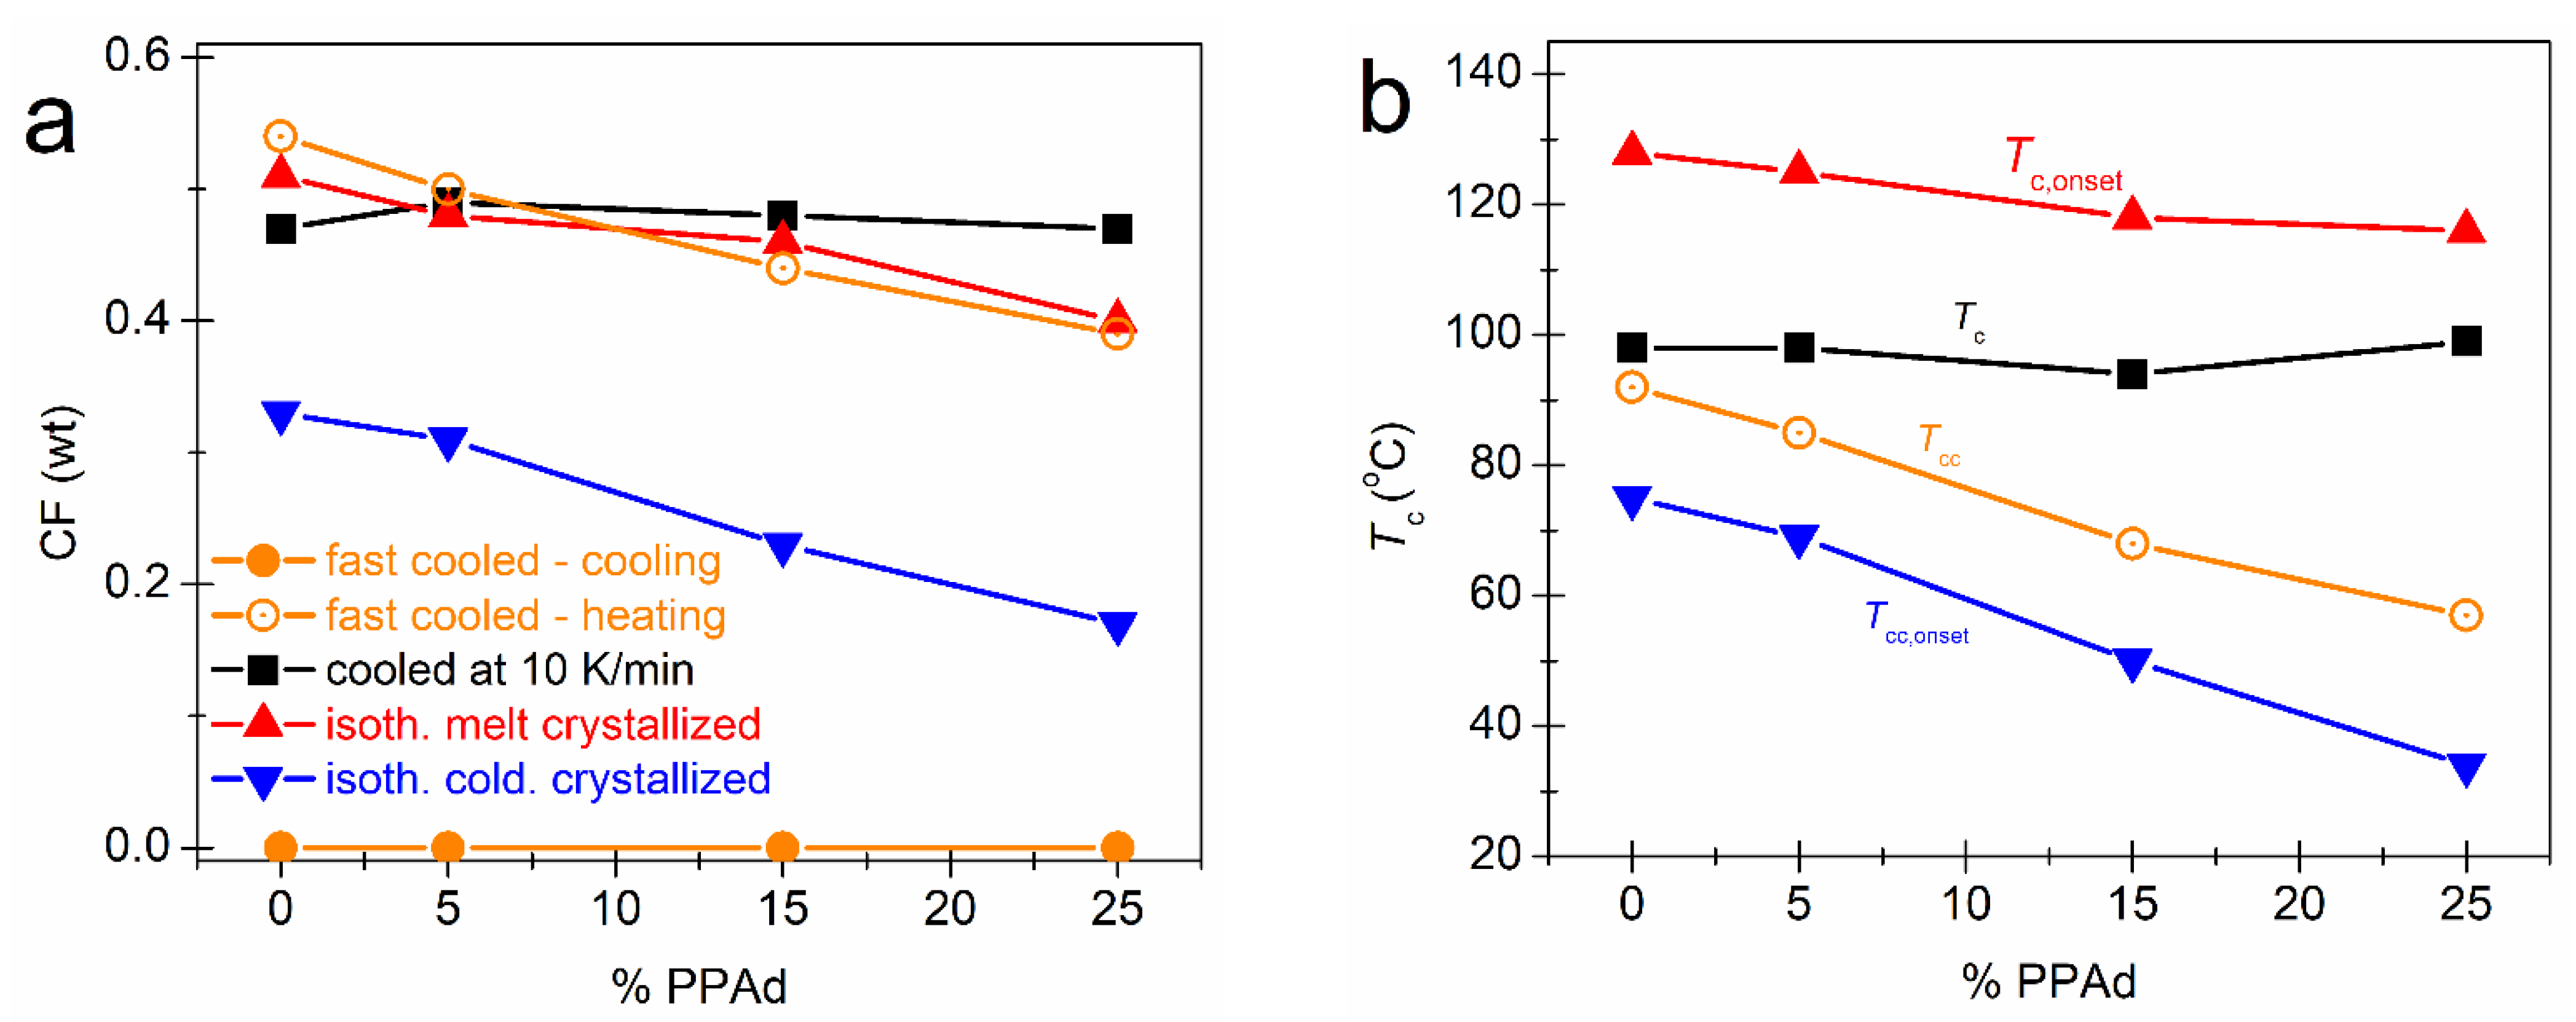
3.1. Crystallization and Glass Transition
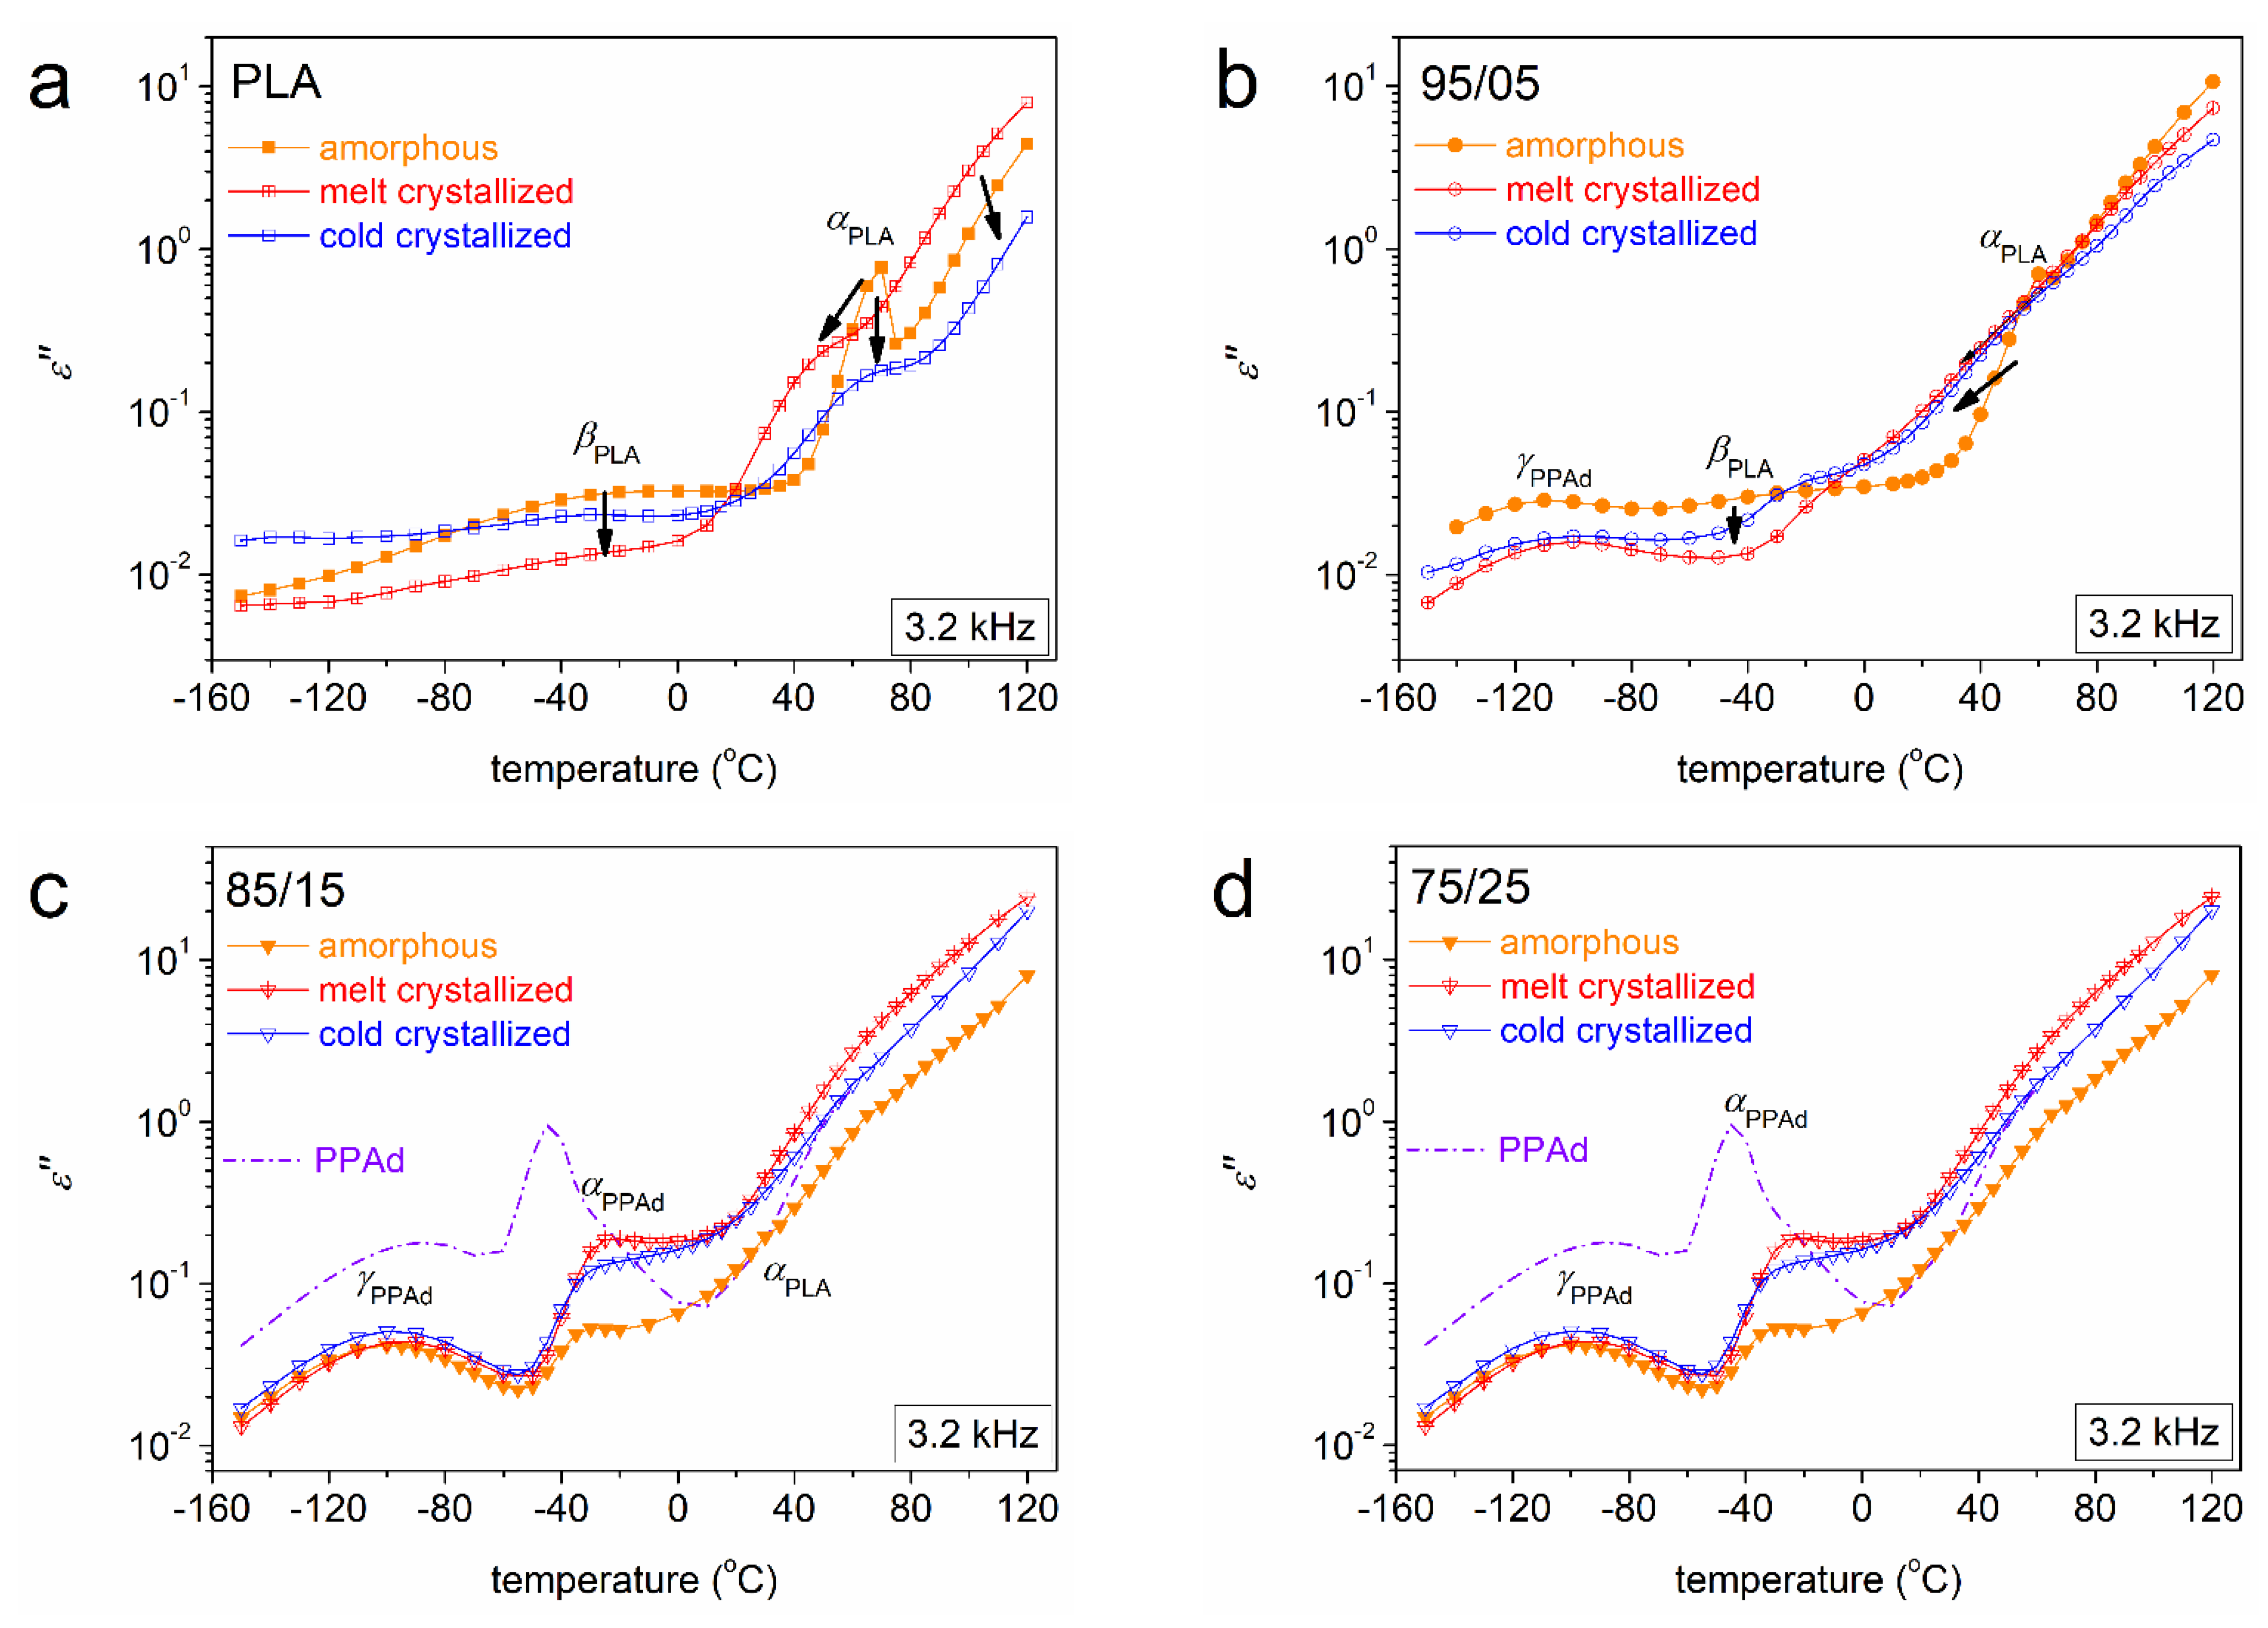
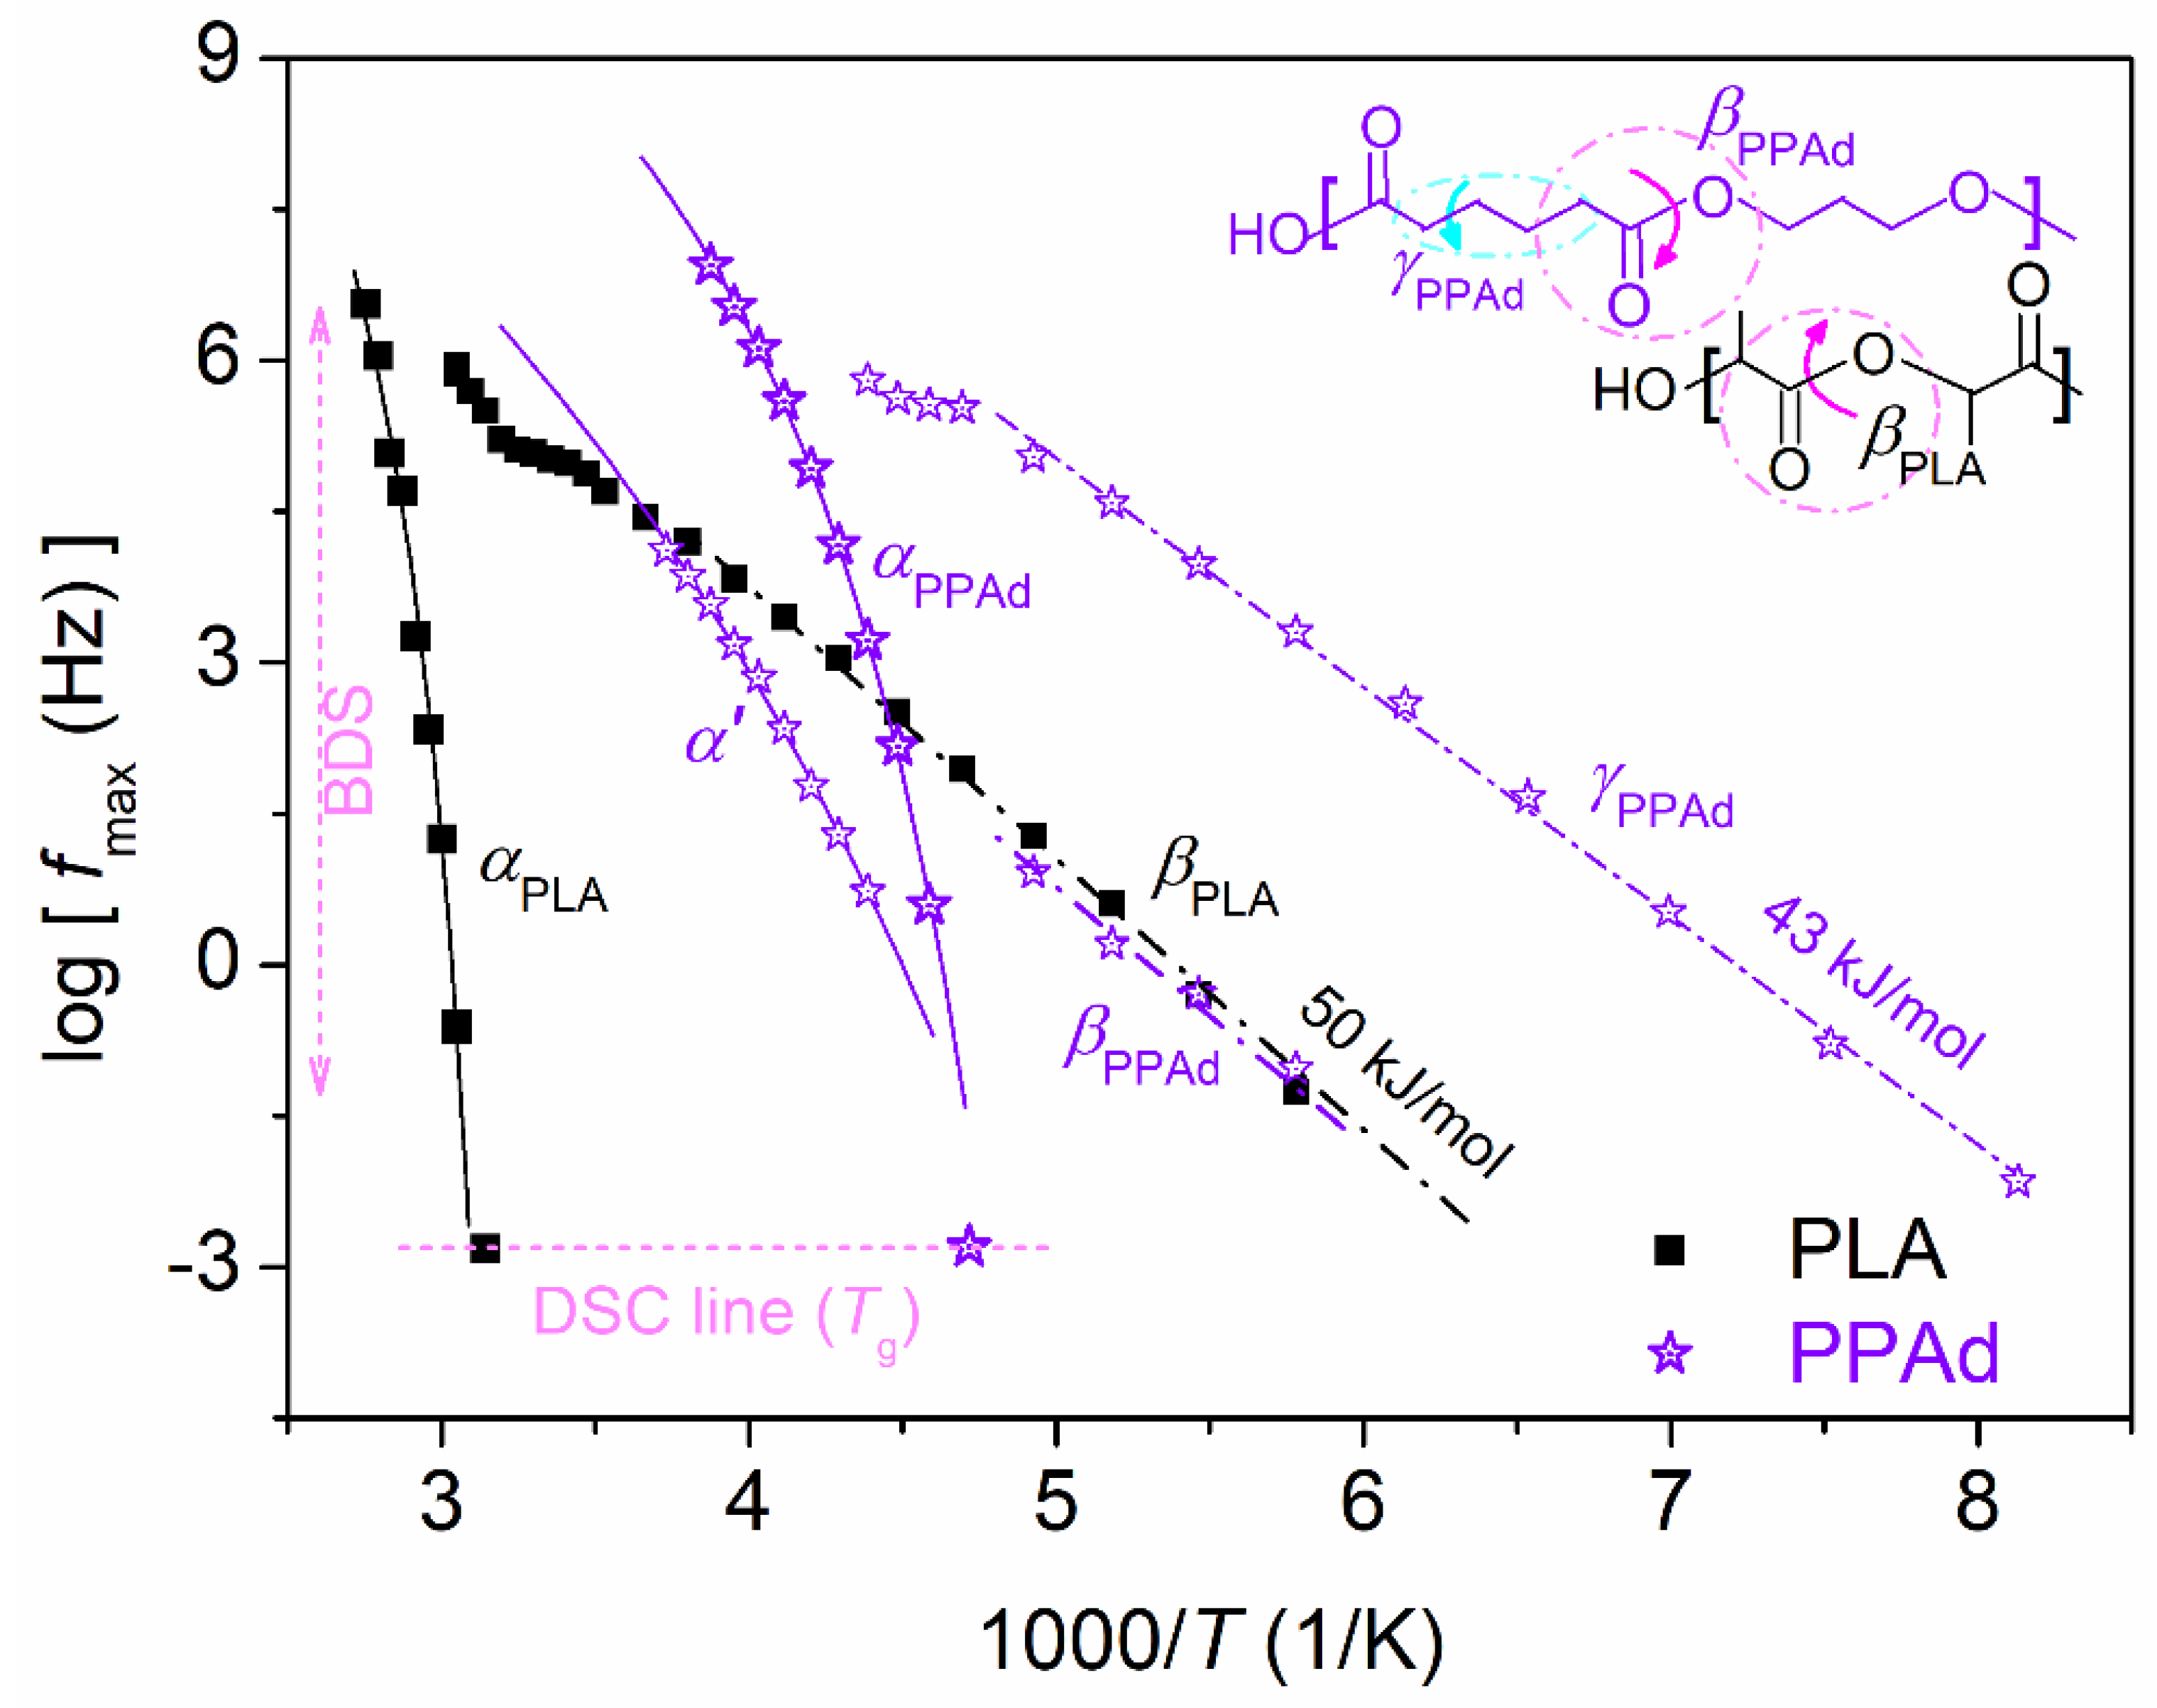
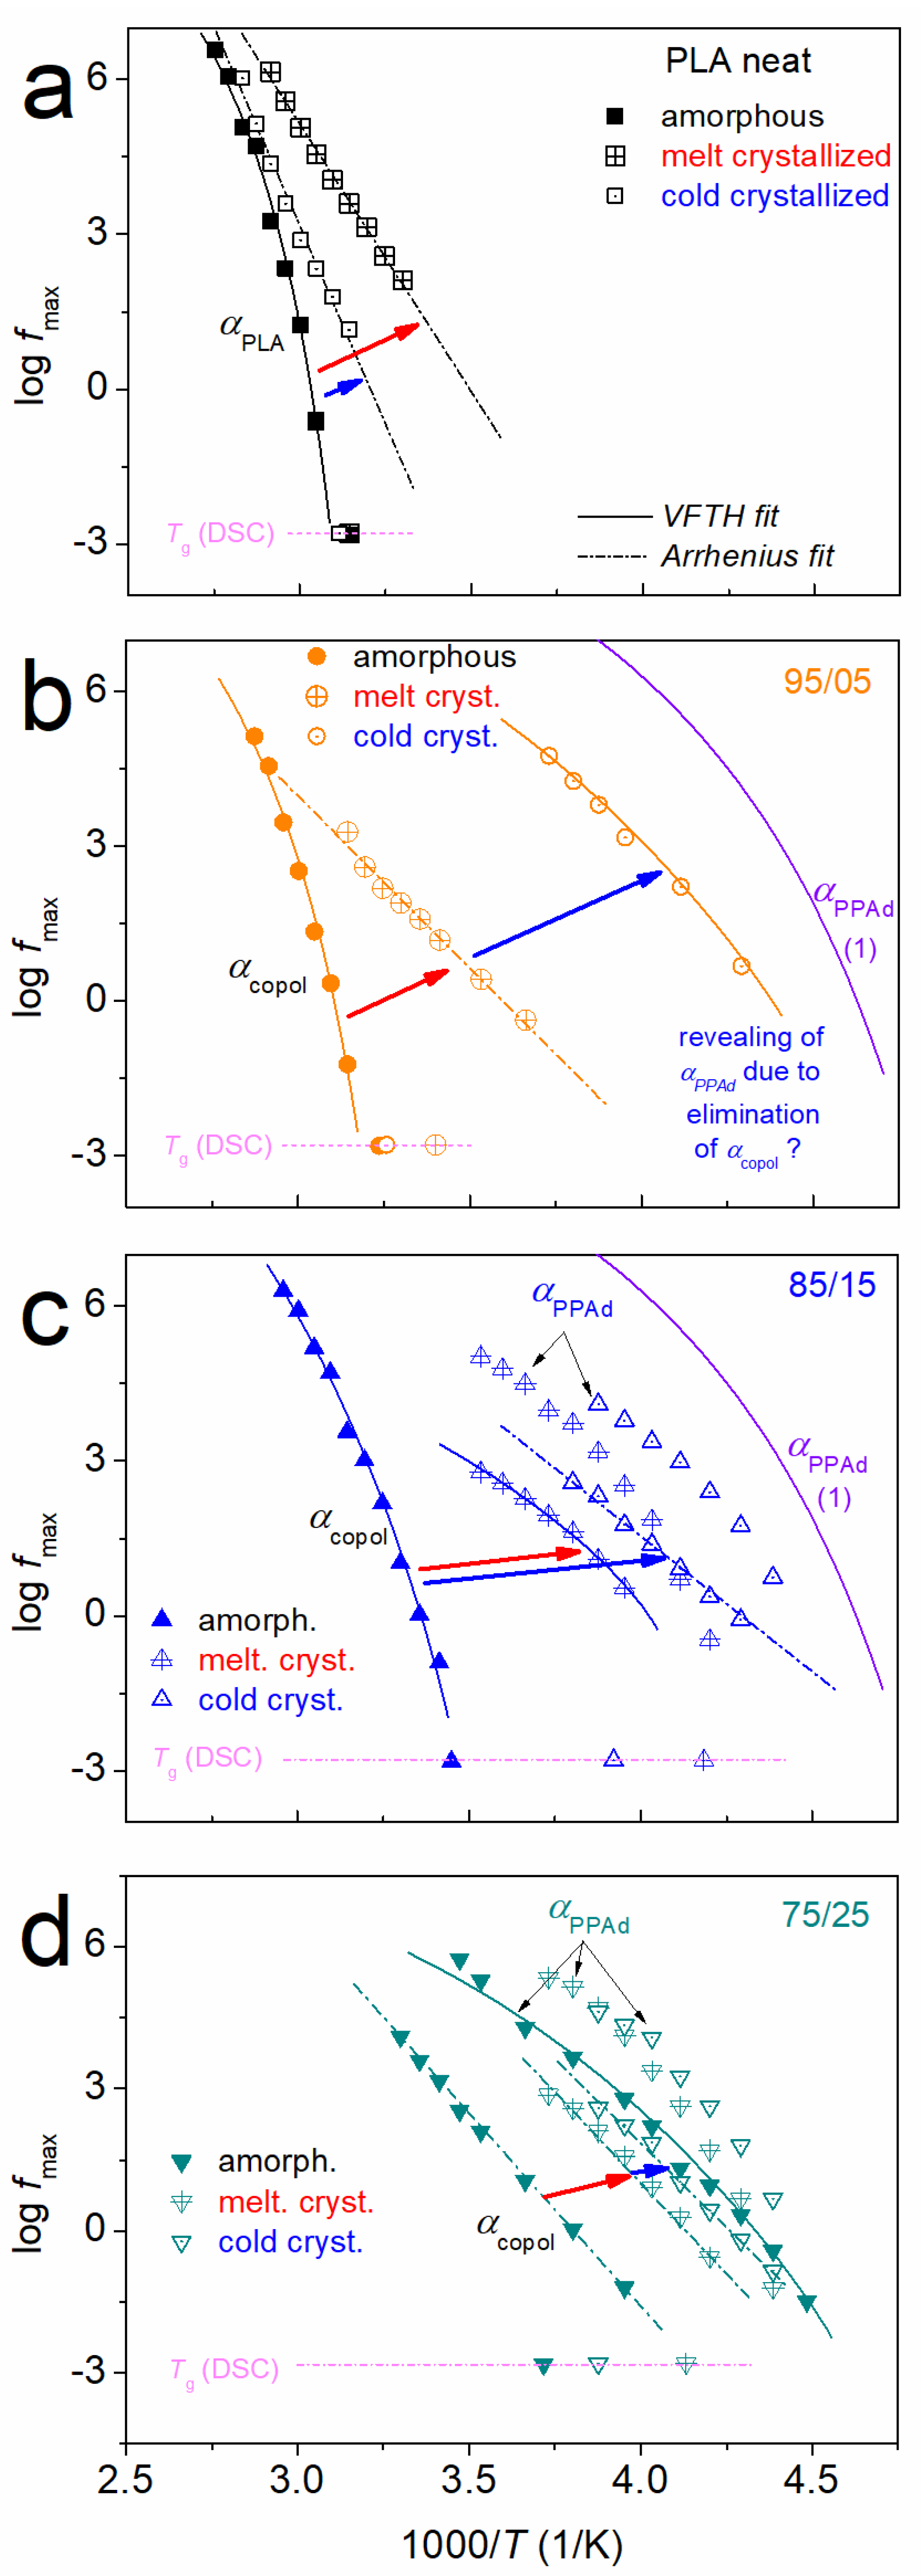
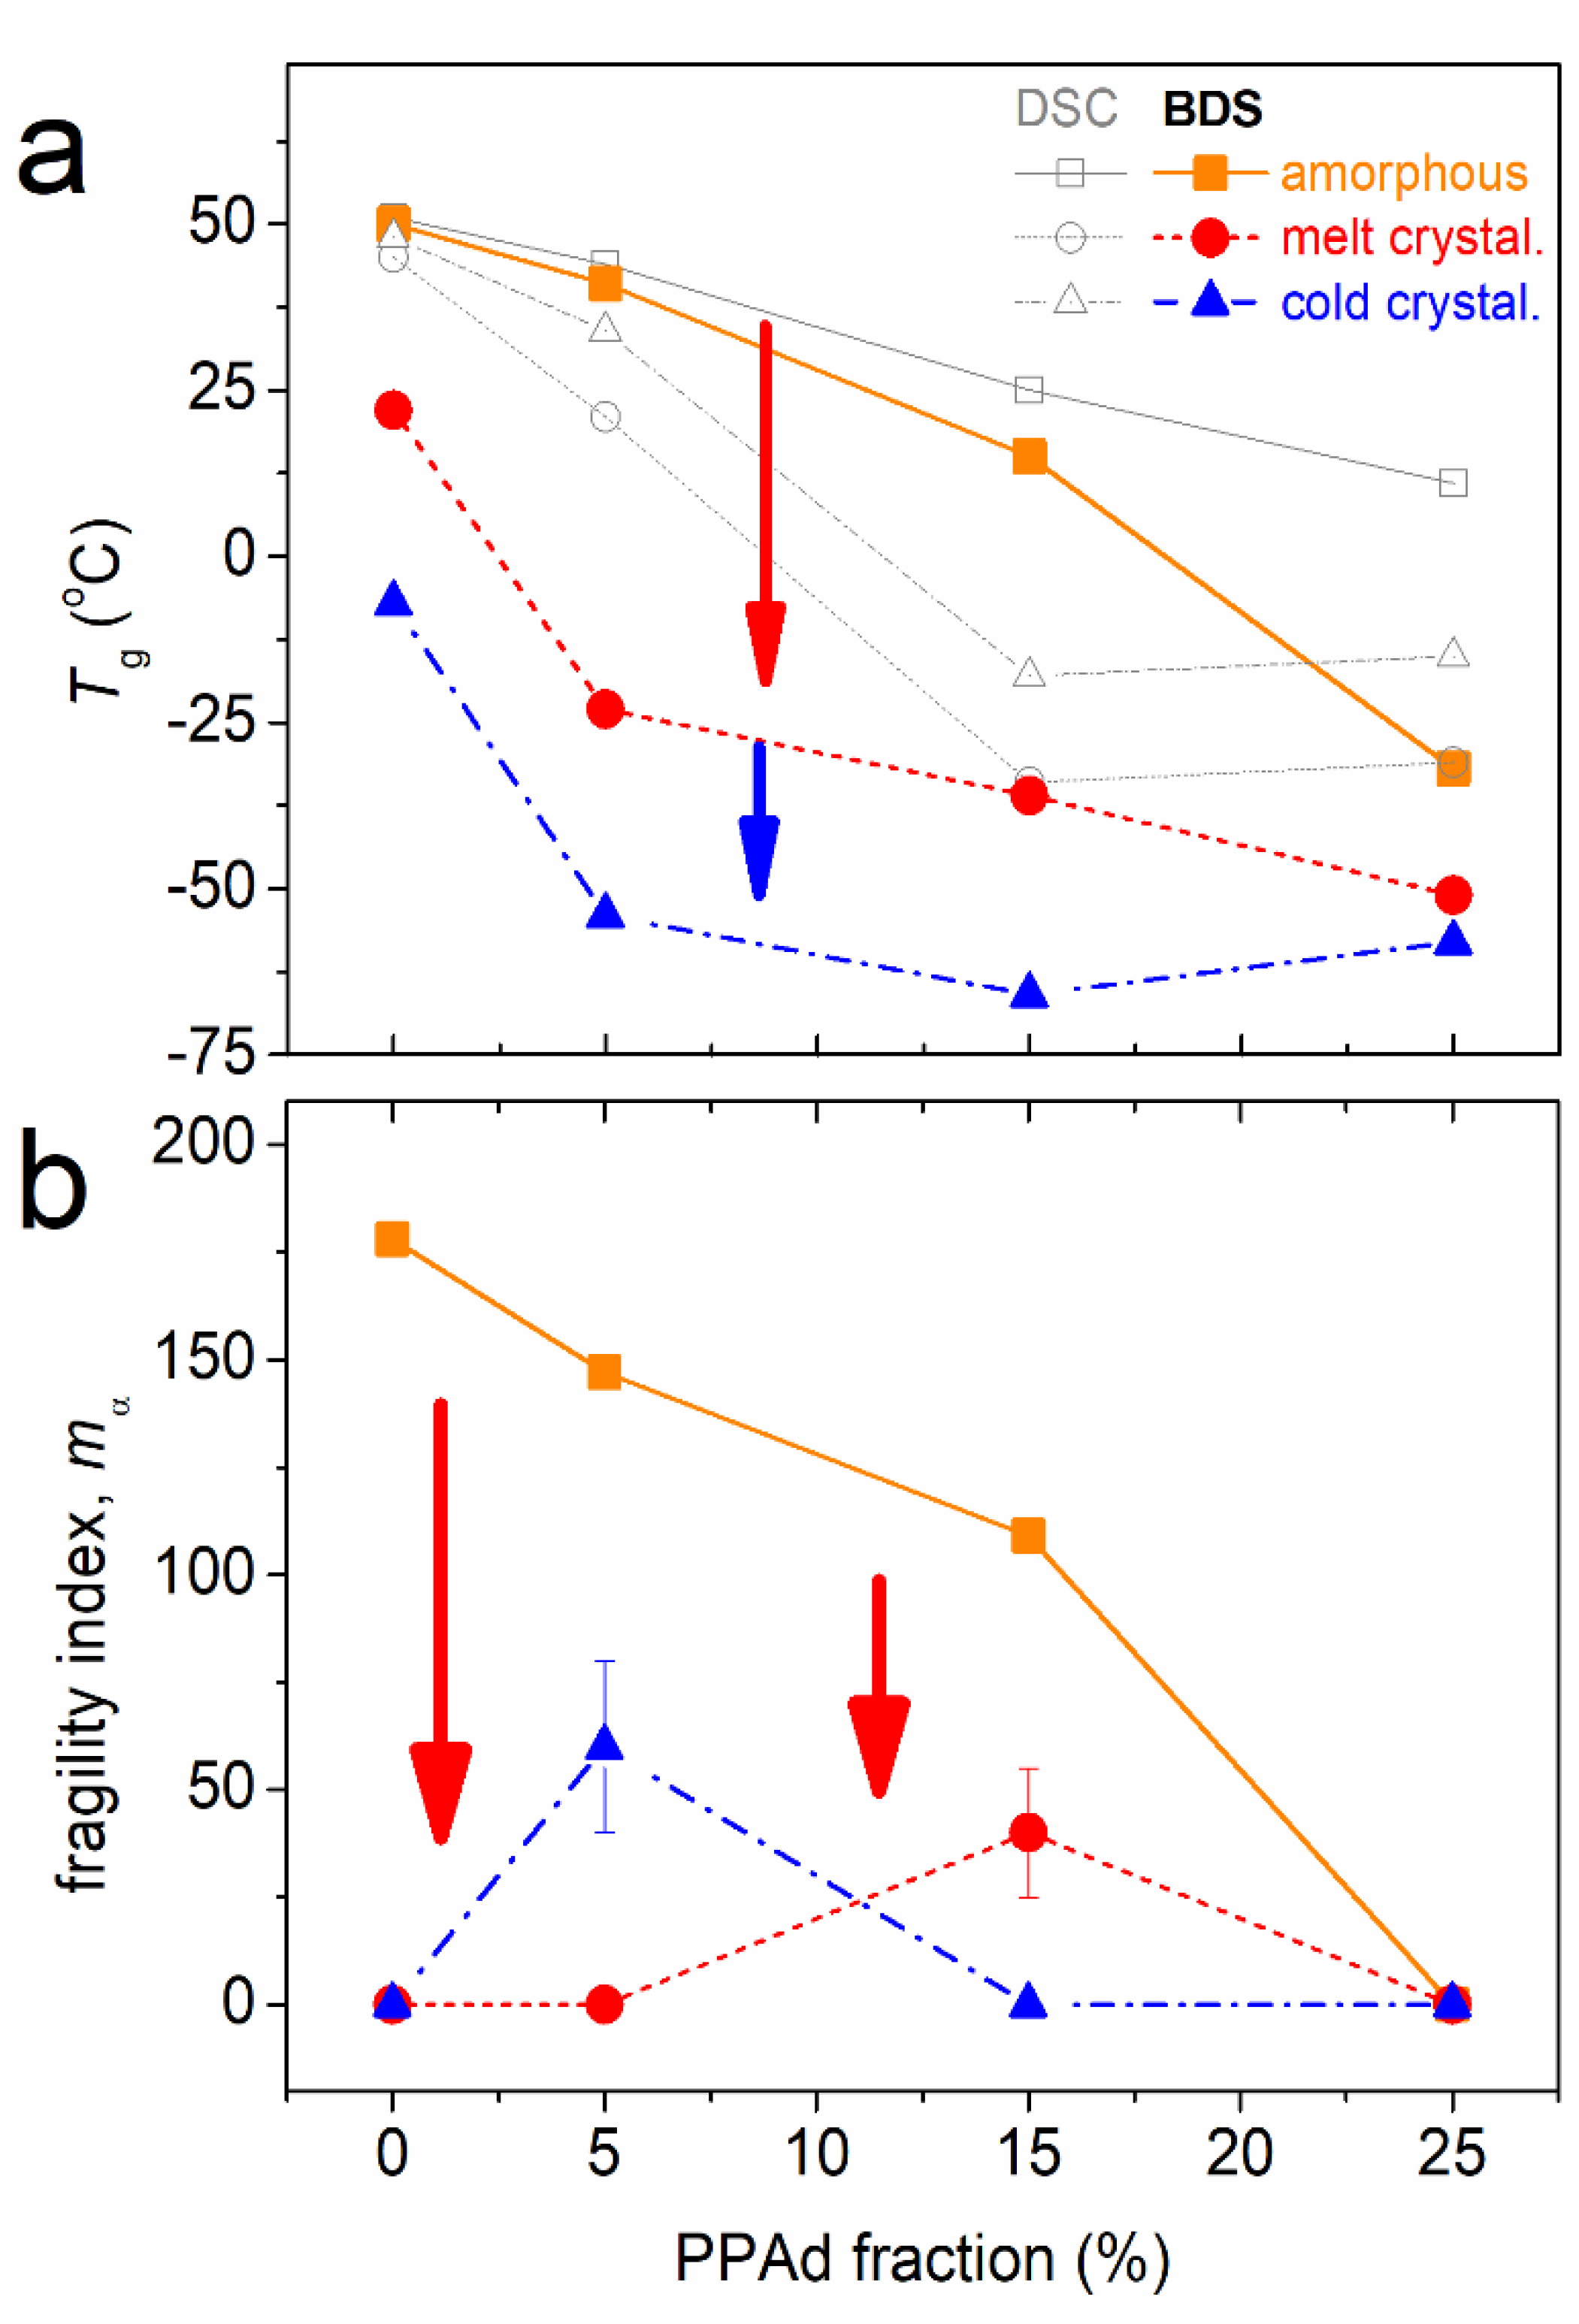
3.2. Molecular Mobility (BDS)
4. Conclusions
Author Contributions
Funding
Institutional Review Board Statement
Informed Consent Statement
Data Availability Statement
Conflicts of Interest
References
- Chanda, M.; Roy, S.K. Industrial Polymers, Specialty Polymers, and Their Applications, 1st ed.; CRC Press: Boca Raton, FL, USA, 2008. [Google Scholar] [CrossRef]
- Rowan, S.J. 100th anniversary of macromolecular science viewpoints. ACS Macro Lett. 2021, 10, 466–468. [Google Scholar] [CrossRef]
- Pan, P.; Inoue, Y. Polymorphism and isomorphism in biodegradable polyesters. Prog. Polym. Sci. 2009, 34, 605–640. [Google Scholar] [CrossRef]
- Tanaka, M.; Sato, K.; Kitakami, E.; Kobayashi, S.; Hoshiba, T.; Fukushima, K. Design of biocompatible and biodegradable polymers based on intermediate water concept. Polym. J. 2015, 47, 114–121. [Google Scholar] [CrossRef]
- Sisti, L.; Totaro, G.; Marchese, P. PBS makes its entrance into the family of biobased plastics. In Biodegradable and Biobased Polymers for Environmental and Biomedical Applications; Kalia, S., Avérous, L., Eds.; John Wiley & Sons: Hobocan, NJ, USA, 2016. [Google Scholar] [CrossRef] [Green Version]
- Balla, E.; Daniilidis, V.; Karlioti, G.; Kalamas, T.; Stefanidou, M.; Bikiaris, N.D.; Vlachopoulos, A.; Koumentakou, I.; Bikiaris, D.N. Poly(lactic acid) a versatile biobased polymer of next decades with multifunctional properties. From monomer synthesis, polymerization techniques and molecular weight increase to PLA applications. Polymers 2021, 13, 1822. [Google Scholar] [CrossRef]
- Ikada, Y.; Tsuji, H. Biodegradable polyesters for medical and ecological applications. Macromol. Rapid Commun. 2000, 21, 117–132. [Google Scholar] [CrossRef]
- Williams, C.K. Synthesis of functionalized biodegradable polyesters. Chem. Soc. Rev. 2007, 36, 1573–1580. [Google Scholar] [CrossRef]
- Ebara, M.; Uto, K.; Idota, N.; Hoffman, J.M.; Aoyagi, T. Rewritable and shape-memory soft matter with dynamically tunable microchannel geometry in a biological temperature range. Soft Matter 2013, 9, 3074–3080. [Google Scholar] [CrossRef]
- Armentano, I.; Bitinis, N.; Fortunati, E.; Mattioli, S.; Rescignano, N.; Verdejo, R.; Lopez-Manchado, M.A.; Kenny, J.M. Multifunctional nanostructured PLA materials for packaging and tissue engineering. Prog. Polym. Sci. 2013, 38, 1720–1747. [Google Scholar] [CrossRef]
- Giliopoulos, D.; Zamboulis, A.; Giannakoudakis, D.; Bikiaris, D.; Triantafyllidis, K. Polymer/metal organic framework (MOF) nanocomposites for biomedical applications. Molecules 2020, 25, 185. [Google Scholar] [CrossRef] [Green Version]
- Auras, R.; Harte, B.; Selke, S. An overview of polylactides as packaging materials. Macrom. Biosci. 2004, 4, 835–864. [Google Scholar] [CrossRef]
- Coulembier, O.; De Winter, J.; Josse, T.; Mespouille, L.; Gerbaux, P.; Dubois, P. One-step synthesis of polylactide macrocycles from sparteine-initiated ROP. Polym. Chem. 2014, 5, 2103–2108. [Google Scholar] [CrossRef]
- Meimoun, J.; Phuphuak, Y.; Miyamachi, R.; Miao, Y.; Bria, M.; Rousseau, C.; Nogueira, G.; Valente, A.; Favrelle-Hurret, A.; Zinck, P. Cyclodextrins initiated ring-opening polymerization of lactide using 4-dimethylaminopyridine (DMAP) as catalyst: Study of DMAP/β-CD inclusion complex and access to new structures. Molecules 2022, 27, 1083. [Google Scholar] [CrossRef]
- Saeidlou, S.; Huneault, M.A.; Li, H.; Park, C.B. Poly(lactic acid) crystallization. Prog. Polym. Sci. 2012, 37, 1657–1667. [Google Scholar] [CrossRef]
- Delpouve, N.; Saiter, A.; Dargent, E. Cooperativity length evolution during crystallization of poly(lactic acid). Eur. Polym. J. 2011, 47, 2414–2423. [Google Scholar] [CrossRef]
- Georgiopoulos, P.; Kontou, E.; Meristoudi, A.; Pispas, S.; Chatzinikolaidou, M. The effect of silica nanoparticles on the thermomechanical properties and degradation behavior of polylactic acid. J. Biomat. Appl. 2014, 29, 662–674. [Google Scholar] [CrossRef]
- Klonos, P.A.; Peoglos, V.; Bikiaris, D.N.; Kyritsis, A. Rigid amorphous fraction and thermal diffusivity in nanocomposites based on poly(L-lactic acid) filled with carbon nanotubes and graphene oxide. J. Phys. Chem. C 2020, 123, 5469–5479. [Google Scholar] [CrossRef]
- Sangroniz, A.; Chaos, A.; Iriarte, M.; del Río, J.; Sarasua, J.R.; Etxeberria, A. Influence of the rigid amorphous fraction and crystallinity on polylactide transport properties. Macromolecules 2018, 51, 3923–3931. [Google Scholar] [CrossRef]
- Demchenko, V.; Mamunya, Y.; Kobylinskyi, S.; Riabov, S.; Naumenko, K.; Zahorodinia, S.; Povnitsa, O.; Rybalchenko, N.; Iurzhenko, M.; Adamus, G.; et al. Structure-morphology-antimicrobial and antiviral activity relationship in silver-containing nanocomposites based on polylactide. Molecules 2022, 27, 3769. [Google Scholar] [CrossRef]
- Androsch, R.; Zhuravlev, E.; Schick, C. Solid-state reorganization, melting and melt-recrystallization of conformationally disordered crystals (α′-phase) of poly(L-lactic acid). Polymer 2014, 55, 4932–4941. [Google Scholar] [CrossRef]
- Toda, A.; Androsch, R.; Schick, C. Insights into polymer crystallization and melting from fast chip calorimetry. Polymer 2016, 91, 239–263. [Google Scholar] [CrossRef]
- Androsch, R.; Naeem Iqbal, H.M.; Schick, C. Non-isothermal crystal nucleation of poly(L-lactic acid). Polymer 2015, 81, 151–158. [Google Scholar] [CrossRef]
- Androsch, R.; Zhang, R.; Schick, C. Melt-recrystallization of poly(L-lactic acid) initially containing α′-crystals. Polymer 2019, 176, 227–235. [Google Scholar] [CrossRef]
- Beslikas, T.; Gigis, I.; Goulios, V.; Christoforides, J.; Papageorgiou, G.Z.; Bikiaris, D.N. Crystallization and comparative in vitro-in vivo hydrolysis of PLA reinforcement ligament. Int. J. Mol. Sci. 2011, 12, 6597–6618. [Google Scholar] [CrossRef] [Green Version]
- Klonos, P.A.; Terzopoulou, Z.; Zamboulis, A.; Valera, M.A.; Mangas, A.; Kyritsis, A.; Pissis, P.; Bikiaris, D.N. Direct and indirect effects on molecular mobility in renewable polylactide-poly(propylene adipate) block copolymers as studied by dielectric spectroscopy and calorimetry. Soft Matter 2022, 18, 3725–3737. [Google Scholar] [CrossRef]
- Naddeo, M.; Viscusi, G.; Gorrasi, G.; Pappalardo, D. Degradable elastomers: Is there a future in tyre compound formulation? Molecules 2021, 26, 4454. [Google Scholar] [CrossRef]
- Ainali, N.M.; Kalaronis, D.; Evgenidou, E.; Kyzas, G.Z.; Bobori, D.C.; Kaloyianni, M.; Yang, X.; Bikiaris, D.N.; Lambropoulou, D.A. Do poly(lactic acid) microplastics instigate a threat? A perception for their dynamic towards environmental pollution and toxicity. Sci. Total Environ. 2022, 832, 155014. [Google Scholar] [CrossRef]
- Zhang, Q.; Song, M.; Xu, Y.; Wang, W.; Wang, Z.; Zhang, L. Bio-based polyesters: Recent progress and future prospects. Prog. Polym. Sci. 2021, 120, 101430. [Google Scholar] [CrossRef]
- Terzopoulou, Z.; Zamboulis, A.; Bikiaris, D.N.; Valera, M.A.; Mangas, A. Synthesis, properties, and enzymatic hydrolysis of poly(lactic acid)-co-poly(propylene adipate) block copolymers prepared by reactive extrusion. Polymers 2021, 13, 4121. [Google Scholar] [CrossRef]
- Christodoulou, E.; Klonos, P.A.; Tsachouridis, K.; Zamboulis, A.; Kyritsis, A.; Bikiaris, D.N. Synthesis, crystallization, and molecular mobility in poly(ε-caprolactone) copolyesters of different architectures for biomedical applications studied by calorimetry and dielectric spectroscopy. Soft Matter 2020, 16, 8187–8201. [Google Scholar] [CrossRef]
- Karava, V.; Siamidi, A.; Vlachou, M.; Christodoulou, E.; Zamboulis, A.; Bikiaris, D.N.; Kyritsis, A.; Klonos, P.A. Block copolymers based on poly(butylene adipate) and poly(L-lactic acid) for biomedical applications: Synthesis, structure and thermodynamical studies. Soft Matter 2021, 17, 2439–2453. [Google Scholar] [CrossRef]
- Klonos, P.A.; Lazaridou, M.; Samiotaki, C.; Kyritsis, A.; Bikiaris, D.N. Dielectric and calorimetric study in renewable polymer blends based on poly(ethylene adipate) and poly(lactic acid) with microphase separation. Polymer 2022, 259, 125329. [Google Scholar] [CrossRef]
- Correa-Pacheco, Z.N.; Black-Solís, J.D.; Ortega-Gudiño, P.; Sabino-Gutiérrez, M.A.; Benítez-Jiménez, J.J.; Barajas-Cervantes, A.; Bautista-Baños, S.; Hurtado-Colmenares, L.B. Preparation and characterization of bio-based PLA/PBAT and cinnamon essential oil polymer fibers and life-cycle assessment from hydrolytic degradation. Polymers 2020, 12, 38. [Google Scholar] [CrossRef] [Green Version]
- Yan, D.; Wang, Z.; Guo, Z.; Ma, Y.; Wang, C.; Tan, H.; Zhang, Y. Study on the properties of PLA/PBAT composite modified by nanohydroxyapatite. J. Mater. Res. Technol. 2020, 9, 11895–11904. [Google Scholar] [CrossRef]
- Bikiaris, D.; Karavelidis, V.; Karavas, E. Novel biodegradable polyesters. Synthesis and application as drug carriers for the preparation of raloxifene HCl loaded nanoparticles. Molecules 2009, 14, 2410–2430. [Google Scholar] [CrossRef]
- Papageorgiou, G.Z.; Tsanaktsis, V.; Bikiaris, D.N. Crystallization of poly(butylene-2,6-naphthalate-co-butylene adipate) copolymers: Regulating crystal modification of the polymorphic parent homopolymers and biodegradation. CrystEngComm 2014, 16, 7963–7978. [Google Scholar] [CrossRef]
- Skoog, E.; Shin, J.H.; Saez-Jimenez, V.; Mapelli, V.; Olsson, L. Biobased adipic acid—The challenge of developing the production host. Biotechnol. Adv. 2018, 36, 2248–2263. [Google Scholar] [CrossRef]
- Alvarez, C.; Capitan, M.J.; Lotti, N.; Munari, A.; Ezquerra, T.A. Structure−dynamics relationships in random poly(butylene isophthalate-co-butylene adipate) copolyesters as revealed by dielectric loss spectroscopy and X-ray scattering. Macromolecules 2003, 36, 3245–3253. [Google Scholar] [CrossRef]
- Zorba, T.; Chrissafis, K.; Paraskevopoulos, K.M.; Bikiaris, D.N. Synthesis, characterization and thermal degradation mechanism of three poly(alkylene adipate)s: Comparative study. Polym. Deg. Stabil. 2007, 92, 222–230. [Google Scholar] [CrossRef]
- Lu, J.; Li, Z.; Zhou, L.; Wu, L.; Li, B.G. Biobased 1,5-pentanediol derived aliphatic-aromatic copolyesters: Synthesis and thermo-mechanical properties of poly(pentylene succinate-co-terephthalate)s and poly(pentylene adipate-co-terephthalate)s. Polym. Deg. Stabil. 2019, 163, 68–75. [Google Scholar] [CrossRef]
- Fischer, E.W.; Sterzel, H.J.; Wegner, G. Investigation of the structure of solution grown crystals of lactide copolymers by means of chemical reactions. Kolloid-Z. Z. Für Polym. 1973, 251, 980–990. [Google Scholar] [CrossRef]
- Righetti, M.C.; Gazzano, M.; Di Lorenzo, M.L.; Androsch, R. Enthalpy of melting of α′- and α-crystals of poly(L-lactic acid). Eur. Polym. J. 2015, 70, 215–220. [Google Scholar] [CrossRef]
- Jariyavidyanont, K.; Schick, C.; Androsch, R. The bulk enthalpy of melting of α’-crystals of poly (l-lactic acid) determined by fast scanning chip calorimetry. Thermochim. Acta 2022, 717, 179349. [Google Scholar] [CrossRef]
- Kremer, F.; Schönhals, A. Broadband Dielectric Spectroscopy, 1st ed.; Springer: Berlin/Heidelberg, Germany, 2003. [Google Scholar] [CrossRef]
- Havriliak, S.; Negami, S. A complex plane representation of dielectric and mechanical relaxation processes in some polymers. Polymer 1967, 8, 161–210. [Google Scholar] [CrossRef]
- Tammann, G.; Hesse, W. Die abhängigkeit der viscosität von der temperatur bie unterkühlten flüssigkeiten. Z. Anorg. Allg. Chem. 1926, 156, 245–257. [Google Scholar] [CrossRef]
- Böhmer, R.; Ngai, K.; Angell, C.A.; Plazek, D.J. Nonexponential relaxations in strong and fragile glass formers. J. Chem. Phys. 1993, 99, 4201–4209. [Google Scholar] [CrossRef]
- Brás, A.R.; Viciosa, M.T.; Wang, Y.; Dionisio, M.; Mano, J.F. Crystallization of poly(L–lactic acid) probed with dielectric relaxation spectroscopy. Macromolecules 2006, 39, 6513–6520. [Google Scholar] [CrossRef]
- Klonos, P.; Terzopoulou, Z.; Koutsoumpis, S.; Zidropoulos, S.; Kripotou, S.; Papageorgiou, G.Z.; Bikiaris, D.; Kyritsis, A.; Pissis, P. Rigid amorphous fraction and segmental dynamics in nanocomposites based on poly(L-lactic acid) and nano-inclusions of 1-3D geometry studied by thermal and dielectric techniques. Eur. Polym. J. 2016, 82, 16–34. [Google Scholar] [CrossRef]
- Zhuravlev, E.; Wurm, A.; Pötschke, P.; Androsch, R.; Schmelzer, J.W.P.; Schick, C. Kinetics of nucleation and crystallization of poly(ε-caprolactone)—Multiwalled carbon nanotube composites. Eur. Polym. J. 2014, 52, 1–11. [Google Scholar] [CrossRef]
- Lorenzo, A.T.; Arnal, M.L.; Albuerne, J.; Müller, A.J. DSC isothermal polymer crystallization kinetics measurements and the use of the Avrami equation to fit the data: Guidelines to avoid common problems. Polym. Test. 2007, 26, 222–231. [Google Scholar] [CrossRef]
- Lovinger, A.J. Twisted crystals and the origin of banding in spherulites of semicrystalline polymers. Macromolecules 2020, 53, 741–745. [Google Scholar] [CrossRef]
- Safandowska, M.; Rozanski, A. Ring-banded spherulites in polylactide and its blends. Polym. Test. 2021, 100, 107230. [Google Scholar] [CrossRef]
- Liu, J.; Ye, H.M.; Xu, J.; Guo, B.H. Formation of ring-banded spherulites of α and β modifications in poly(butylene adipate). Polymer 2011, 52, 4619–4630. [Google Scholar] [CrossRef]
- Schönhals, A.; Szymoniak, P. Dynamics of Composite Materials, 1st ed.; Springer: Cham, Switzerland, 2022. [Google Scholar] [CrossRef]
- Ren, J.; Urakawa, O.; Adachi, K. Dielectric study on dynamics and conformations of poly(D,L-lactic acid) in dilute and semi-dilute solutions. Polymer 2003, 44, 847–855. [Google Scholar] [CrossRef]
- Laredo, E.; Newman, D.; Pezzoli, R.; Müller, A.J.; Bello, A. A complete TSDC description of molecular mobilities in polylactide/starch blends from local to normal modes: Effect of composition, moisture, and crystallinity. J. Polym. Sci. B Polym. Phys. 2016, 54, 680–691. [Google Scholar] [CrossRef]
- Leng, J.; Kang, N.; Wang, D.Y.; Falkenhagen, J.; Thünemann, A.F.; Schönhals, A. Structure–property relationships of nanocomposites based on polylactide and layered double hydroxides—Comparison of MgAl and NiAl LDH as nanofiller. Macrom. Chem. Phys. 2017, 20, 1700232. [Google Scholar] [CrossRef]
- Figueroa, D.R.; Fontanella, J.J.; Wintersgill, M.C.; Calame, J.P.; Andeen, C.G. TSDC and DR studies on PEO complexed with inorganic salts. Solid State Ion. 1988, 28–30, 1023–1028. [Google Scholar] [CrossRef]
- Kripotou, S.; Pissis, P.; Sysel, P.; Sindelar, V.; Bershtein, V.A. Structure–property relationships in novel poly(imide-amide)–poly(ethylene glycol) hybrid networks. Polymer 2006, 47, 357–366. [Google Scholar] [CrossRef]
- Vassiliadou, O.; Chrysostomou, V.; Pispas, S.; Klonos, P.A.; Kyritsis, A. Molecular dynamics and crystallization in polymers based on ethylene glycol methacrylates (EGMAs) with melt memory characteristics: From linear oligomers to comb-like polymers. Soft Matter 2021, 17, 1284. [Google Scholar] [CrossRef]
- Beiner, M.; Huth, H. Nanophase separation and hindered glass transition in side-chain polymers. Nat. Mater. 2003, 2, 595–599. [Google Scholar] [CrossRef]
- Schönhals, A.; Goering, H.; Schick, C. Segmental and chain dynamics of polymers: From the bulk to confined state. J. Non-Cryst. Solids 2002, 305, 140–149. [Google Scholar] [CrossRef]
- Casalini, R.; Roland, C.M. Temperature and density effects on the local segmental and global chain dynamics of poly(oxybutylene). Macromolecules 2005, 38, 1779–1788. [Google Scholar] [CrossRef] [Green Version]
- Klonos, P.A.; Papadopoulos, L.; Papageorgiou, G.Z.; Kyritsis, A.; Pissis, P.; Bikiaris, D.N. Interfacial interactions, crystallization, and molecular dynamics of renewable poly(propylene furanoate) in situ filled with initial and surface modified carbon nanotubes and graphene oxide. J. Phys. Chem. C 2020, 124, 10220–10234. [Google Scholar] [CrossRef]
- Genovese, L.; Soccio, M.; Lotti, N.; Munari, A.; Szymczyk, A.; Paszkiewicz, S.; Linares, A.; Nogales, A.; Ezquerra, T.A. Effect of chemical structure on the subglass relaxation dynamics of biobased polyesters as revealed by dielectric spectroscopy: 2,5-furandicarboxylic acid vs. trans-1,4-cyclohexanedicarboxylic acid. Phys. Chem. Chem. Phys. 2018, 20, 15696–15706. [Google Scholar] [CrossRef]
- Klonos, P.A.; Bikiaris, D.N.; Kyritsis, A. Molecular mobility in nanocomposites based on renewable semicrystalline polyesters. In Dynamics of Composite Materials; Schönhals, A., Szymoniak, P., Eds.; Springer: Cham, Switzerland, 2022; pp. 87–121. [Google Scholar] [CrossRef]
- Adam, G.; Gibbs, J.H. On the temperature dependence of cooperative relaxation properties in glass-forming liquids. J. Chem. Phys. 1965, 43, 139–146. [Google Scholar] [CrossRef] [Green Version]
- Schönhals, A.; Goering, H.; Schick, C.; Frick, M.; Mayorova, M.; Zorn, R. Segmental dynamics of poly(methyl phenyl siloxane) confined to nanoporous glasses. Eur. Phys. J. Spec. Top. 2007, 141, 255–259. [Google Scholar] [CrossRef]
- Elmahdy, M.M.; Chrissopoulou, K.; Afratis, A.; Floudas, G.; Anastasiadis, S.H. Effect of confinement on polymer segmental motion and ion mobility in PEO/layered silicate nanocomposites. Macromolecules 2006, 39, 5170–5173. [Google Scholar] [CrossRef]
- Safari, M.; Maiz, J.; Shi, G.; Juanes, D.; Liu, G.; Wang, D.; Mijangos, C.; Alegría, Á.; Müller, A.J. How confinement affects the nucleation, crystallization, and dielectric relaxation of poly(butylene succinate) and poly(butylene adipate) infiltrated within nanoporous alumina templates. Langmuir 2019, 35, 15168–15179. [Google Scholar] [CrossRef]
- Klonos, P.A.; Bikiaris, N.D.; Christodoulou, E.; Zamboulis, A.; Papageorgiou, G.Z.; Kyritsis, A. Molecular mobility, crystallization and melt-memory investigation of molar mass effects on linear and hydroxyl-terminated poly(ε-caprolactone). Polymer 2022, 242, 124603. [Google Scholar] [CrossRef]
- Shi, G.; Guan, Y.; Liu, G.; Müller, A.J.; Wang, D. Segmental dynamics govern the cold crystallization of poly(lactic acid) in nanoporous alumina. Macromolecules 2019, 52, 6904–6912. [Google Scholar] [CrossRef]
- Genix, A.C.; Bocharova, V.; Carroll, B.; Lehmann, M.; Saito, T.; Krueger, S.; He, L.; Dieudonné-George, P.; Sokolov, A.P.; Oberdisse, J. Understanding the static interfacial polymer layer by exploring the dispersion states of nanocomposites. ACS Appl. Mater. Interfaces 2019, 11, 17863–17872. [Google Scholar] [CrossRef]
- Holt, A.P.; Griffin, P.J.; Bocharova, V.; Agapov, A.L.; Imel, A.E.; Dadmun, M.D.; Sangoro, J.R.; Sokolov, A.P. Dynamics at the polymer/nanoparticle interface in poly(2-vinylpyridine)/silica nanocomposites. Macromolecules 2014, 47, 1837–1843. [Google Scholar] [CrossRef]
- Klonos, P.A.; Patelis, N.; Glynos, E.; Sakellariou, G.; Kyritsis, A. Molecular dynamics in polystyrene single-chain nanoparticles. Macromolecules 2019, 52, 9334–9340. [Google Scholar] [CrossRef]


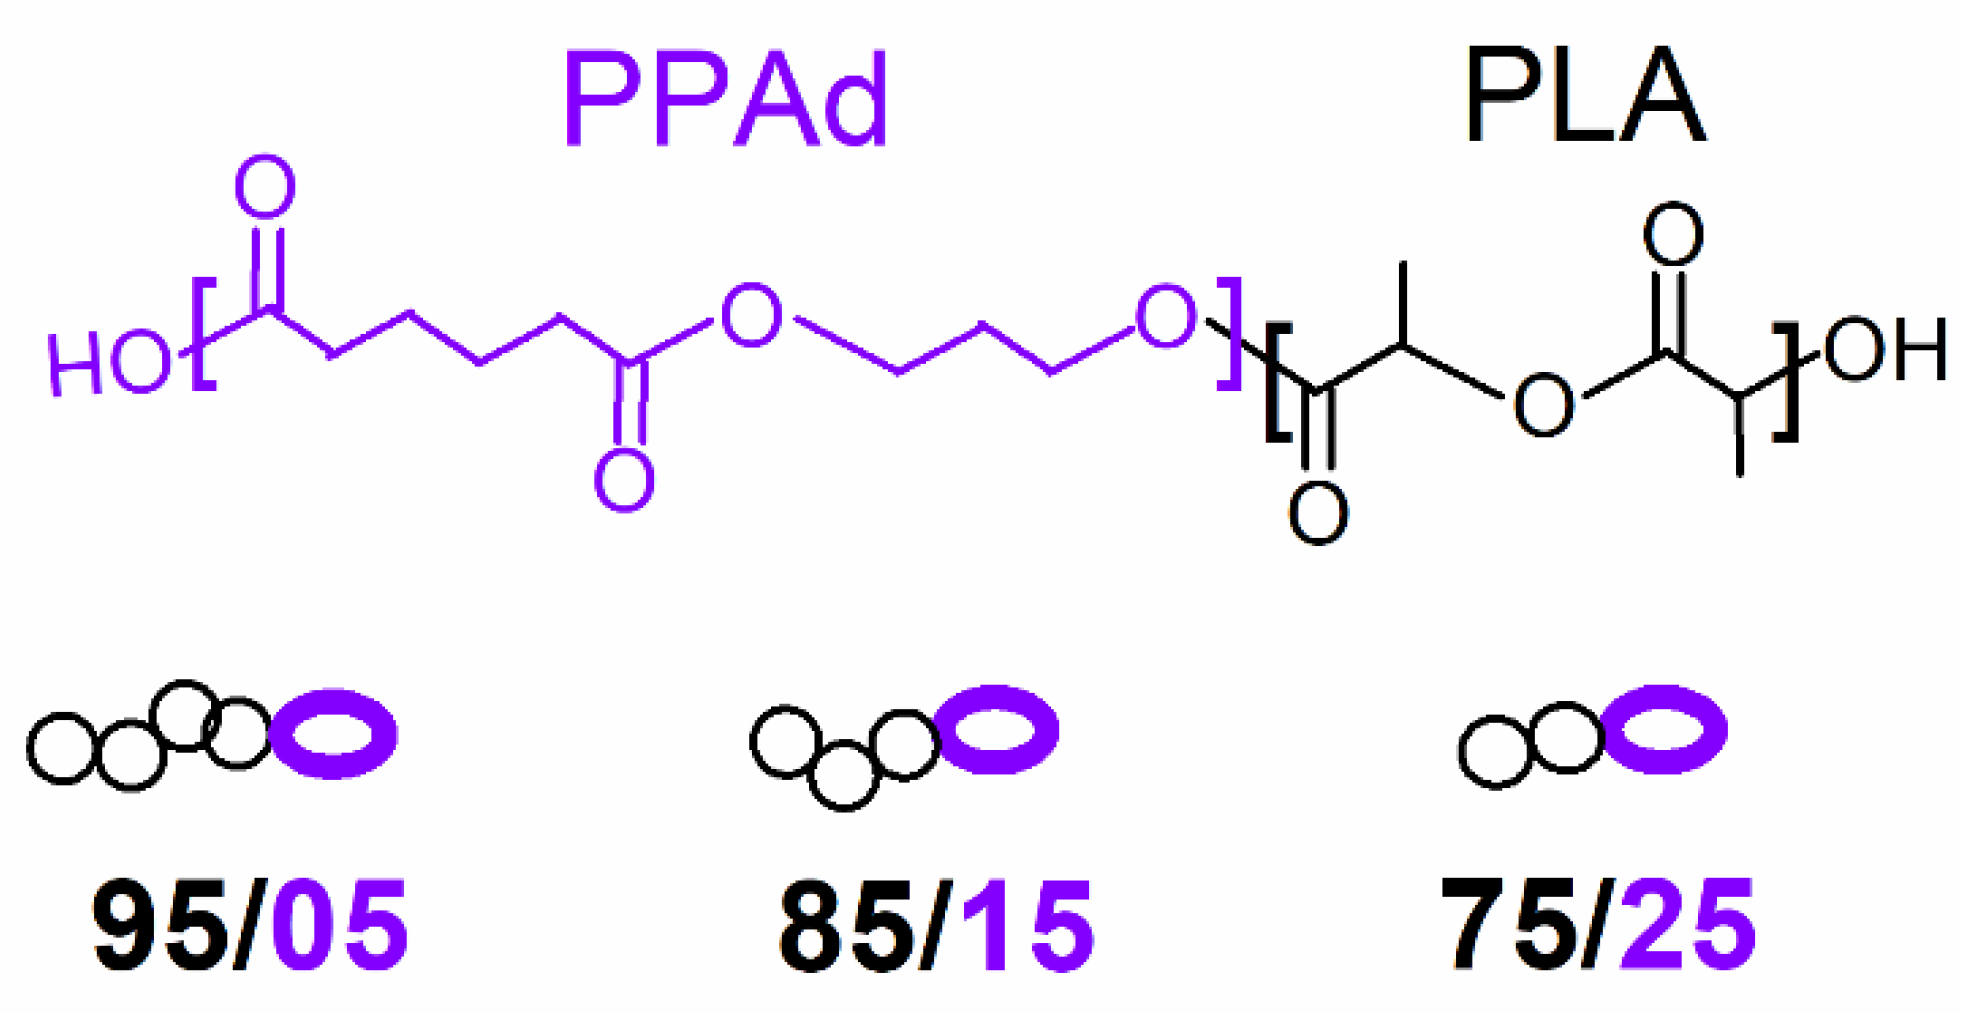
| Sample | Code Name | Mn (g/mol) | Tanneal,mc (°C) | Tanneal,cc (°C) |
|---|---|---|---|---|
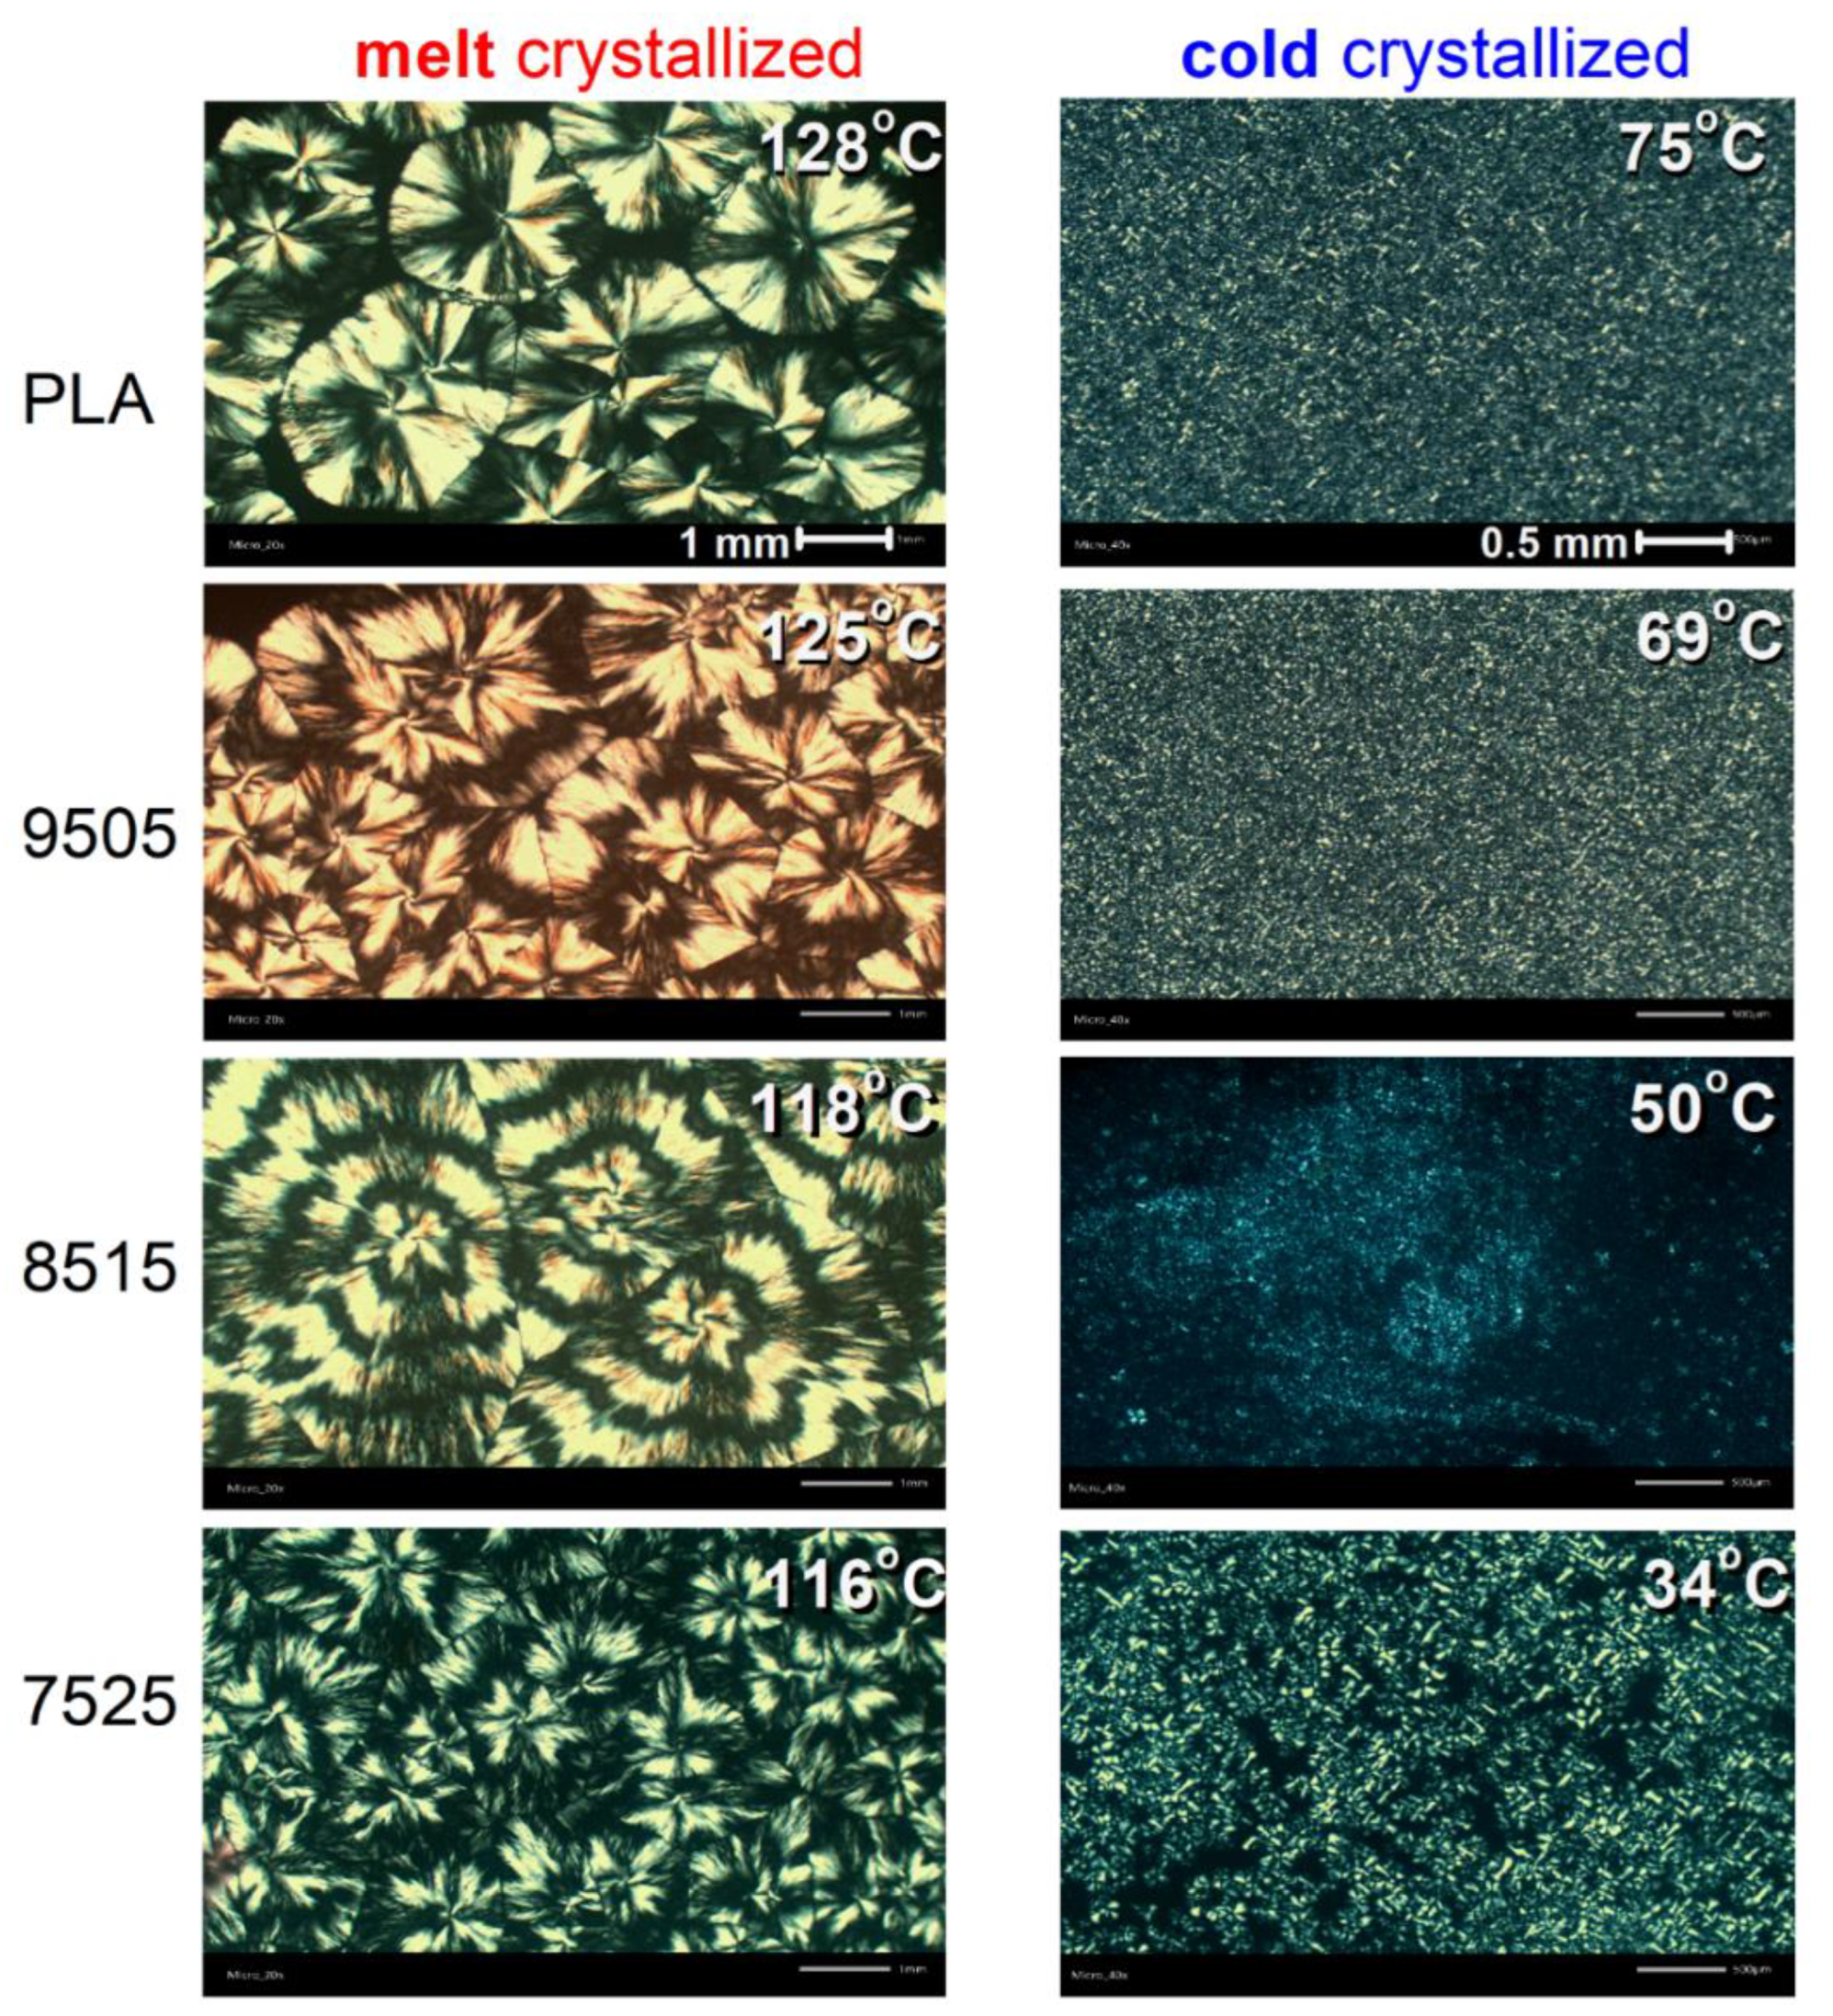
| PLA | PLA | 76k | 128 | 75 |
| PLA (95%)_b_PPAd (5%) | 95/05 | 63k | 125 | 69 |
| PLA (85%)_b_PPAd (15%) | 85/15 | 41k | 118 | 50 |
| PLA (75%)_b_PPAd (25%) | 75/25 | 29k | 116 | 34 |
| PPAd initial | PPAd | 6k | - | - |
Publisher’s Note: MDPI stays neutral with regard to jurisdictional claims in published maps and institutional affiliations. |
© 2022 by the authors. Licensee MDPI, Basel, Switzerland. This article is an open access article distributed under the terms and conditions of the Creative Commons Attribution (CC BY) license (https://creativecommons.org/licenses/by/4.0/).
Share and Cite
Klonos, P.A.; Evangelopoulou, A.; Terzopoulou, Z.; Zamboulis, A.; Valera, M.Á.; Mangas, A.; Kyritsis, A.; Bikiaris, D.N. Revisiting Non-Conventional Crystallinity-Induced Effects on Molecular Mobility in Sustainable Diblock Copolymers of Poly(propylene adipate) and Polylactide. Molecules 2022, 27, 7449. https://doi.org/10.3390/molecules27217449
Klonos PA, Evangelopoulou A, Terzopoulou Z, Zamboulis A, Valera MÁ, Mangas A, Kyritsis A, Bikiaris DN. Revisiting Non-Conventional Crystallinity-Induced Effects on Molecular Mobility in Sustainable Diblock Copolymers of Poly(propylene adipate) and Polylactide. Molecules. 2022; 27(21):7449. https://doi.org/10.3390/molecules27217449
Chicago/Turabian StyleKlonos, Panagiotis A., Alexandra Evangelopoulou, Zoi Terzopoulou, Alexandra Zamboulis, Miguel Ángel Valera, Ana Mangas, Apostolos Kyritsis, and Dimitrios N. Bikiaris. 2022. "Revisiting Non-Conventional Crystallinity-Induced Effects on Molecular Mobility in Sustainable Diblock Copolymers of Poly(propylene adipate) and Polylactide" Molecules 27, no. 21: 7449. https://doi.org/10.3390/molecules27217449