
Non-Conventional Time Domain (TD)-NMR Approaches for Food Quality: Case of Gelatin-Based Candies as a Model Food
 , ,
, ,
Abstract
:1. Introduction
2. Results and Discussion
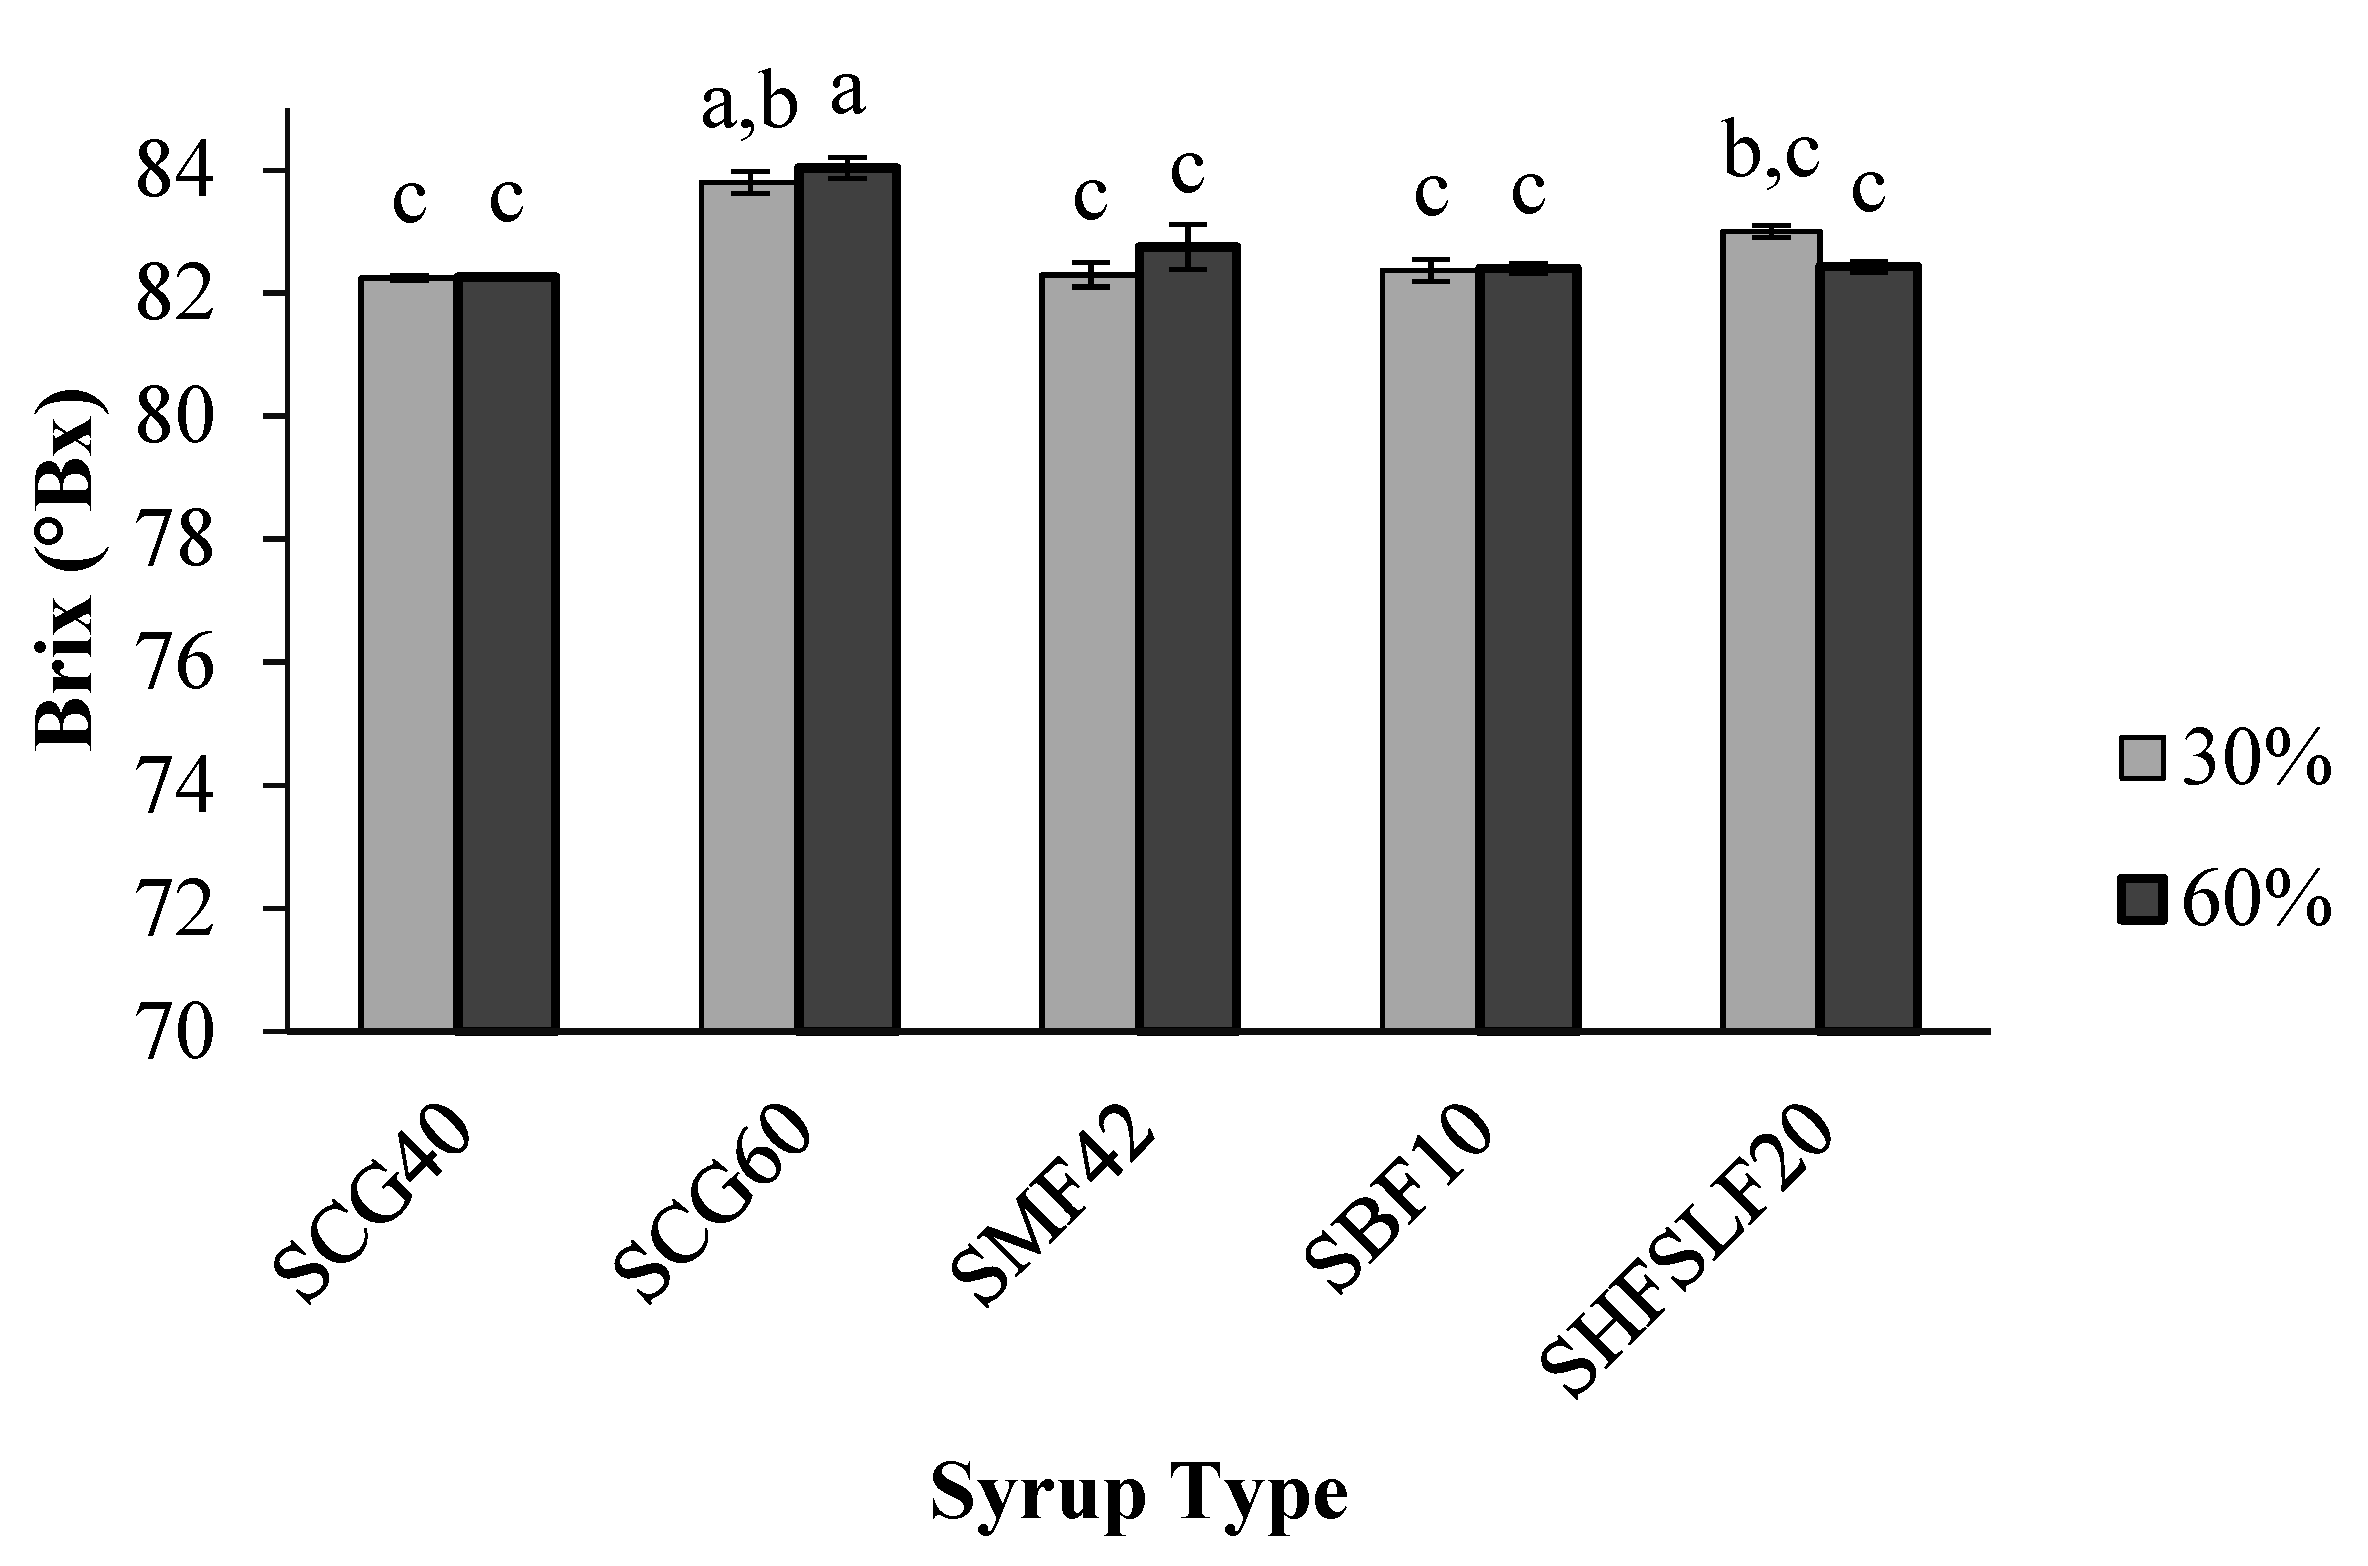
2.1. Brix
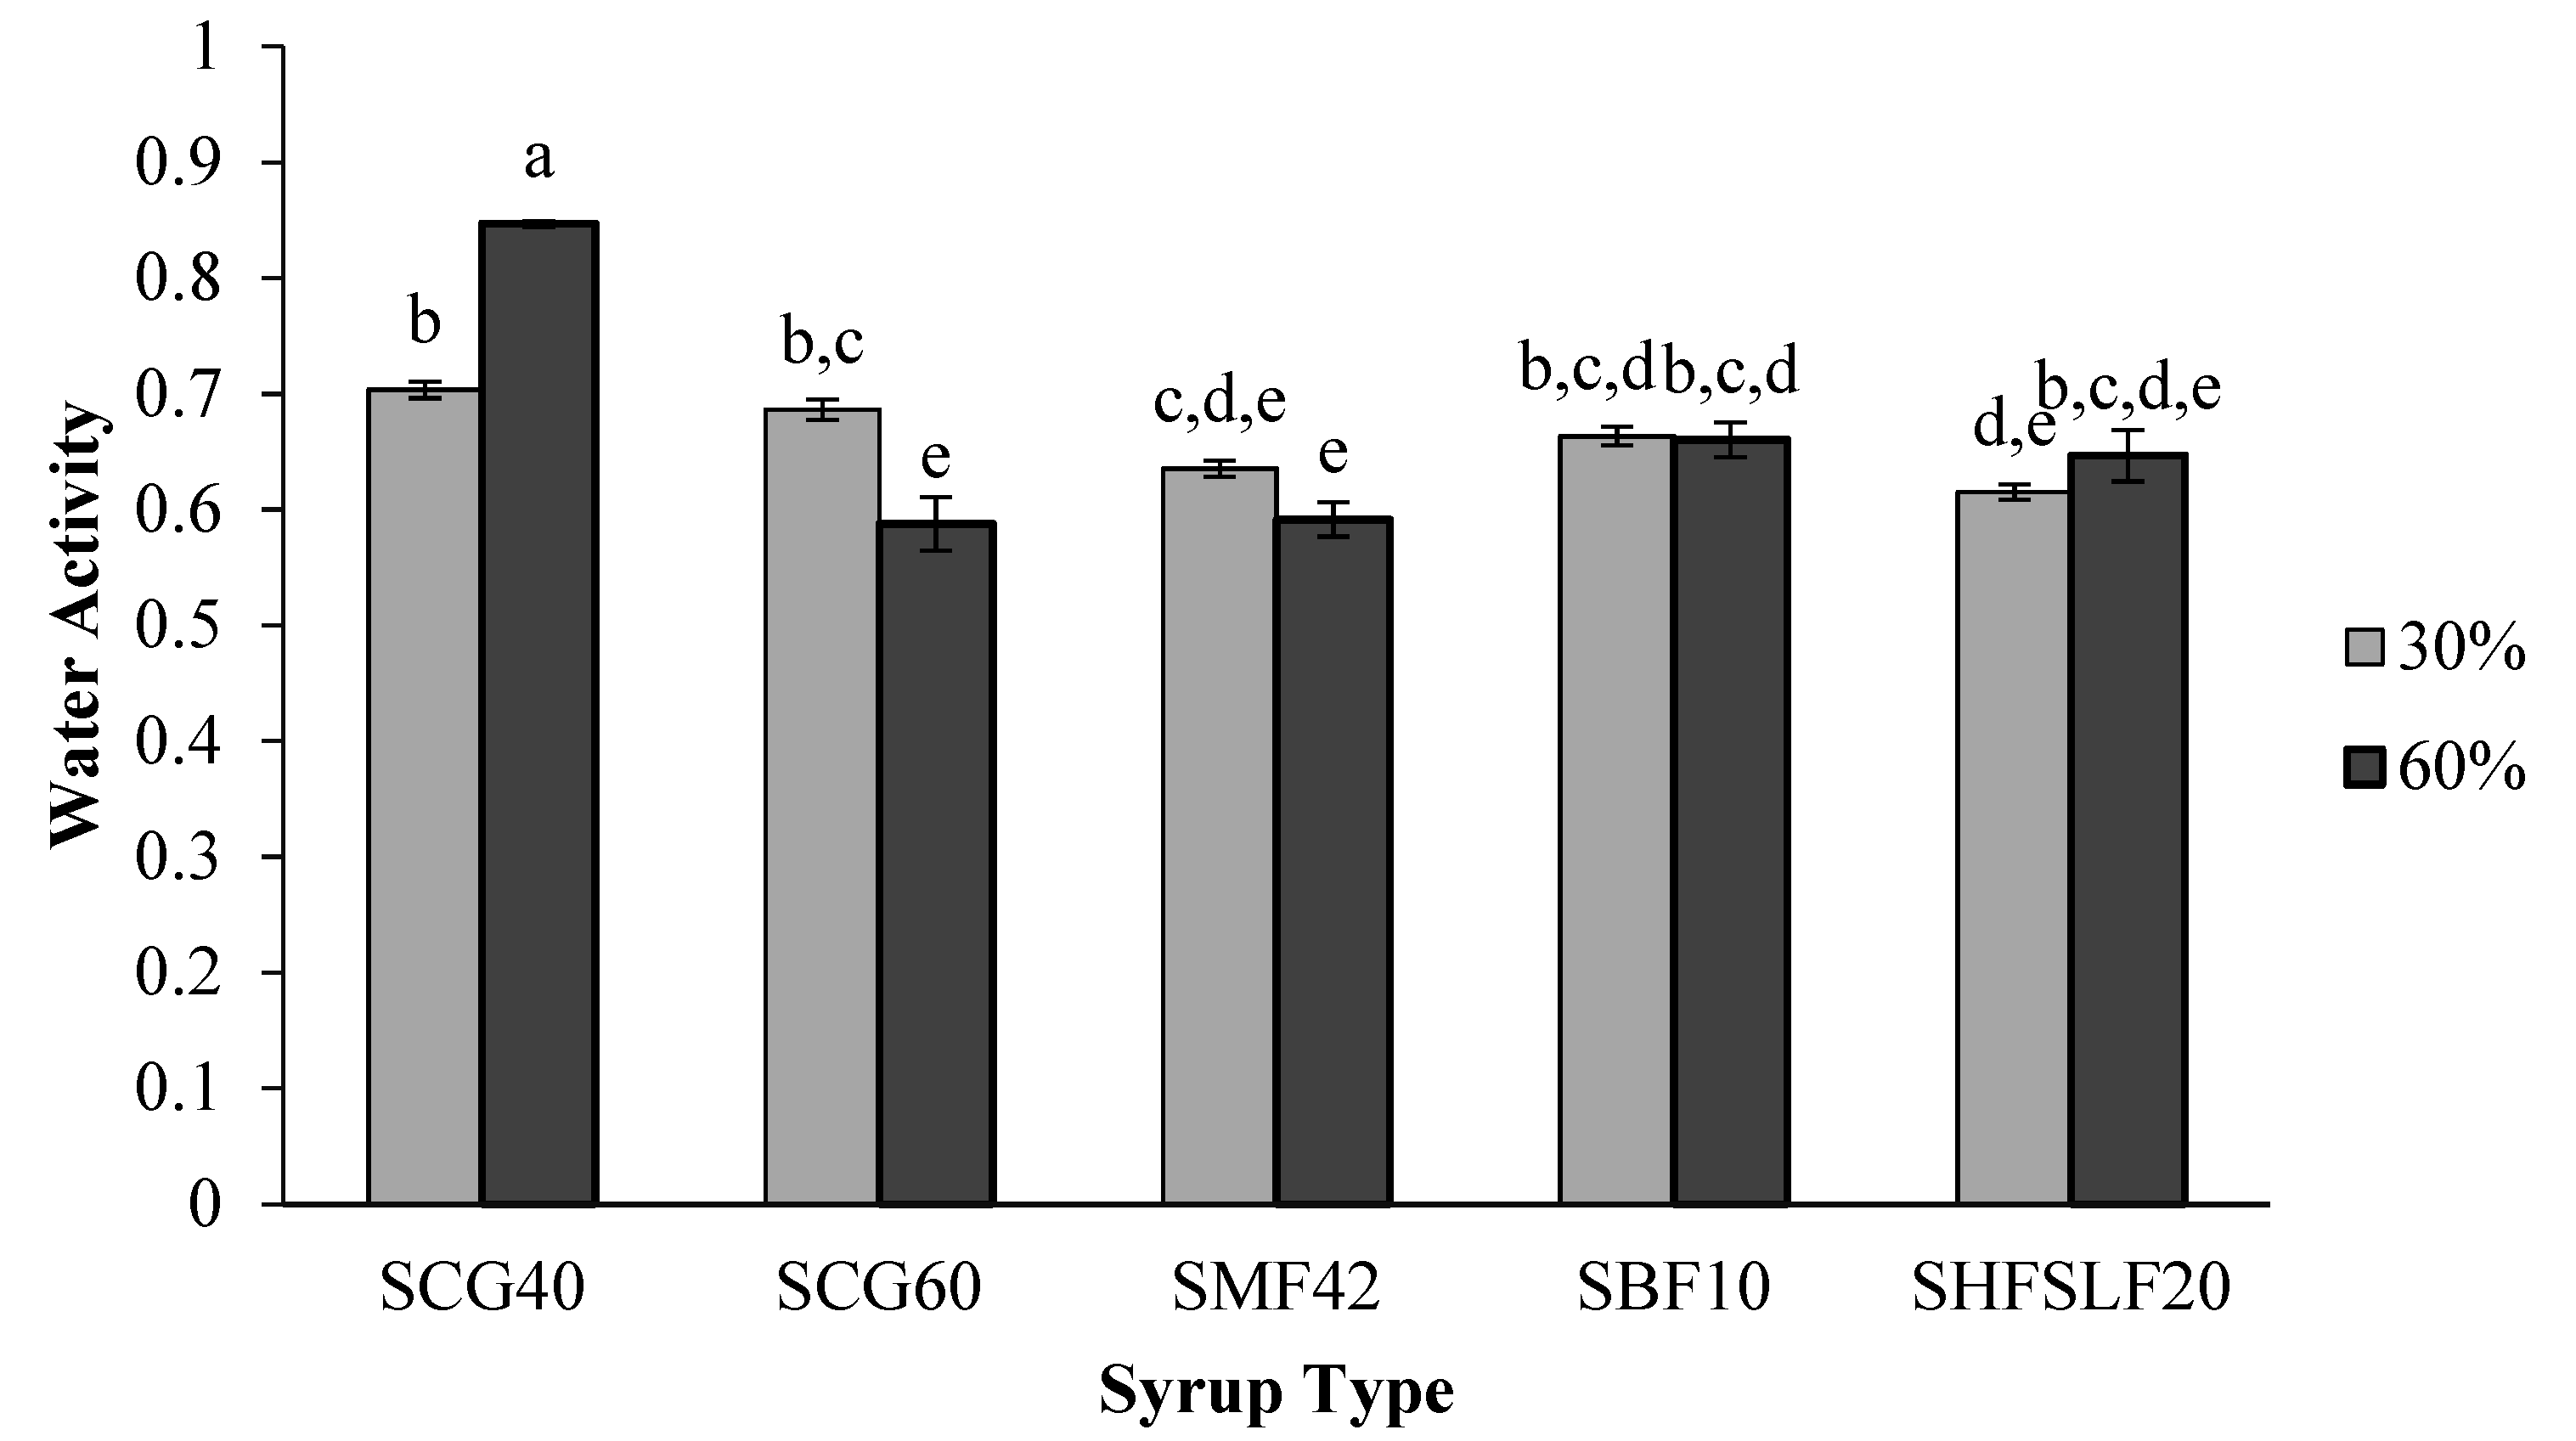
2.2. Water Activity
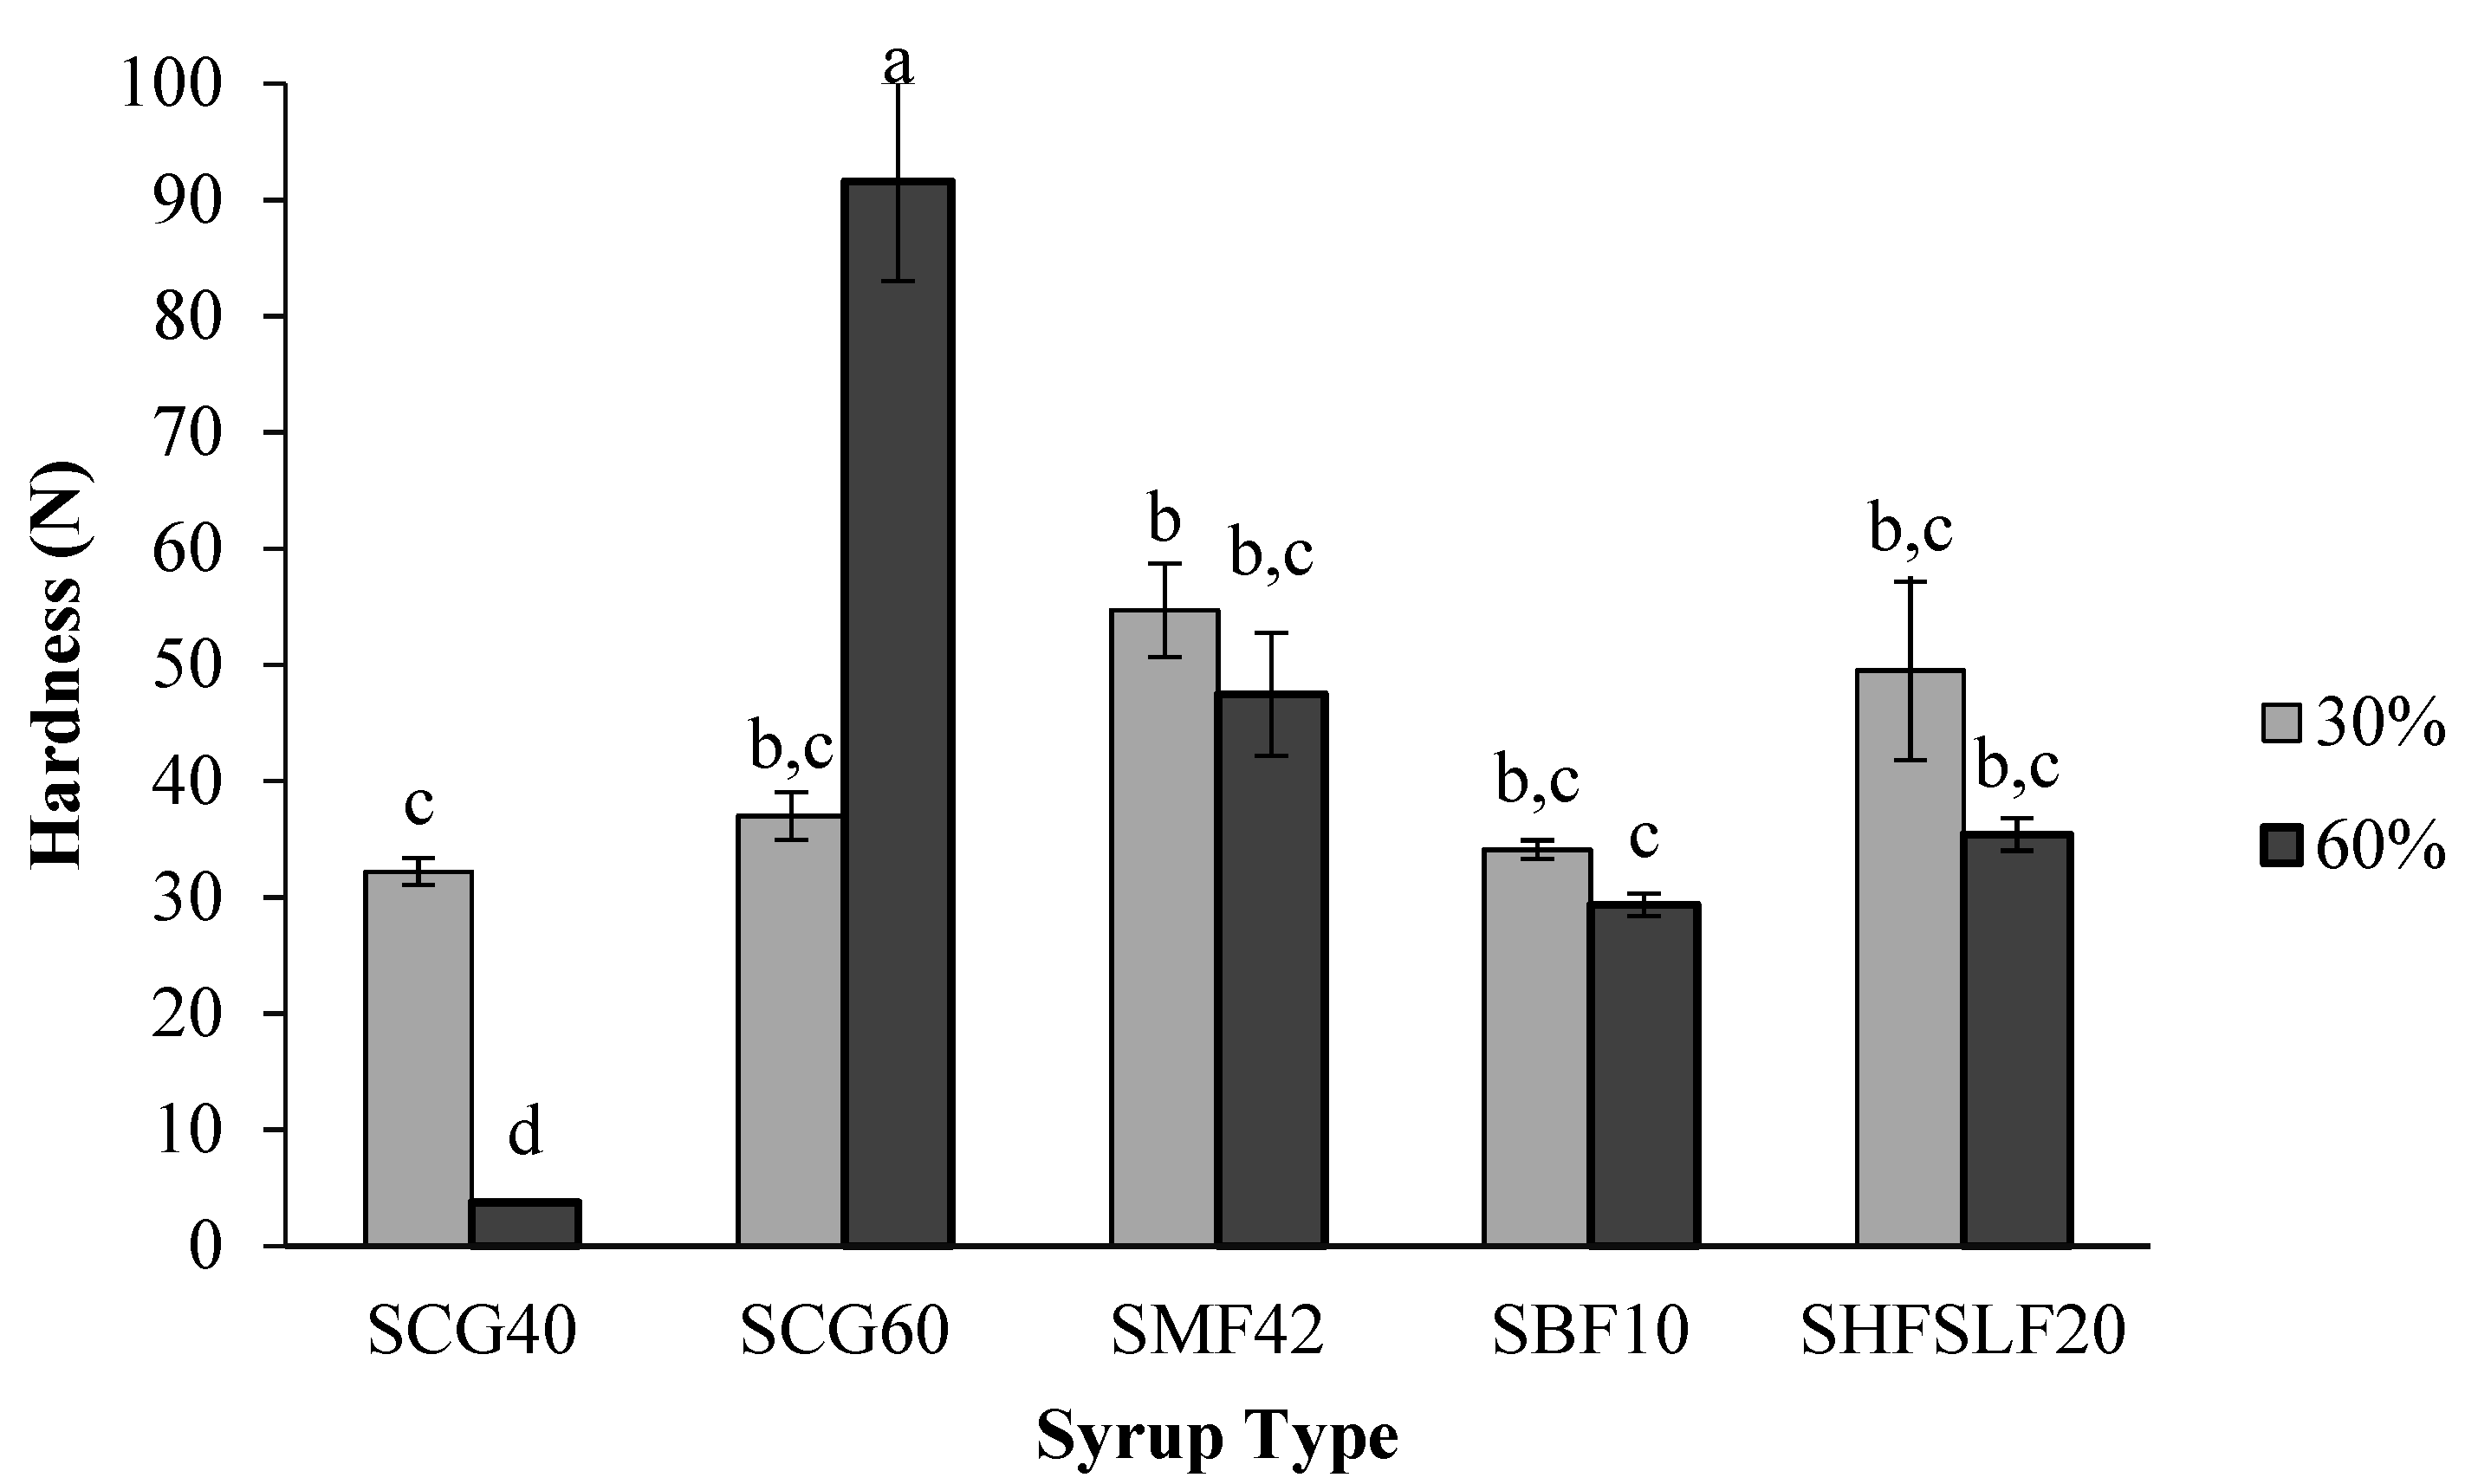
2.3. Hardness
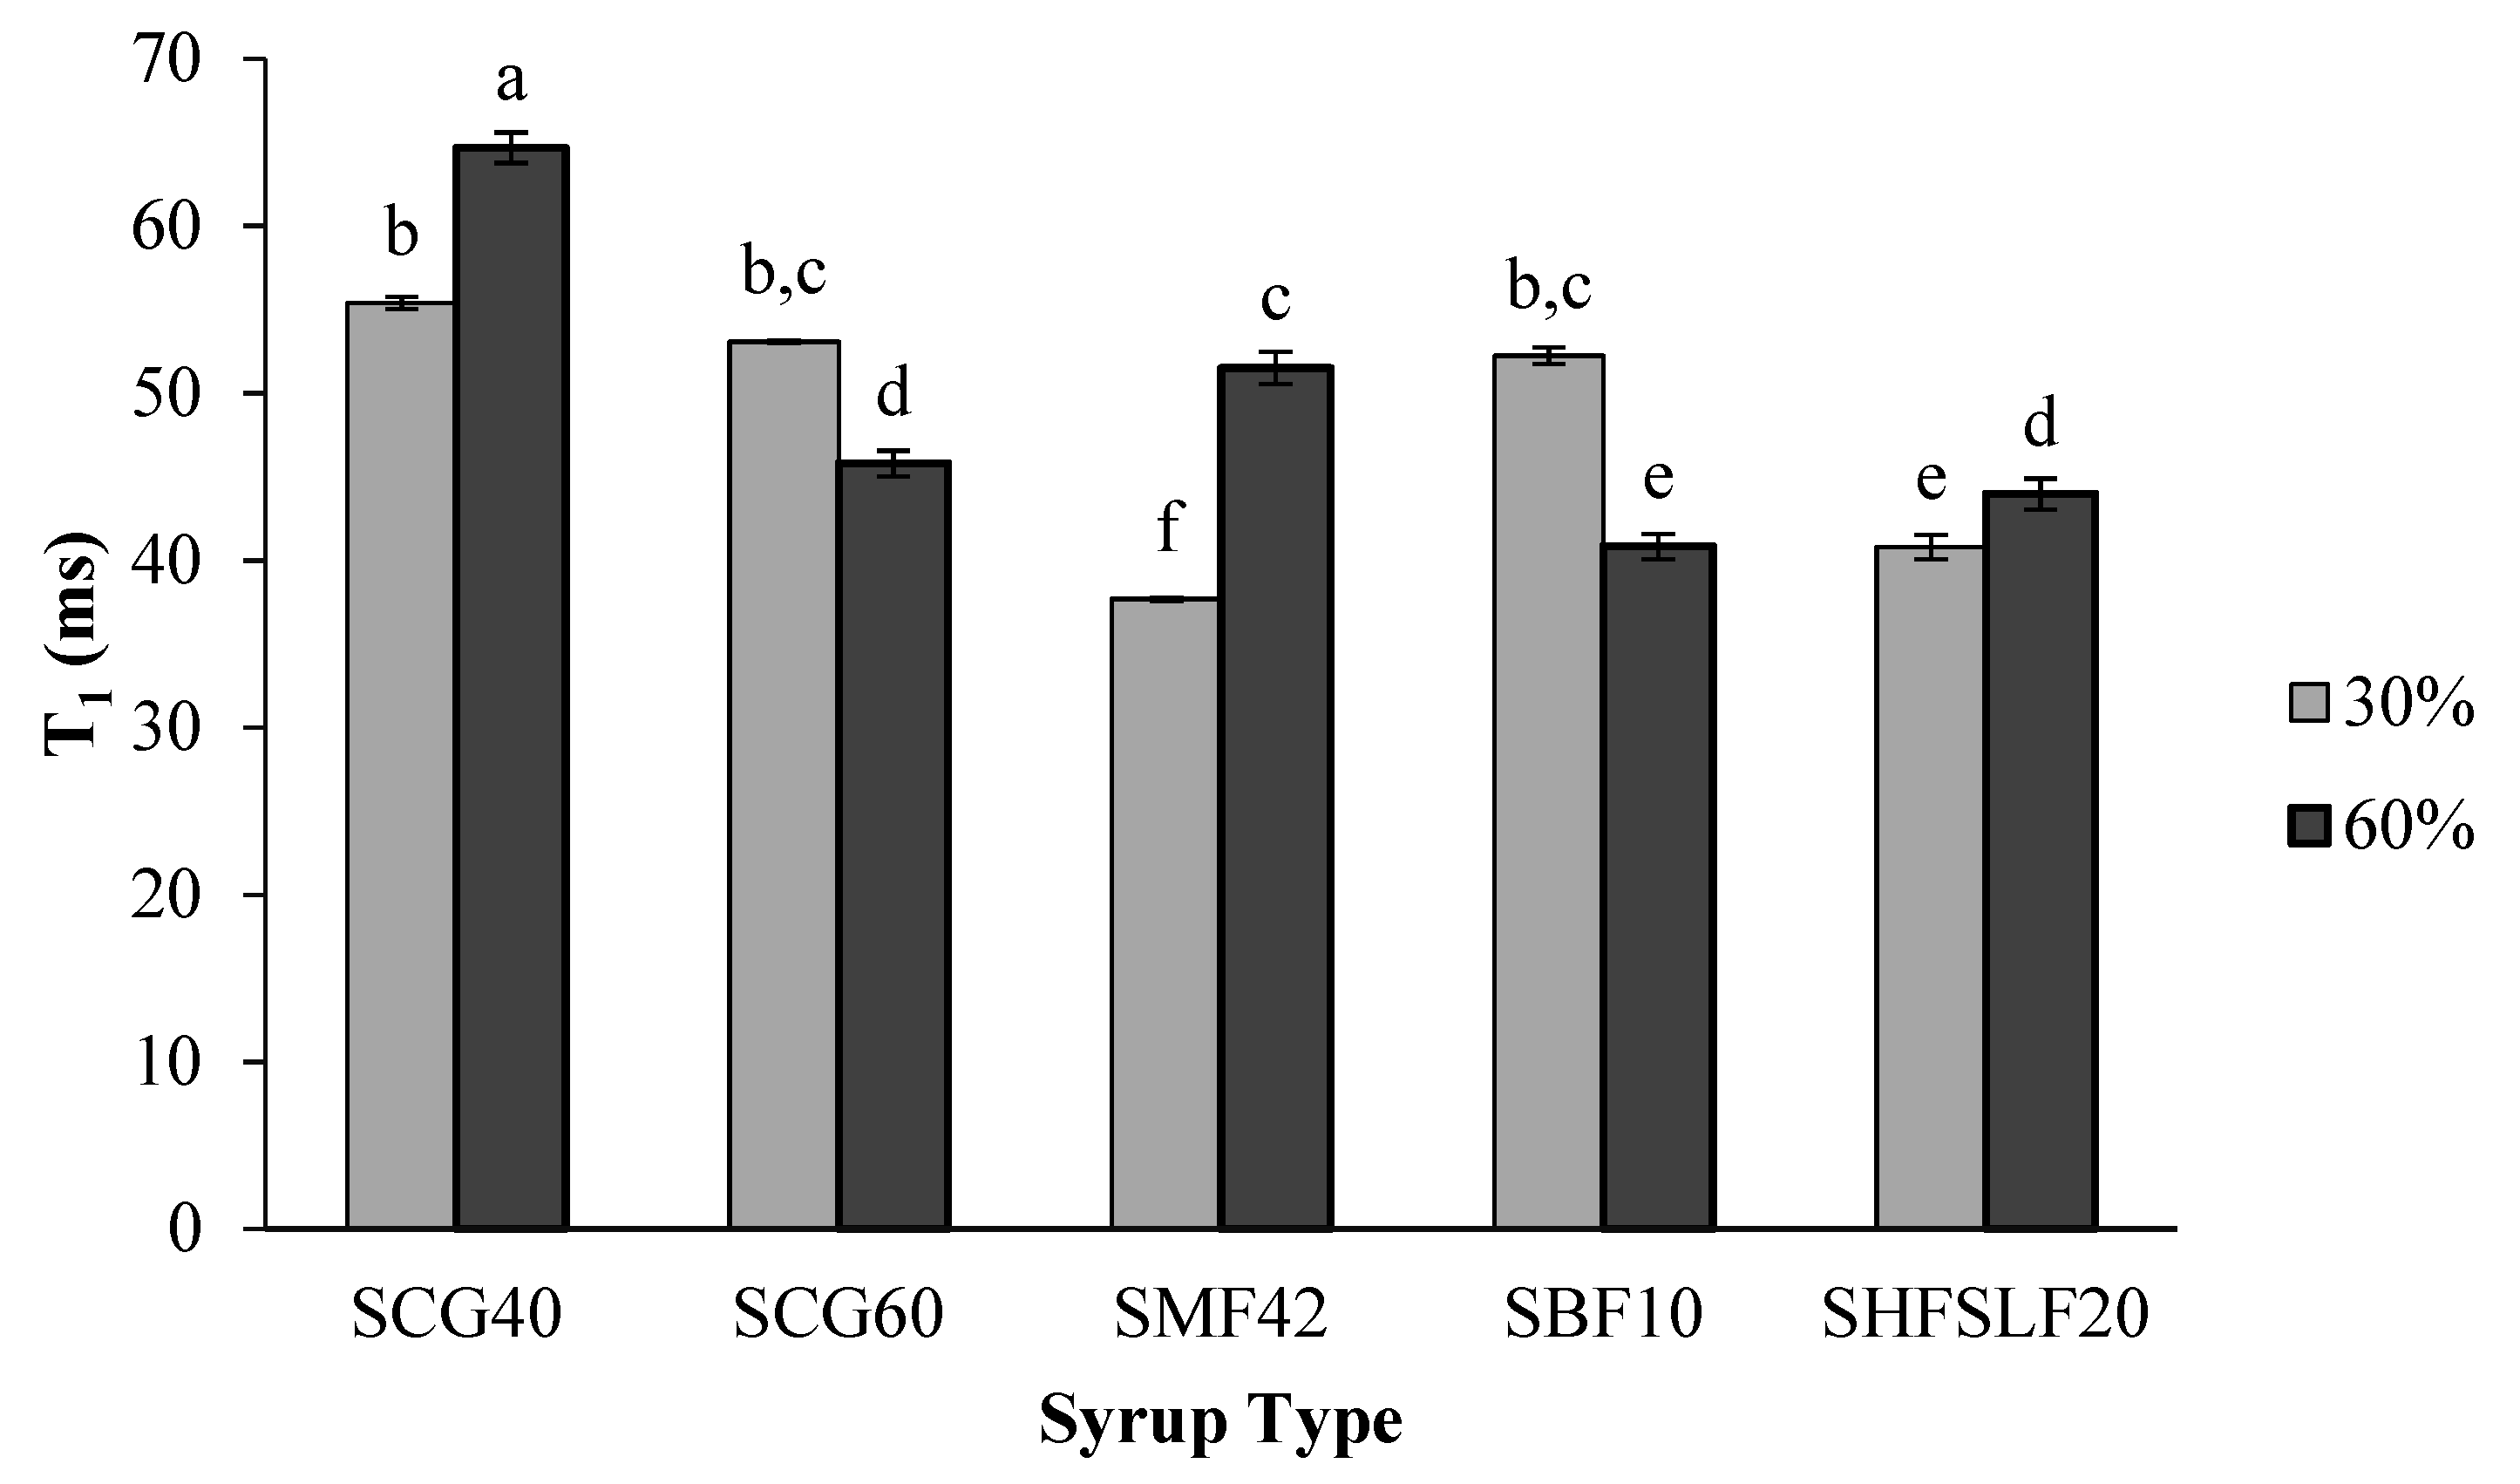
2.4. Longitudinal Relaxation Times
2.5. Second Moment
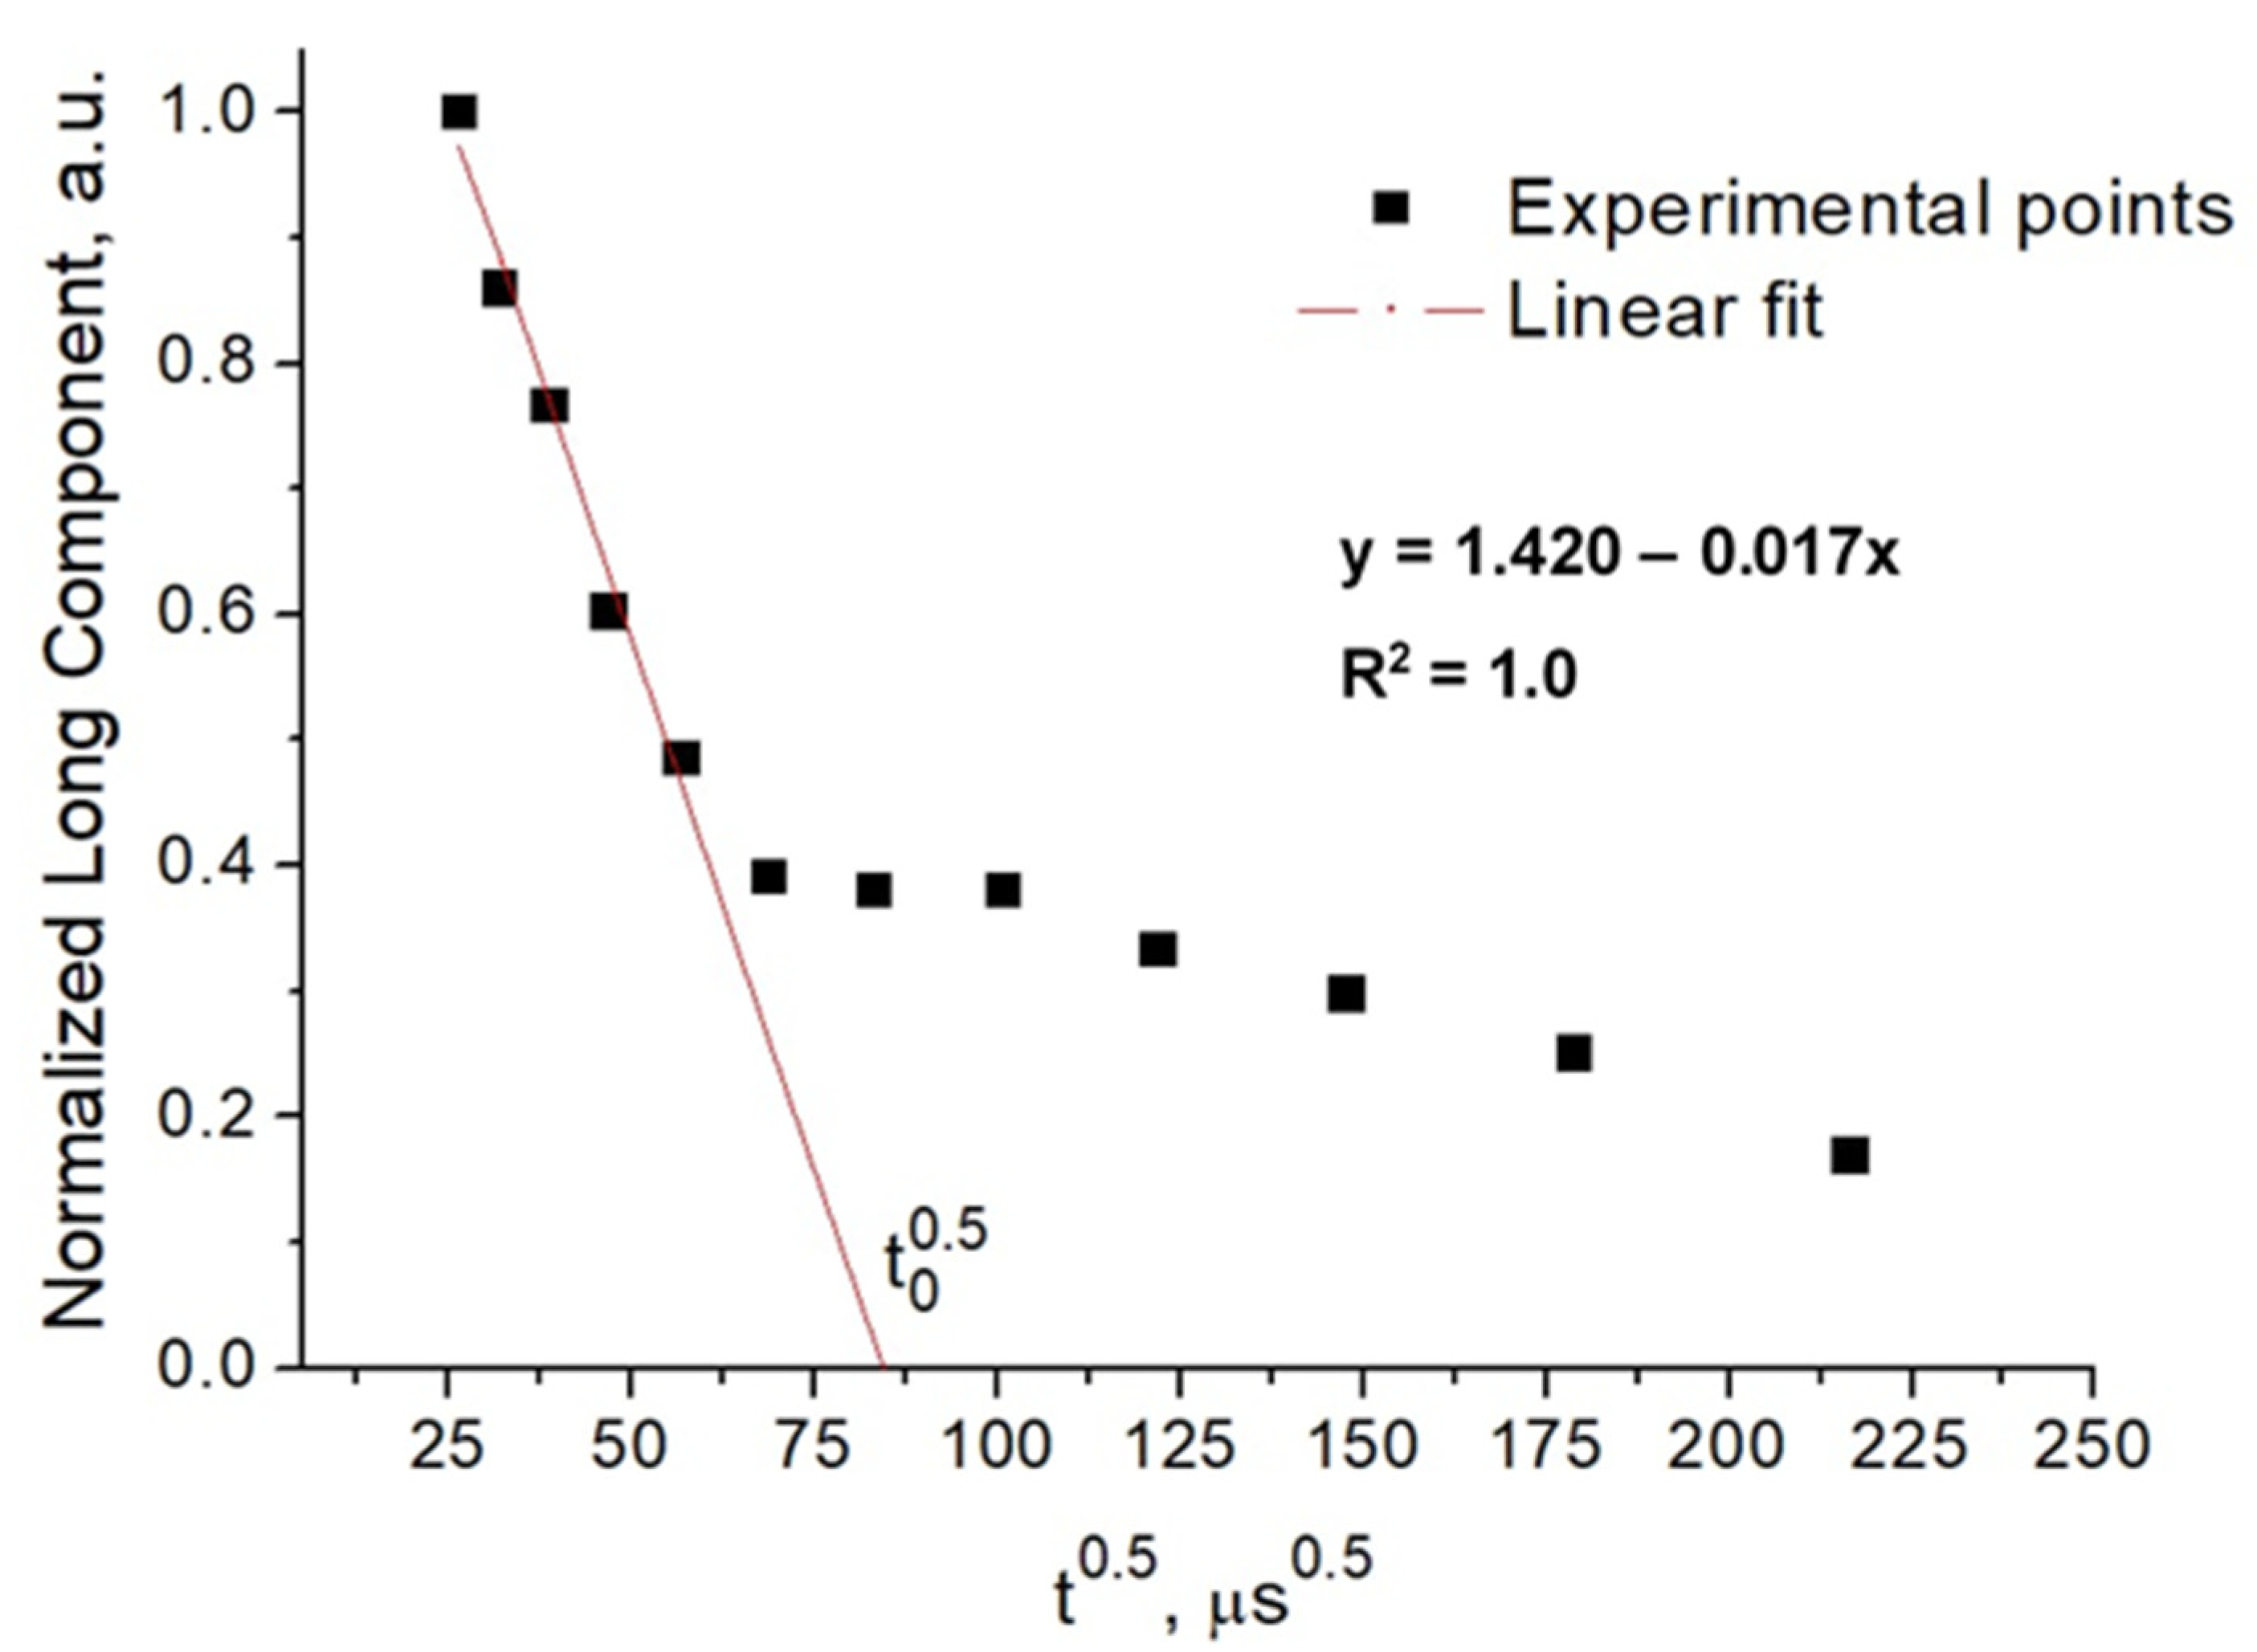
2.6. Spin Diffusion
3. Materials and Methods
3.1. Materials
3.2. Sample Preparation
3.3. Water Activity Measurements
3.4. Texture Profile Analysis
3.5. Brix Measurements
3.6. Time Domain Nuclear Magnetic Resonance (TD-NMR) Relaxometry Experiments
3.7. Statistical Analysis
4. Conclusions
Author Contributions
Funding
Institutional Review Board Statement
Informed Consent Statement
Data Availability Statement
Conflicts of Interest
References
- Delgado, P.; Bañón, S. Efecto de la sustitución de almidón por inulina sobre las características físico-químicas, de textura y sensoriales de los caramelos de goma. CYTA-J. Food 2018, 16, 1–10. [Google Scholar] [CrossRef] [Green Version]
- Efe, N.; Bielejewski, M.; Tritt-Goc, J.; Mert, B.; Oztop, M.H. NMR relaxometry study of gelatin based low-calorie soft candies. Mol. Phys. 2019, 117, 1034–1045. [Google Scholar] [CrossRef]
- Ebrahimnejad, H.; Ebrahimnejad, H.; Salajegheh, A.; Barghi, H. Use of Magnetic Resonance Imaging in Food Quality Control: A Review. J. Biomed. Phys. Eng. 2018, 8, 127–132. [Google Scholar] [PubMed]
- Ates, E.G.; Ozvural, E.B.; Oztop, M.H. Understanding the role of d-Allulose and soy protein addition in pectin gels. J. Appl. Polym. Sci. 2021, 138, 49885. [Google Scholar] [CrossRef]
- Ates, E.G.; Domenici, V.; Florek-Wojciechowska, M.; Gradišek, A.; Kruk, D.; Maltar-Strmečki, N.; Oztop, M.; Ozvural, E.B.; Rollet, A.L. Field-dependent NMR relaxometry for Food Science: Applications and perspectives. Trends Food Sci. Technol. 2021, 110, 513–524. [Google Scholar] [CrossRef]
- Kirtil, E.; Oztop, M.H. 1H Nuclear magnetic resonance relaxometry and magnetic resonance imaging and applications in food science and processing. Food Eng. Rev. 2016, 8, 1–22. [Google Scholar] [CrossRef]
- Maus, A.; Hertlein, C.; Saalwächter, K. A robust proton NMR method to investigate hard/soft ratios, crystallinity, and component mobility in polymers. Macromol. Chem. Phys. 2006, 207, 1150–1158. [Google Scholar] [CrossRef]
- Grunin, L.; Oztop, M.H.; Guner, S.; Baltaci, S.F. Exploring the crystallinity of different powder sugars through solid echo and magic sandwich echo sequences. Magn. Reson. Chem. 2019, 57, 607–615. [Google Scholar] [CrossRef]
- Papon, A.; Saalwächter, K.; Schäler, K.; Guy, L.; Lequeux, F.; Montes, H. Low-field NMR investigations of nanocomposites: Polymer dynamics and network effects. Macromolecules 2011, 44, 913–922. [Google Scholar] [CrossRef]
- Grunin, L.Y.; Grunin, Y.B.; Nikolskaya, E.A.; Sheveleva, N.N.; Nikolaev, I.A. An NMR relaxation and spin diffusion study of cellulose structure during water adsorption. Biophys. Russ. Fed. 2017, 62, 198–206. [Google Scholar] [CrossRef]
- Leisen, J.; Beckham, H.W.; Sharaf, M.A. Evolution of crystallinity, chain mobility, and crystallite size during polymer crystallization. Macromolecules 2004, 37, 8028–8034. [Google Scholar] [CrossRef]
- Pancoast, H.M.; Junk, W.R. Handbook of Sugars, 2nd ed.; Pancoast, H.M., Junk, W.R., Eds.; AVI Publishing Co. Inc.: Westport, CT, USA, 1980. [Google Scholar]
- Ergun, R.; Lietha, R.; Hartel, R.W. Moisture and shelf life in sugar confections. Crit. Rev. Food Sci. Nutr. 2010, 50, 162–192. [Google Scholar] [CrossRef] [PubMed]
- Schneider, H.A. Glass transiton behaviour of compatible polymer blends. Polymer 1989, 30, 771–779. [Google Scholar] [CrossRef]
- Schmidt, C.; Bornmann, R.; Schuldt, S.; Schneider, Y.; Rohm, H. Thermo-Mechanical Properties of Soft Candy: Application of Time-Temperature Superposition to Mimic Response at High Deformation Rates. Food Biophys. 2018, 13, 11–17. [Google Scholar] [CrossRef]
- Hartel, R.W.; Ergun, R.; Vogel, S. Phase/State Transitions of Confectionery Sweeteners: Thermodynamic and Kinetic Aspects. Compr. Rev. Food Sci. Food Saf. 2011, 10, 17–32. [Google Scholar] [CrossRef]
- Okada, K.; Hirai, D.; Kumada, S.; Kosugi, A.; Hayashi, Y.; Onuki, Y. 1H NMR Relaxation Study to Evaluate the Crystalline State of Active Pharmaceutical Ingredients Containing Solid Dosage Forms Using Time Domain NMR. J. Pharm. Sci. 2019, 108, 451–456. [Google Scholar] [CrossRef] [Green Version]
- Hashemi, R.H.; Bradley, W.G.; Lisanti, C.J. MRI: The basics, 3rd ed.; Lippincott Williams and Wilkins: Baltimore, MA, USA, 2010; ISBN 978-1-60831-115-6. [Google Scholar]
- Aso, Y.; Yoshioka, S.; Miyazaki, T.; Kawanishi, T.; Tanaka, K.; Kitamura, S.; Takakura, A.; Hayashi, T.; Muranushi, N. Miscibility of nifedipine and hydrophilic polymers as measured by 1H-NMR spin-lattice relaxation. Chem. Pharm. Bull. 2007, 55, 1227–1231. [Google Scholar] [CrossRef] [Green Version]
- Le Botlan, D.; Casseron, F.; Lantier, F. Polymorphism of sugars studied by time domain NMR. Analusis 1998, 26, 198–204. [Google Scholar] [CrossRef]
- Van Duynhoven, J.; Dubourg, I.; Goudappel, G.J.; Roijers, E. Determination of MG and TG phase composition by time-domain NMR. JAOCS, J. Am. Oil Chem. Soc. 2002, 79, 383–388. [Google Scholar] [CrossRef]
- Wang, Y.L.; Tang, H.R.; Belton, P.S. Solid state NMR studies of the molecular motions in the polycrystalline α-L-fucopyranose and methyl α-L-fucopyranoside. J. Phys. Chem. B 2002, 106, 12834–12840. [Google Scholar] [CrossRef]
- Berk, B.; Grunin, L.; Oztop, M.H. A non-conventional TD-NMR approach to monitor honey crystallization and melting. J. Food Eng. 2021, 292, 110292. [Google Scholar] [CrossRef]
- Adam-Berret, M.; Riaublanc, A.; Rondeau-Mouro, C.; Mariette, F. Effects of crystal growth and polymorphism of triacylglycerols on nmr relaxation parameters. 1. evidence of a relationship between crystal size and spin-lattice relaxation time. Cryst. Growth Des. 2009, 9, 4273–4280. [Google Scholar] [CrossRef]
- Slade, L.; Levine, H.; Reid, D.S. Beyond water activity: Recent advances based on an alternative approach to the assessment of food quality and safety. Crit. Rev. Food Sci. Nutr. 1991, 30, 115–360. [Google Scholar] [CrossRef] [PubMed]
- McFetridge, J.; Rades, T.; Lim, M. Influence of hydrogenated starch hydrolysates on the glass transition and crystallisation of sugar alcohols. Food Res. Int. 2004, 37, 409–415. [Google Scholar] [CrossRef]
- Roos, Y.; Karel, M. Plasticizing Effect of Water on Thermal Behavior and Crystallization of Amorphous Food Models. J. Food Sci. 1991, 56, 38–43. [Google Scholar] [CrossRef]
- Cheung, T.T.P. Spin diffusion in NMR in solids. Phys. Rev. B 1981, 23, 1404–1418. [Google Scholar] [CrossRef]
- Buda, A.; Demco, D.E.; Bertmer, M.; Blümich, B.; Reining, B.; Keul, H.; Höcker, H. Domain sizes in heterogeneous polymers by spin diffusion using single-quantum and double-quantum dipolar filters. Solid State Nucl. Magn. Reson. 2003, 24, 39–67. [Google Scholar] [CrossRef]
- Schäler, K.; Roos, M.; Micke, P.; Golitsyn, Y.; Seidlitz, A.; Thurn-Albrecht, T.; Schneider, H.; Hempel, G.; Saalwächter, K. Basic principles of static proton low-resolution spin diffusion NMR in nanophase-separated materials with mobility contrast. Solid State Nucl. Magn. Reson. 2015, 72, 50–63. [Google Scholar] [CrossRef]
- Greenbaum, D.; Kindermann, M.; Ramanathan, C.; Cory, D.G. Hydrodynamic approach to coherent nuclear-spin transport. Phys. Rev. B-Condens. Matter Mater. Phys. 2005, 71, 054403. [Google Scholar] [CrossRef] [Green Version]
- Demco, D.E.; Johansson, A.; Tegenfeldt, J. Proton spin diffusion for spatial heterogeneity and morphology investigations of polymers. Solid State Nucl. Magn. Reson. 1995, 4, 13–38. [Google Scholar] [CrossRef]
- Mauri, M.; Thomann, Y.; Schneider, H.; Saalwächter, K. Spin-diffusion NMR at low field for the study of multiphase solids. Solid State Nucl. Magn. Reson. 2008, 34, 125–141. [Google Scholar] [CrossRef] [PubMed]
- Cheung, T.T.P.; Gerstein, B.C. 1H nuclear magnetic resonance studies of domain structures in polymers. J. Appl. Phys. 1981, 52, 5517–5528. [Google Scholar] [CrossRef]
- Goldman, M.; Shen, L. Spin-Spin Relaxation in LaF3. Phys. Rev. 1966, 144, 321–331. [Google Scholar] [CrossRef]
- Besghini, D.; Mauri, M.; Simonutti, R. Time domain NMR in polymer science: From the laboratory to the industry. Appl. Sci. 2019, 9, 1801. [Google Scholar] [CrossRef]


| M2 (SE) | M2 (MSE) | |||
|---|---|---|---|---|
| Syrup Amount (%) | 30 | 60 | 30 | 60 |
| Syrup Type | ||||
| SCG40 | 7.00 ± 0.10 a,b | 7.46 ± 0.07 a | 11.76 ± 0.08 a,b | 11.99 ± 0.07 a |
| SCG60 | 6.86 ± 0.06 a,b | 7.25 ± 0.05 a,b | 11.21 ± 0.14 a,b | 12.02 ± 0.15 a |
| SMF42 | 6.14 ± 0.27 c | 5.31 ± 0.08 d | 9.21 ± 0.23 c | 8.55 ± 0.35 c |
| SBF10 | 6.77 ± 0.15 b,c | 6.75 ± 0.13 b,c | 10.92 ± 0.24 b | 11.00 ± 0.12 b |
| SHFSLF20 | 7.19 ± 0.10 a,b | 6.69 ± 0.09 b,c | 11.60 ± 0.08 a,b | 11.14 ± 0.09 a,b |
| Interface layer thickness (Å) | ||
|---|---|---|
| Syrup Amount (%) | 30 | 60 |
| Syrup Type | ||
| SCG40 | 47.5 ± 1.8 g | 62.2 ± 1.4 d,e |
| SCG60 | 50.2 ± 1.5 f,g | 69.4 ± 2.4 d |
| SMF42 | 83.6 ± 1.8 c | 641 ± 3.8 a |
| SBF10 | 57.7 ± 2.4 e,f | 95.8 ± 1.7 c |
| SHFSLF20 | 60 ± 1 e | 113 ± 3.5 b |
| Product Name | Brix (°Bx, 20 °C) | Glucose (%) | Fructose (%) |
|---|---|---|---|
| SBF10 Syrup | 79 ± 1 | 36 ± 2 | 10.5 ± 2.5 |
| SHFSLF20 Syrup | 79 ± 1 | 27.5 ± 2.5 | 20 ± 3 |
| SMF42 Syrup | 70 ± 1 | 51 ± 3 | 42.5 ± 2.5 |
| SCG40 Syrup | 83 ± 1 | 40.5 ± 3.5 | - |
| SCG60 Syrup | 81.75 ± 1.25 | 60.5 ± 3.5 | - |
| Sample Name | Sucrose (g/100 g mix) | Glucose (g/100 g mix) | Fructose (g/100 g mix) |
|---|---|---|---|
| SCG40-30% | 30 | 11 | - |
| SCG60-30% | 30 | 17.1 | - |
| SMF42-30% | 30 | 14.4 | 12 |
| SBF10-30% | 30 | 10.2 | 2.4 |
| SHFSLF20-30% | 30 | 6.9 | 5.1 |
| SCG40-60% | - | 22 | - |
| SCG60-60% | - | 34.2 | - |
| SMF42-60% | - | 28.8 | 24 |
| SBF10-60% | - | 20.4 | 48 |
| SHFSLF20-60% | - | 13.8 | 10.2 |
Publisher’s Note: MDPI stays neutral with regard to jurisdictional claims in published maps and institutional affiliations. |
© 2022 by the authors. Licensee MDPI, Basel, Switzerland. This article is an open access article distributed under the terms and conditions of the Creative Commons Attribution (CC BY) license (https://creativecommons.org/licenses/by/4.0/).
Share and Cite
Uguz, S.S.; Ozel, B.; Grunin, L.; Ozvural, E.B.; Oztop, M.H. Non-Conventional Time Domain (TD)-NMR Approaches for Food Quality: Case of Gelatin-Based Candies as a Model Food. Molecules 2022, 27, 6745. https://doi.org/10.3390/molecules27196745
Uguz SS, Ozel B, Grunin L, Ozvural EB, Oztop MH. Non-Conventional Time Domain (TD)-NMR Approaches for Food Quality: Case of Gelatin-Based Candies as a Model Food. Molecules. 2022; 27(19):6745. https://doi.org/10.3390/molecules27196745
Chicago/Turabian StyleUguz, Sirvan Sultan, Baris Ozel, Leonid Grunin, Emin Burcin Ozvural, and Mecit H. Oztop. 2022. "Non-Conventional Time Domain (TD)-NMR Approaches for Food Quality: Case of Gelatin-Based Candies as a Model Food" Molecules 27, no. 19: 6745. https://doi.org/10.3390/molecules27196745