
Deep Learning Combined with Hyperspectral Imaging Technology for Variety Discrimination of Fritillaria thunbergii
 , , ,
, , ,
Abstract
:1. Introduction
2. Materials and Methods
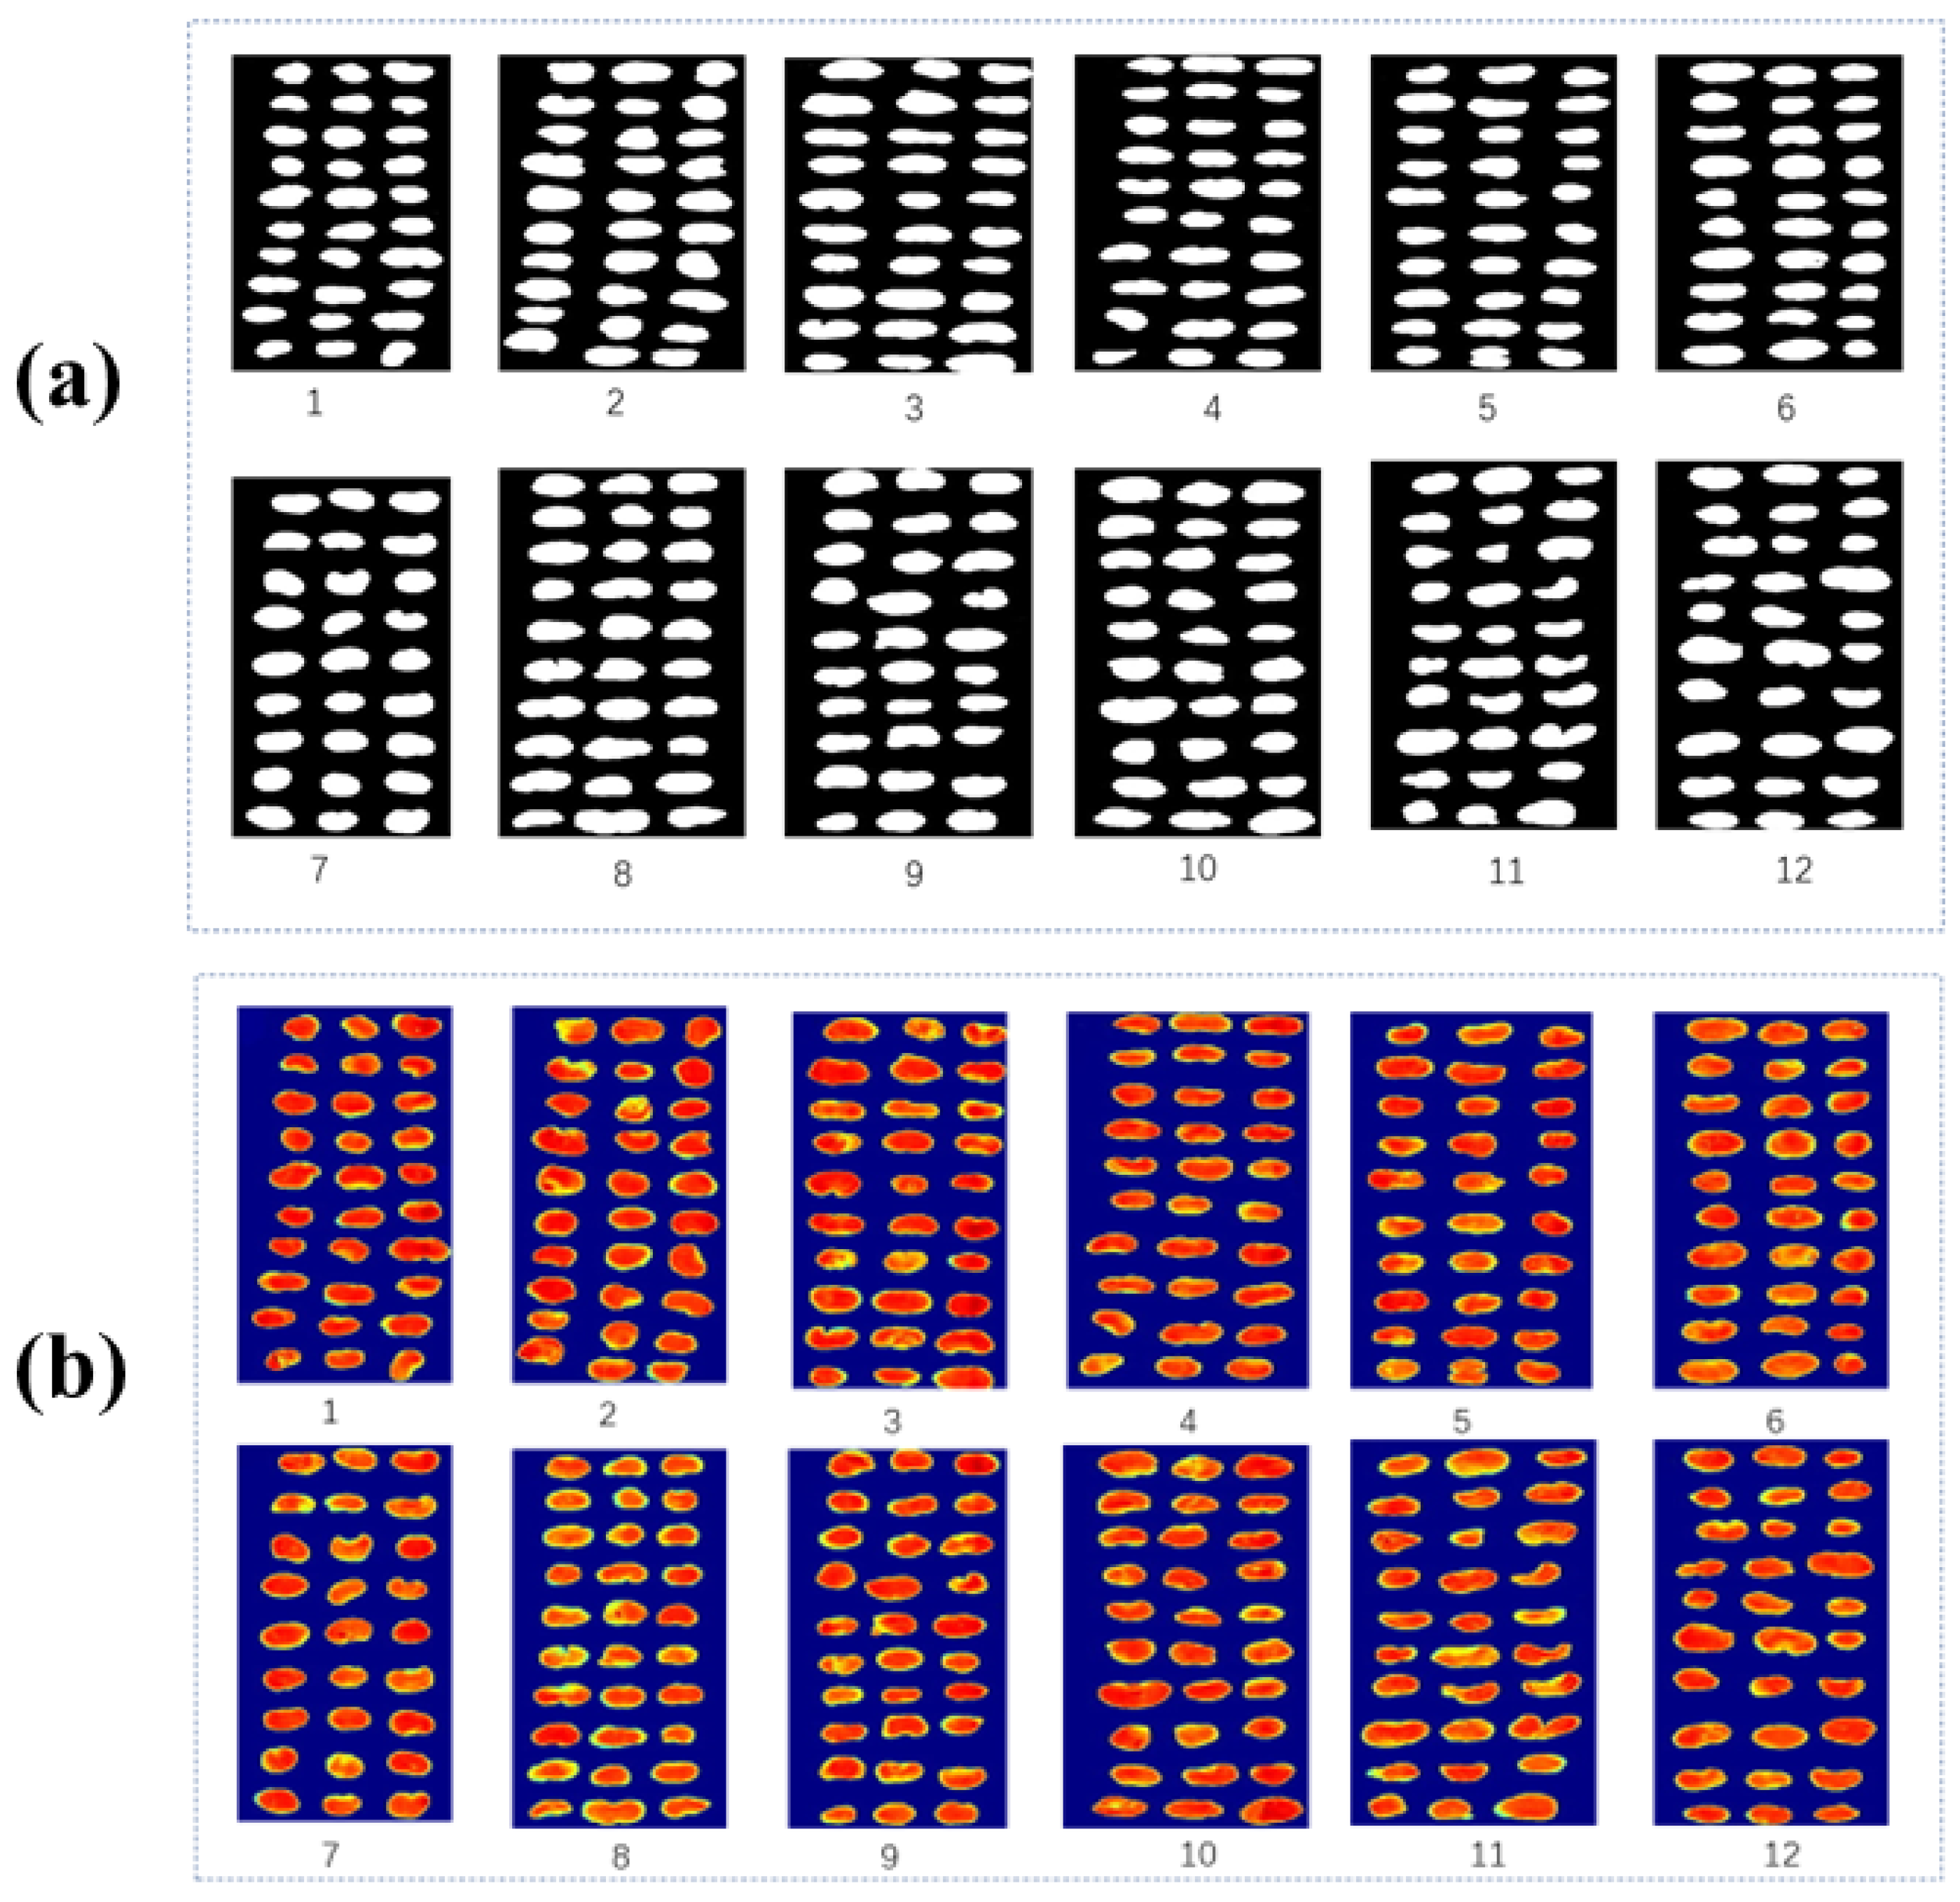
2.1. Sample Preparation
2.2. Hyperspectral Image Acquisition and Correction
2.3. Pretreatment and Extraction of Spectra
2.4. Software
2.5. Analysis of Chemometrics
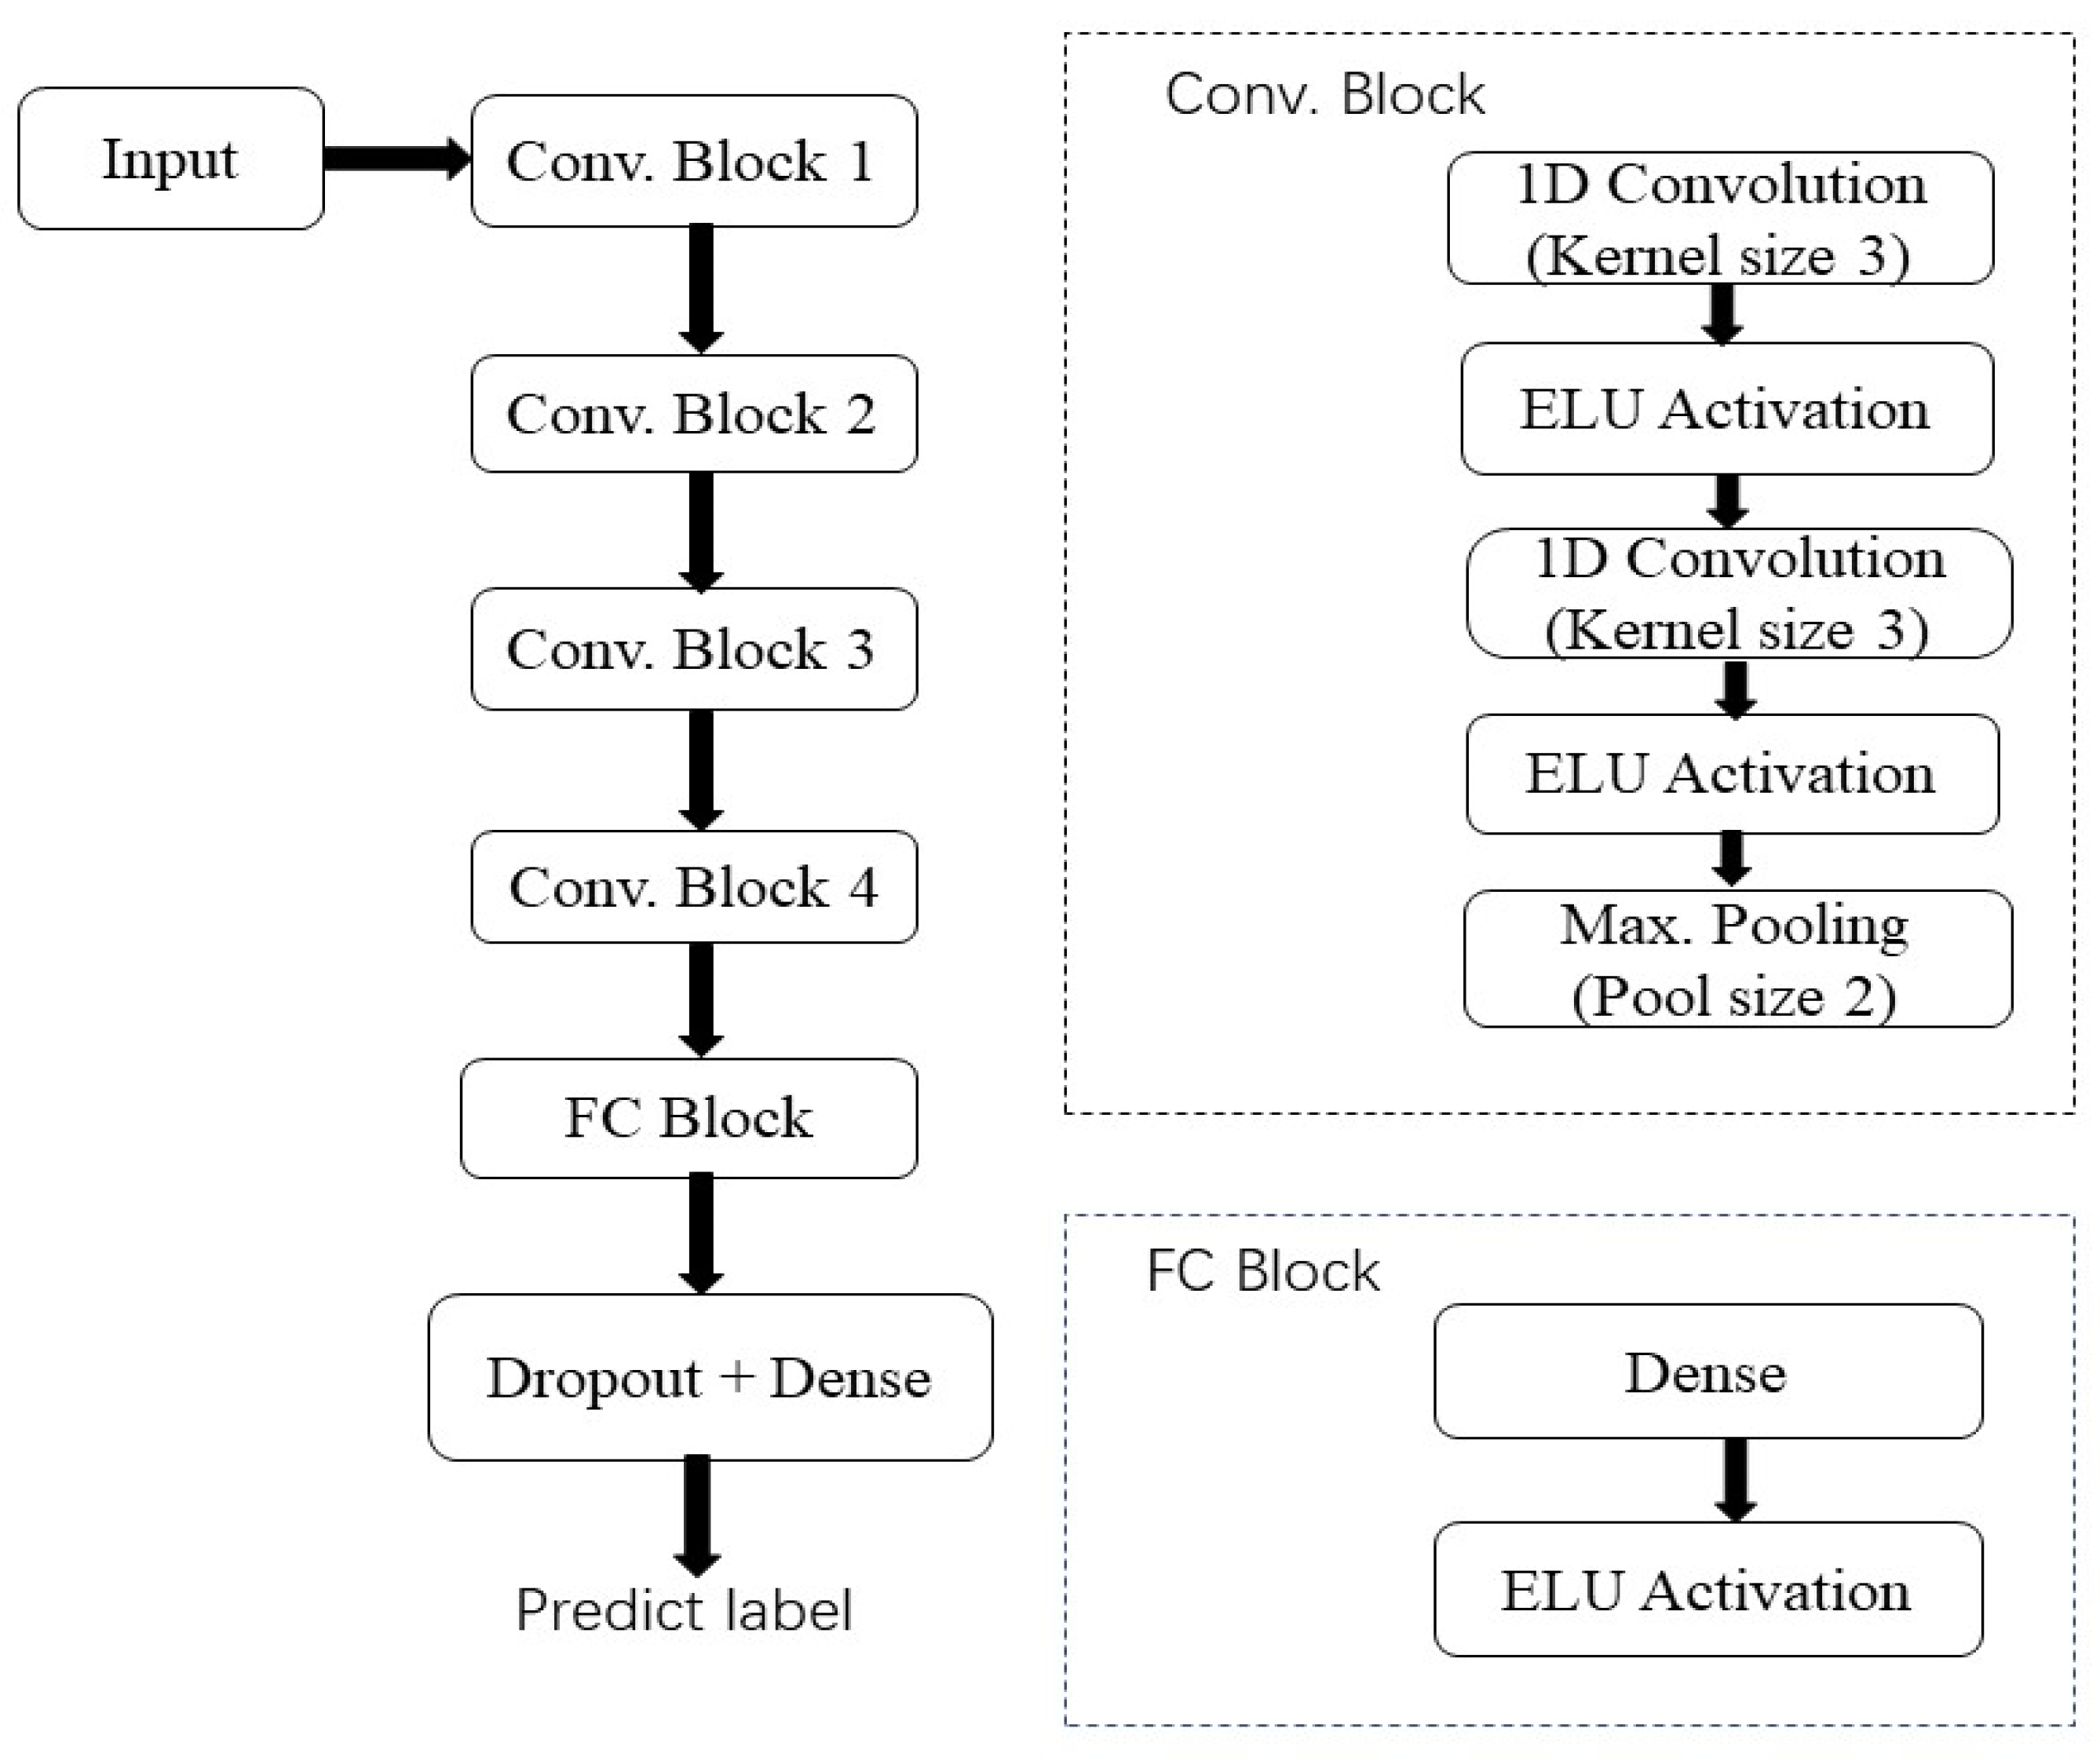
2.5.1. CNN
2.5.2. PLS-DA
2.5.3. SVM
2.5.4. Discrimination Models Accuracy Evaluation
3. Results and Discussion
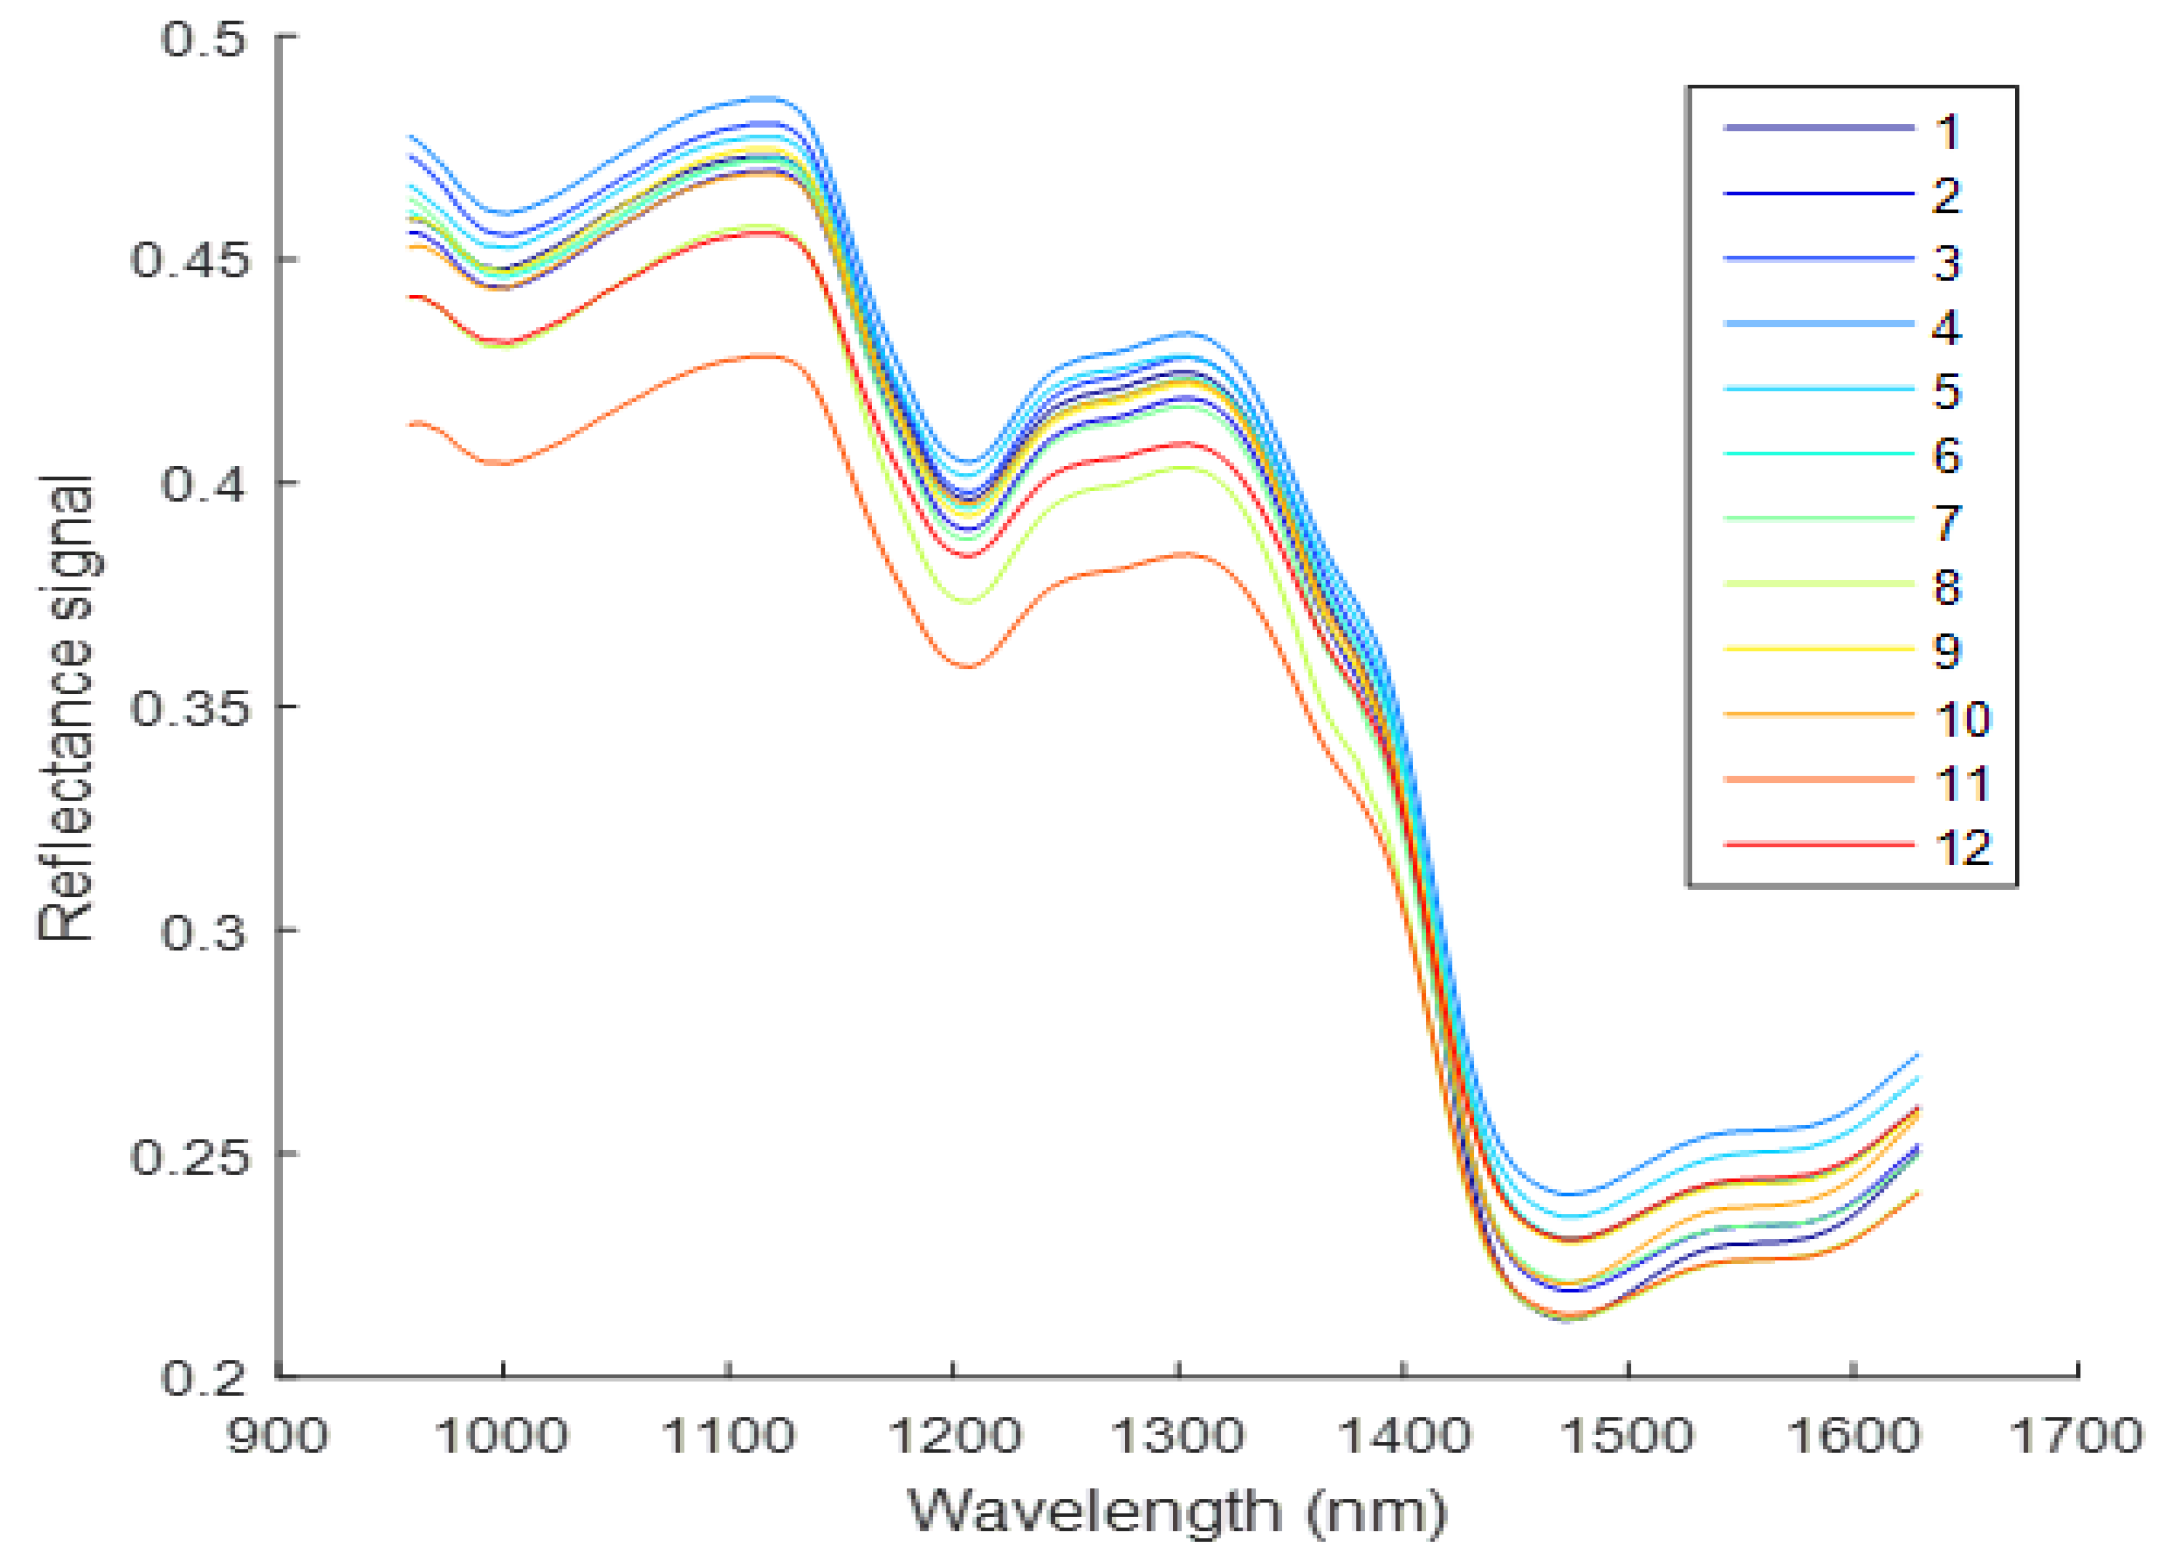
3.1. Spectral Features
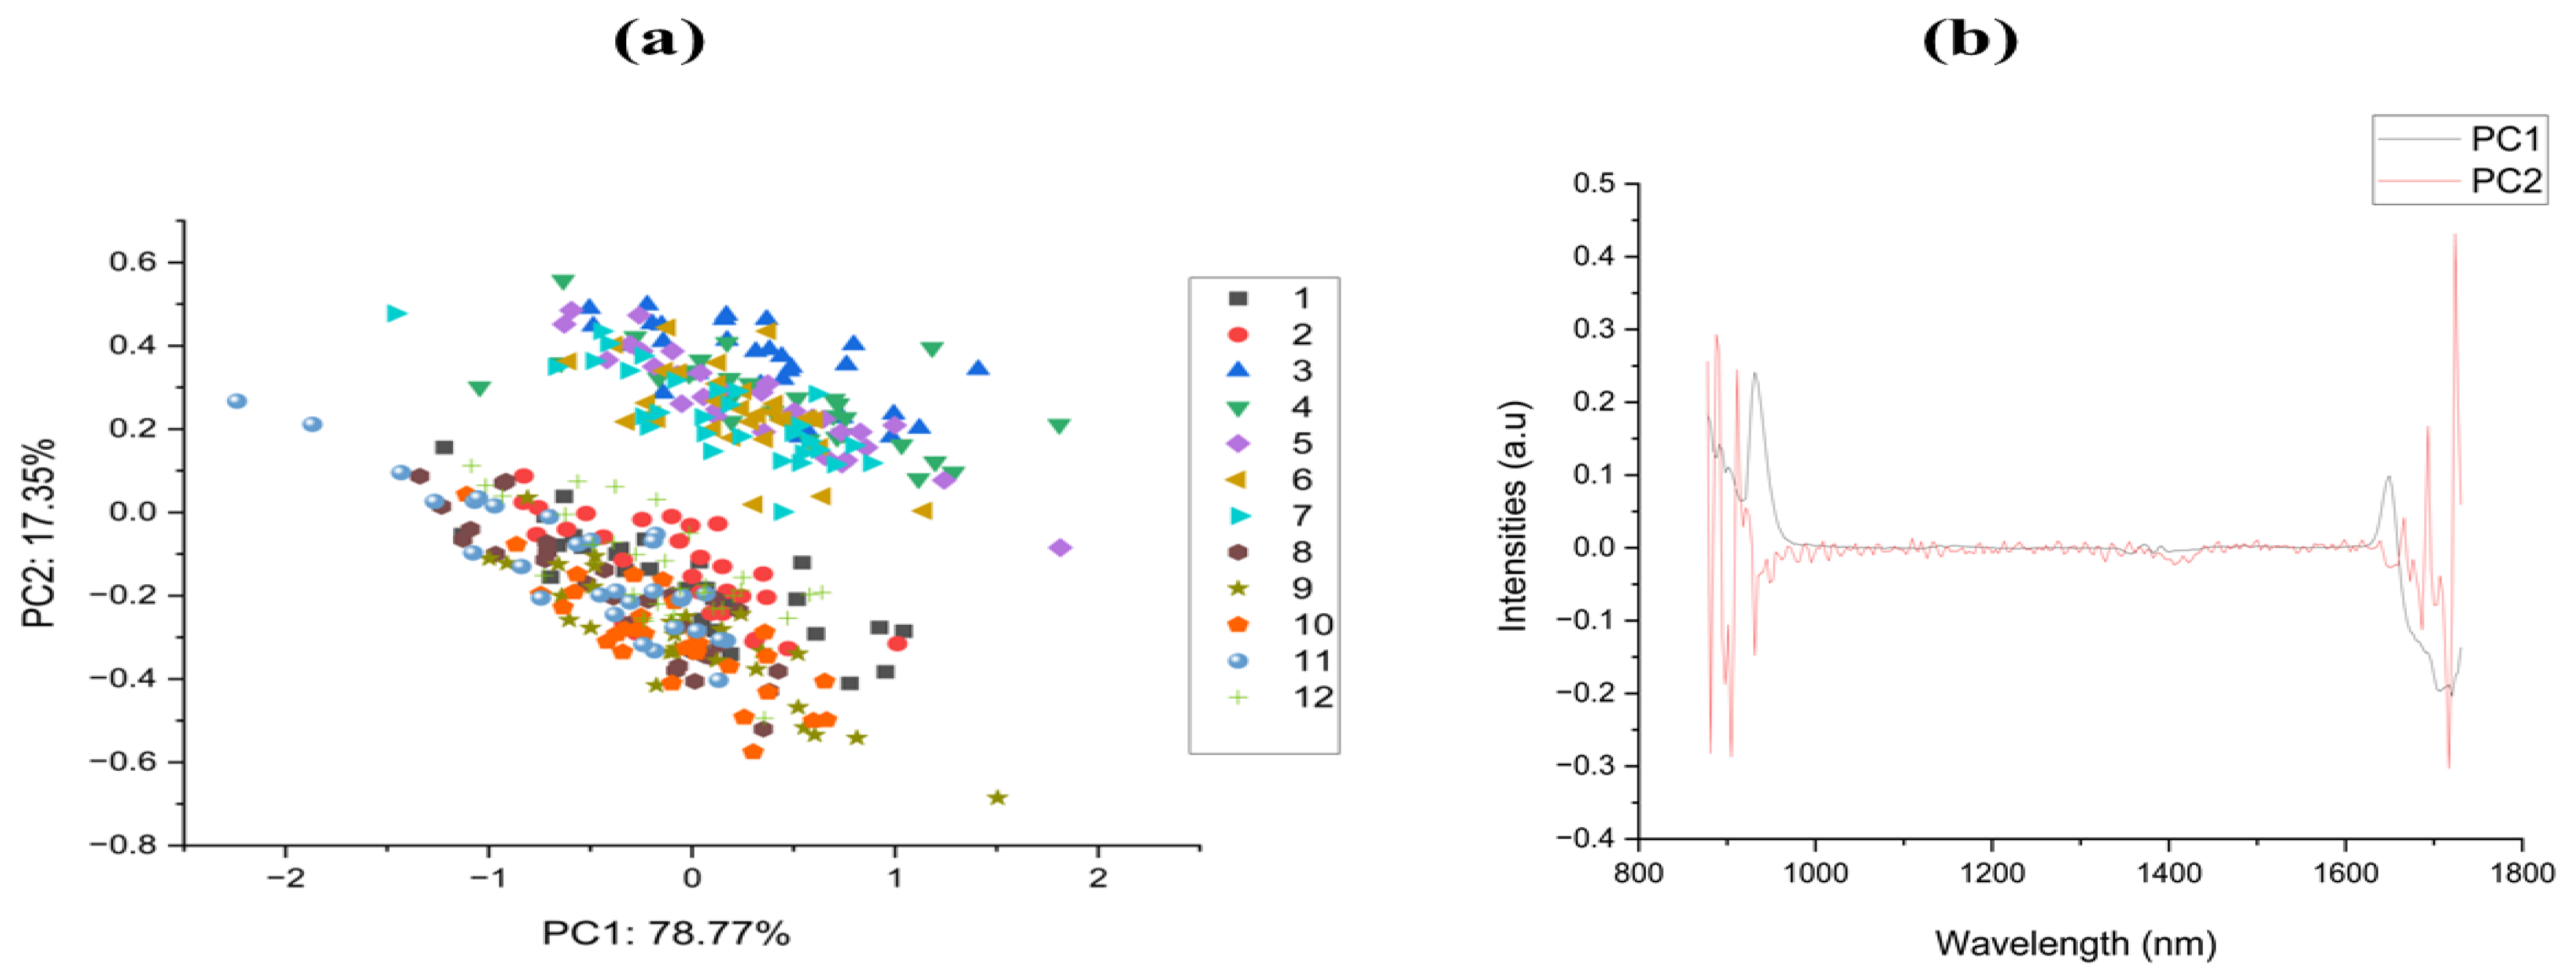
3.2. PCA
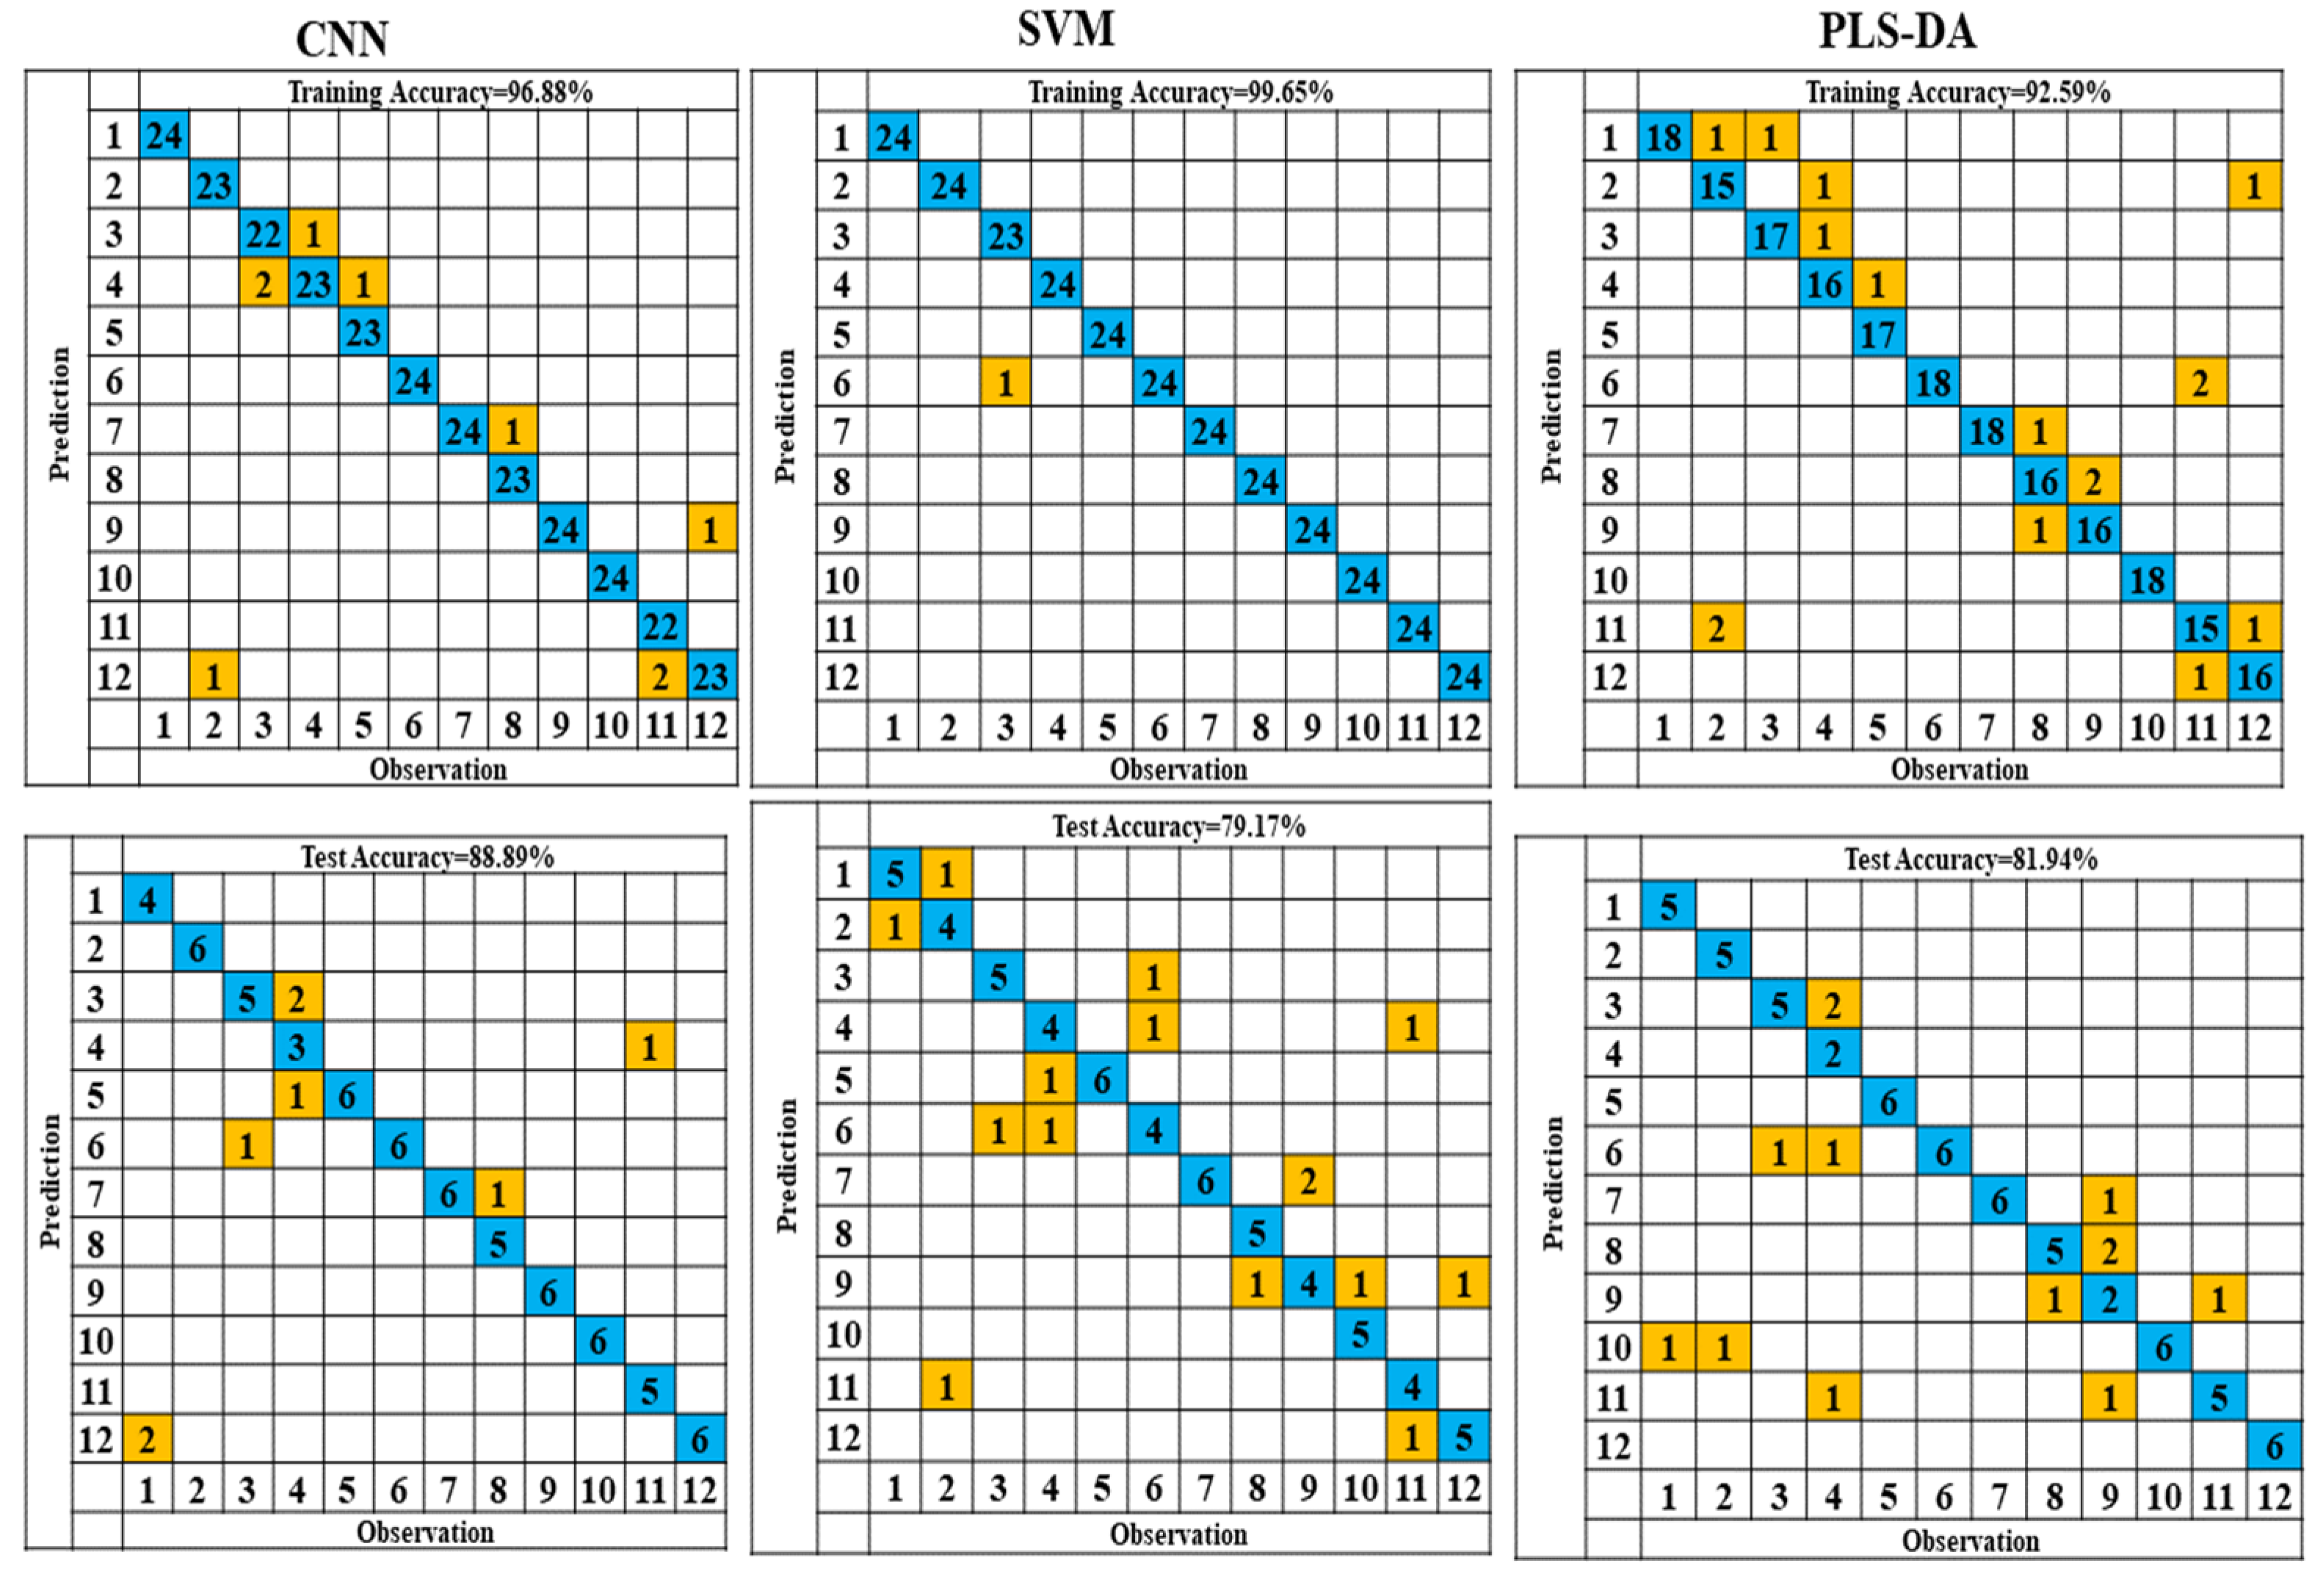
3.3. CNN
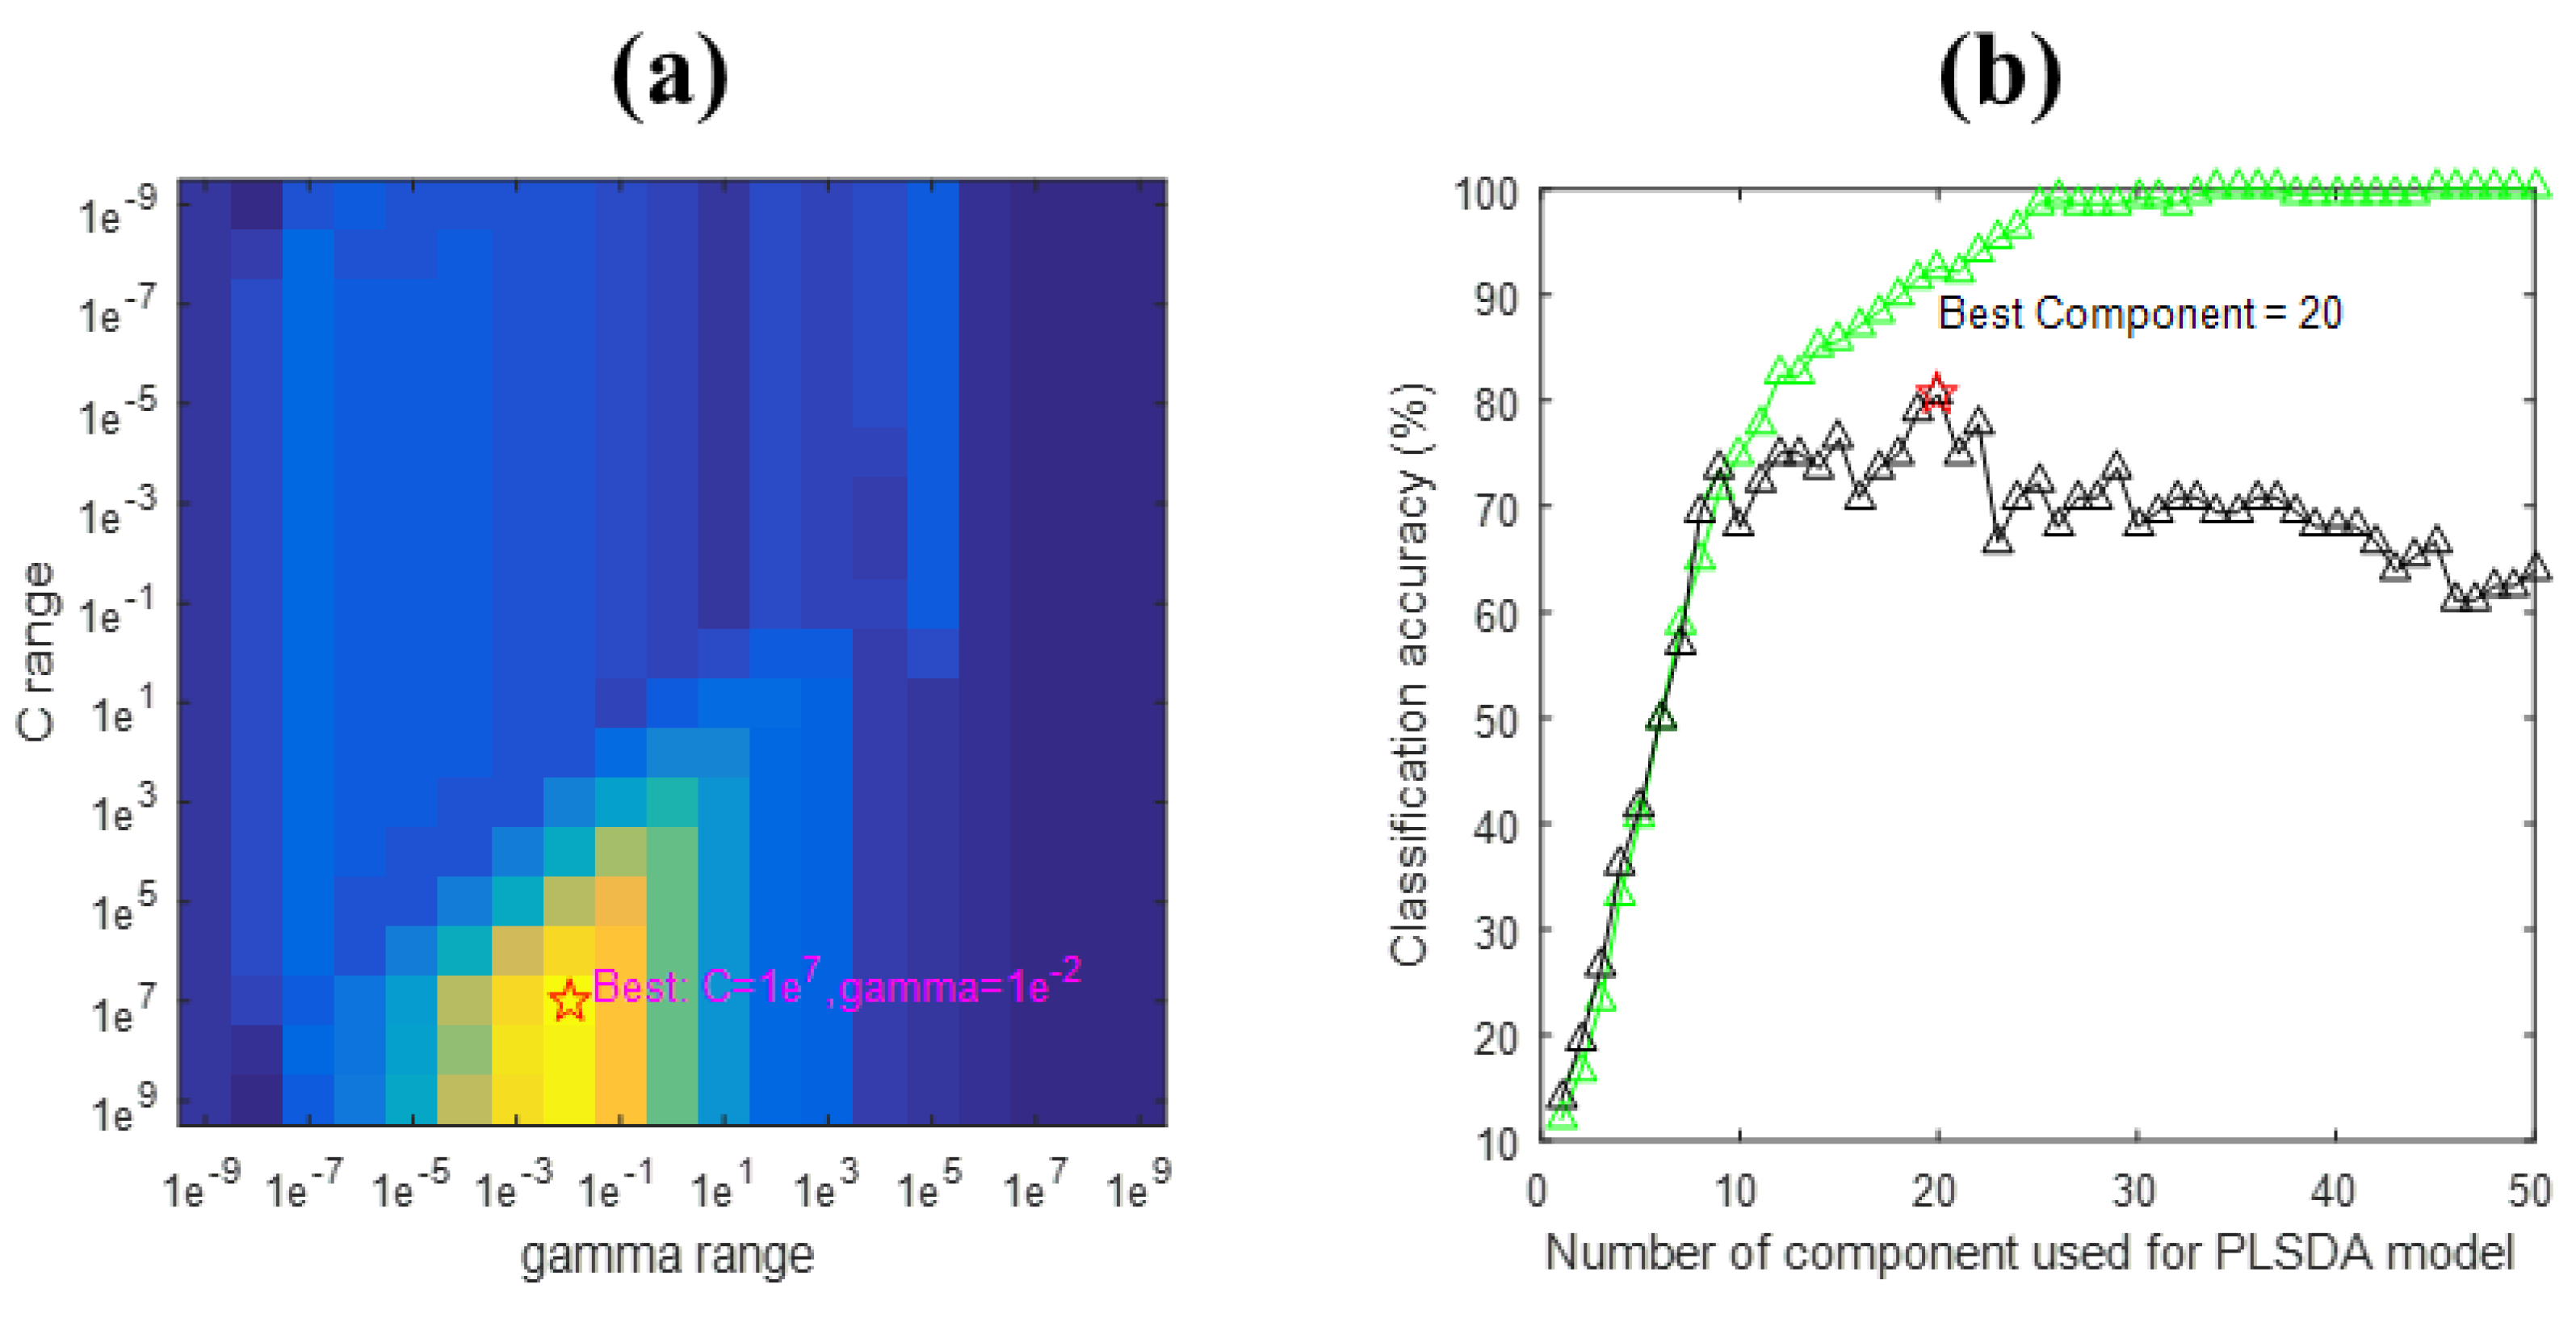
3.4. PLS-DA
3.5. SVM
4. Conclusions
Author Contributions
Funding
Institutional Review Board Statement
Informed Consent Statement
Data Availability Statement
Conflicts of Interest
Sample Availability
References
- Hu, W.; Huang, Y.; Wei, L.; Zhang, F.; Li, H. Deep convolutional neural networks for hyperspectral image classification. J. Sens. 2015, 2015, 258619. [Google Scholar] [CrossRef]
- Xu, J.; Zhao, W.; Pan, L.; Zhang, A.; Chen, Q.; Xu, K.; Lu, H.; Chen, Y. Peimine, a main active ingredient of fritillaria, exhibits anti-inflammatory and pain suppression properties at the cellular level. Fitoterapia 2016, 111, 1–6. [Google Scholar] [CrossRef] [PubMed]
- Lorente, D.; Aleixos, N.; Gómez-Sanchis, J.; Cubero, S.; García-Navarrete, O.L.; Blasco, J. Recent advances and applications of hyperspectral imaging for fruit and vegetable quality assessment. Food Bioprocess Technol. 2012, 5, 1121–1142. [Google Scholar] [CrossRef]
- Manley, M.; du Toit, G.; Geladi, P. Tracking diffusion of conditioning water in single wheat kernels of different hardnesses by near infrared hyperspectral imaging. Anal. Chim. Acta 2011, 686, 64–75. [Google Scholar] [CrossRef] [PubMed]
- Zhang, H.; Wu, T.; Zhang, L.; Zhang, P. Development of a portable field imaging spectrometer: Application for the identification of sun-dried and sulfur-fumigated chinese herbals. Appl. Spectrosc. 2016, 70, 879–887. [Google Scholar] [CrossRef] [PubMed]
- He, J.; He, Y.; Zhang, A.C. Determination and visualization of peimine and peiminine content in Fritillaria thunbergii bulbi treated by sulfur fumigation using hyperspectral imaging with chemometrics. Molecules 2017, 22, 1402. [Google Scholar] [CrossRef] [PubMed]
- Zhu, S.; Chao, M.; Zhang, J.; Xu, X.; Song, P.; Zhang, J.; Huang, Z. Identification of soybean seed varieties based on hyperspectral imaging technology. Sensors 2019, 19, 5225. [Google Scholar] [CrossRef]
- Zhu, S.; Zhang, J.; Chao, M.; Xu, X.; Song, P.; Zhang, J.; Huang, Z. A Rapid and highly efficient method for the identification of soybean seed varieties: Hyperspectral images combined with transfer learning. Molecules 2019, 25, 152. [Google Scholar] [CrossRef]
- Wu, N.; Zhang, C.; Bai, X.; Du, X.; He, Y. Discrimination of chrysanthemum varieties using hyperspectral imaging combined with a deep convolutional neural network. Molecules 2018, 23, 2831. [Google Scholar] [CrossRef]
- Nie, P.; Zhang, J.; Feng, X.; Yu, C.; He, Y. Classification of hybrid seeds using near-infrared hyperspectral imaging technology combined with deep learning. Sens. Actuators B Chem. 2019, 296, 126630. [Google Scholar] [CrossRef]
- Zhang, C.; Liu, F.; He, Y. Identification of coffee bean varieties using hyperspectral imaging: Influence of preprocessing methods and pixel-wise spectra analysis. Sci. Rep. 2018, 8, 82166. [Google Scholar] [CrossRef] [PubMed]
- Yin, W.; Zhang, C.; Zhu, H.; Zhao, Y.; He, Y. Application of near-infrared hyperspectral imaging to discriminate different geographical origins of Chinese wolfberries. PLoS ONE 2017, 12, e0180534. [Google Scholar] [CrossRef] [PubMed]
- Zhao, Y.; Zhu, S.; Zhang, C.; Feng, X.; Feng, L.; He, Y. Application of hyperspectral imaging and chemometrics for variety classification of maize seeds. RSC Adv. 2018, 8, 1337–1345. [Google Scholar] [CrossRef] [PubMed]
- Yu, Z.; Fang, H.; Zhangjin, Q.; Mi, C.; Feng, X.; He, Y. Hyperspectral imaging technology combined with deep learning for hybrid okra seed identification. Biosyst. Eng. 2021, 212, 46–61. [Google Scholar] [CrossRef]
- Carreiro Soares, S.F.; Medeiros, E.P.; Pasquini, C.; de Lelis Morello, C.; Harrop Galvão, R.K.; Ugulino Araújo, M.C. Classification of individual cotton seeds with respect to variety using near-infrared hyperspectral imaging. Anal. Methods 2016, 8, 8498–8505. [Google Scholar] [CrossRef]
- Feng, X.; Peng, C.; Chen, Y.; Liu, X.; Feng, X.; He, Y. Discrimination of CRISPR/Cas9-induced mutants of rice seeds using near-infrared hyperspectral imaging. Sci. Rep. 2017, 7, 15934. [Google Scholar] [CrossRef]
- Qiu, Z.; Chen, J.; Zhao, Y.; Zhu, S.; He, Y.; Zhang, C. Variety identification of single Rice seed using hyperspectral imaging combined with convolutional neural network. Appl. Sci. 2018, 8, 212. [Google Scholar] [CrossRef]
- Jordan, M.I.; Mitchell, T.M. Machine learning: Trends, perspectives, and prospects. Science 2015, 349, 255–260. [Google Scholar] [CrossRef]
- Jin, B.; Zhang, C.; Jia, L.; Tang, Q.; Gao, L.; Zhao, G.; Qi, H. Identification of rice seed varieties based on near-infrared hyperspectral imaging technology combined with deep learning. ACS Omega 2022, 7, 4735–4749. [Google Scholar] [CrossRef]
- Simonyan, K.; Zisserman, A. Very deep convolutional networks for large-scale image recognition. arXiv 2015, arXiv:1409.1556. [Google Scholar]
- He, K.; Zhang, X.; Ren, S.; Sun, J. Delving deep into rectifiers: Surpassing human-level performance on imagenet classification. In Proceedings of the IEEE International Conference on Computer Vision, Santiago, Chile, 7–13 December 2015; pp. 1026–1034. [Google Scholar]
- Clevert, D.-A.; Unterthiner, T.; Hochreiter, S. Fast and accurate deep network learning by exponential linear units (ELUs). arXiv 2016, arXiv:1511.07289. [Google Scholar]
- Ioffe, S.; Szegedy, C. Batch normalization accelerating deep network training by reducing internal covariate shift. In Proceedings of the International Conference on Machine Learning, Lille, France, 6–11 July 2015. [Google Scholar]
- Kingma, D.P.; Ba, J. Adam: A Method for stochastic optimization. arXiv 2014, arXiv:1412.6980. [Google Scholar]
- Almeida, M.R.; Fidelis, C.H.V.; Barata, L.E.S.; Poppi, R.J. Classification of amazonian rosewood essential oil by raman spectroscopy and PLS-DA with reliability estimation. Talanta 2013, 117, 305–311. [Google Scholar] [CrossRef]
- Burges, C.J.C. A Tutorial on support vector machines for pattern recognition. Data Min. Knowl. Discov. 1998, 2, 121–167. [Google Scholar] [CrossRef]
- Pandiselvam, R.; Mahanti, N.K.; Manikantan, M.R.; Kothakota, A.; Chakraborty, S.K.; Ramesh, S.V.; Beegum, P.P.S. Rapid detection of adulteration in desiccated coconut powder: Vis-NIR spectroscopy and chemometric approach. Food Control 2022, 133, 108588. [Google Scholar] [CrossRef]
- Mahanti, N.K.; Chakraborty, S.K. Application of chemometrics to identify artificial ripening in sapota (Manilkara Zapota) using visible near infrared absorbance spectra. Comput. Electron. Agric. 2020, 175, 105539. [Google Scholar] [CrossRef]
- Chakraborty, S.K.; Mahanti, N.K.; Mansuri, S.M.; Tripathi, M.K.; Kotwaliwale, N.; Jayas, D.S. Non-destructive classification and prediction of aflatoxin-B1 concentration in maize kernels using Vis–NIR (400–1000 nm) hyperspectral imaging. J. Food Sci. Technol. 2021, 58, 437–450. [Google Scholar] [CrossRef]
- Kabir, M.H.; Guindo, M.L.; Chen, R.; Liu, F. Geographic origin discrimination of millet using Vis-NIR spectroscopy combined with machine learning techniques. Foods 2021, 10, 2767. [Google Scholar] [CrossRef]
- Visentini, I.; Snidaro, L.; Foresti, G.L. Diversity-aware classifier ensemble selection via f-score. Inf. Fusion 2016, 28, 24–43. [Google Scholar] [CrossRef]
- Kim, S.-W.; Gil, J.-M. Research paper classification systems based on TF-IDF and LDA schemes. Hum.-Cent. Comput. Inf. Sci. 2019, 9, 30. [Google Scholar] [CrossRef]
- Barbosa, R.M.; de Paula, E.S.; Paulelli, A.C.; Moore, A.F.; Souza, J.M.O.; Batista, B.L.; Campiglia, A.D.; Barbosa, F. Recognition of organic rice samples based on trace elements and support vector machines. J. Food Compos. Anal. 2016, 45, 95–100. [Google Scholar] [CrossRef]
- Serranti, S.; Cesare, D.; Marini, F.; Bonifazi, G. Classification of oat and groat kernels using NIR hyperspectral imaging. Talanta 2013, 103, 276–284. [Google Scholar] [CrossRef] [PubMed]
- Liu, Y.; Chen, Y.R. Two-dimensional visible/near-infrared correlation spectroscopy study of thawing behavior of frozen chicken meats without exposure to air. Meat Sci. 2001, 57, 299–310. [Google Scholar] [CrossRef]
- Vance, C.K.; Tolleson, D.R.; Kinoshita, K.; Rodriguez, J.; Foley, W.J. Near Infrared Spectroscopy in Wildlife and Biodiversity. J. Near Infrared Spectrosc. 2016, 24, 1–25. [Google Scholar] [CrossRef]
- Restaino, E.; Fassio, A.; Cozzolino, D. Discrimination of meat patés according to the animal species by means of near infrared spectroscopy and chemometrics Discriminación de muestras de paté de carne según tipo de especie mediante el uso de la espectroscopia en el infrarrojo cercano y la quimiometria. CyTA-J. Food 2011, 9, 210–213. [Google Scholar]
- Wilson, R.H.; Nadeau, K.P.; Jaworski, F.B.; Tromberg, B.J.; Durkin, A.J. Review of short-wave infrared spectroscopy and imaging methods for biological tissue characterization. J. Biomed. Opt. 2015, 20, 030901. [Google Scholar] [CrossRef]
- Ribeiro, J.S.; Ferreira, M.M.C.; Salva, T.J.G. Chemometric models for the quantitative descriptive sensory analysis of Arabica coffee beverages using near infrared spectroscopy. Talanta 2011, 83, 1352–1358. [Google Scholar] [CrossRef]
- Monrroy, M.; GutiÉRrez, D.; Miranda, M.; HernÁNdez, K.; Garcia, J. Determination of brachiaria spp. forage quality by near-infrared spectroscopy and partial least squares regression. J. Chil. Chem. Soc. 2017, 62, 3472–3477. [Google Scholar] [CrossRef]
- Luna, A.S.; da Silva, A.P.; Pinho, J.S.A.; Ferré, J.; Boqué, R. Rapid characterization of transgenic and non-transgenic soybean oils by chemometric methods using NIR spectroscopy. Spectrochim. Acta Part A Mol. Biomol. Spectrosc. 2013, 100, 115–119. [Google Scholar] [CrossRef] [PubMed]
- He, J.; Zhang, C.; He, Y. Application of near-infrared hyperspectral imaging to detect sulfur dioxide residual in the Fritillaria thunbergii bulbus treated by sulfur fumigation. Appl. Sci. 2017, 7, 77. [Google Scholar] [CrossRef]
- Xu, L.; Sun, W.; Wu, C.; Ma, Y.; Chao, Z. Discrimination of trichosanthis fructus from different geographical origins using near infrared spectroscopy coupled with chemometric techniques. Molecules 2019, 24, 1550. [Google Scholar] [CrossRef] [PubMed]
- Gok, S.; Severcan, M.; Goormaghtigh, E.; Kandemir, I.; Severcan, F. Differentiation of anatolian honey samples from different botanical origins by ATR-FTIR spectroscopy using multivariate analysis. Food Chem. 2015, 170, 234–240. [Google Scholar] [CrossRef] [PubMed]
- Acquarelli, J.; van Laarhoven, T.; Gerretzen, J.; Tran, T.N.; Buydens, L.M.C.; Marchiori, E. Convolutional neural networks for vibrational spectroscopic data analysis. Anal. Chim. Acta 2017, 954, 22–31. [Google Scholar] [CrossRef] [PubMed]
- Liu, J.; Osadchy, M.; Ashton, L.; Foster, M.; Solomon, C.J.; Gibson, S.J. Deep convolutional neural networks for Raman spectrum recognition: A unified solution. Analyst 2017, 142, 4067–4074. [Google Scholar] [CrossRef] [Green Version]
- Ballabio, D.; Consonni, V. Classification tools in chemistry. Part 1: Linear models. PLS-DA. Anal. Methods 2013, 5, 3790–3798. [Google Scholar] [CrossRef]
- Yang, X.; Hong, H.; You, Z.; Cheng, F. Spectral and image integrated analysis of hyperspectral data for waxy corn seed variety classification. Sensors 2015, 15, 15578–15594. [Google Scholar] [CrossRef]
- Kong, W.; Zhang, C.; Liu, F.; Nie, P.; He, Y. Rice seed cultivar identification using near-infrared hyperspectral imaging and multivariate data analysis. Sensors 2013, 13, 8916–8927. [Google Scholar] [CrossRef]
- Wakholi, C.; Kandpal, L.M.; Lee, H.; Bae, H.; Park, E.; Kim, M.S.; Mo, C.; Lee, W.H.; Cho, B.-K. Rapid assessment of corn seed viability using short wave infrared line-scan hyperspectral imaging and chemometrics. Sens. Actuators B-Chem. 2018, 255, 498–507. [Google Scholar] [CrossRef]
- Chen, Y.; Lin, Z.; Zhao, X.; Wang, G.; Gu, Y. Deep learning-based classification of hyperspectral data. IEEE J. Sel. Top. Appl. Earth Obs. Remote Sens. 2014, 7, 2094–2107. [Google Scholar] [CrossRef]
- Kang, X.; Li, C.; Li, S.; Lin, H. Classification of hyperspectral images by gabor filtering based deep network. IEEE J. Sel. Top. Appl. Earth Obs. Remote Sens. 2018, 11, 1166–1178. [Google Scholar] [CrossRef]


| ID. | Variety | State | Origin | Supplier |
|---|---|---|---|---|
| 1 | TongRenTang | Flake | Zhejiang, China | Tongrentang (Sichuan) Health Pharmaceutical Co., Ltd. |
| 2 | MoYuan | Flake | Zhejiang, China | Anguo MedicineSource Trading Co., Ltd. |
| 3 | NiuEnTang | Flake | Zhejiang, China | Hebei NiuEntang Electronic Commerce Co., Ltd. |
| 4 | QiGuiTang | Flake | Zhejiang, China | Hebei Lingkang Trading Co., Ltd. |
| 5 | ZeXinTang | Flake | Zhejiang, China | Bozhou ZeXinTang Pharmaceutical Co., Ltd. |
| 6 | JiaQiTang | Flake | Zhejiang, China | Anguo Guangsheng Trading Co., Ltd. |
| 7 | FuXiTang | Flake | Zhejiang, China | Sichuan Haorui Gallium Biotechnology Co., Ltd. (Sichuan) |
| 8 | ZangXiTang | Flake | Zhejiang, China | Sichuan Zangxitang Biotechnology Co., Ltd. |
| 9 | NanBeiHang | Flake | Zhejiang, China | Guangzhou NanBeiHang Chinese Medicine Herb Co., Ltd. |
| 10 | ShenYue | Flake | Zhejiang, China | Tonghua Sanbao Ginseng Antler Trading Co., Ltd. |
| 11 | KangMei | Flake | Zhejiang, China | Kangmei Pharmaceutical Co., Ltd. (Guangdong) |
| 12 | YiLing | Flake | Zhejiang, China | Shijiazhuang Yiling Herbal Pieces Co., Ltd. |
| Models | Data Set | Precision (%) | Recall (%) | F-Score |
|---|---|---|---|---|
| CNN | Training | 0.9705 | 0.9688 | 0.9697 |
| Testing | 0.8988 | 0.8889 | 0.8938 | |
| SVM | Training | 0.9967 | 0.9965 | 0.9965 |
| Testing | 0.8010 | 0.7917 | 0.7963 | |
| PLS-DA | Training | 0.9267 | 0.9259 | 0.9263 |
| Testing | 0.8333 | 0.8194 | 0.8263 |
Publisher’s Note: MDPI stays neutral with regard to jurisdictional claims in published maps and institutional affiliations. |
© 2022 by the authors. Licensee MDPI, Basel, Switzerland. This article is an open access article distributed under the terms and conditions of the Creative Commons Attribution (CC BY) license (https://creativecommons.org/licenses/by/4.0/).
Share and Cite
Kabir, M.H.; Guindo, M.L.; Chen, R.; Liu, F.; Luo, X.; Kong, W. Deep Learning Combined with Hyperspectral Imaging Technology for Variety Discrimination of Fritillaria thunbergii. Molecules 2022, 27, 6042. https://doi.org/10.3390/molecules27186042
Kabir MH, Guindo ML, Chen R, Liu F, Luo X, Kong W. Deep Learning Combined with Hyperspectral Imaging Technology for Variety Discrimination of Fritillaria thunbergii. Molecules. 2022; 27(18):6042. https://doi.org/10.3390/molecules27186042
Chicago/Turabian StyleKabir, Muhammad Hilal, Mahamed Lamine Guindo, Rongqin Chen, Fei Liu, Xinmeng Luo, and Wenwen Kong. 2022. "Deep Learning Combined with Hyperspectral Imaging Technology for Variety Discrimination of Fritillaria thunbergii" Molecules 27, no. 18: 6042. https://doi.org/10.3390/molecules27186042