
Simultaneous Determination of Fourteen Marker Compounds in the Traditional Herbal Prescription, Geumgwesingihwan, Using Ultra-Performance Liquid Chromatography–Tandem Mass Spectrometry


Abstract
:1. Introduction
2. Results and Discussion
2.1. Selection of Marker Components for Simultaneous Analysis Using UPLC–MS/MS
2.2. Optimization of UPLC Operation Conditions and UPLC–MS/MS MRM Parameters for Simultaneous Analysis
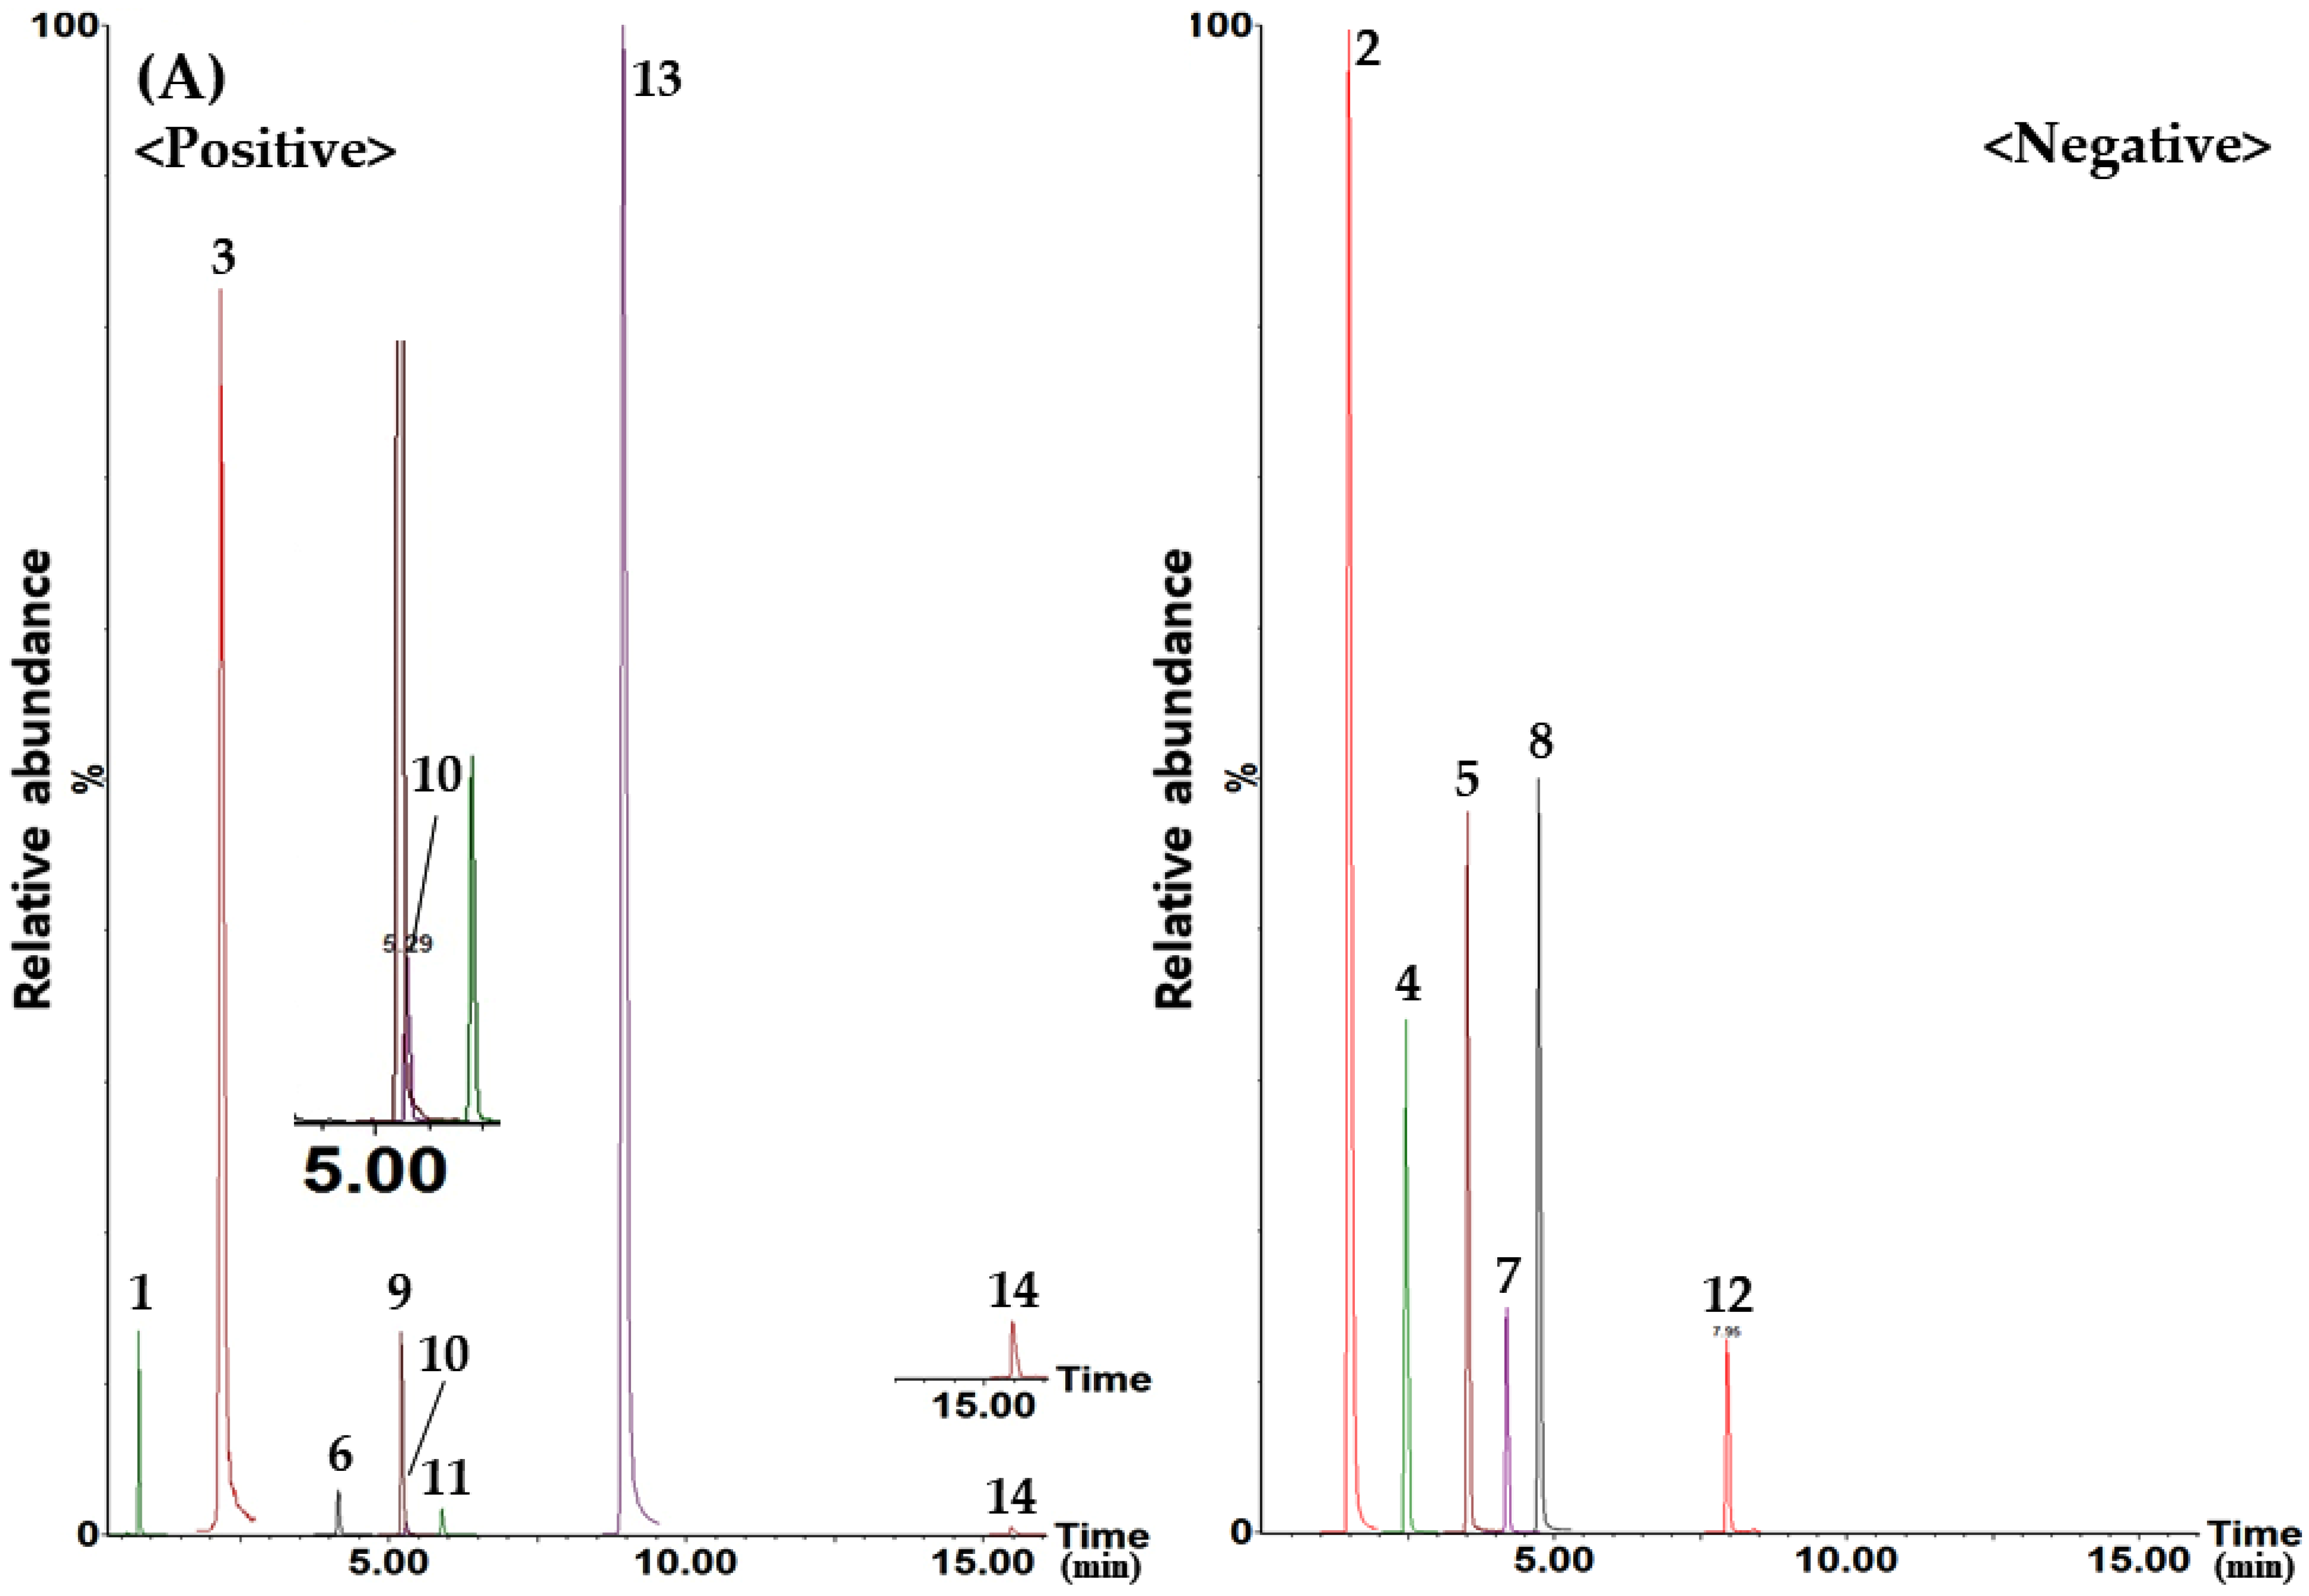
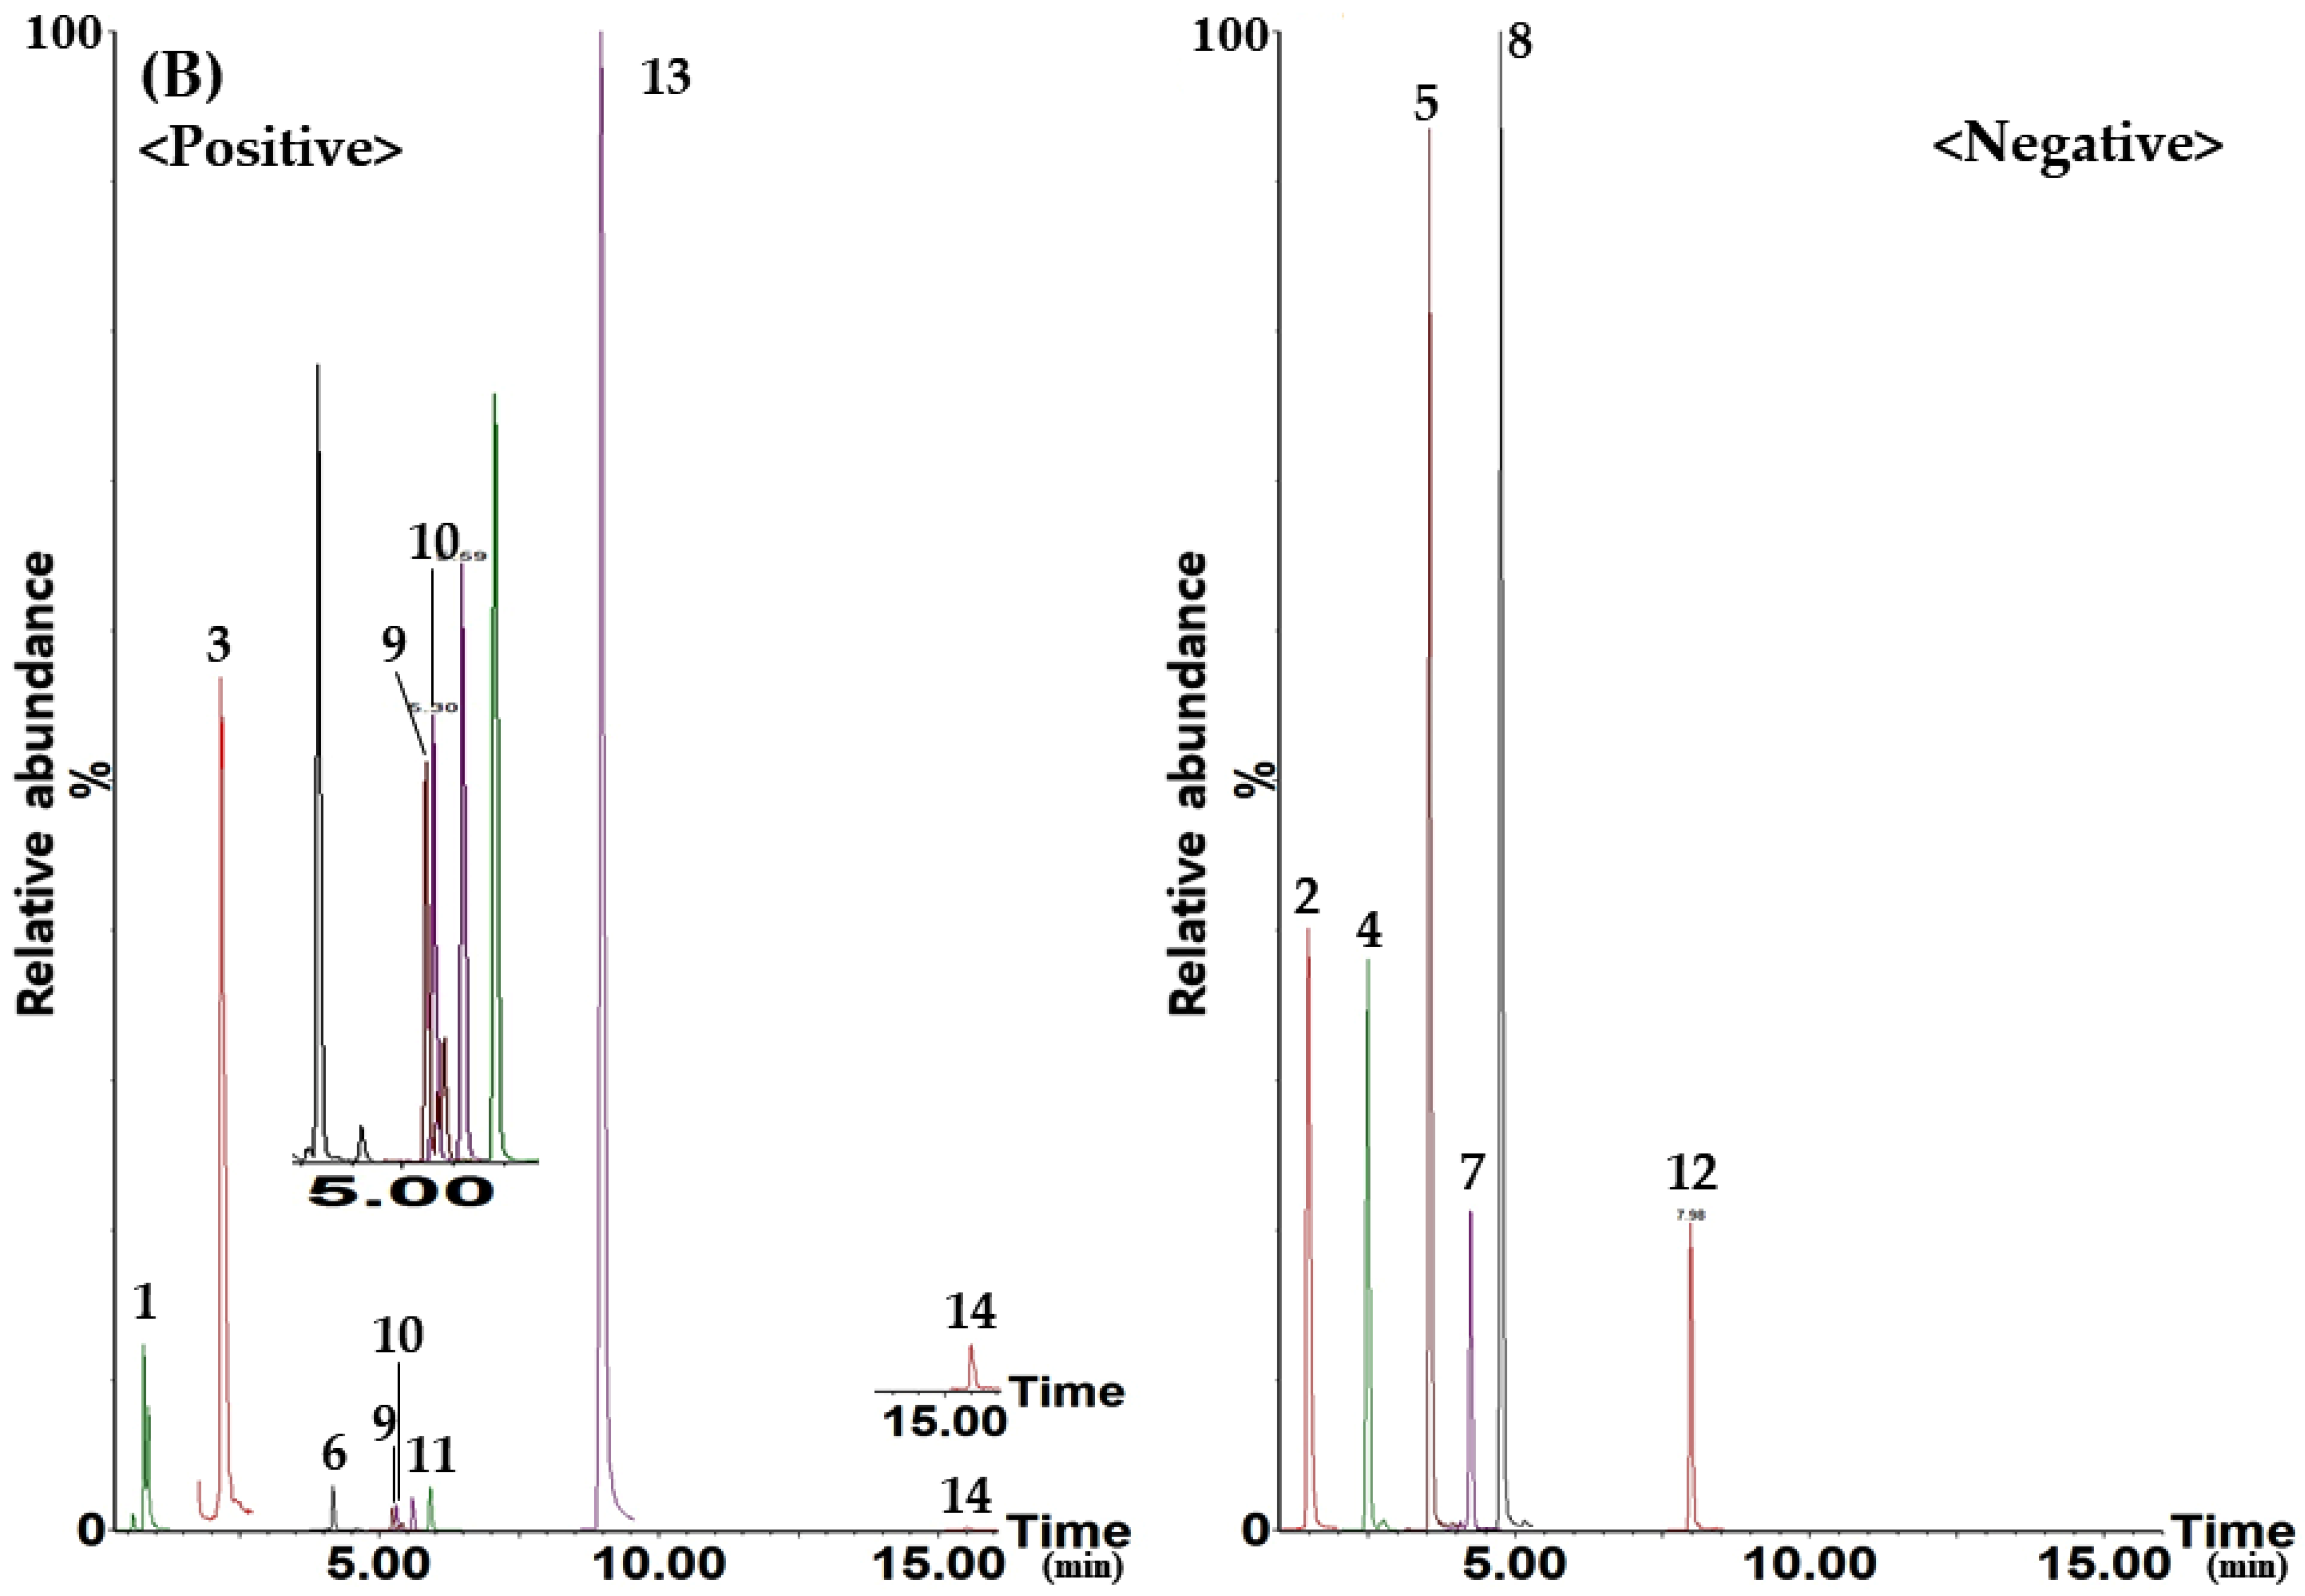
2.3. Identification of Each Marker Analyte for UPLC–MS/MS MRM Quantification
2.4. Method Validation of the Developed UPLC–MS/MS MRM Assay
2.5. Quantification of Compounds 1–14 in GSH Samples by UPLC–MS/MS MRM Assay
3. Materials and Methods
3.1. Plant Materials
3.2. Chemicals and Reagents
3.3. Preparation of GSH Water Extract
3.4. Preparation of Sample Solutions and Standard Solutions for UPLC–MS/MS MRM Analysis
3.5. UPLC–MS/MS MRM Analysis Conditions for Simultaneous Determination of the 14 Marker Analytes in GSH
3.6. Method Validation of the Established UPLC–MS/MS MRM Assay for Quality Control of GSH
4. Conclusions
Supplementary Materials
Author Contributions
Funding
Institutional Review Board Statement
Informed Consent Statement
Data Availability Statement
Conflicts of Interest
Sample Availability
References
- Mao, Q.; Xu, J.; Kong, M.; Shen, H.; Zhu, H.; Zhou, S.; Ki, S. LC–MS-based metabolomics in traditional Chinese medicines research: Personal experiences. Chin. Herb. Med. 2017, 9, 14–21. [Google Scholar] [CrossRef]
- Hwang, D.Y. Bangyakhappyeon; Yeokang Publishing Co.: Seoul, Korea, 1993; p. 112. [Google Scholar]
- Li, H.; Wu, C.; Liu, Y.; Zhang, S.; Gao, X. Baihe Zhimu formula attenuates the efficacy of tamoxifen against breast cancer in mice through modulation of CYP450 enzyme. BMC Complement. Altern. Med. 2019, 19, 240. [Google Scholar] [CrossRef] [PubMed] [Green Version]
- Kim, Y.J.; Jeong, S.J.; Seo, C.S.; Lim, H.S.; Sohn, E.; Yon, J.; Kim, B.Y. Simultaneous determination of the traditional herbal formula Ukgansan and the in vitro antioxidant activity of ferulic acid as an active compound. Molecules 2018, 23, 1659. [Google Scholar] [CrossRef] [PubMed] [Green Version]
- Shu, Y.; Chem, Y.; Qin, K.; Liu, X.; Cai, B. A study on the chemical compositions of the Yinquaosan (Lonicerae and Forsythiae powder) at different time of later-decoction by gas chromatography mass spectrometry. Pharmacogn. Mag. 2016, 12, 134–138. [Google Scholar]
- Shaw, L.H.; Chem, W.M.; Tsai, T.H. Identification of multiple ingredients for a traditional Chinese medicine preparation (Bu-yang-huan-wu-tang) by liquid chromatography coupled with tandem mass spectrometry. Molecules 2013, 18, 11281–11298. [Google Scholar] [CrossRef]
- Xu, L.; Shang, Z.; Tian, Y.; Xiong, M.; Nijat, D.; Wang, Y.; Qiao, X.; Ye, M. Chemical variations among Shengmaisan-based TCM patent drugs by ultra-high performance liquid chromatography coupled with hybrid quadrupole orbitrap mass spectrometry. Molecules 2021, 26, 4000. [Google Scholar] [CrossRef]
- Won, T.H.; Liao, L.; Kang, S.S.; Shin, J. Simultaneous analysis of furfural metabolites from Rehmanniae radix preparata by HPLC–DAD–ESI–MS. Food Chem. 2014, 142, 107–113. [Google Scholar] [CrossRef]
- Seo, C.S.; Huang, D.S.; Lee, J.K.; Ha, H.K.; Kim, H.K.; Seo, Y.B.; Shin, H.K. Quantitative determination of the marker constituent of Dioscoreae Rhizoma by the packaging methods. Kor. J. Herbol. 2008, 23, 45–49. [Google Scholar]
- Jiang, Y.; Chen, H.; Wang, L.; Zou, J.; Zheng, X.; Liu, Z. Quality evaluation of polar and active components in crude and processed Fucutus Corni by quantitative analysis of multicomponents with single marker. J. Anal. Methods Chem. 2016, 2016, 6496840. [Google Scholar] [CrossRef] [Green Version]
- Wu, L.F.; Wang, K.F.; Mao, X.; Liang, W.Y.; Chen, W.J.; Li, S.; Qi, Q.; Cui, Y.P.; Zhang, L.Z. Screening and analysis of the potential bioactive components of Poria cocos (Schw.) Wolf by HPLC and HPLC–MSn with the aid of chemometrics. Molecules 2016, 21, 227. [Google Scholar] [CrossRef] [Green Version]
- Xiao, C.; Wu, M.; Chen, Y.; Zhang, Y.; Zhao, X.; Zheng, X. Revealing metabolomic variations in Cortex Moutan from different root parts using HPLC–MS method. Phytochem. Anal. 2015, 26, 86–93. [Google Scholar] [CrossRef] [PubMed]
- Zhang, Y.W.; Li, Q.; Lv, C.X.; Liu, X.J.; Chen, X.H.; Bi, K.S. Simultaneous determination of four active components in Alisma orientale (Sam.) Juz. by HPLC–DAD using a single reference standard. J. Pharm. Anal. 2015, 5, 85–92. [Google Scholar] [CrossRef] [PubMed] [Green Version]
- Zhao, B.T.; Jeong, S.Y.; Moon, D.C.; Son, K.H.; Son, J.K.; Woo, M.H. High performance liquid chromatography used for quality control of Achyranthis Radix. Arch. Pharm. Res. 2012, 35, 1449–1455. [Google Scholar] [CrossRef]
- Wang, D.; Qi, M.; Yang, Q.; Tong, R.; Wang, R.; Bligh, S.W.A.; Yang, L.; Wang, Z. Comprehensive metabolite profiling of Plantaginis Semen using ultra high performance liquid chromatography with electrospray ionization quadrupole time-of-flight tandem mass spectrometry coupled with elevated energy technique. J. Sep. Sci. 2016, 39, 1842–1852. [Google Scholar] [CrossRef]
- Nam, D.H.; Son, K.H.; Kim, J.Y.; Kim, S.D.; Lim, S.K. Quantitative determination of dioscin from Dioscorea Rhizoma. Kor. J. Pharmacogn. 2006, 37, 33–36. [Google Scholar]
- Lee, H.; Lee, S.; Baek, J.Y.; Seo, C.S.; Yun, H.; Kim, S.N.; Kang, K.S.; Choi, Y.K. Estrogenic activity of ethyl gallate and its potential use in hormone replacement therapy. Bioorg. Med. Chem. Lett. 2021, 40, 127919. [Google Scholar] [CrossRef]
- Kim, B.H.; Park, K.S.; Chang, I.M. Elucidation of anti-inflammatory potencies of Eucommia ulmoides bark and Plantago asiatica seeds. J. Med. Food 2009, 12, 764–769. [Google Scholar] [CrossRef] [PubMed]
- Turner, R.; Stamp, L.K.; Kettle, A.J. Detection of allantoin in clinical samples using hydrophilic liquid chromatography with stable isotope dilution negative ion tandem mass spectrometry. J. Chromatogr. B Analyt. Technol. Biomed. Life Sci. 2012, 891–892, 85–89. [Google Scholar] [CrossRef]
- Jiang, M.; Zhou, M.; Han, Y.; Xing, L.; Zhao, H.; Dong, L.; Bai, G.; Luo, G. Identification of NF-κB inhibitors in Xuebijing injection for sepsis treatment based on bioactivity-integrated UPLC-Q/TOF. J. Ethnopharmacol. 2013, 147, 426–433. [Google Scholar] [CrossRef]
- Ye, J.; Zhang, X.; Dai, W.; Yan, S.; Huang, H.; Liang, X.; Li, Y.; Zhang, W. Chemical fingerprinting of Liuwei Dihuang Pill and simultaneous determination of its major bioactive constituents by HPLC coupled with multiple detections of DAD, ELSD and ESI-MS. J. Pharm. Biomed. Anal. 2009, 49, 638–645. [Google Scholar] [CrossRef]
- Bajpai, W.; Singh, A.; Chandra, P.; Negi, M.P.S.; Kumar, N.; Kumar, B. Analysis of phytochemical variations in dioecious Tinospora cordifolia stems using HPLC/QTOF MS/MS and UPLC/QqQLIT-MS/MS. Phytochem. Anal. 2016, 27, 92–99. [Google Scholar] [CrossRef] [PubMed]
- Peng, M.; Zhang, Y.; Shi, S.; Peng, S. Simultaneous ligand fishing and identification of human serum albumin binders from Eucommia ulmoides bark using surface plasmon resonance-high performance liquid chromatography-tandem mass spectrometry. J. Chromatogr. B 2013, 940, 86–93. [Google Scholar] [CrossRef] [PubMed]
- He, Q.; Hu, X.J.; Cheng, Y.Y. Analysis of ‘SHUANGDAN’ granules by high-performance liquid chromatography-diode array detection-electrospray ionization tandem mass spectrometry. J. Pharm. Biomed. Anal. 2006, 41, 485–492. [Google Scholar] [CrossRef] [PubMed]
- Fan, P.C.; Li, M.X.; Ma, H.P.; Jing, L.; Qiu, J.; Jia, Z.P. Simultaneous determination of four shanzhiside methylester derivatives in rabbit plasma by liquid chromatography/tandem mass spectrometry. Biomed. Chromatogr. 2012, 26, 1543–1551. [Google Scholar] [CrossRef] [PubMed]
- Li, Y.; Gan, L.; Li, G.Q.; Deng, L.; Zhang, X.; Deng, Y. Pharmacokinetics of plantamajoside and acteoside from Plantago asiatica in rats by liquid chromatography–mass spectrometry. J. Pharm. Biomed. Anal. 2014, 89, 251–256. [Google Scholar] [CrossRef] [PubMed]
- Ding, L.Q.; Qiu, T.Y.; Liu, Z.X.; Chen, L.X.; Oppong, M.B.; Zhang, D.Q.; Zhang, B.; Bai, G.; Qiu, F. Systematic characterization of the metabolites of paeonol in rats using ultra performance liquid chromatography coupled with electrospray ionization quadrupole time-of-flight tandem mass spectrometry with an integrative strategy. J. Chromatogr. B 2017, 1065–1066, 70–78. [Google Scholar] [CrossRef]
- Bujor, A.; Miron, A.; Luca, S.V.; Skalicka-Wozniak, K.; Silion, M.; Ancuceanu, R.; Dinu, M.; Girard, C.; Demougeot, C.; Totoson, P. Metabolite profiling, arginase inhibition and vasorelaxant activity of Cornus mas, Sorbus aucuparia and Viburnum opulus fruit extracts. Food Chem. Toxicol. 2019, 133, 110764. [Google Scholar] [CrossRef]
- Lee, K.H. The Dispensatory on the Visual and Organoleptic Examination of Herbal Medicine; National Institute of Food and Drug Safety Evaluation: Seoul, Korea, 2013; pp. 211–636. [Google Scholar]
- Seo, C.S.; Lee, M.Y. Simultaneous quantification of eight marker components in traditional herbal formula, Haepyoyijin-tang using HPLC–PDA. Appl. Sci. 2020, 10, 3888. [Google Scholar] [CrossRef]
- Seo, C.S.; Lee, M.Y. Quality assessment of Insamyangpye decoction by liquid chromatography tandem mass spectrometry multiple reaction monitoring. Processes 2021, 9, 831. [Google Scholar] [CrossRef]
- International Conference on Harmonization. Guidance for Industry: Q2B Validation of Analytical Procedures: Methodology; Food and Drug Administration: Rockville, MD, USA, 1996. [Google Scholar]


| Analyte | Ion Mode | Exact Mass (Da) | Precursor Ion (Q1, m/z) | Product Ion (Q3, m/z) | Cone Voltage (V) | Collision Energy (eV) | Retention Time (min) | Time Window (min) |
|---|---|---|---|---|---|---|---|---|
| 1 | + | 158.04 | 158.9 | 115.9 | 14 | 5 | 0.79 | 0.30–1.30 |
| 2 | − | 170.02 | 169.0 | 125.0 | 40 | 13 | 1.47 | 1.00–2.00 |
| 3 | + | 126.03 | 126.9 | 109.0 | 25 | 8 | 2.19 | 1.80–2.80 |
| 4 | − | 374.12 | 373.0 | 122.9 | 50 | 15 | 2.48 | 2.00–3.00 |
| 5 | − | 496.16 | 495.0 | 136.9 | 70 | 36 | 3.53 | 3.10–4.10 |
| 6 | + | 390.15 | 391.1 | 228.9 | 12 | 8 | 4.17 | 3.70–4.70 |
| 7 | − | 388.14 | 446.9 | 224.9 | 26 | 12 | 4.20 | 3.80–4.80 |
| 8 | − | 480.16 | 478.9 | 448.9 | 60 | 5 | 4.76 | 4.30–5.30 |
| 9 | + | 480.31 | 481.2 | 445.1 | 24 | 12 | 5.25 | 4.80–5.80 |
| 10 | + | 624.21 | 625.1 | 163.0 | 16 | 28 | 5.32 | 4.90–5.90 |
| 11 | + | 542.16 | 543.1 | 211.0 | 16 | 14 | 5.92 | 5.50–6.50 |
| 12 | − | 584.19 | 583.0 | 553.0 | 70 | 5 | 7.99 | 7.58–8.58 |
| 13 | + | 166.06 | 166.9 | 42.9 | 16 | 16 | 8.98 | 8.60–8.60 |
| 14 | + | 514.37 | 515.3 | 97.0 | 16 | 20 | 15.53 | 15.10–16.10 |
| Analyte | Linear Range (µg/L) | Regression Equation a y = ax + b | r2 | LOD (µg/L) | LOQ (µg/L) |
|---|---|---|---|---|---|
| 1 | 35.00–1400.00 | y = 197.40x + 715.28 | 0.9977 | 0.03 | 0.10 |
| 2 | 900.00–36,000.00 | y = 16.10x − 5046.77 | 0.9968 | 3.07 | 9.22 |
| 3 | 29.50–1180.00 | y = 688.83x + 12805.60 | 0.9925 | 5.13 | 15.40 |
| 4 | 30.00–1200.00 | y = 32.67x − 209.54 | 0.9997 | 0.01 | 0.03 |
| 5 | 35.00–1400.00 | y = 47.69x − 716.09 | 0.9979 | 0.65 | 1.95 |
| 6 | 80.00–3200.00 | y = 15.21x − 472.66 | 0.9962 | 2.63 | 7.88 |
| 7 | 3.00–120.00 | y = 117.72x − 220.62 | 0.9988 | 0.27 | 0.81 |
| 8 | 140.00–5600.00 | y = 17.49x − 260.54 | 0.9976 | 1.06 | 3.18 |
| 9 | 22.50–900.00 | y = 207.44x + 2194.41 | 0.9954 | 0.10 | 0.31 |
| 10 | 11.00–440.00 | y = 55.33x − 247.39 | 0.9992 | 0.26 | 0.79 |
| 11 | 15.00–600.00 | y = 97.19x − 310.13 | 0.9993 | 0.18 | 0.53 |
| 12 | 30.00–1200.00 | y = 19.28x − 61.53 | 0.9996 | 0.29 | 0.88 |
| 13 | 200.00–8000.00 | y = 777.86x − 987.75 | 0.9983 | 0.01 | 0.02 |
| 14 | 0.60–24.00 | y = 249.82x + 15.06 | 0.9905 | 0.18 | 0.54 |
| Analyte | Spiked Amount (µg/L) | Found Amount (µg/L) | Recovery (%) a | SD | CV (%) |
|---|---|---|---|---|---|
| 1 | 733.35 | 674.53 | 91.98 | 5.11 | 0.76 |
| 883.35 | 808.81 | 91.56 | 17.10 | 2.11 | |
| 1033.35 | 941.72 | 91.13 | 27.21 | 2.89 | |
| 2 | 11,206.90 | 13,407.94 | 119.64 | 196.05 | 1.46 |
| 21,206.90 | 23,164.32 | 109.23 | 74.13 | 0.32 | |
| 31,206.90 | 32,056.30 | 102.72 | 80.22 | 0.25 | |
| 3 | 504.65 | 451.45 | 89.46 | 24.17 | 5.35 |
| 799.65 | 932.21 | 116.58 | 45.37 | 4.87 | |
| 1094.65 | 1279.31 | 116.87 | 41.54 | 3.25 | |
| 4 | 471.05 | 514.32 | 109.19 | 8.33 | 1.62 |
| 771.05 | 815.69 | 105.79 | 34.82 | 4.27 | |
| 1071.05 | 1140.28 | 106.46 | 12.50 | 1.10 | |
| 5 | 703.75 | 760.04 | 108.00 | 9.89 | 1.30 |
| 1053.75 | 1171.82 | 111.21 | 17.59 | 1.50 | |
| 1403.75 | 1622.10 | 115.56 | 28.16 | 1.74 | |
| 6 | 1634.27 | 1712.97 | 104.82 | 22.09 | 1.29 |
| 2434.27 | 2517.14 | 103.40 | 102.05 | 4.05 | |
| 3234.27 | 3402.03 | 105.19 | 130.06 | 3.82 | |
| 7 | 79.57 | 79.23 | 99.58 | 0.68 | 0.86 |
| 119.57 | 119.56 | 99.99 | 4.52 | 3.78 | |
| 159.57 | 164.90 | 103.34 | 0.48 | 0.29 | |
| 8 | 2813.95 | 3274.32 | 116.36 | 45.32 | 1.38 |
| 4213.95 | 4667.37 | 110.76 | 110.34 | 2.36 | |
| 5613.95 | 5962.55 | 106.21 | 171.33 | 2.87 | |
| 9 | 263.27 | 282.25 | 107.21 | 8.34 | 2.95 |
| 488.27 | 521.97 | 106.90 | 23.10 | 4.43 | |
| 713.27 | 699.62 | 98.09 | 63.32 | 9.05 | |
| 10 | 237.67 | 233.55 | 98.27 | 3.09 | 1.33 |
| 347.67 | 316.93 | 91.16 | 12.72 | 4.01 | |
| 457.67 | 378.21 | 82.64 | 4.97 | 1.31 | |
| 11 | 278.00 | 252.58 | 90.86 | 5.41 | 2.14 |
| 428.00 | 354.77 | 82.89 | 13.05 | 3.68 | |
| 578.00 | 443.05 | 76.65 | 7.83 | 1.77 | |
| 12 | 588.50 | 681.32 | 115.77 | 11.10 | 1.63 |
| 888.50 | 1037.52 | 116.77 | 32.56 | 3.14 | |
| 1188.50 | 1420.09 | 119.49 | 19.36 | 1.35 | |
| 13 | 3944.38 | 4257.84 | 107.95 | 31.19 | 0.73 |
| 5944.38 | 6278.03 | 105.61 | 130.85 | 2.08 | |
| 7944.38 | 8211.59 | 103.36 | 25.12 | 0.31 | |
| 14 | 12.48 | 13.01 | 104.22 | 0.32 | 2.42 |
| 24.24 | 24.40 | 100.64 | 0.84 | 3.45 | |
| 39.12 | 35.72 | 91.32 | 1.02 | 2.86 |
| Analyte | Conc. (µg/L) | Intra-Day | Inter-Day | ||||
|---|---|---|---|---|---|---|---|
| Observed Conc. (µg/L) | Precision (CV, %) | Accuracy (%) | Observed Conc. (µg/L) | Precision (CV, %) | Accuracy (%) | ||
| 1 | 175.00 | 160.66 | 1.51 | 91.80 | 177.43 | 9.91 | 101.39 |
| 350.00 | 373.88 | 1.82 | 106.82 | 374.08 | 1.90 | 106.88 | |
| 700.00 | 725.69 | 1.87 | 103.67 | 710.82 | 5.77 | 101.55 | |
| 2 | 9000.00 | 9593.69 | 1.72 | 106.60 | 8130.41 | 2.22 | 90.34 |
| 18,000.00 | 16,350.19 | 2.65 | 90.83 | 17,764.99 | 2.39 | 98.69 | |
| 27,000.00 | 26,606.21 | 0.72 | 98.54 | 27,000.40 | 4.17 | 100.00 | |
| 3 | 1475.00 | 1506.92 | 2.24 | 102.16 | 1524.46 | 7.64 | 103.35 |
| 2950.00 | 2997.51 | 8.55 | 101.61 | 3165.14 | 8.74 | 107.29 | |
| 5900.00 | 5759.22 | 3.03 | 97.61 | 6098.16 | 7.40 | 103.36 | |
| 4 | 150.00 | 158.36 | 3.99 | 105.57 | 153.14 | 5.12 | 102.10 |
| 300.00 | 315.64 | 2.48 | 105.21 | 310.71 | 2.91 | 103.57 | |
| 600.00 | 609.36 | 2.25 | 101.56 | 604.61 | 2.51 | 100.77 | |
| 5 | 175.00 | 166.42 | 4.69 | 95.10 | 167.33 | 1.72 | 95.62 |
| 350.00 | 341.86 | 7.72 | 97.68 | 341.00 | 2.68 | 97.43 | |
| 700.00 | 677.57 | 1.61 | 96.80 | 672.49 | 1.21 | 96.07 | |
| 6 | 400.00 | 405.00 | 3.49 | 101.25 | 399.32 | 6.04 | 99.83 |
| 800.00 | 803.91 | 1.60 | 100.49 | 818.92 | 6.90 | 102.36 | |
| 1600.00 | 1598.20 | 1.30 | 99.89 | 1545.80 | 4.49 | 96.61 | |
| 7 | 15.00 | 15.34 | 6.91 | 102.29 | 14.89 | 5.57 | 99.24 |
| 30.00 | 31.21 | 2.17 | 104.02 | 30.45 | 6.04 | 101.50 | |
| 60.00 | 60.71 | 2.61 | 101.18 | 59.19 | 1.53 | 98.66 | |
| 8 | 700.00 | 655.24 | 1.03 | 93.61 | 711.55 | 7.71 | 101.65 |
| 1400.00 | 1493.31 | 0.72 | 106.67 | 1502.72 | 0.72 | 107.34 | |
| 2800.00 | 2874.30 | 0.84 | 102.65 | 2795.28 | 5.05 | 99.83 | |
| 9 | 112.50 | 106.09 | 2.50 | 94.31 | 120.33 | 3.36 | 106.96 |
| 225.00 | 237.78 | 2.02 | 105.68 | 245.79 | 1.85 | 109.24 | |
| 450.00 | 456.85 | 3.31 | 101.52 | 449.38 | 7.08 | 99.86 | |
| 10 | 75.00 | 77.81 | 2.13 | 103.75 | 73.52 | 3.86 | 98.02 |
| 150.00 | 143.57 | 2.50 | 95.71 | 153.20 | 8.10 | 102.13 | |
| 300.00 | 300.86 | 0.17 | 100.29 | 298.44 | 1.18 | 99.48 | |
| 11 | 75.00 | 68.19 | 0.73 | 90.92 | 77.19 | 5.71 | 102.92 |
| 150.00 | 143.60 | 1.24 | 95.73 | 155.04 | 2.65 | 103.36 | |
| 300.00 | 290.52 | 2.16 | 96.84 | 300.37 | 2.35 | 100.12 | |
| 12 | 150.00 | 157.77 | 1.47 | 105.18 | 156.51 | 0.19 | 104.34 |
| 300.00 | 316.03 | 2.60 | 105.34 | 306.18 | 0.74 | 102.06 | |
| 600.00 | 612.99 | 0.74 | 102.17 | 595.89 | 1.12 | 99.32 | |
| 13 | 1000.00 | 957.04 | 1.14 | 95.70 | 1019.41 | 7.79 | 101.94 |
| 2000.00 | 2070.86 | 1.21 | 103.54 | 2127.56 | 1.21 | 106.38 | |
| 4000.00 | 4097.28 | 0.98 | 102.43 | 4010.78 | 3.80 | 100.27 | |
| 14 | 6.00 | 5.65 | 5.98 | 94.22 | 5.79 | 5.87 | 96.56 |
| 12.00 | 12.01 | 5.23 | 100.06 | 11.33 | 6.49 | 94.39 | |
| 18.00 | 17.94 | 0.46 | 99.67 | 18.18 | 2.55 | 101.02 | |
| Analyte | GSH–1 a | GSH–2 | Source b | ||||
|---|---|---|---|---|---|---|---|
| Mean (mg/kg) | SD | CV (%) | Mean (mg/kg) | SD | CV (%) | ||
| 1 | 1162.07 | 24.00 | 2.07 | 1183.52 | 9.42 | 0.80 | DJ |
| 2 | 2404.19 | 62.35 | 2.59 | 1152.41 | 13.78 | 1.20 | CO |
| 3 | 3489.64 | 214.43 | 6.14 | 4126.28 | 393.28 | 9.53 | RG |
| 4 | 340.71 | 2.53 | 0.74 | 573.31 | 0.94 | 0.16 | PA |
| 5 | 704.68 | 9.47 | 1.34 | 464.09 | 1.38 | 0.30 | PS |
| 6 | 1661.91 | 82.90 | 4.99 | 1521.40 | 86.36 | 5.68 | CO |
| 7 | 78.81 | 3.04 | 3.86 | 80.72 | 2.06 | 2.56 | PA |
| 8 | 2816.66 | 78.32 | 2.78 | 2108.67 | 80.24 | 3.81 | PS |
| 9 | 76.23 | 1.07 | 1.41 | 399.93 | 6.53 | 1.63 | AB |
| 10 | 254.32 | 6.24 | 2.45 | 202.42 | 4.76 | 2.35 | PA |
| 11 | 254.97 | 4.38 | 1.72 | 193.73 | 2.88 | 1.49 | CO |
| 12 | 574.69 | 17.90 | 3.12 | 348.49 | 2.87 | 0.82 | PS |
| 13 | 3873.26 | 48.08 | 1.24 | 1087.89 | 5.88 | 0.54 | PS |
| 14 | 6.94 | 0.48 | 6.97 | 15.97 | 0.38 | 2.40 | AO |
Publisher’s Note: MDPI stays neutral with regard to jurisdictional claims in published maps and institutional affiliations. |
© 2022 by the authors. Licensee MDPI, Basel, Switzerland. This article is an open access article distributed under the terms and conditions of the Creative Commons Attribution (CC BY) license (https://creativecommons.org/licenses/by/4.0/).
Share and Cite
Seo, C.-S.; Lee, M.-Y. Simultaneous Determination of Fourteen Marker Compounds in the Traditional Herbal Prescription, Geumgwesingihwan, Using Ultra-Performance Liquid Chromatography–Tandem Mass Spectrometry. Molecules 2022, 27, 3890. https://doi.org/10.3390/molecules27123890
Seo C-S, Lee M-Y. Simultaneous Determination of Fourteen Marker Compounds in the Traditional Herbal Prescription, Geumgwesingihwan, Using Ultra-Performance Liquid Chromatography–Tandem Mass Spectrometry. Molecules. 2022; 27(12):3890. https://doi.org/10.3390/molecules27123890
Chicago/Turabian StyleSeo, Chang-Seob, and Mee-Young Lee. 2022. "Simultaneous Determination of Fourteen Marker Compounds in the Traditional Herbal Prescription, Geumgwesingihwan, Using Ultra-Performance Liquid Chromatography–Tandem Mass Spectrometry" Molecules 27, no. 12: 3890. https://doi.org/10.3390/molecules27123890