
Modulating Properties of Piroxicam, Meloxicam and Oxicam Analogues against Macrophage-Associated Chemokines in Colorectal Cancer

 , , , ,
Abstract
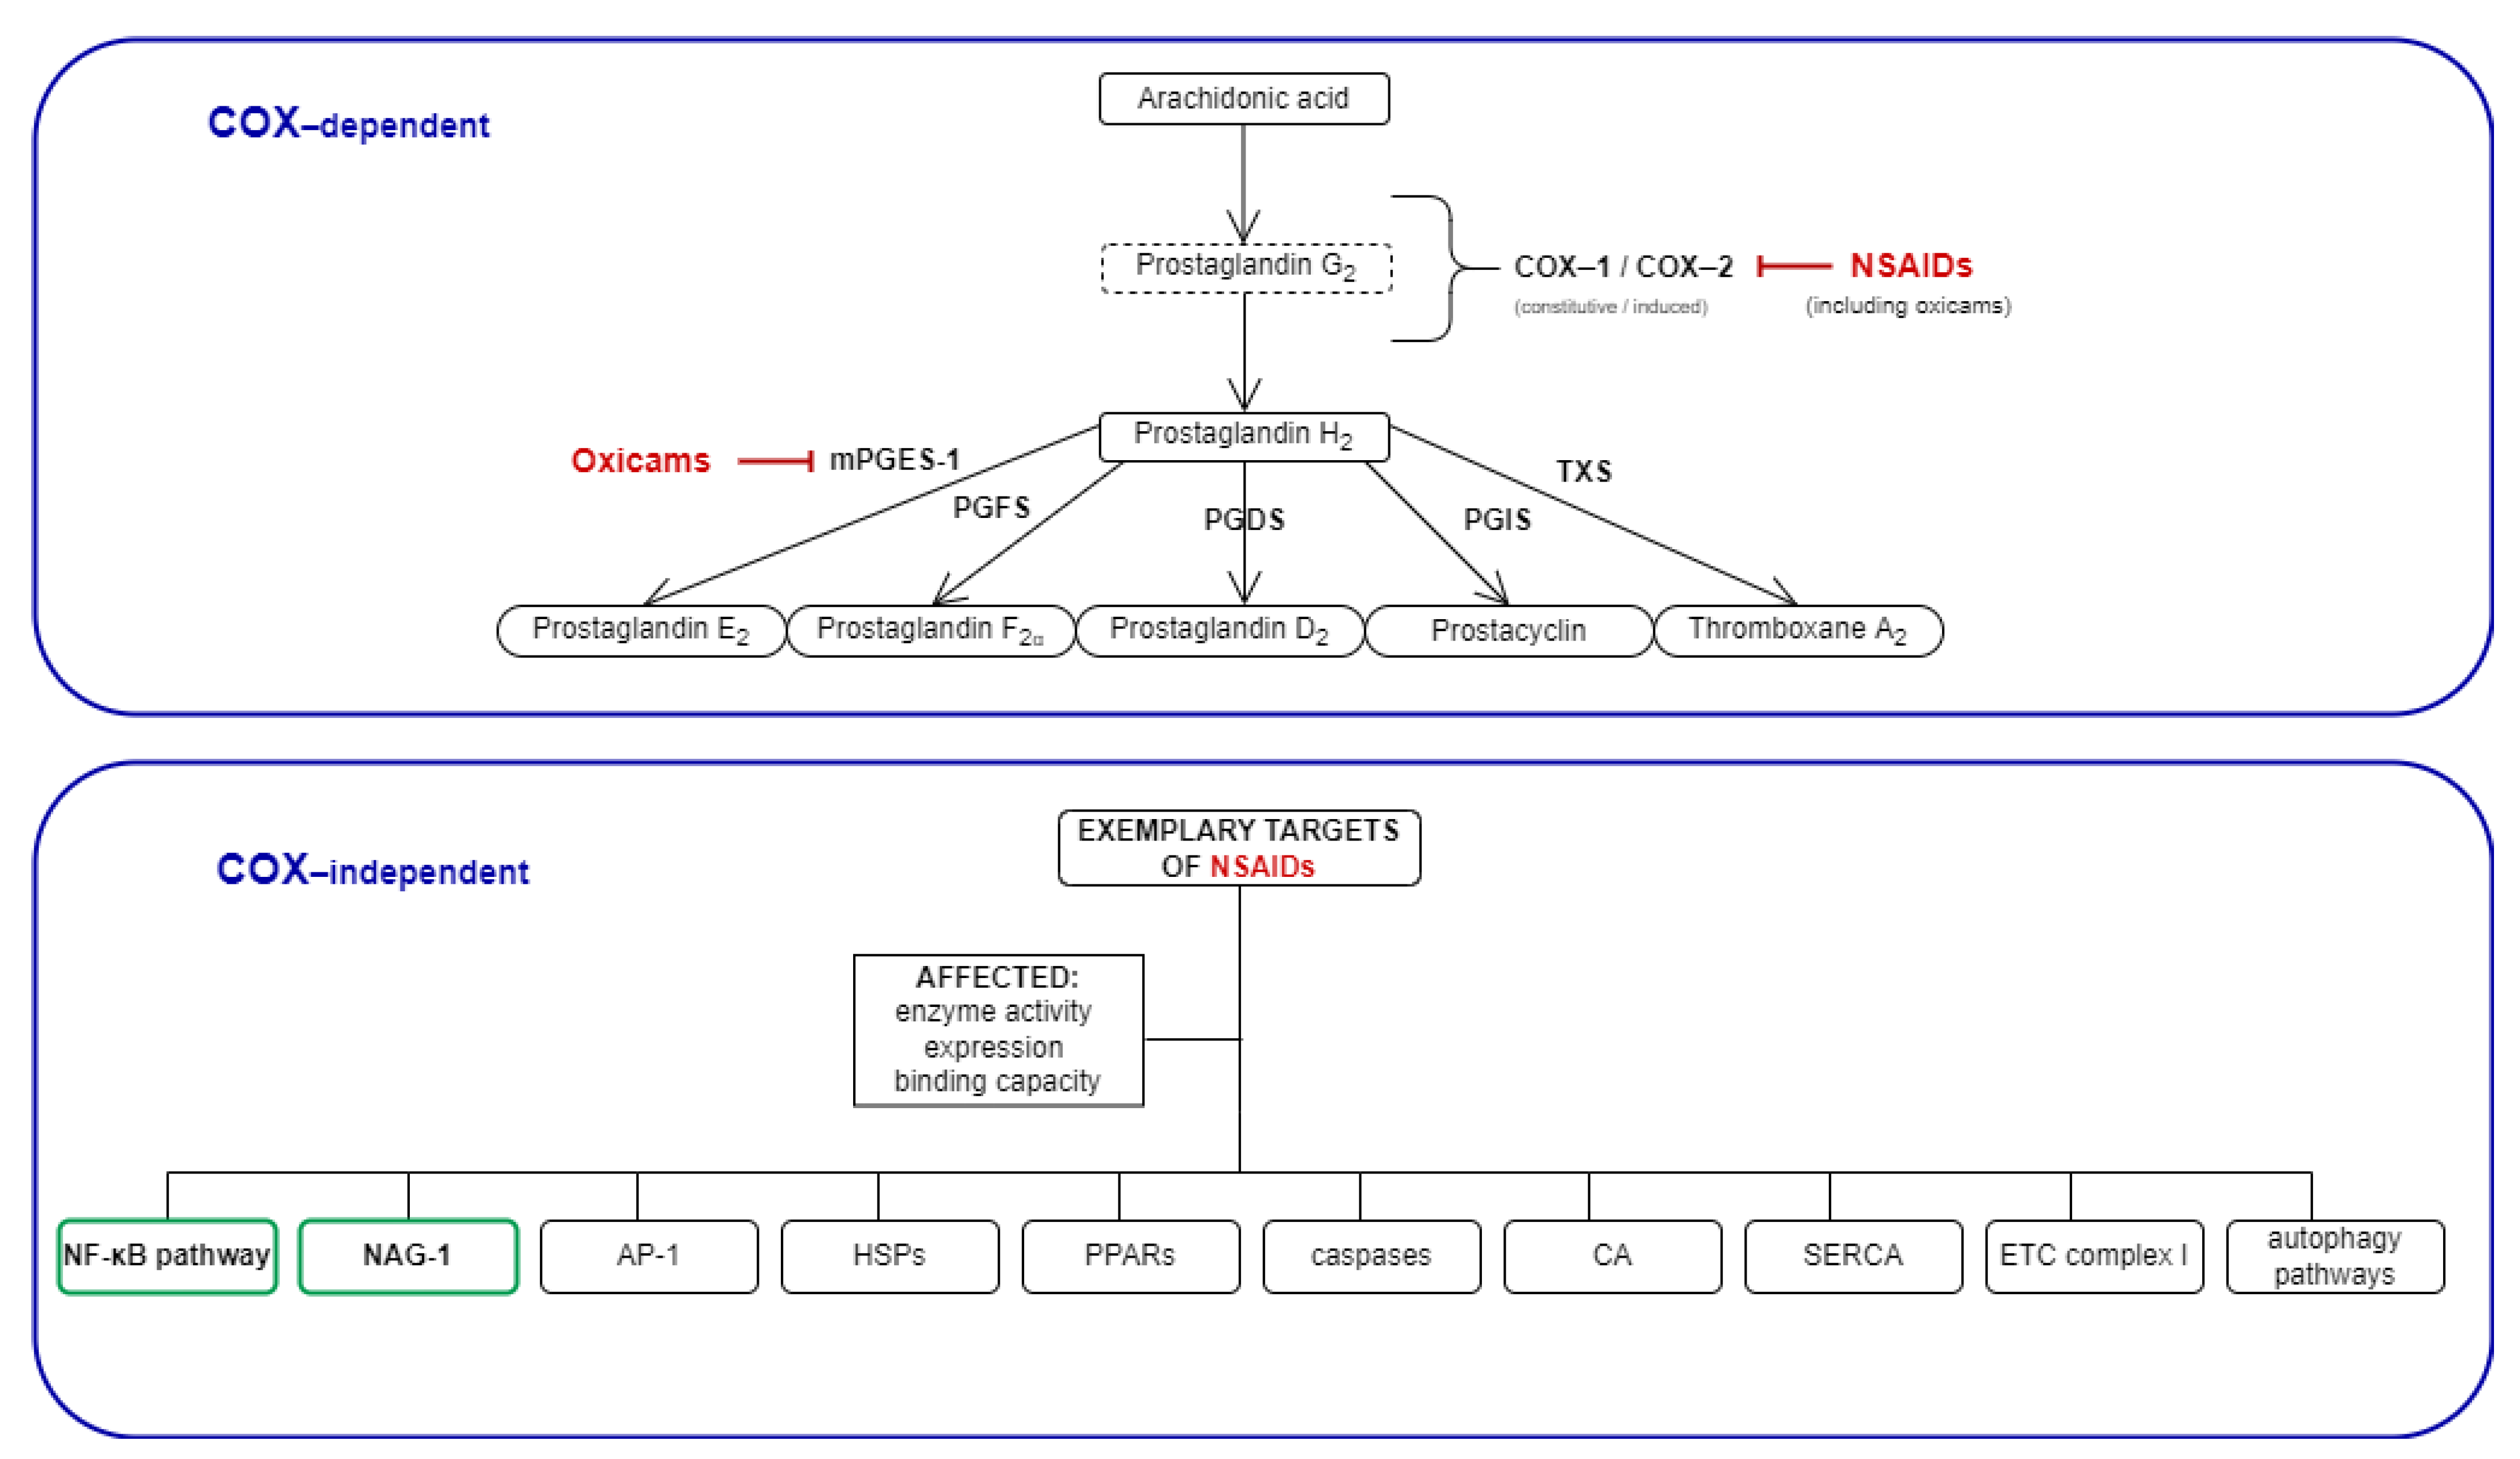
:1. Introduction
2. Results
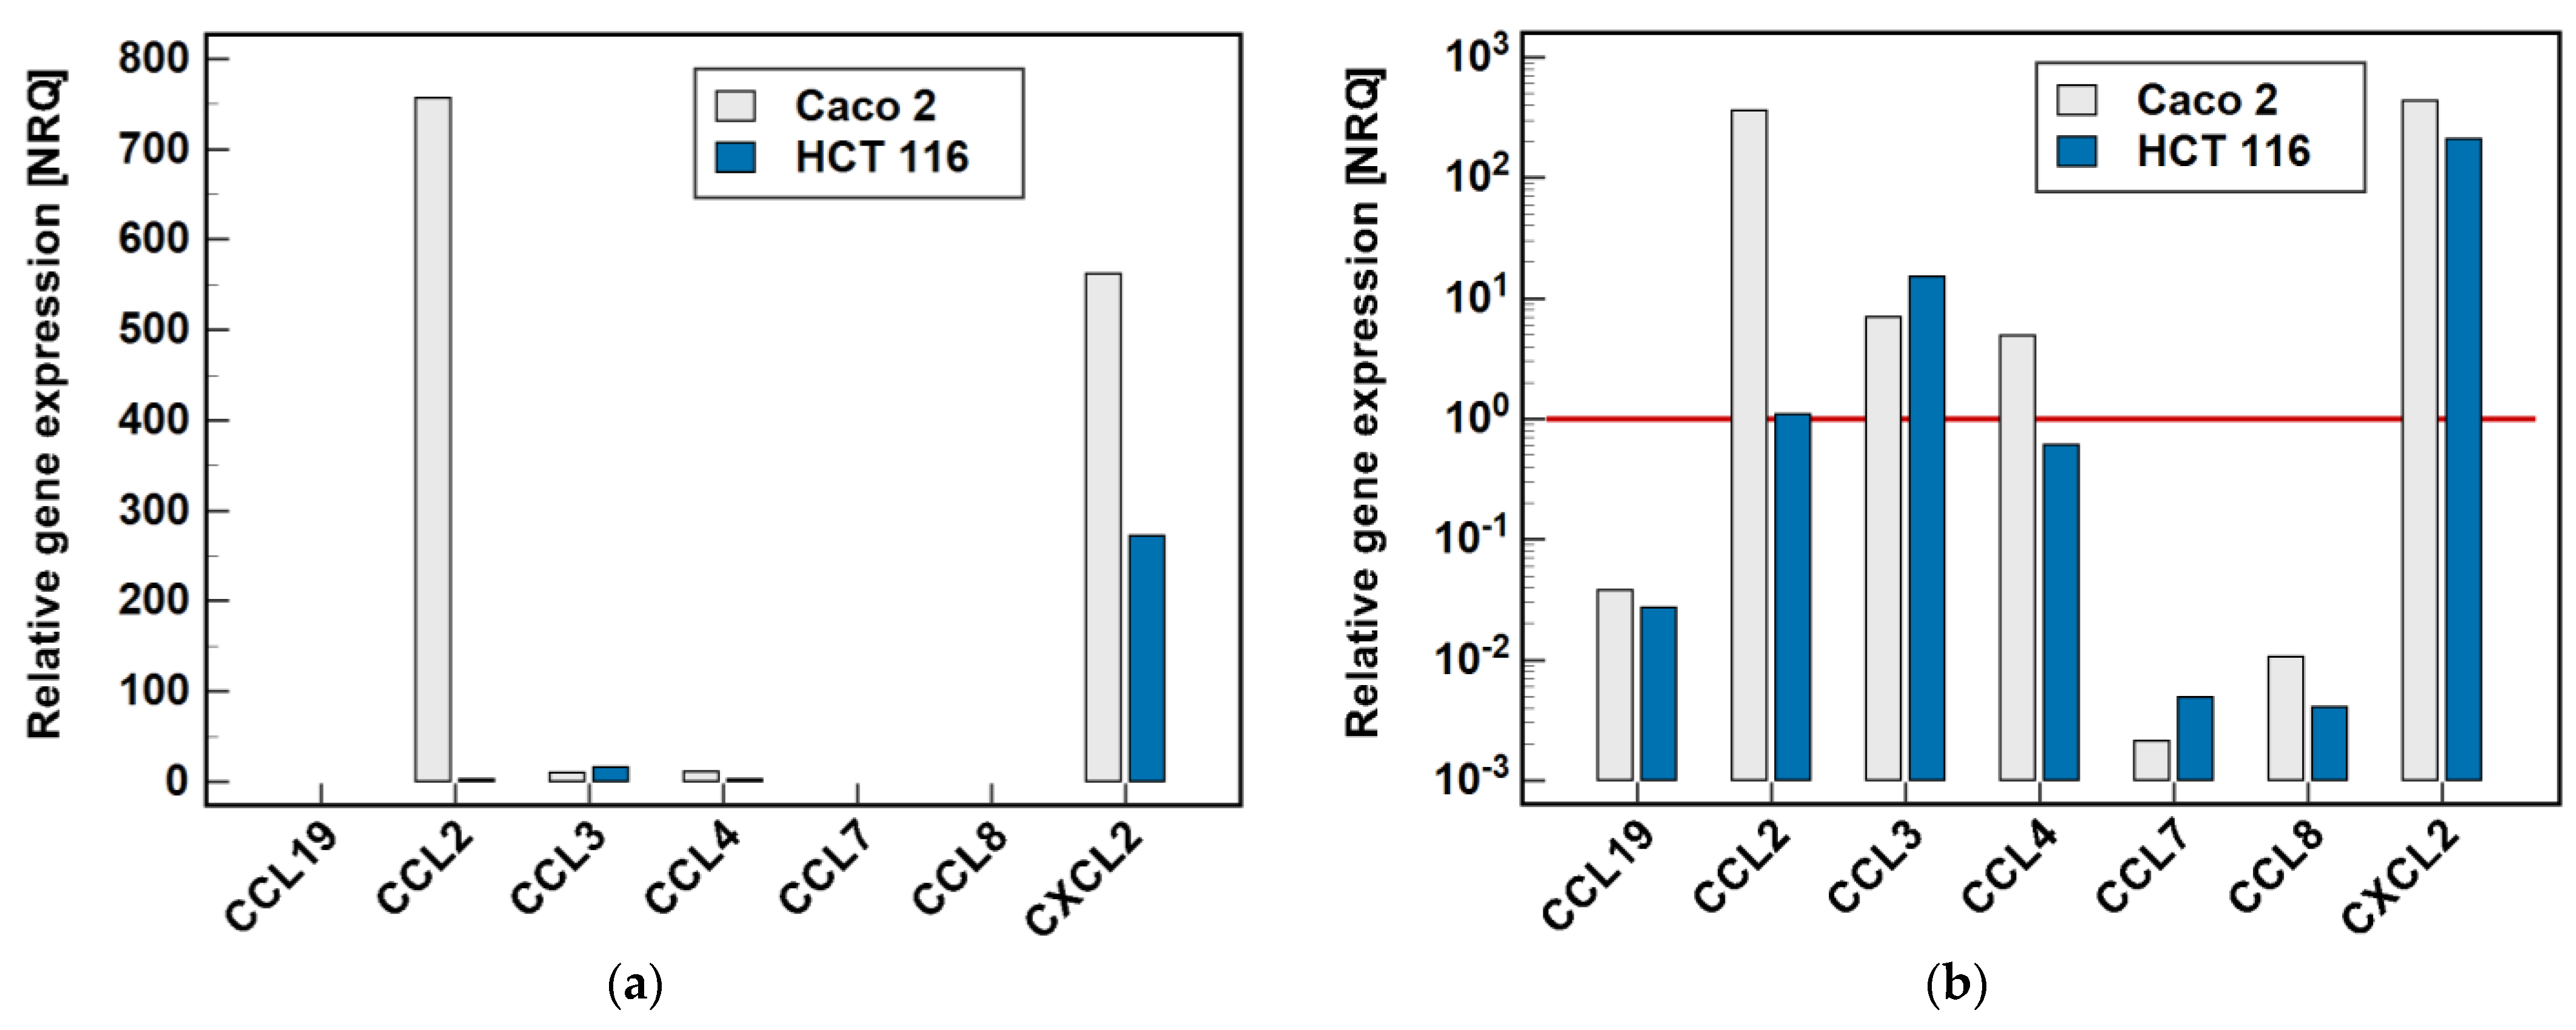
2.1. MCP and MIP Expression in Colonic Adenocarcinoma Cell Lines
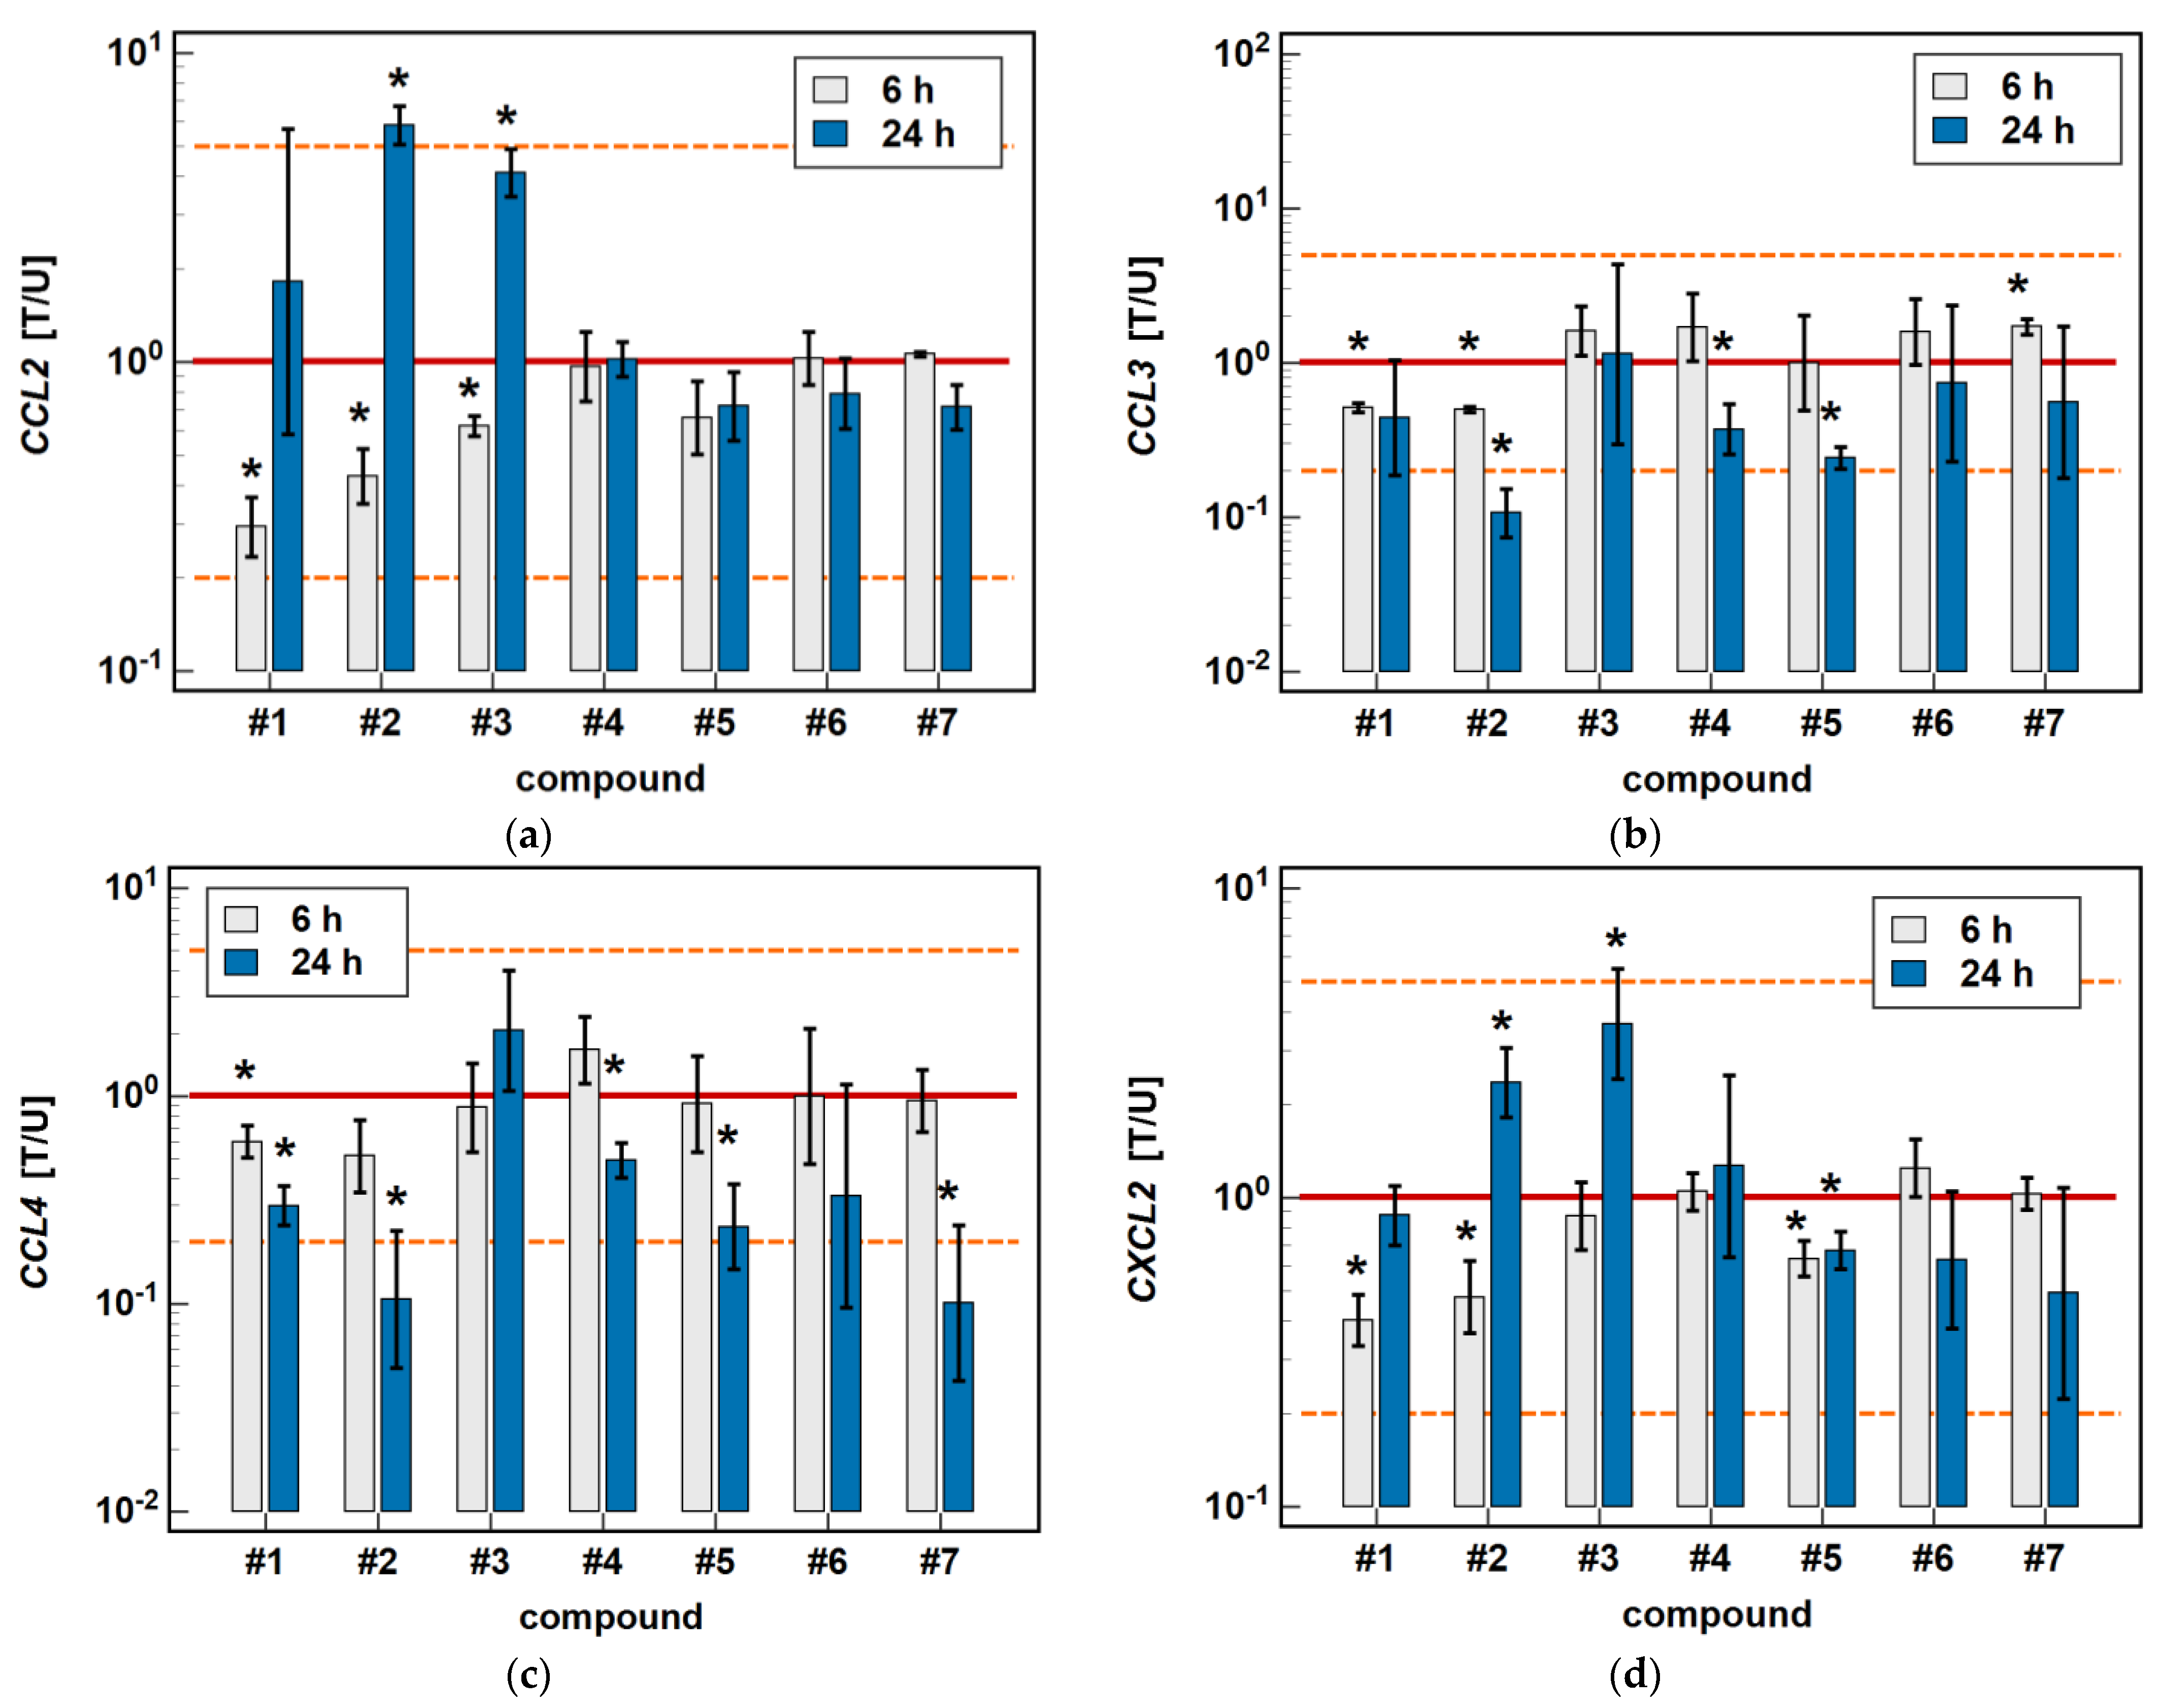
2.2. Effect of Oxicams on MCP and MIP Expression in Colonic Adenocarcinoma Cell Lines
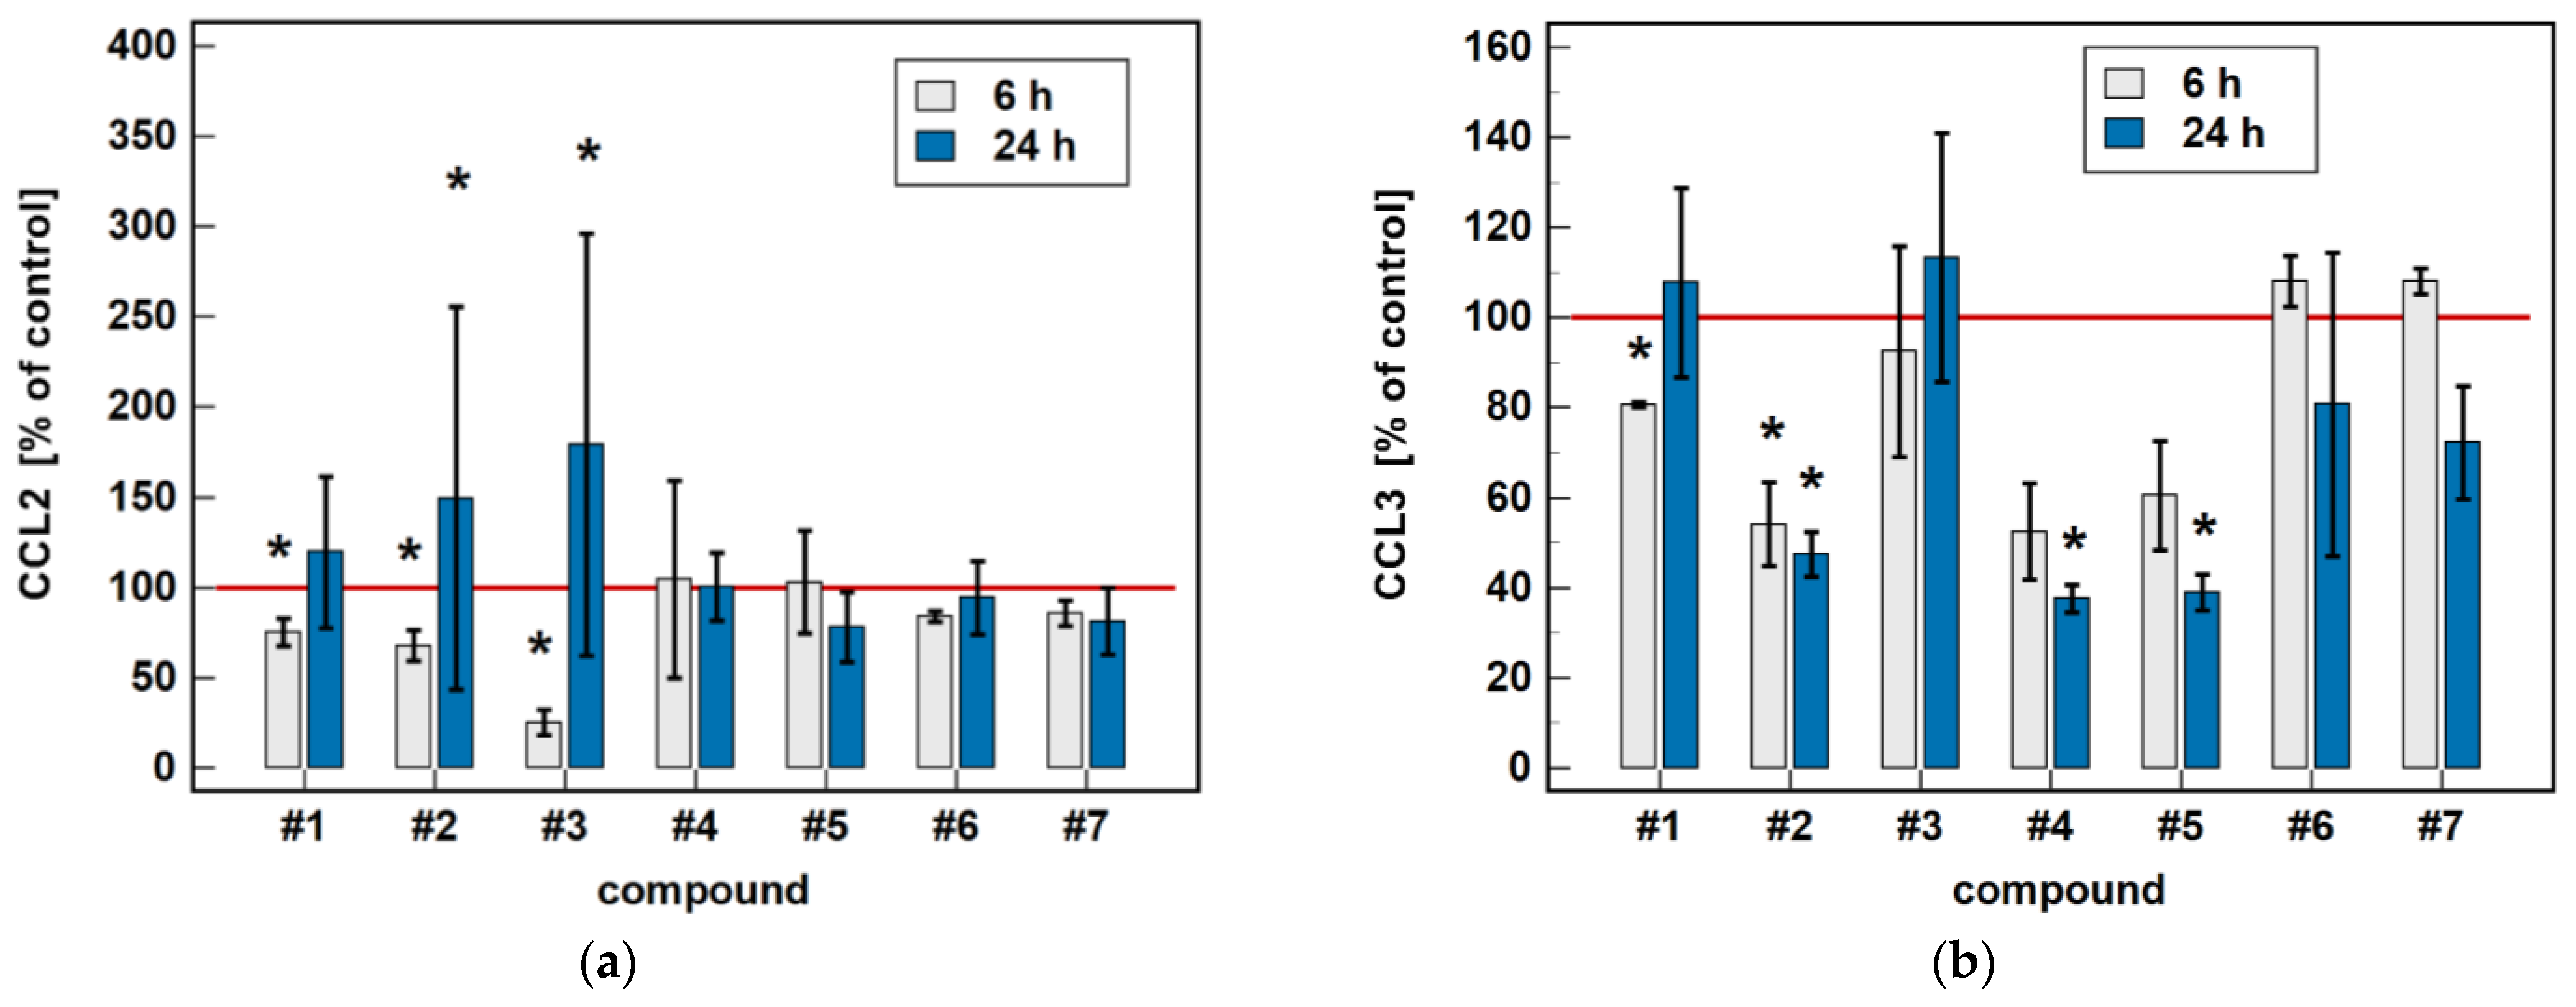
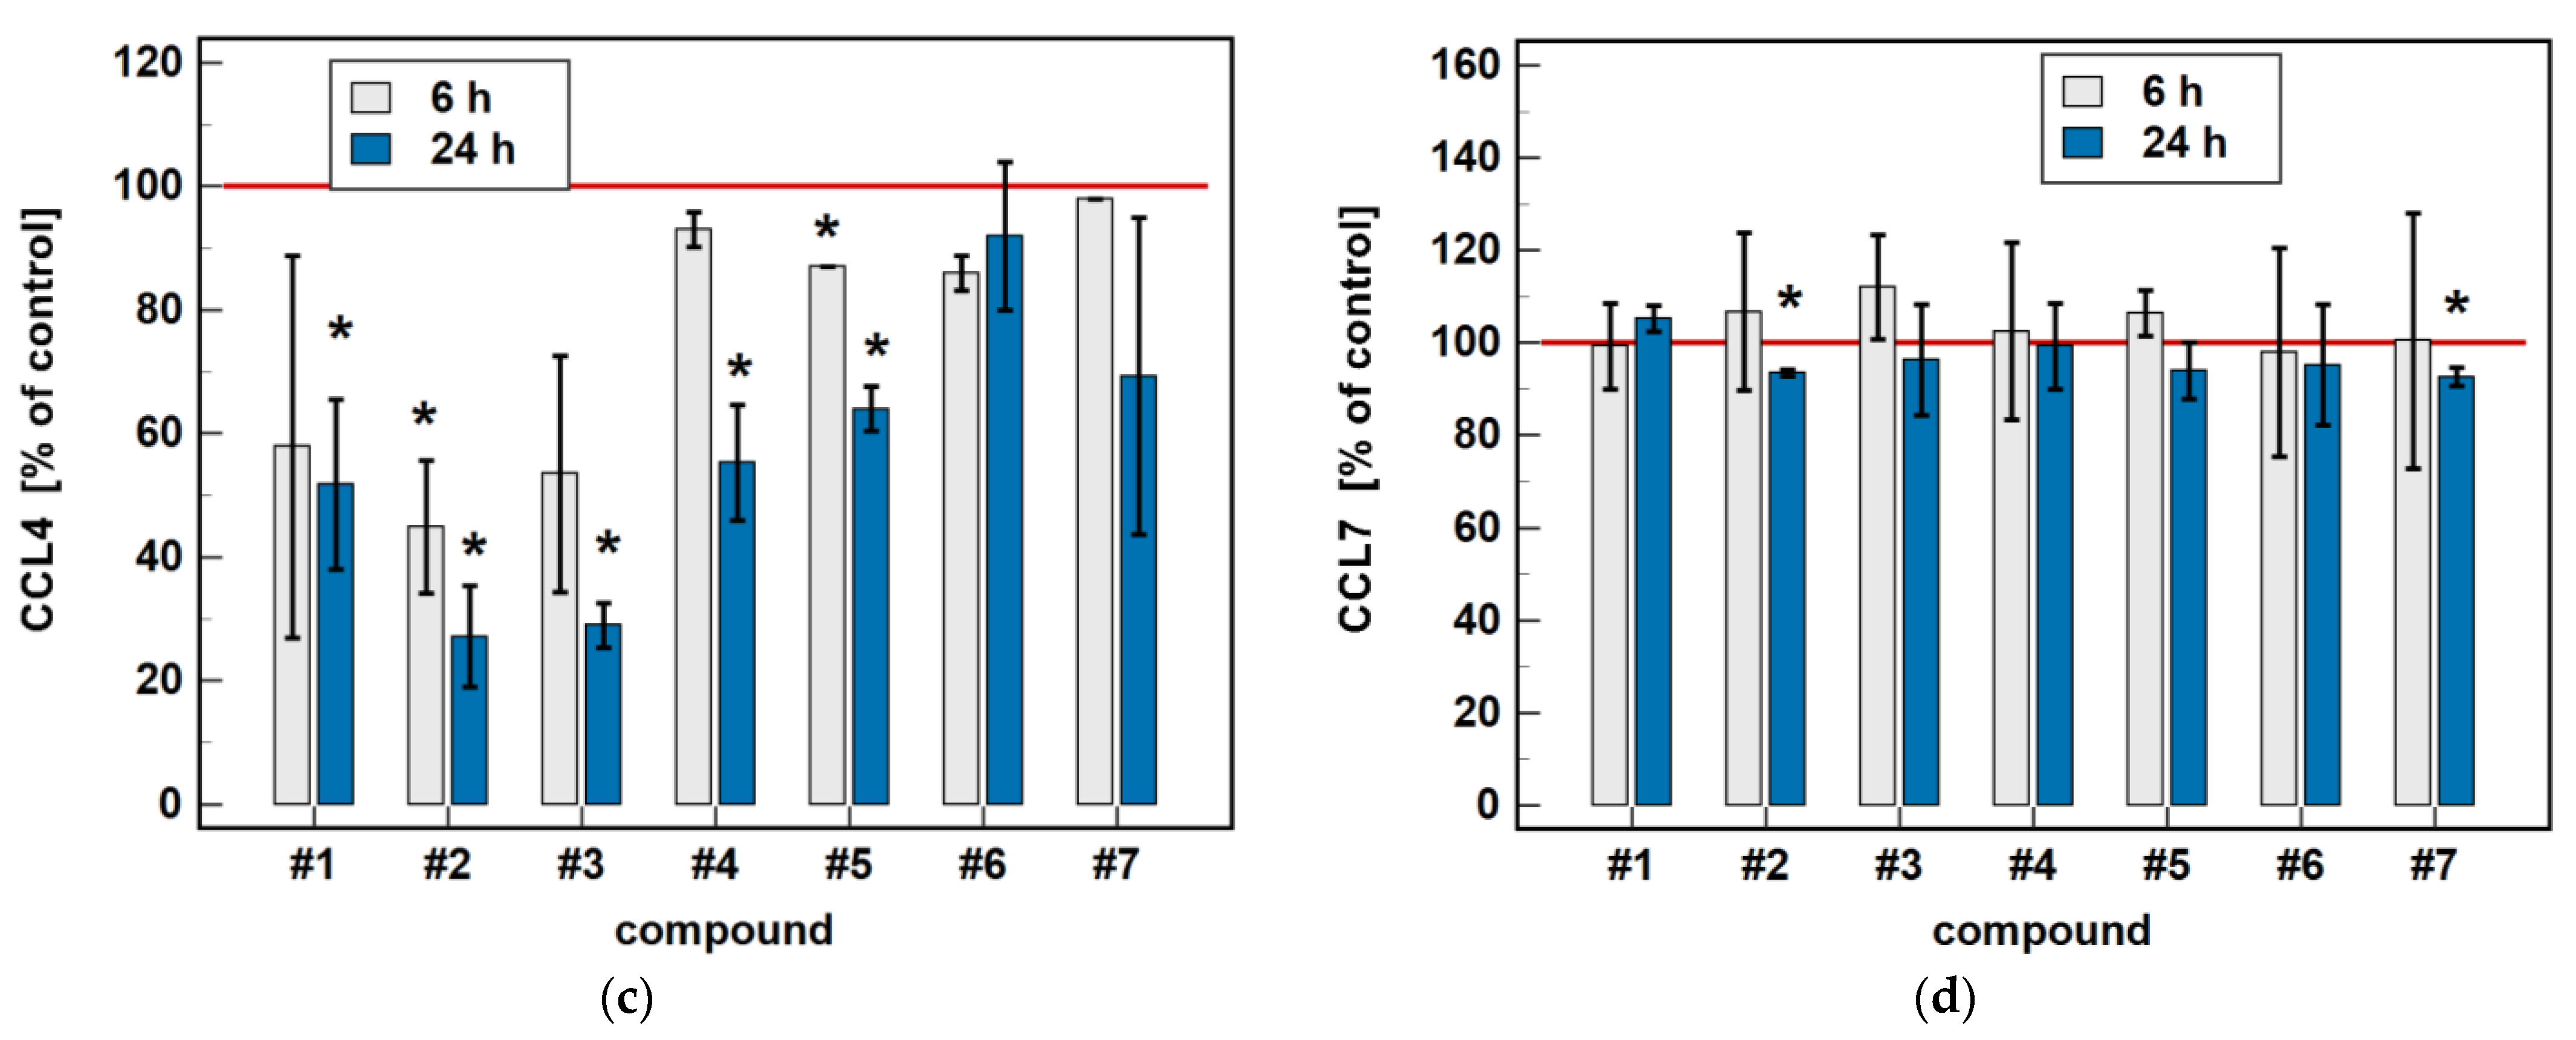
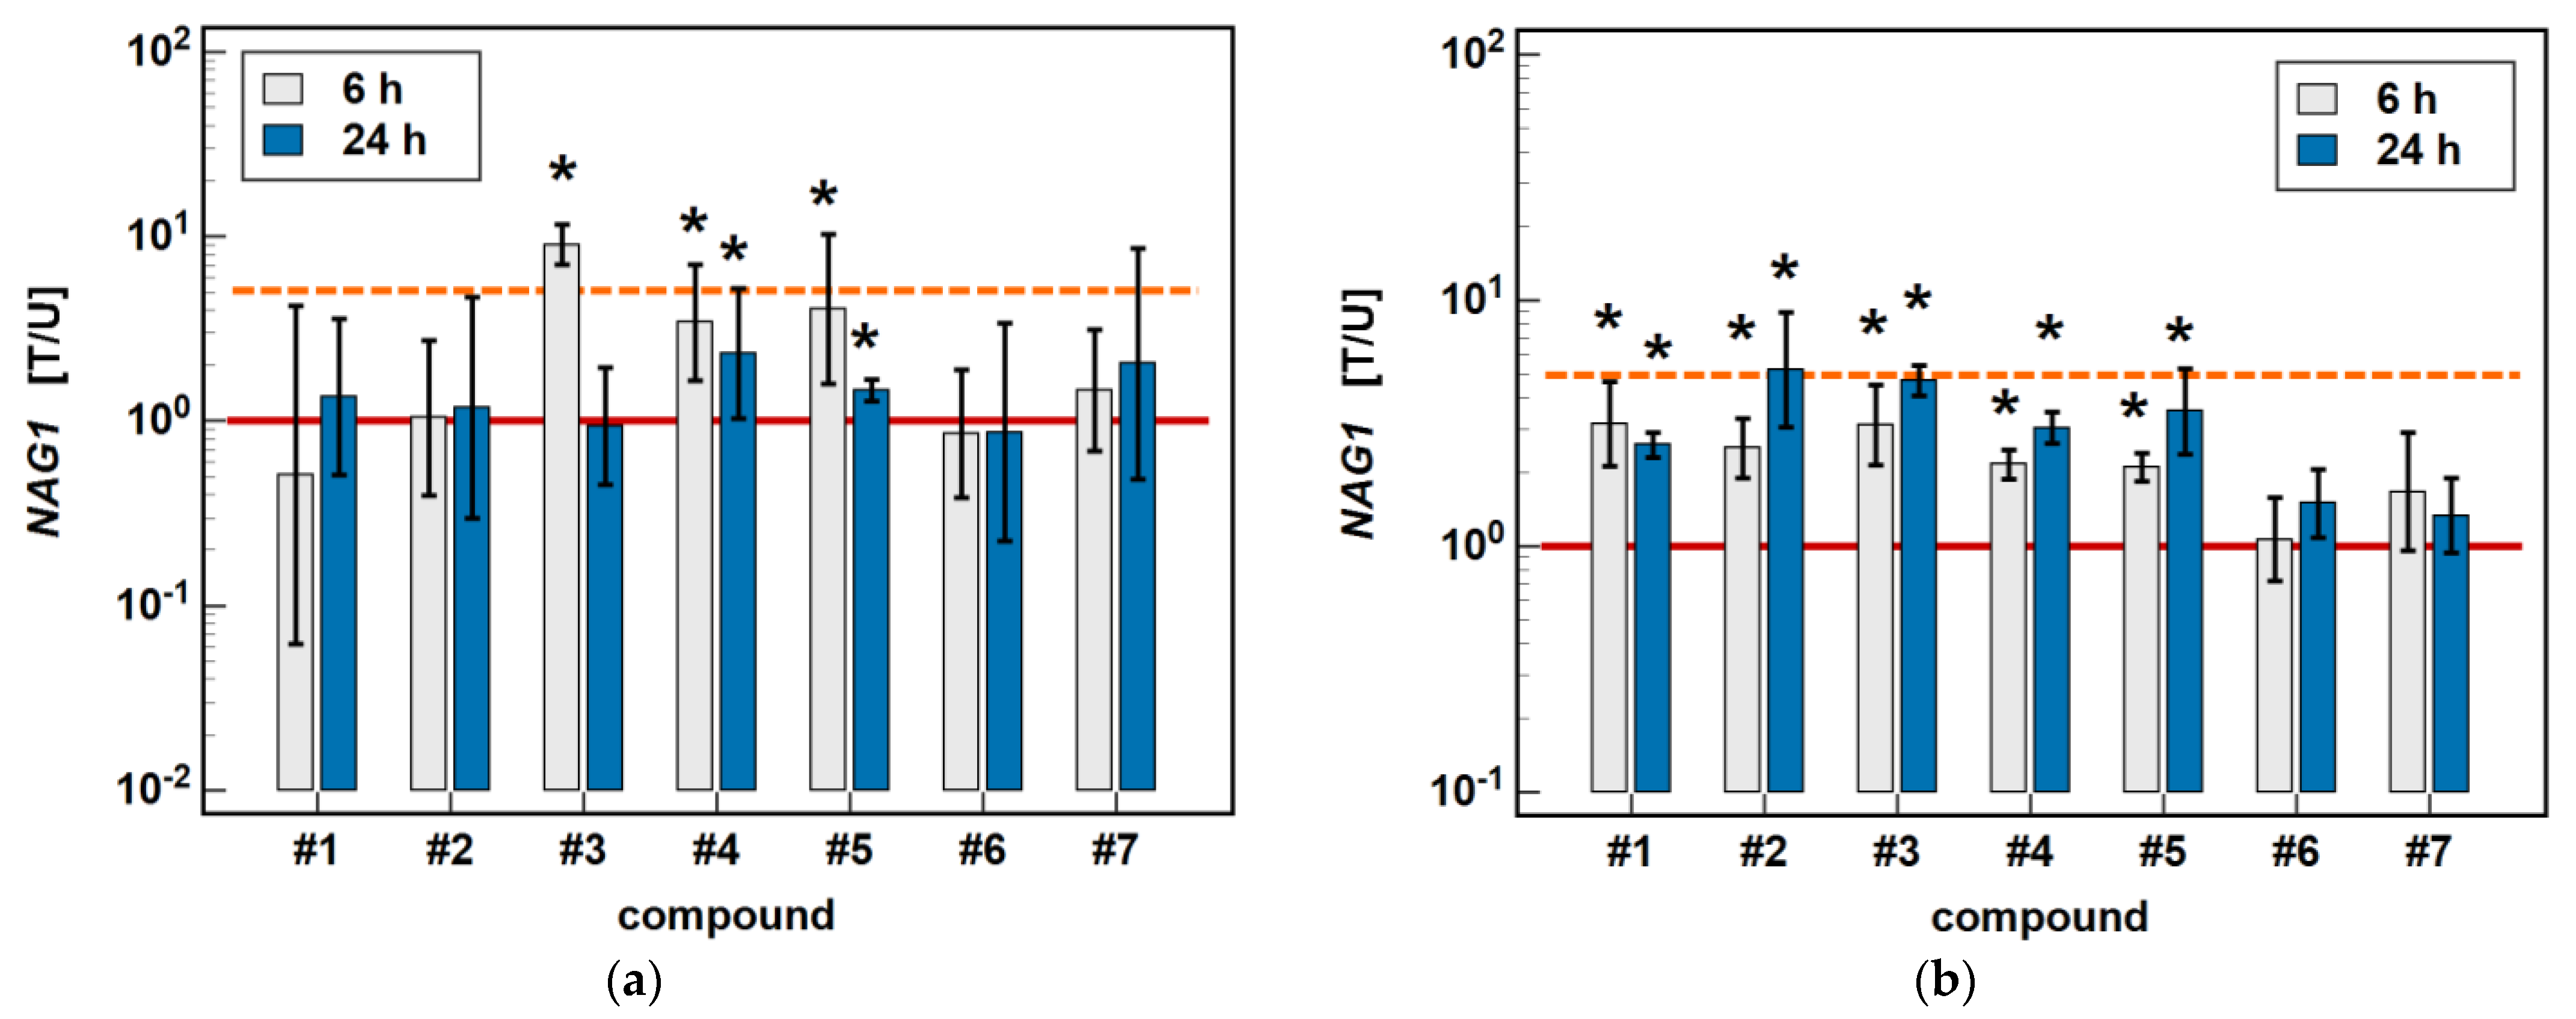
2.2.1. Time-Dependent Response to Oxicams
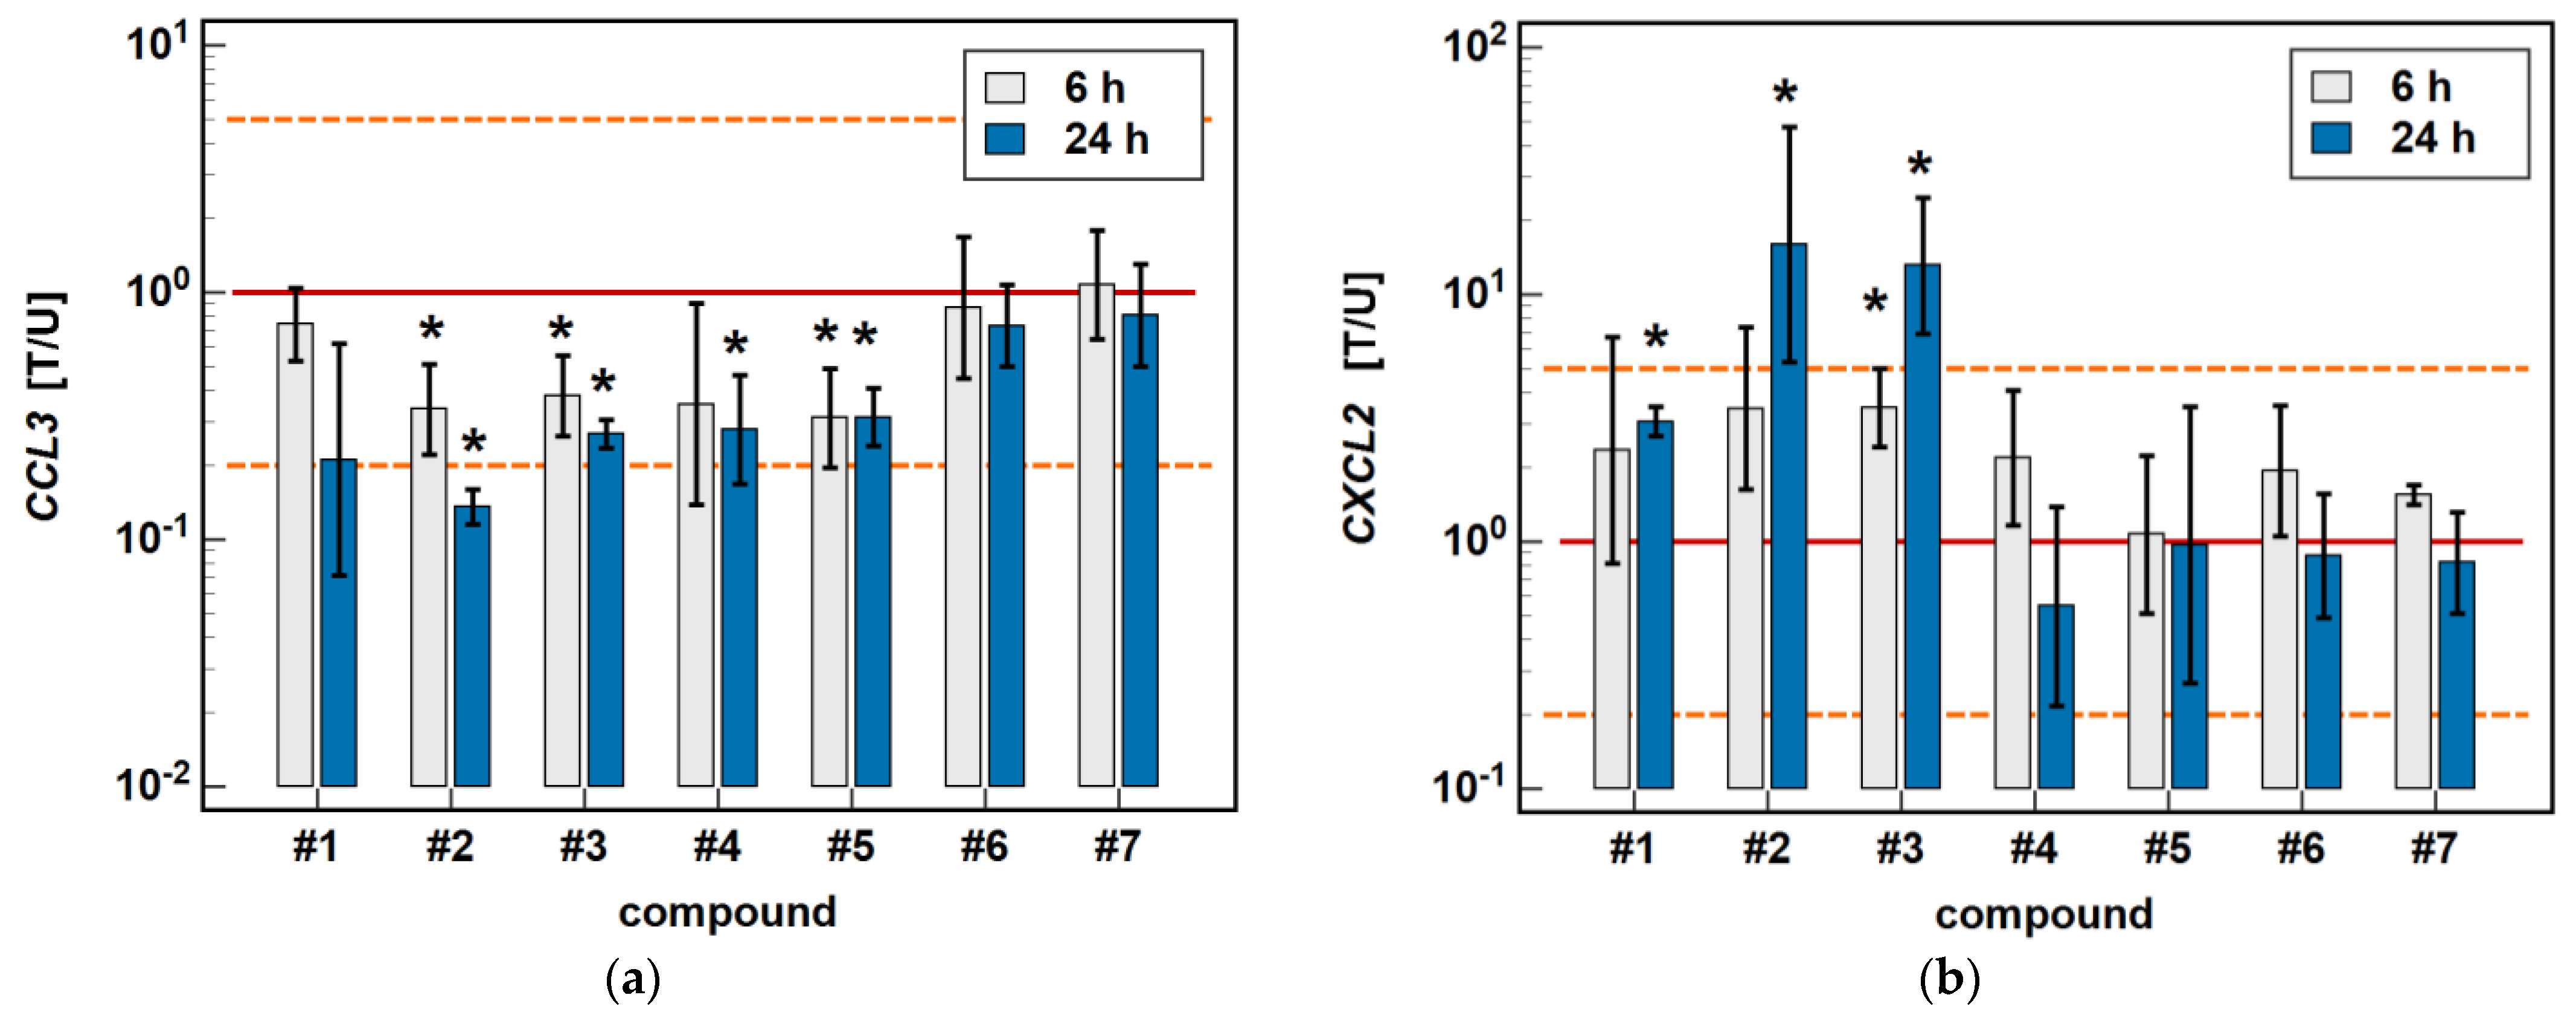
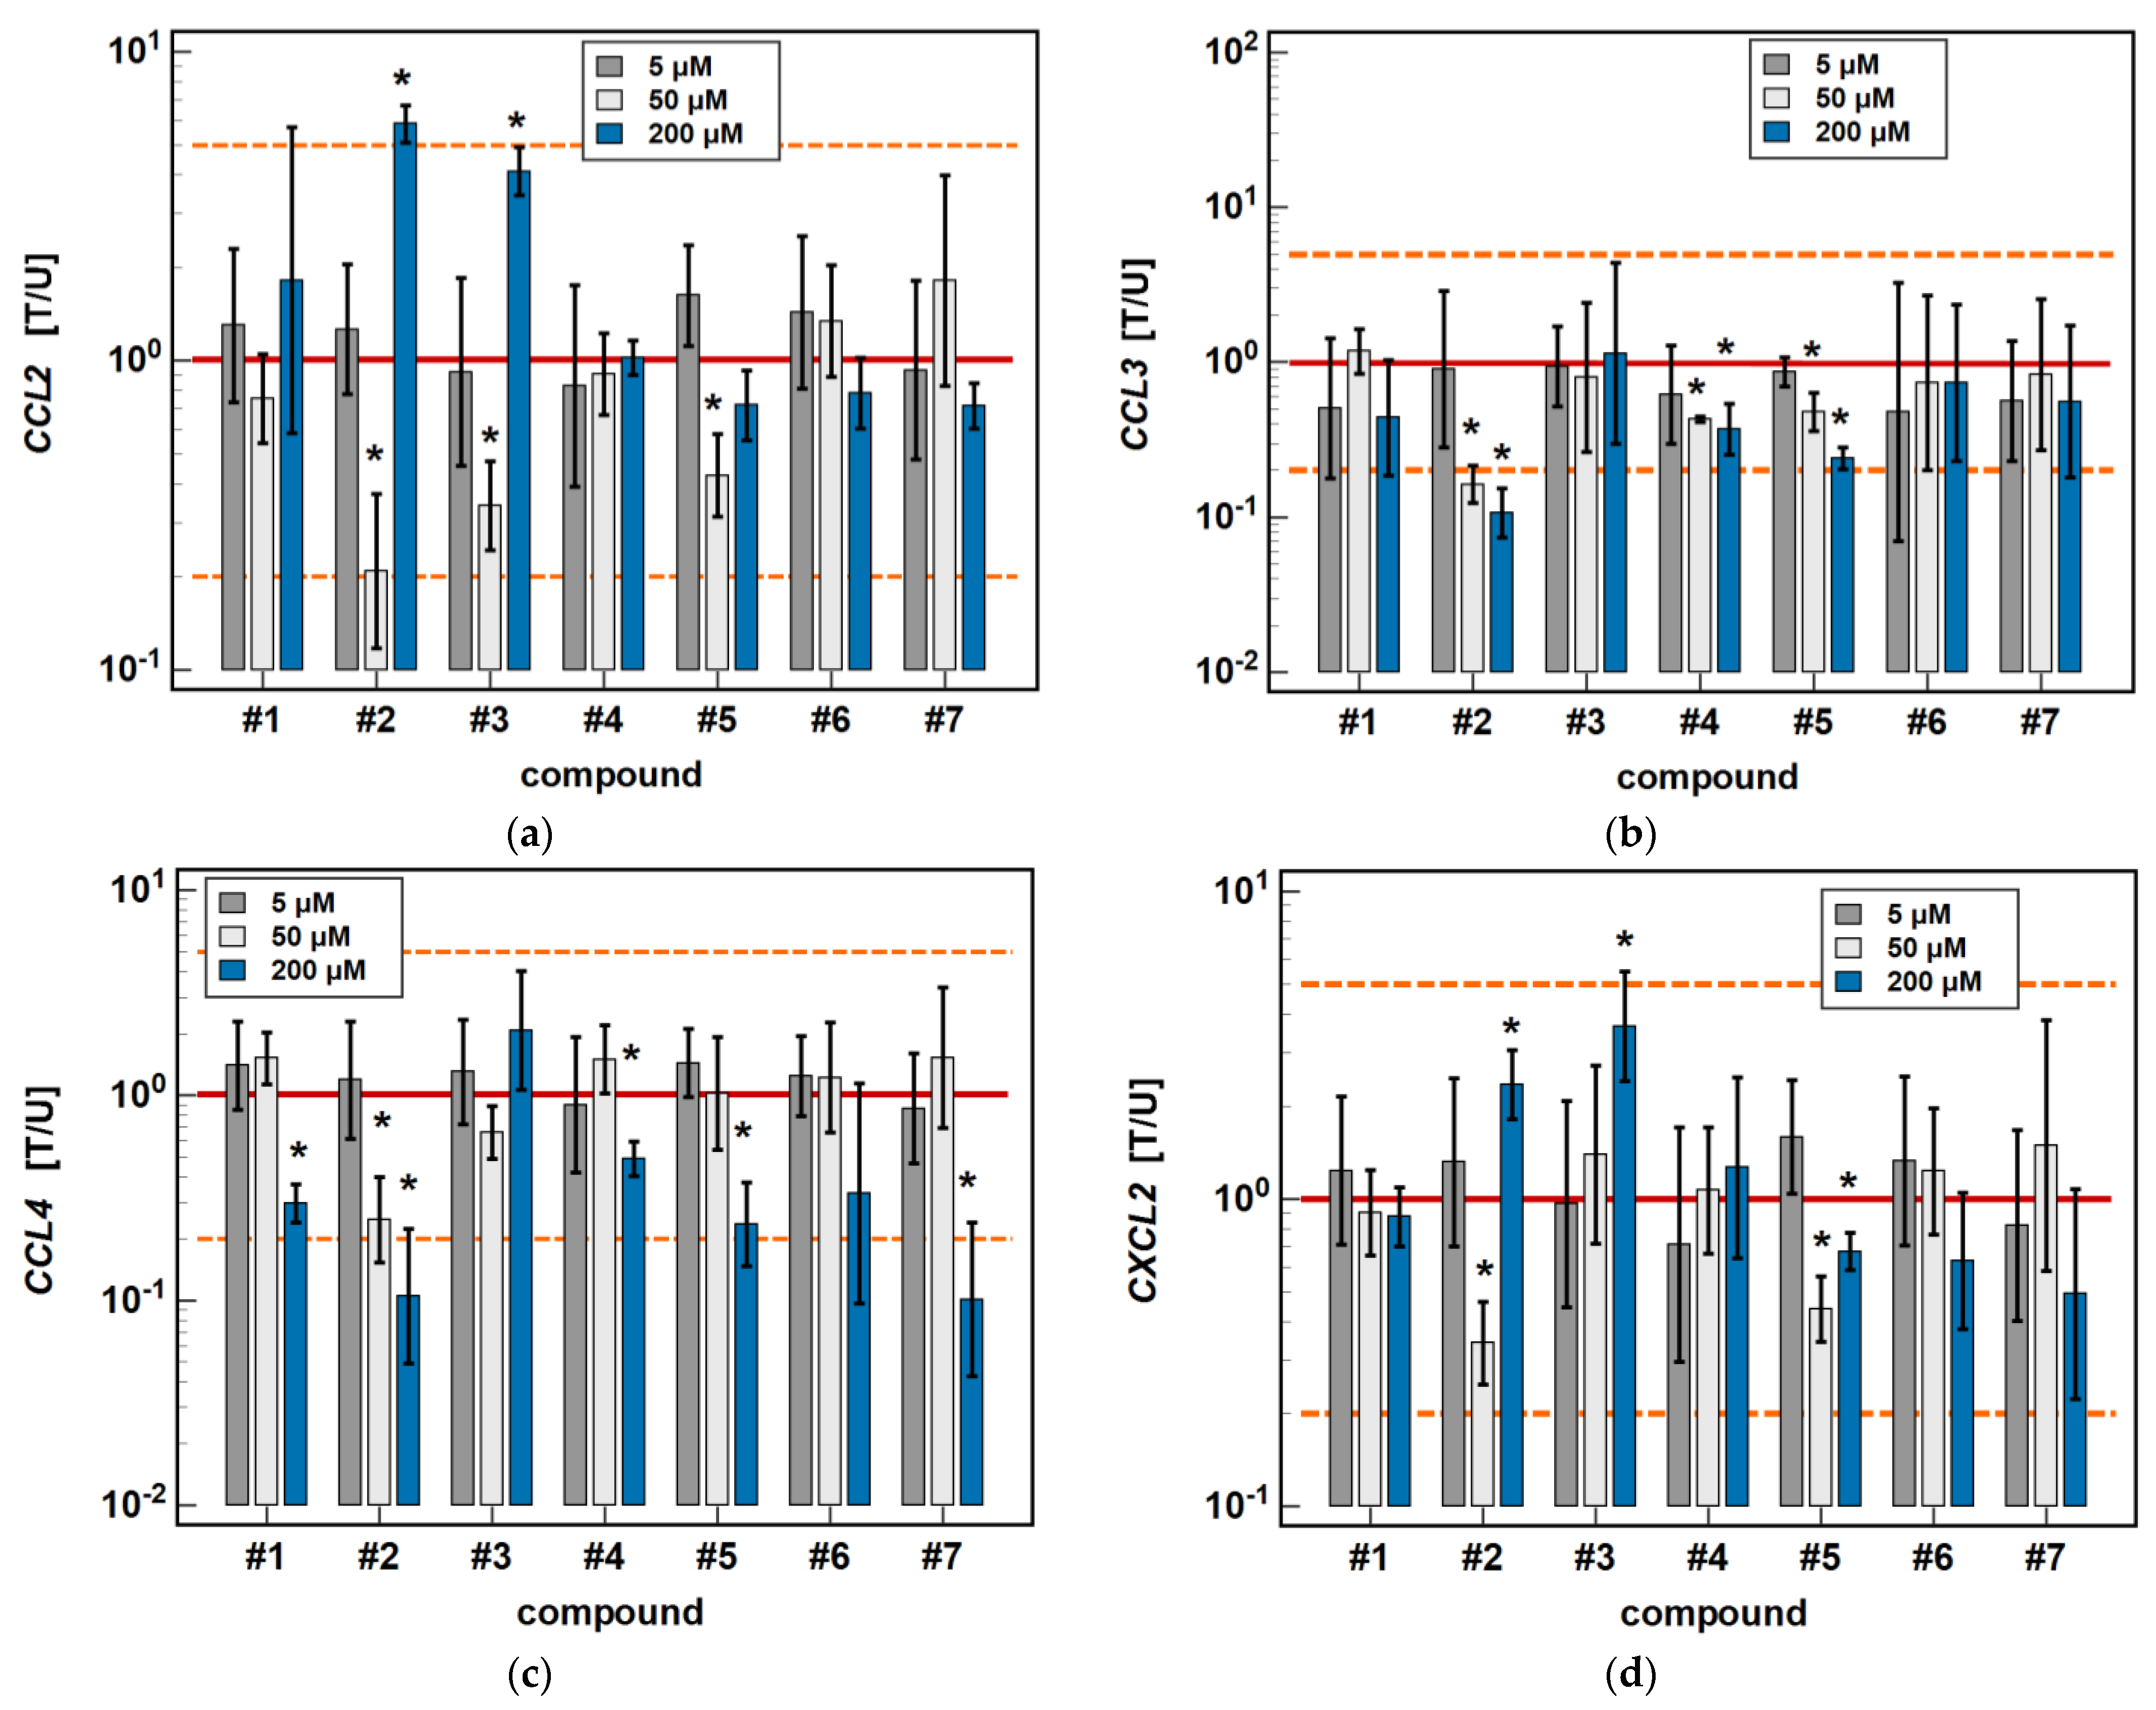
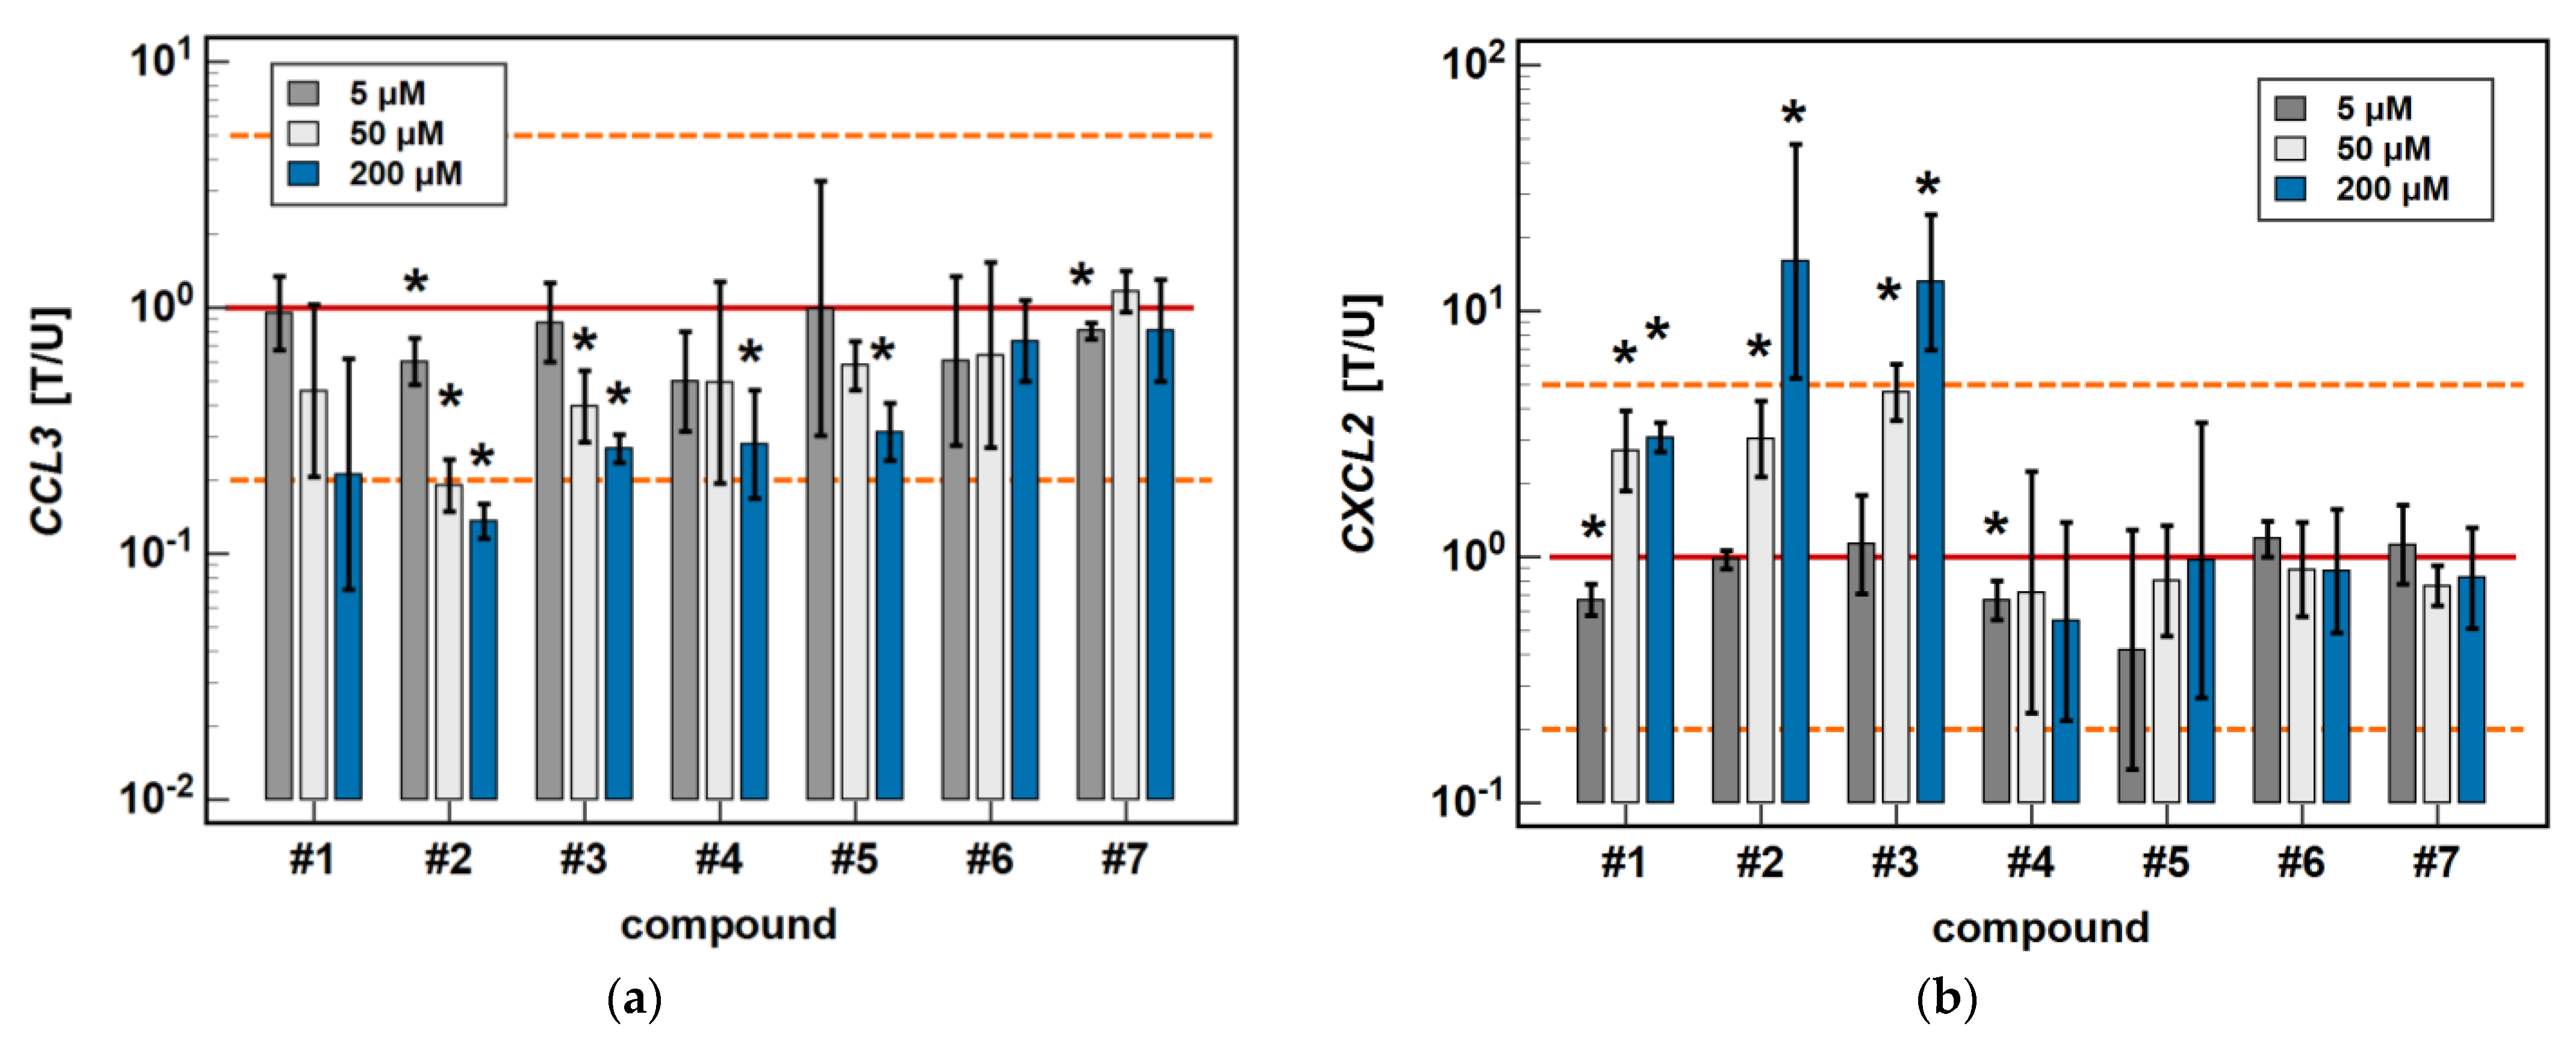
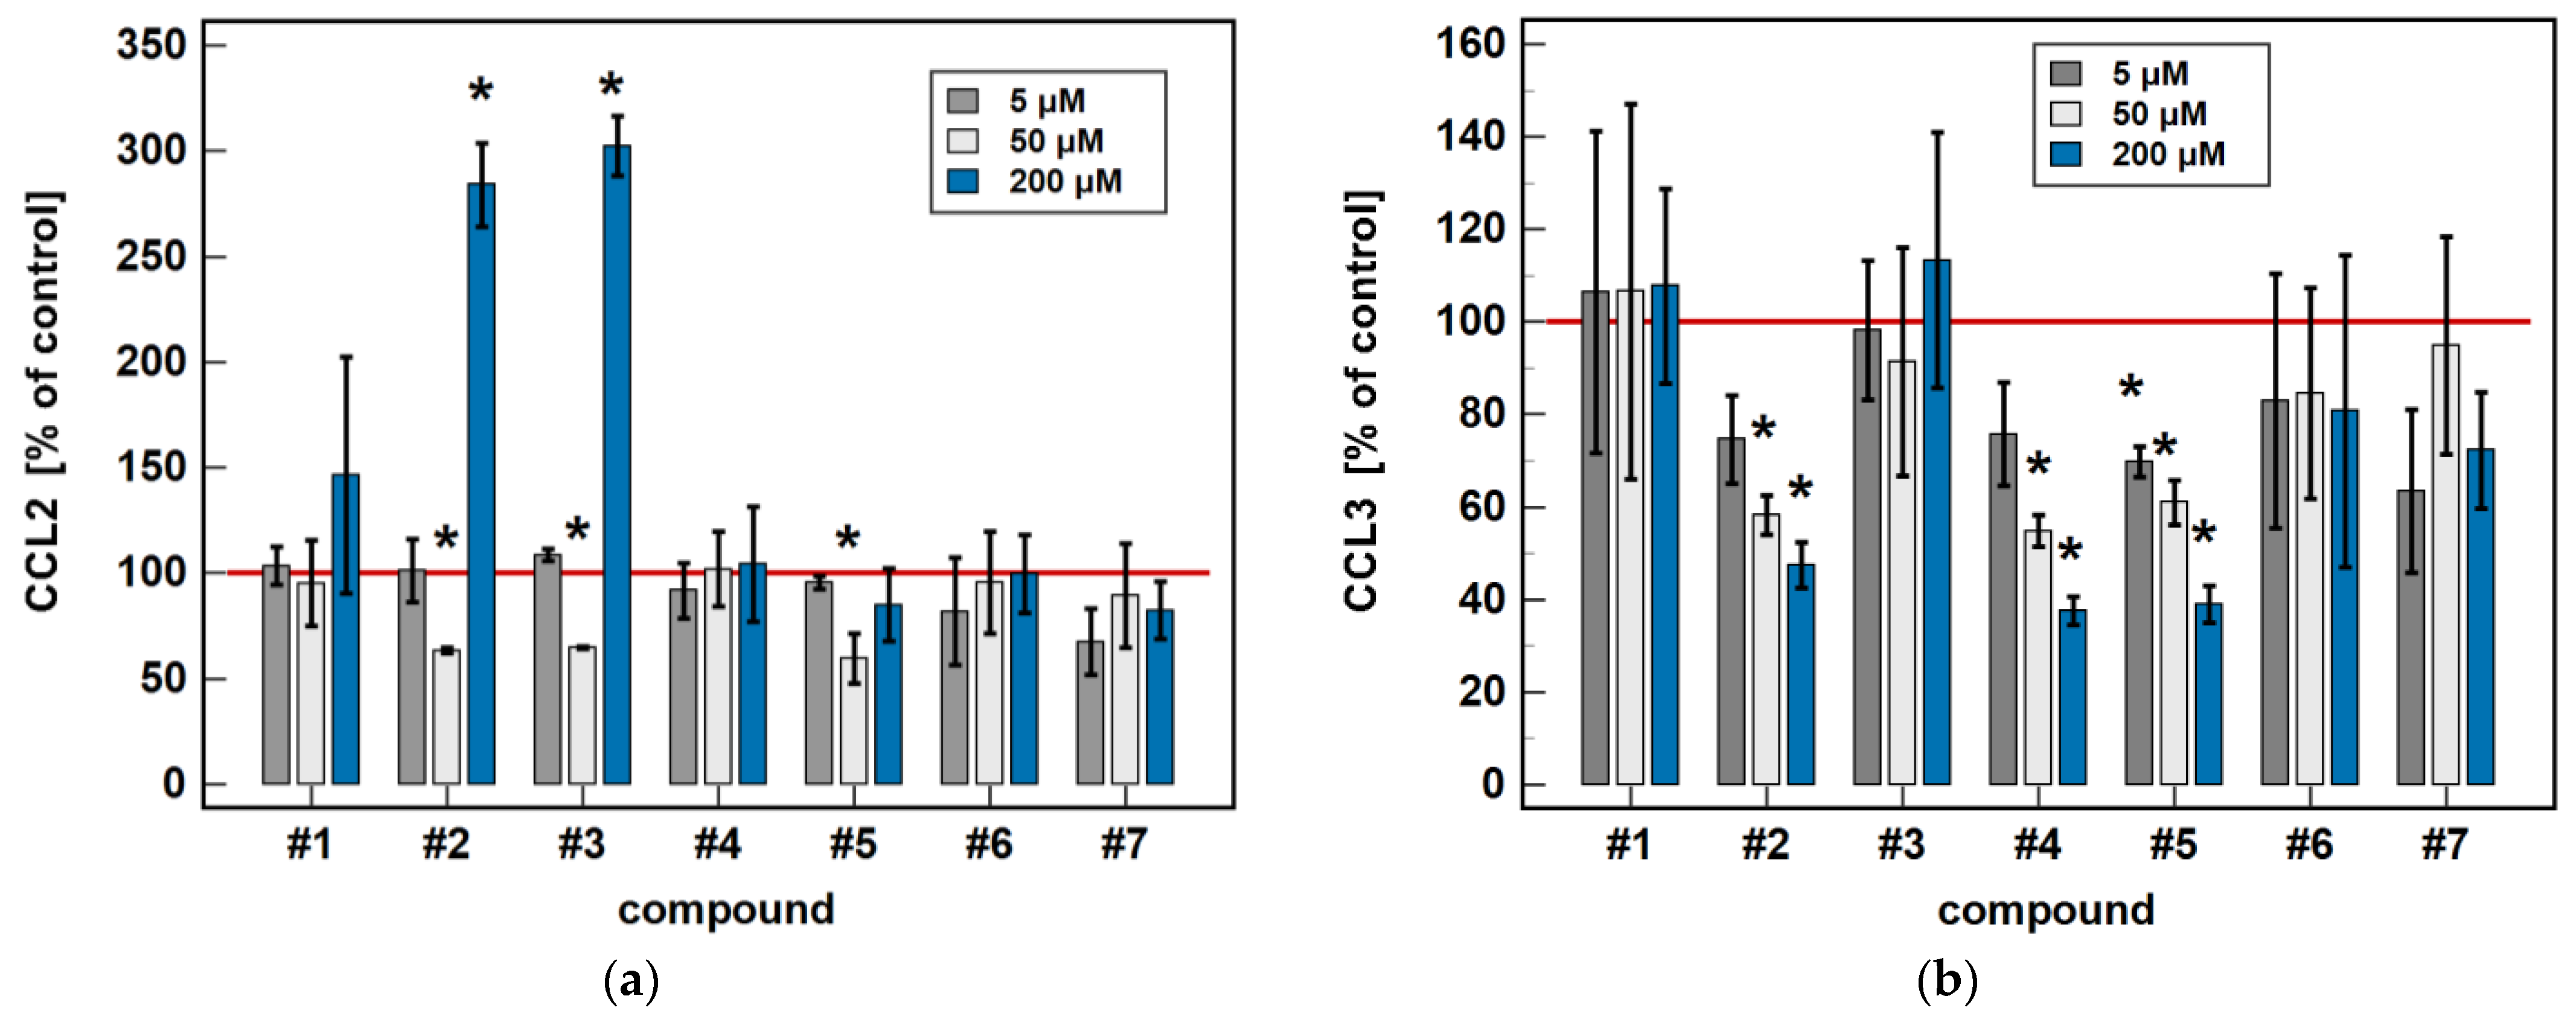
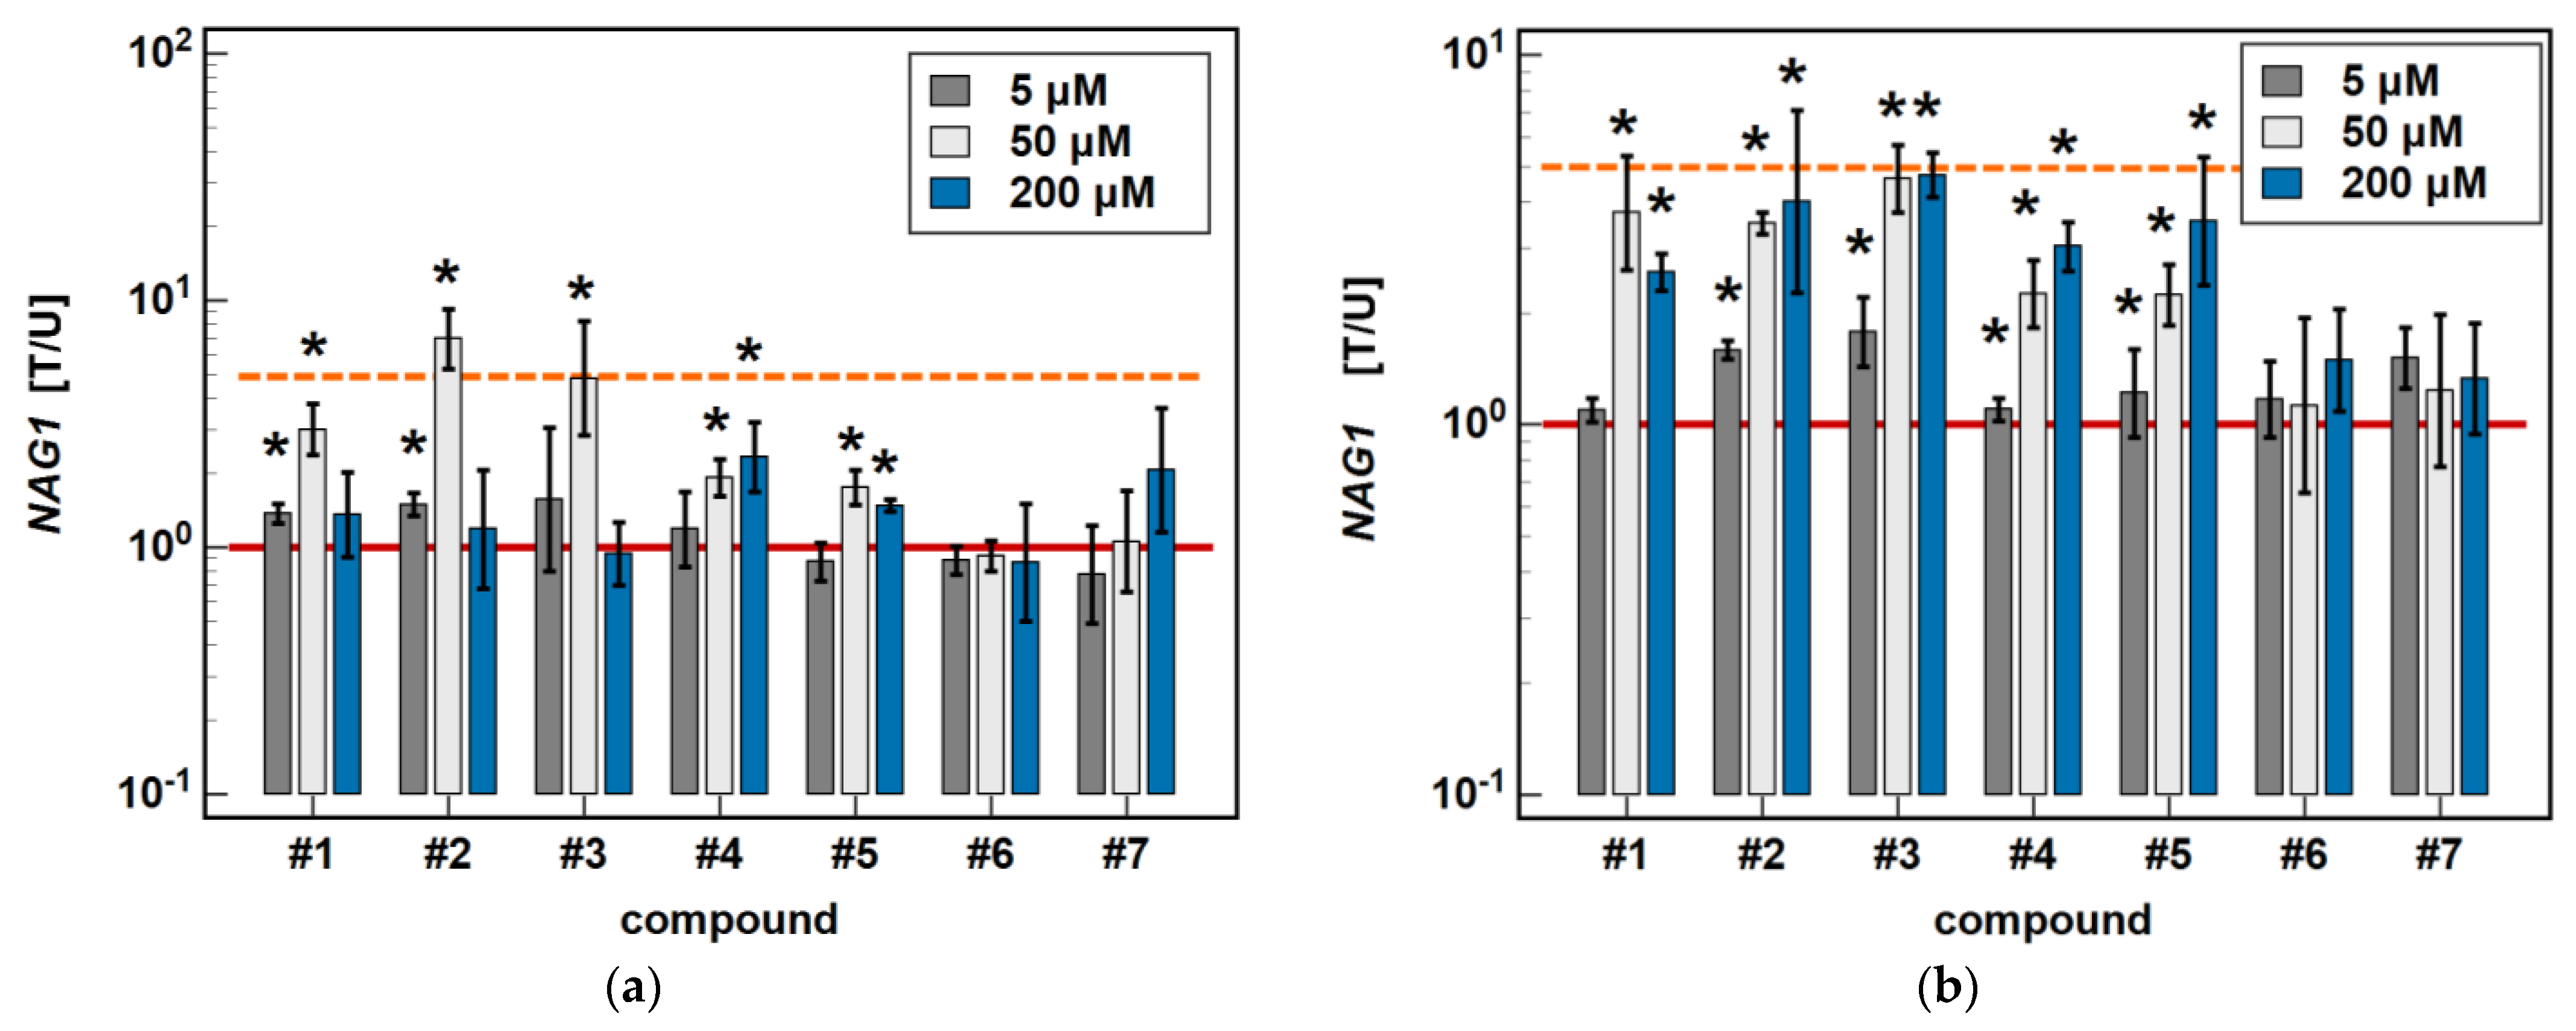
2.2.2. Dose-Dependent Response to Oxicams
2.3. Effect of Oxicams on MCP and MIP Secretion by Caco-2 Cells
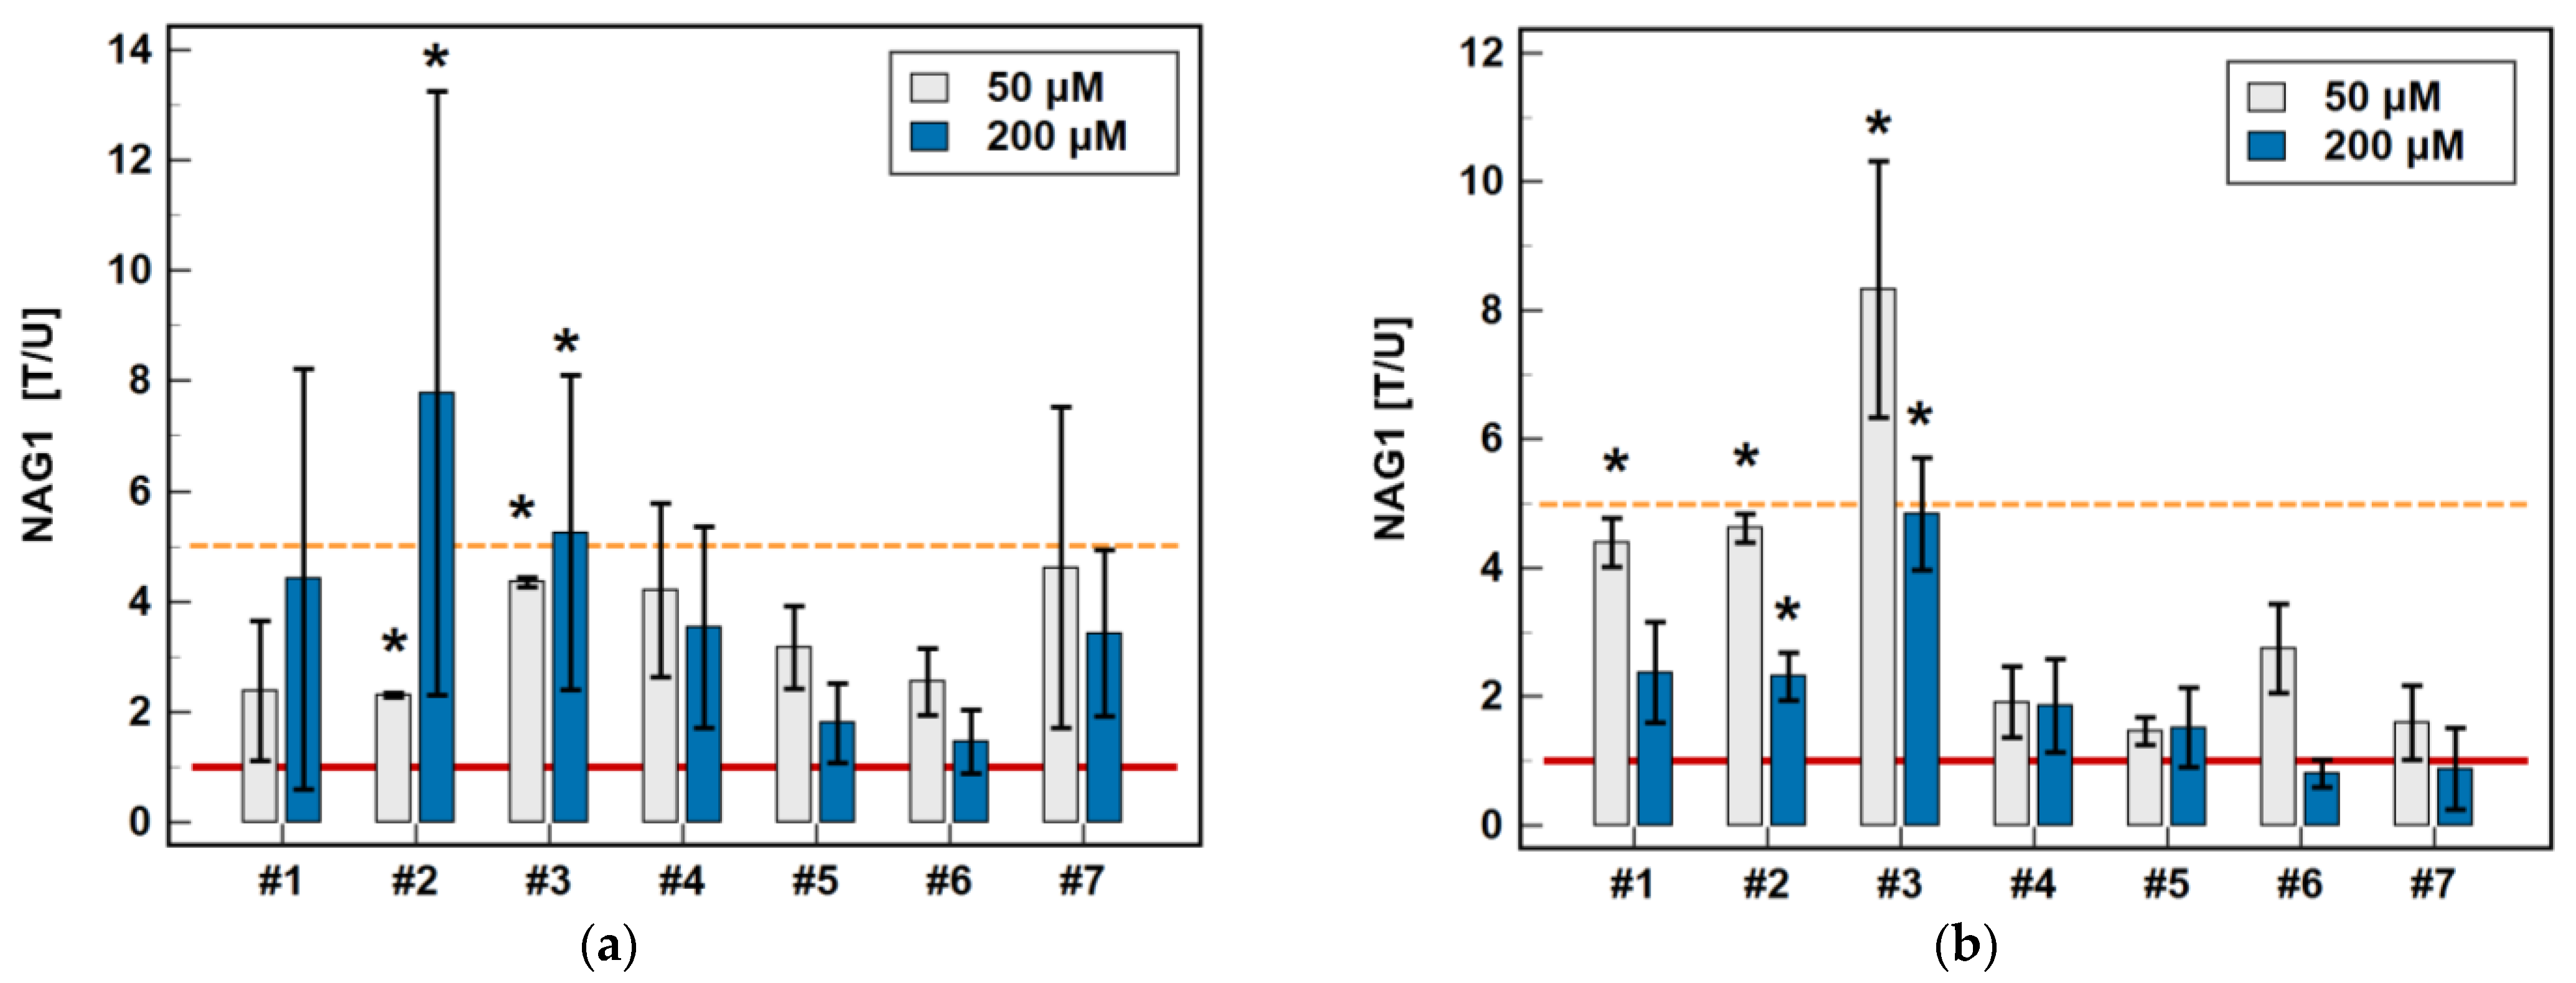
2.4. Effect of Oxicams on NAG1 Expression in Caco-2 and HCT 116 Cells
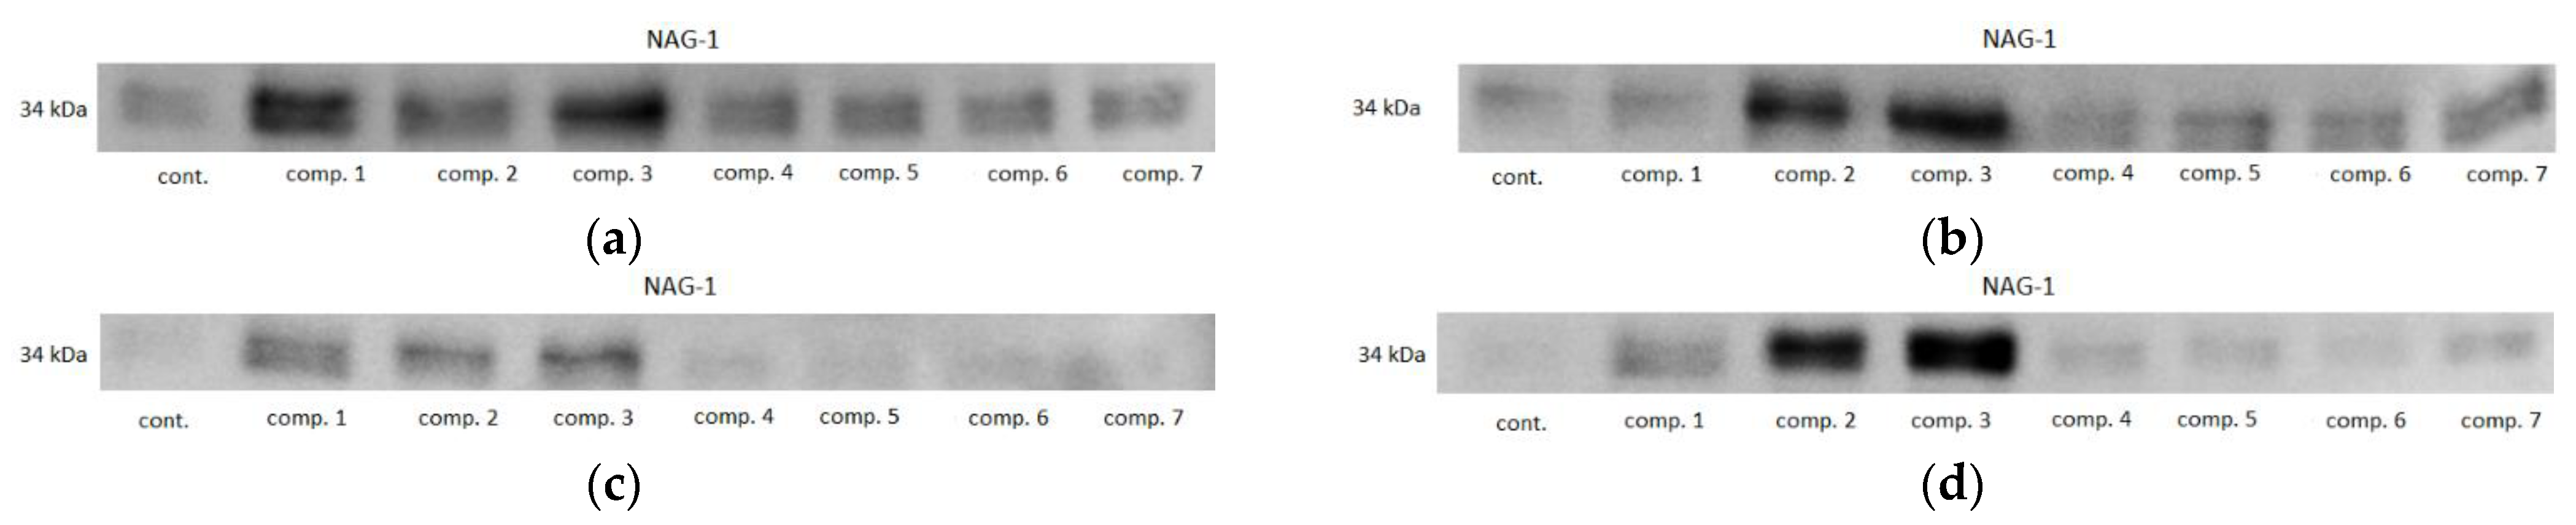
2.5. Effect of Oxicams on NAG1 Protein Expression in Caco-2, HCT 116, and HT-29 Cells
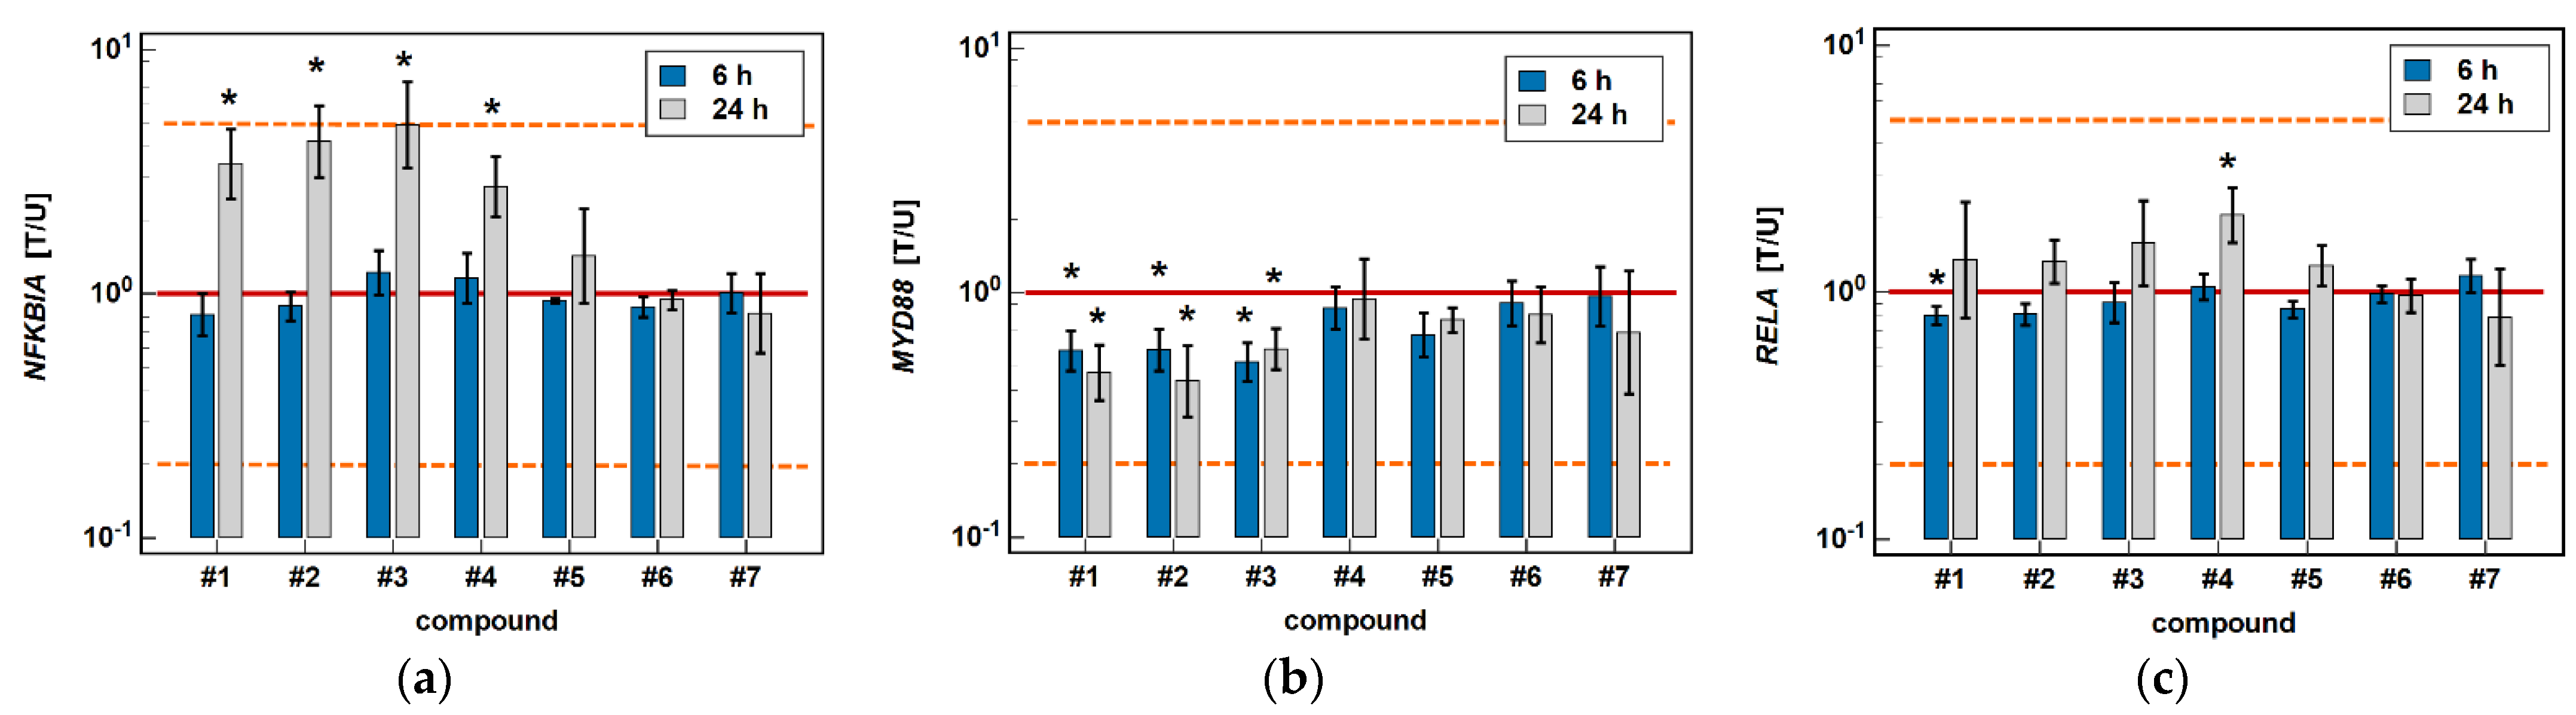
2.6. Effect of Oxicams on the Expression of NFκB-Associated Genes in Caco-2 Cells
2.7. Local Expression of MCP and MIP Chemokines in CRC Patients
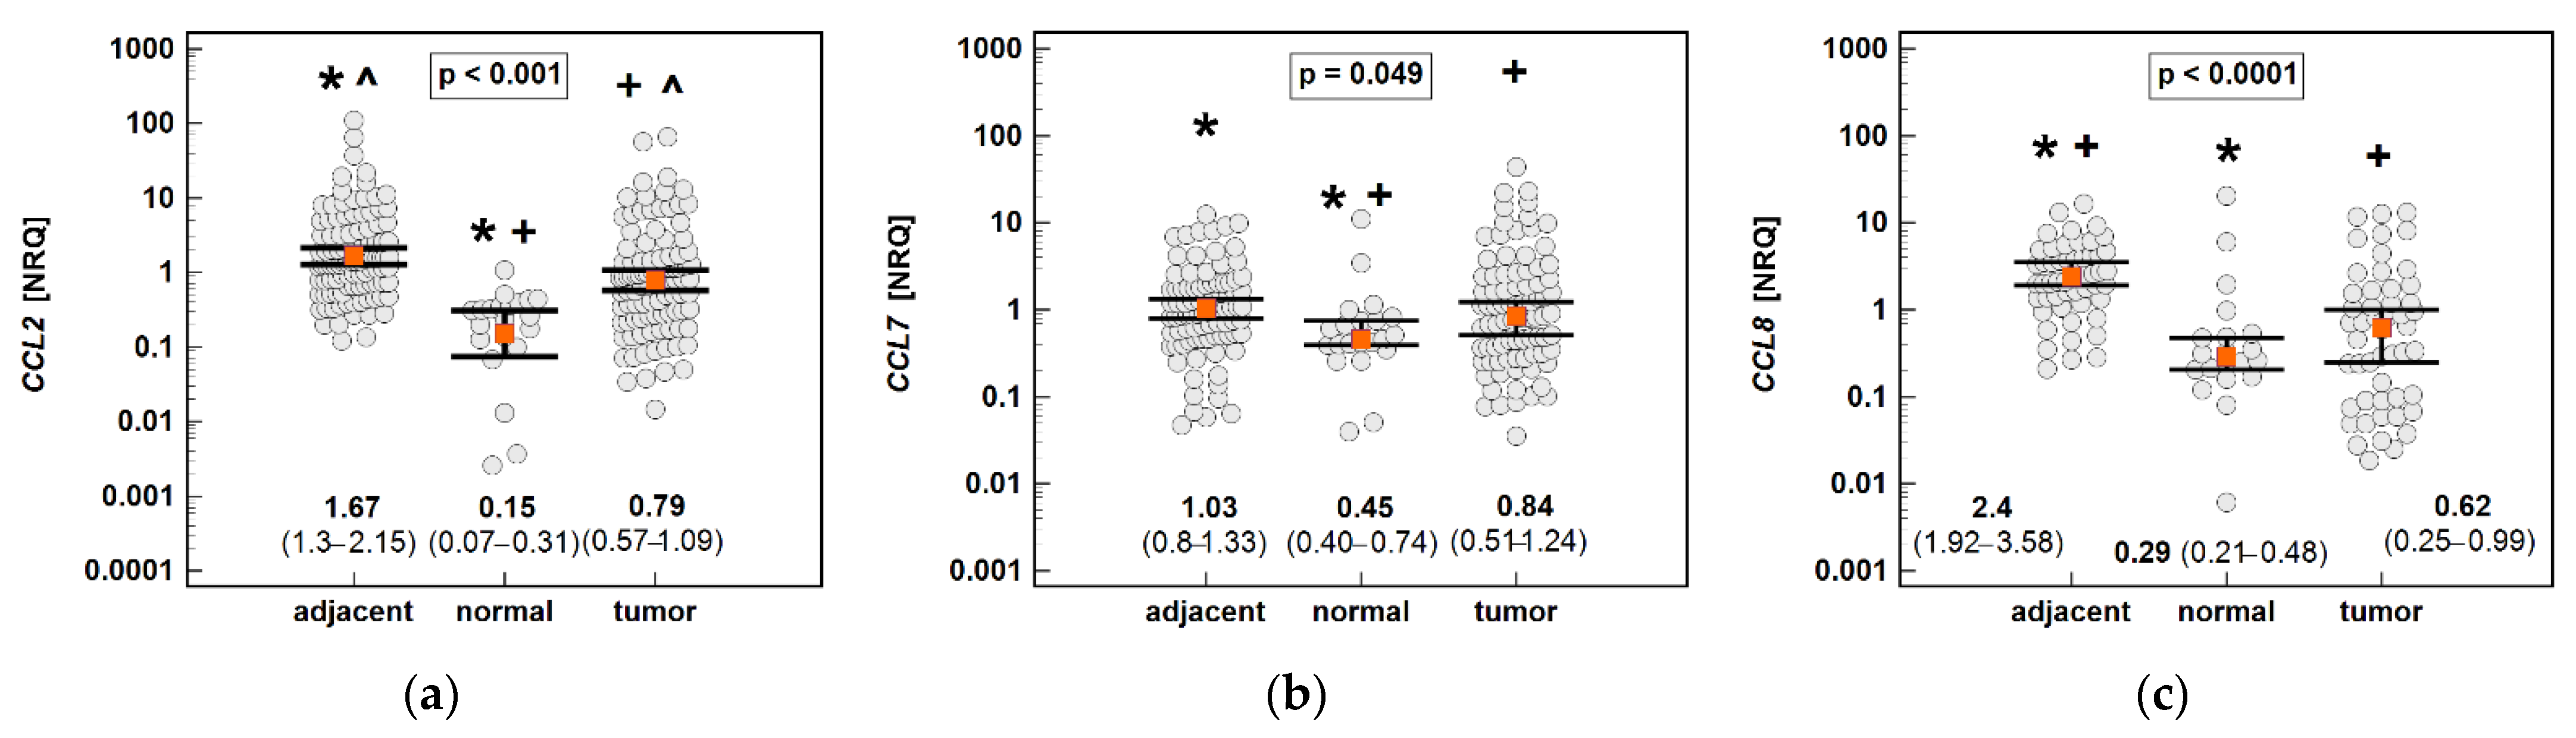
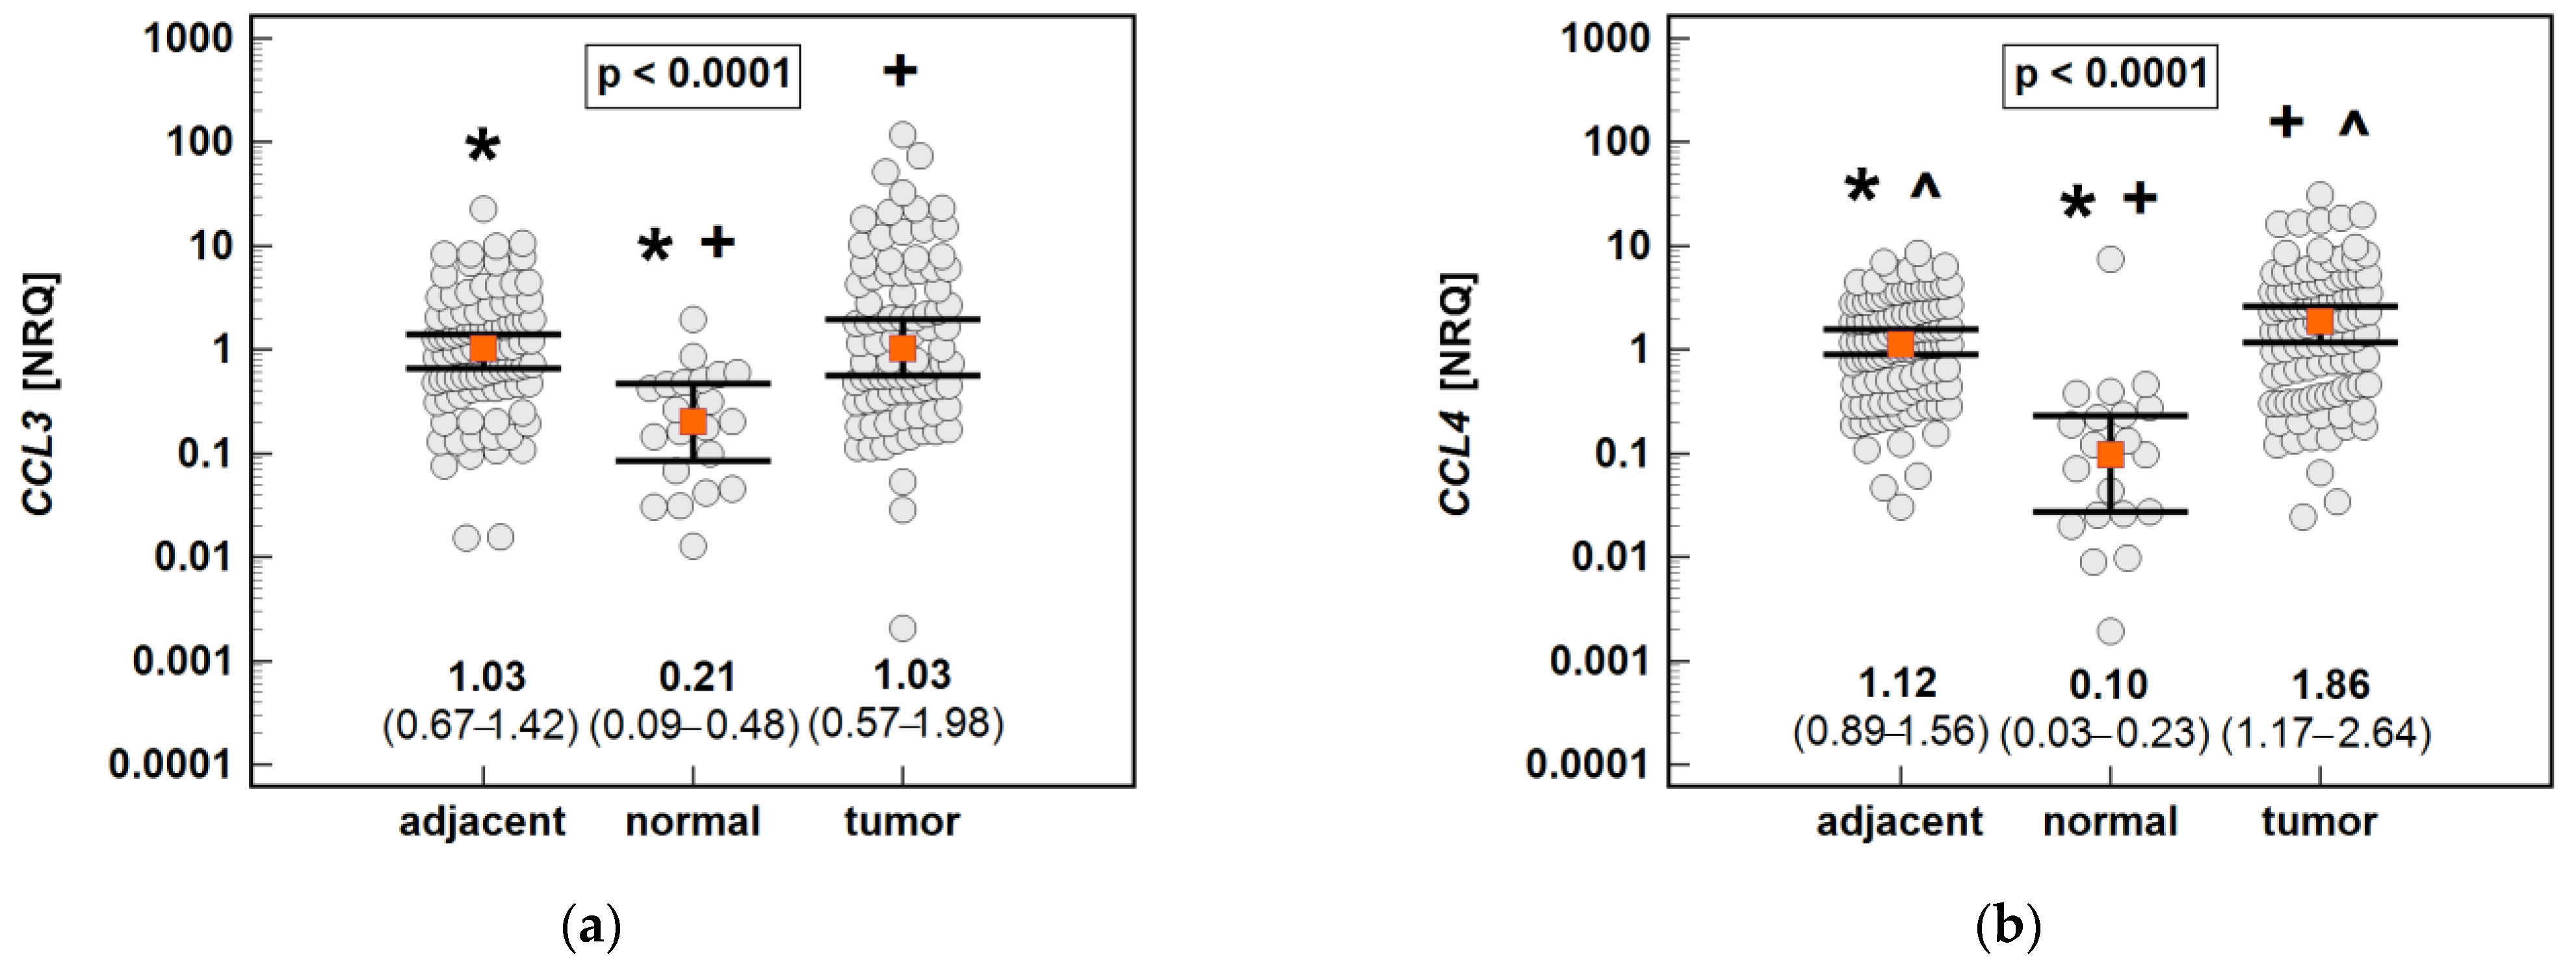
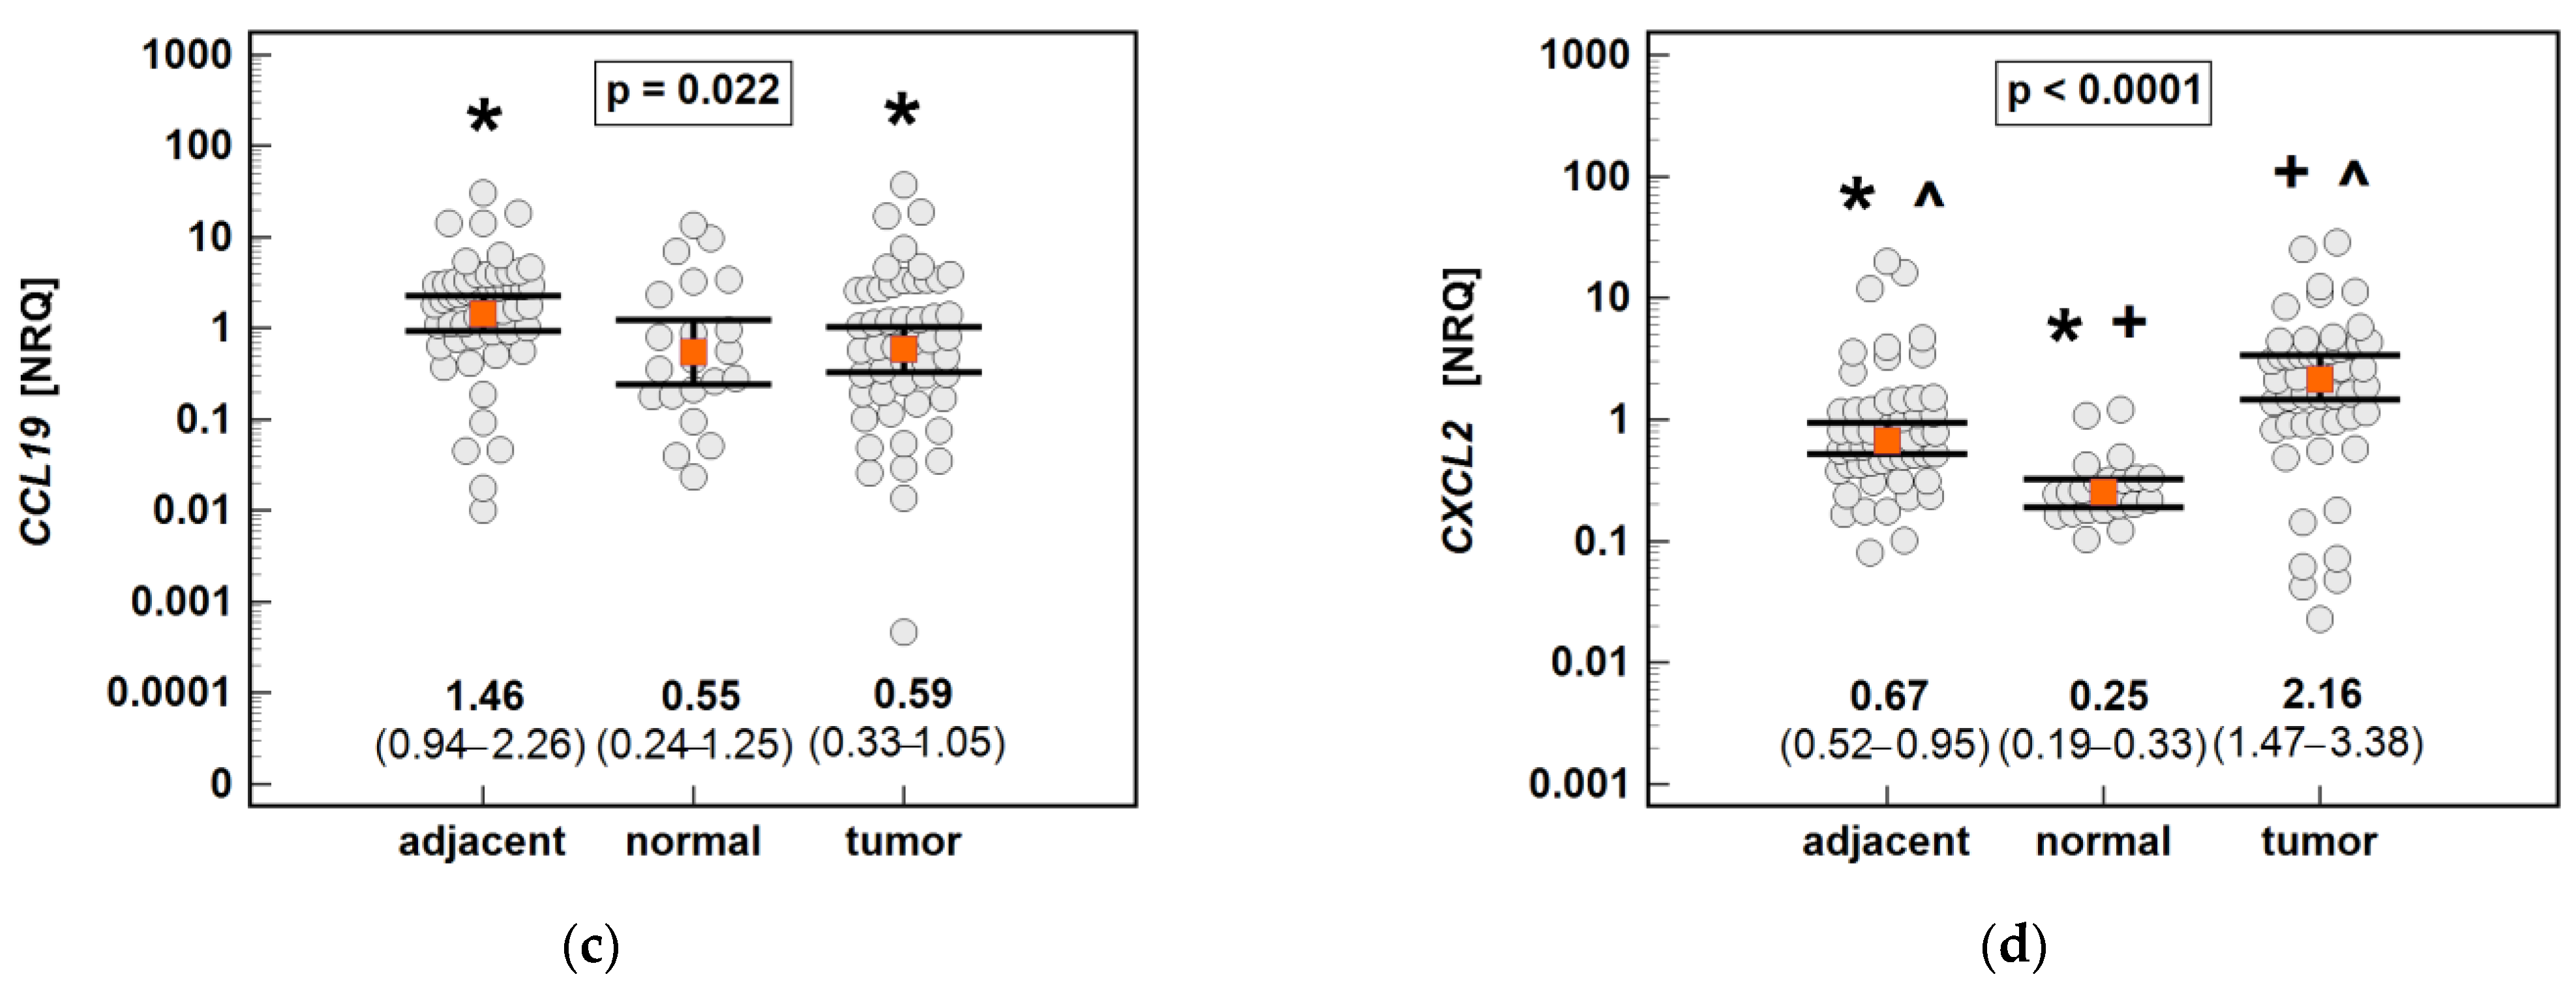
2.7.1. Pairwise Analysis of MCPs and MIPs in Transformed and Non-transformed Tumor-Adjacent Colorectal Mucosa
2.7.2. Non-Paired Analysis of the MCP and MIP Expression in Tumor and Tumor-Adjacent Tissue Compared to Normal Colonic Mucosa from Non-Cancer Patients
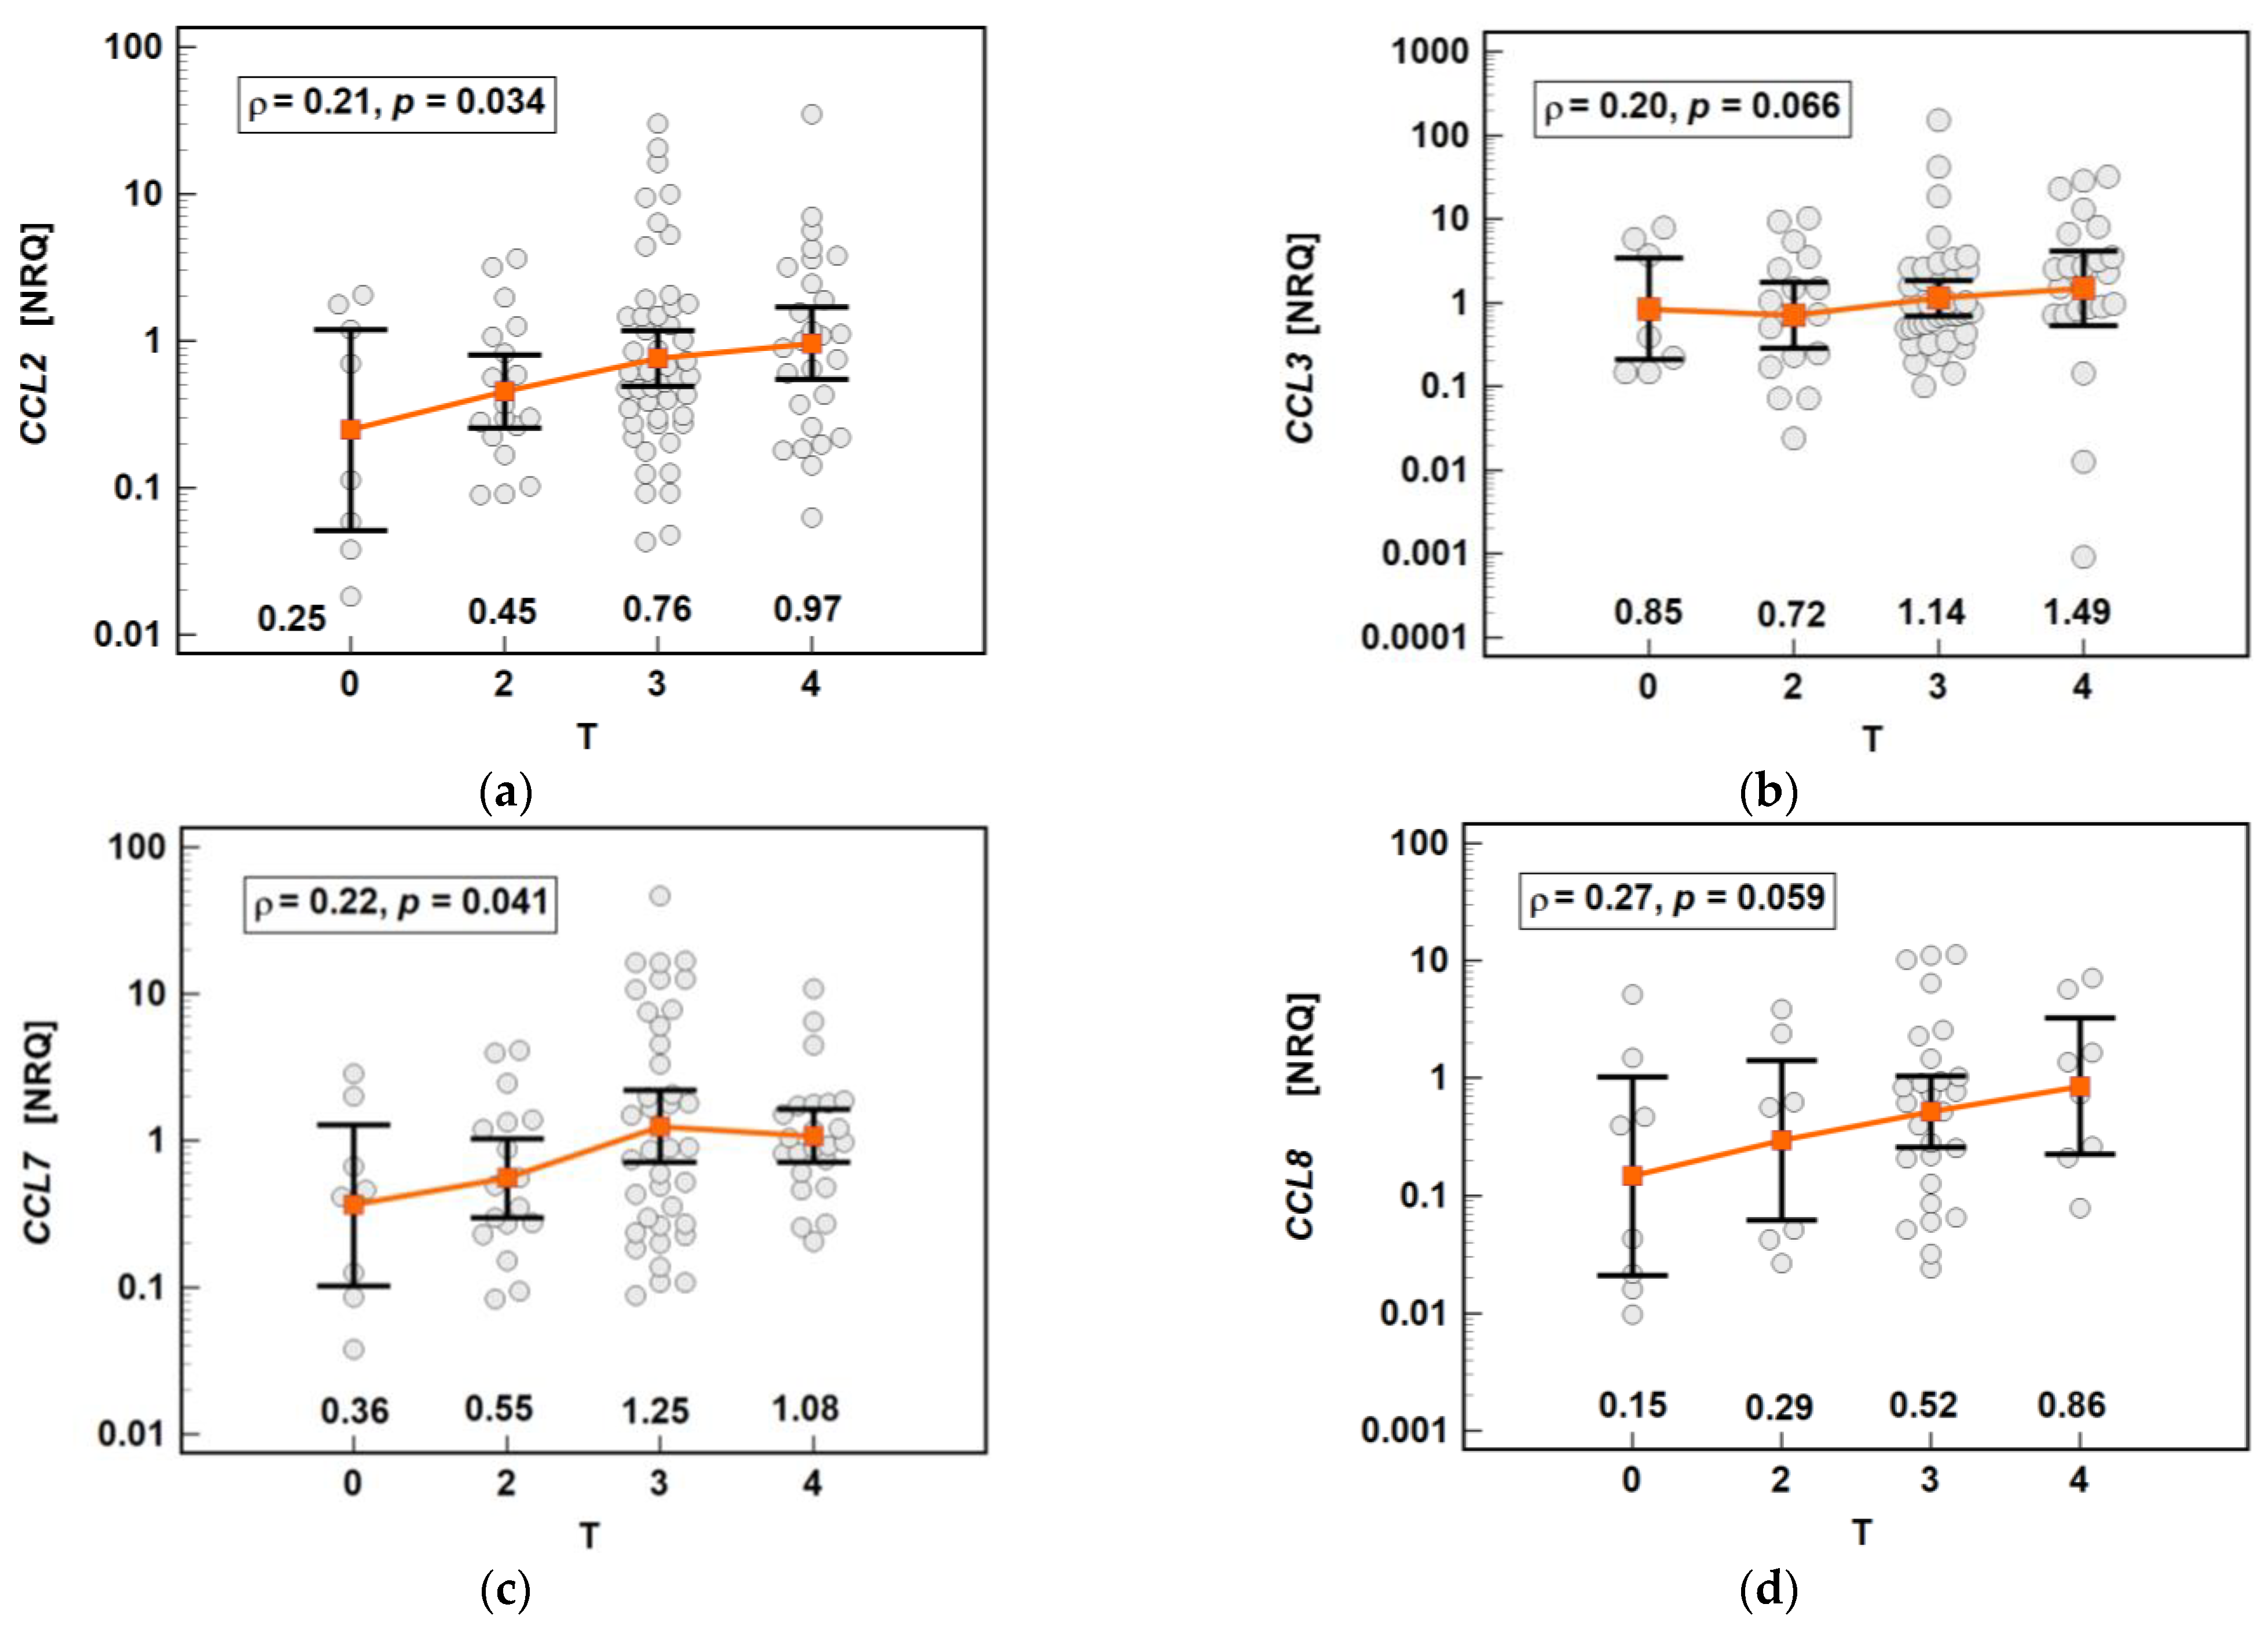
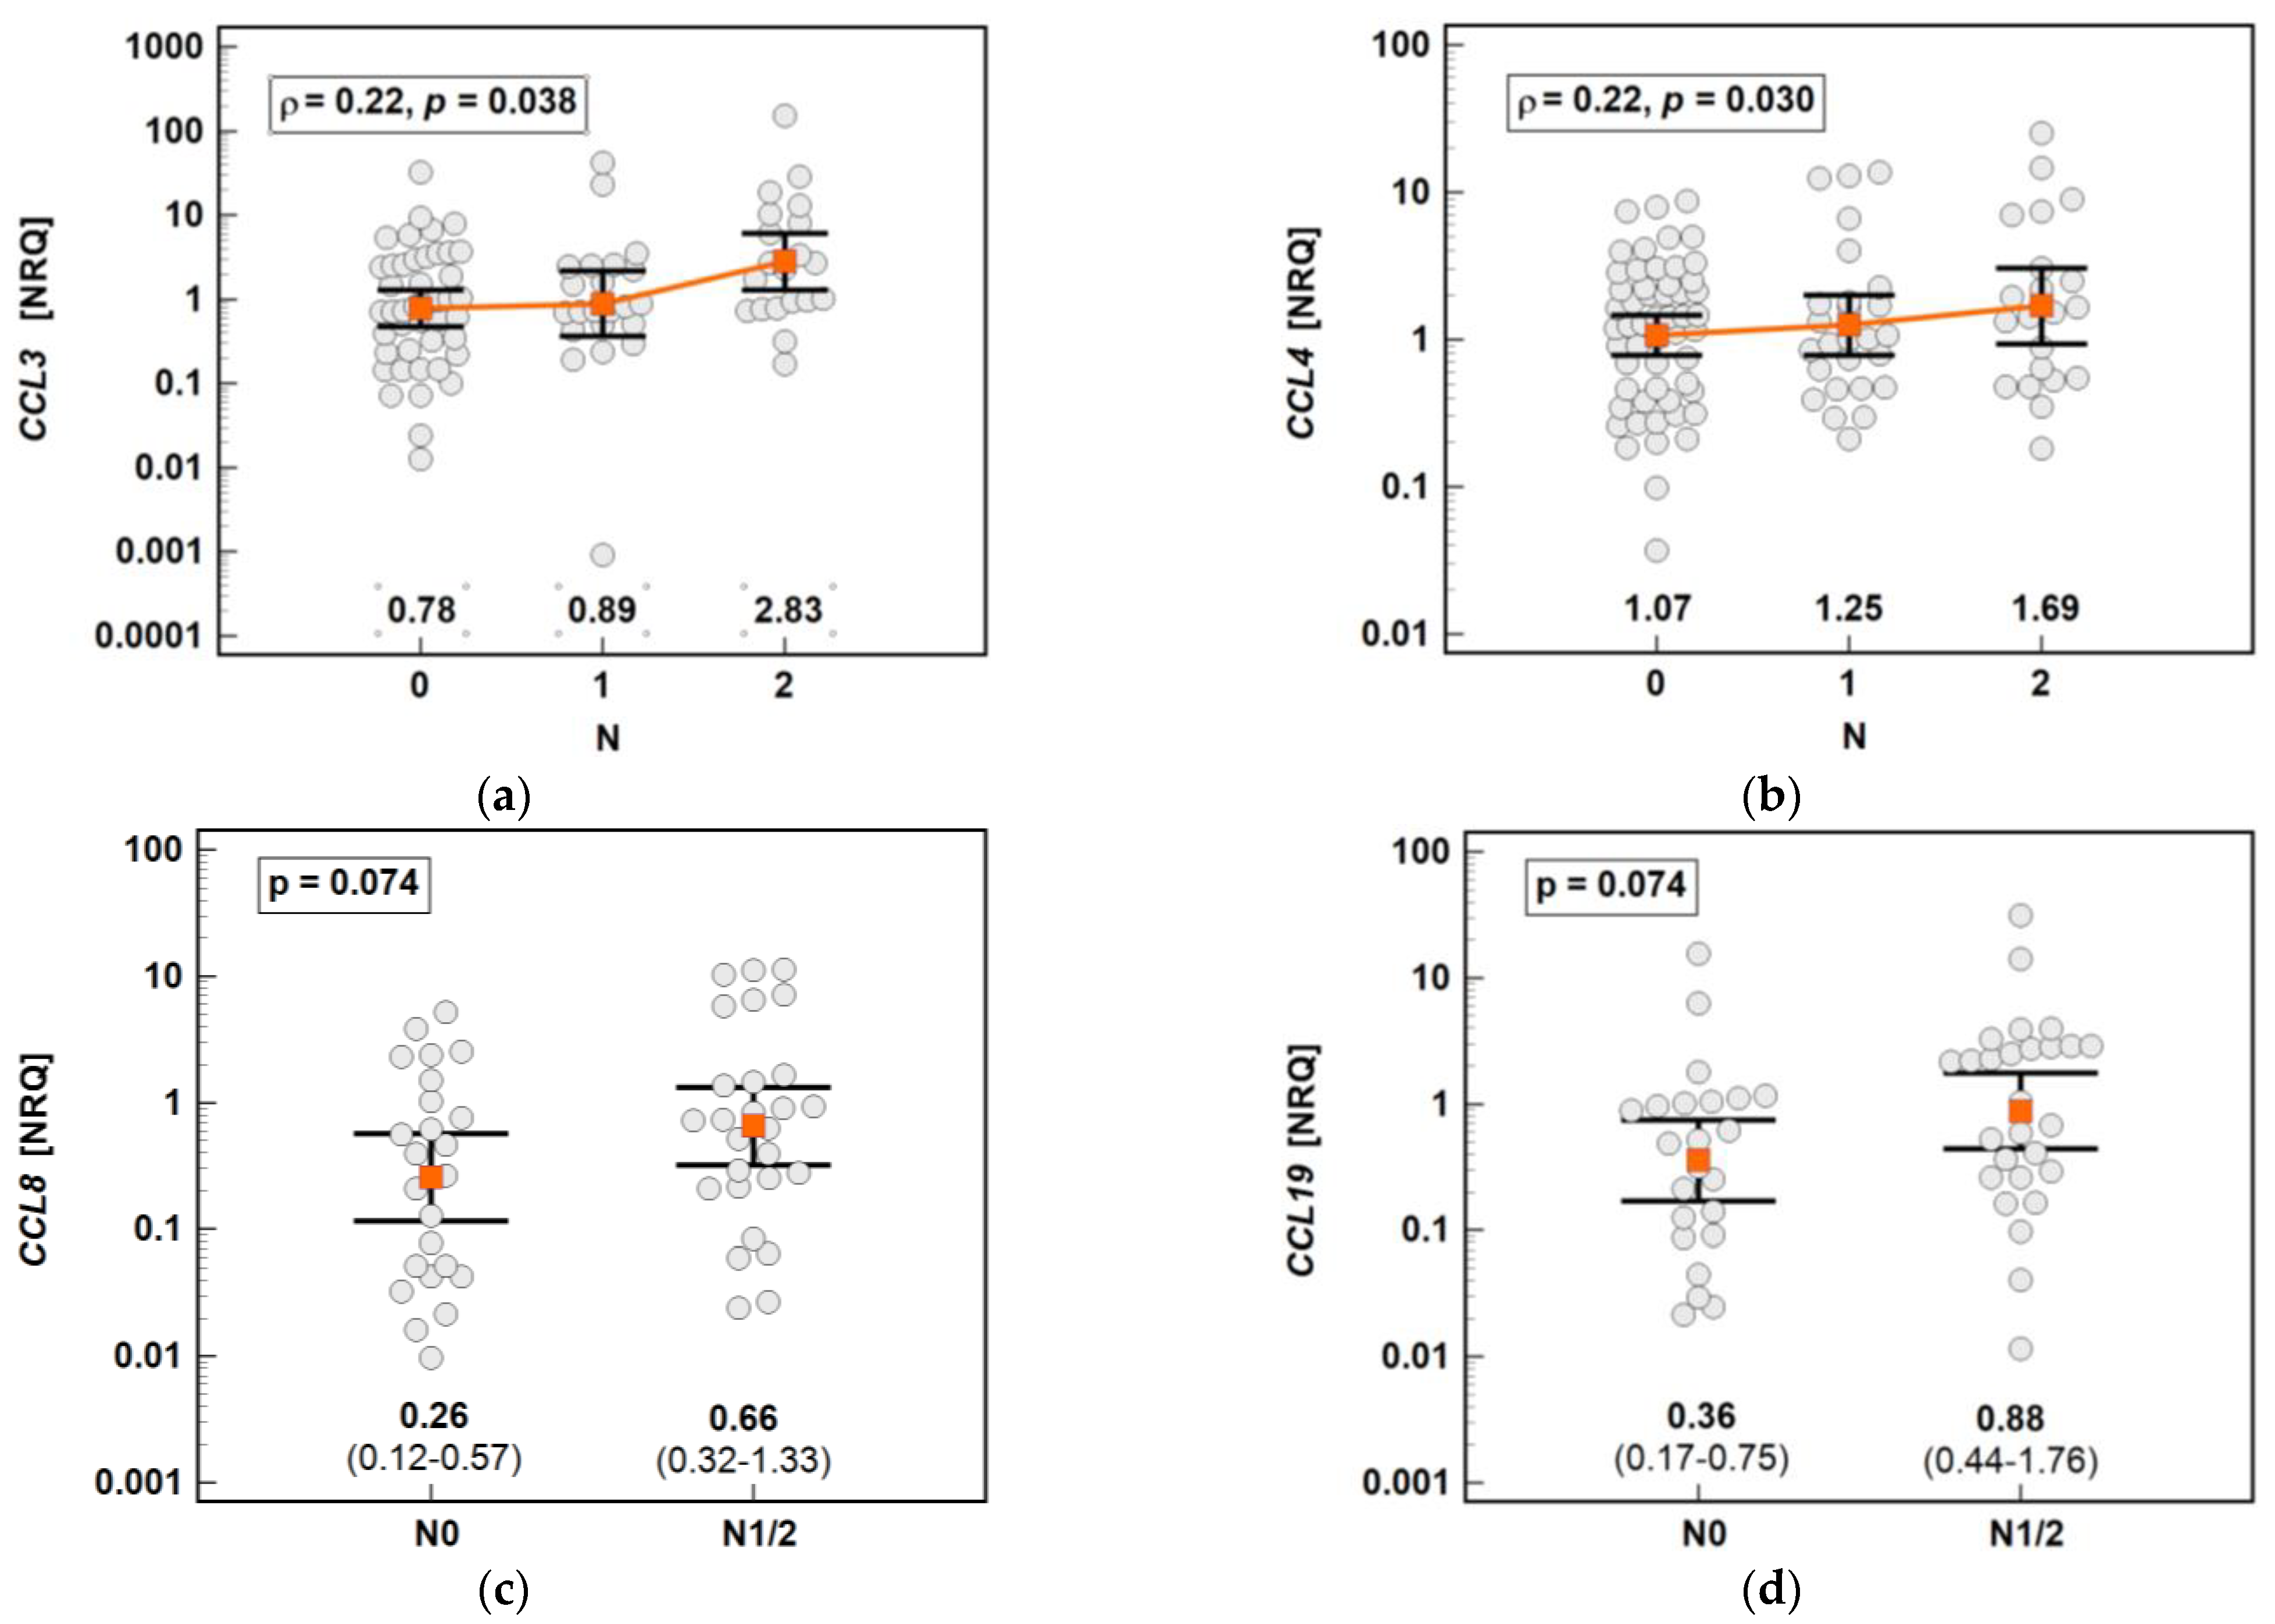
2.8. Impact of Cancer Pathology on Chemokine Expression
2.9. Interrelationship between the Chemokine Expression in the Bowel and Circulating MCPs and MIPs
3. Discussion
4. Materials and Methods
4.1. Patients
4.1.1. Study Population
4.1.2. Biological Material
4.2. In Vitro Studies
4.2.1. Oxicams
4.2.2. Cell Cultures
4.3. Analytical Methods
4.3.1. Transcriptomic Analysis
4.3.2. Protein Analysis
4.3.3. Chemokine Profiling
4.4. Statistical Analysis
5. Conclusions
Author Contributions
Funding
Institutional Review Board Statement
Informed Consent Statement
Data Availability Statement
Acknowledgments
Conflicts of Interest
Sample Availability
References
- Bray, F.; Ferlay, J.; Soerjomataram, I.; Siegel, R.L.; Torre, L.A.; Jemal, A. Global cancer statistics 2018: GLOBOCAN estimates of incidence and mortality worldwide for 36 cancers in 185 countries. CA Cancer J. Clin. 2018, 68, 394–424. [Google Scholar] [CrossRef] [Green Version]
- Mollica Poeta, V.; Massara, M.; Capucetti, A.; Bonecchi, R. Chemokines and chemokine receptors: New targets for cancer immunotherapy. Front. Immunol. 2019, 10, 379. [Google Scholar] [CrossRef] [Green Version]
- Korbecki, J.; Kojder, K.; Simińska, D.; Bohatyrewicz, R.; Gutowska, I.; Chlubek, D.; Baranowska-Bosiacka, I. CC Chemokines in a tumor: A review of pro-cancer and anti-cancer properties of the ligands of receptors CCR1, CCR2, CCR3, and CCR4. Int. J. Mol. Sci. 2020, 21, 8412. [Google Scholar] [CrossRef]
- Korbecki, J.; Grochans, S.; Gutowska, I.; Barczak, K.; Baranowska-Bosiacka, I. CC chemokines in a tumor: A review of pro-cancer and anti-cancer properties of receptors CCR5, CCR6, CCR7, CCR8, CCR9, and CCR10 ligands. Int. J. Mol. Sci. 2020, 21, 7619. [Google Scholar] [CrossRef] [PubMed]
- Cabrero-de Las Heras, S.; Martínez-Balibrea, E. CXC family of chemokines as prognostic or predictive biomarkers and possible drug targets in colorectal cancer. World J. Gastroenterol. 2018, 24, 4738–4749. [Google Scholar] [CrossRef]
- Maniewska, J.; Jeżewska, D. Non-steroidal anti-inflammatory drugs in colorectal cancer chemoprevention. Cancers 2021, 13, 594. [Google Scholar] [CrossRef] [PubMed]
- Finetti, F.; Travelli, C.; Ercoli, J.; Colombo, G.; Buoso, E.; Trabalzini, L. Prostaglandin E2 and cancer: Insight into tumor progression and immunity. Biology 2020, 9, 434. [Google Scholar] [CrossRef]
- Li, Y.; Soendergaard, C.; Bergenheim, F.H.; Aronoff, D.M.; Milne, G.; Riis, L.B.; Seidelin, J.B.; Jensen, K.B.; Nielsen, O.H. COX-2-PGE2 signaling impairs intestinal epithelial regeneration and associates with TNF inhibitor responsiveness in ulcerative colitis. EBioMedicine 2018, 36, 497–507. [Google Scholar] [CrossRef] [PubMed] [Green Version]
- Roelofs, H.M.; Te Morsche, R.H.; van Heumen, B.W.; Nagengast, F.M.; Peters, W.H. Over-expression of COX-2 mRNA in colorectal cancer. BMC Gastroenterol. 2014, 14, 1. [Google Scholar] [CrossRef] [PubMed] [Green Version]
- Sheng, J.; Sun, H.; Yu, F.B.; Li, B.; Zhang, Y.; Zhu, Y.T. The role of cyclooxygenase-2 in colorectal cancer. Int. J. Med. Sci. 2020, 17, 1095–1101. [Google Scholar] [CrossRef]
- Saini, M.K.; Sanya, S.N. Targeting angiogenic pathway for chemoprevention of experimental colon cancer using C-phycocyanin as cyclooxygenase-2 inhibitor. Biochem. Cell Biol. 2014, 92, 206–218. [Google Scholar] [CrossRef] [PubMed]
- Saini, M.K.; Sanya, S.N. Cell cycle regulation and apoptotic cell death in experimental colon carcinogenesis: Intervening with cyclooxygenase-2 inhibitors. Nutr. Cancer 2015, 67, 620–636. [Google Scholar] [CrossRef] [PubMed]
- Meyskens, F.L., Jr.; McLaren, C.E.; Pelot, D.; Fujikawa-Brooks, S.; Carpenter, P.M.; Hawk, E.; Kelloff, G.; Lawson, M.J.; Kidao, J.; McCracken, J.; et al. Difluoromethylornithine plus sulindac for the prevention of sporadic colorectal adenomas: A randomized placebo-controlled, double-blind trial. Cancer Prev. Res. 2008, 1, 32–38. [Google Scholar] [CrossRef] [PubMed] [Green Version]
- Burke, C.A.; Dekker, E.; Samadder, N.J.; Stoffel, E.; Cohen, A. Efficacy and safety of eflornithine (CPP-1X)/sulindac combination therapy versus each as monotherapy in patients with familial adenomatous polyposis (FAP): Design and rationale of a randomized, double-blind, Phase III trial. BMC Gastroenterol. 2016, 16, 87. [Google Scholar] [CrossRef] [Green Version]
- Hull, M.A.; Gardner, S.H.; Hawcroft, G. Activity of the non-steroidal anti-inflammatory drug indomethacin against colorectal cancer. Cancer Treat. Rev. 2003, 29, 309–320. [Google Scholar] [CrossRef]
- Zappavigna, S.; Cossu, A.M.; Grimaldi, A.; Bocchetti, M.; Ferraro, G.A.; Nicoletti, G.F.; Filosa, R.; Caraglia, M. Anti-inflammatory drugs as anticancer agents. Int. J. Mol. Sci. 2020, 21, 2605. [Google Scholar] [CrossRef] [PubMed] [Green Version]
- Galisteo, A.; Jannus, F.; García-García, A.; Aheget, H.; Rojas, S.; Lupiañez, J.A.; Rodríguez-Diéguez, A.; Reyes-Zurita, F.J.; Quílez Del Moral, J.F. Diclofenac N-derivatives as therapeutic agents with anti-inflammatory and anti-cancer effect. Int. J. Mol. Sci. 2021, 22, 5067. [Google Scholar] [CrossRef]
- Wong, R.S.Y. Role of nonsteroidal anti-inflammatory drugs (NSAIDs) in cancer prevention and cancer promotion. Adv. Pharmacol. Pharm. Sci. 2019, 2019, 3418975. [Google Scholar] [CrossRef] [PubMed] [Green Version]
- Bjarnason, I.; Scarpignato, C.; Holmgren, E.; Olszewski, M.; Rainsford, K.D.; Lanas, A. Mechanisms of damage to the gastrointestinal tract from nonsteroidal anti-inflammatory drugs. Gastroenterology 2018, 154, 500–514. [Google Scholar] [CrossRef] [Green Version]
- Xu, S.; Rouzer, C.A.; Marnett, L.J. Oxicams, a class of nonsteroidal anti-inflammatory drugs and beyond. IUBMB Life 2014, 66, 803–811. [Google Scholar] [CrossRef]
- Vartiainen, N.; Huang, C.Y.; Salminen, A.; Goldsteins, G.; Chan, P.H.; Koistinaho, J. Piroxicam and NS-398 rescue neurones from hypoxia/reoxygenation damage by a mechanism independent of cyclo-oxygenase inhibition. J. Neurochem. 2001, 76, 480–489. [Google Scholar] [CrossRef] [PubMed]
- Szczuka, I.; Wierzbicki, J.; Serek, P.; Szczęśniak-Sięga, B.M.; Krzystek-Korpacka, M. Heat shock proteins HSPA1 and HSP90AA1 are upregulated in colorectal polyps and can be targeted in cancer cells by anti-inflammatory oxicams with arylpiperazine pharmacophore and benzoyl moiety substitutions at thiazine ring. Biomolecules 2021, 11, 1588. [Google Scholar] [CrossRef]
- Guo, S.; Wharton, W.; Moseley, P.; Shi, H. Heat shock protein 70 regulates cellular redox status by modulating glutathione-related enzyme activities. Cell Stress Chaperones 2007, 12, 245–254. [Google Scholar] [CrossRef] [PubMed]
- Szczęśniak-Sięga, B.M.; Mogilski, S.; Wiglusz, R.J.; Janczak, J.; Maniewska, J.; Malinka, W.; Filipek, B. Synthesis and pharmacological evaluation of novel arylpiperazine oxicams derivatives as potent analgesics without ulcerogenicity. Bioorg. Med. Chem. 2019, 27, 1619–1628. [Google Scholar] [CrossRef]
- Krzystek-Korpacka, M.; Szczęśniak-Sięga, B.; Szczuka, I.; Fortuna, P.; Zawadzki, M.; Kubiak, A.; Mierzchała-Pasierb, M.; Fleszar, M.G.; Lewandowski, Ł.; Serek, P.; et al. L-arginine/nitric oxide pathway is altered in colorectal cancer and can be modulated by novel derivatives from oxicam class of non-steroidal anti-inflammatory drugs. Cancers 2020, 12, 2594. [Google Scholar] [CrossRef]
- Szczęśniak-Sięga, B.; Gębczak, K.; Gębarowski, T.; Maniewska, J. Synthesis, COX-1/2 inhibition and antioxidant activities of new oxicam analogues designed as potential chemopreventive agents. Acta Biochim. Pol. 2018, 65, 199–207. [Google Scholar] [CrossRef]
- Gurpinar, E.; Grizzle, W.E.; Piazza, G.A. NSAIDs inhibit tumorigenesis, but how? Clin. Cancer Res. 2014, 20, 1104–1113. [Google Scholar] [CrossRef] [PubMed] [Green Version]
- Gurpinar, E.; Grizzle, W.E.; Piazza, G.A. COX-independent mechanisms of cancer chemoprevention by anti-inflammatory drugs. Front. Oncol. 2013, 3, 181. [Google Scholar] [CrossRef] [Green Version]
- Kaduševičius, E. Novel applications of NSAIDs: Insight and future perspectives in cardiovascular, neurodegenerative, diabetes and cancer disease therapy. Int. J. Mol. Sci. 2021, 22, 6637. [Google Scholar] [CrossRef]
- Chan, T.A. Nonsteroidal anti-inflammatory drugs, apoptosis, and colon-cancer chemoprevention. Lancet Oncol. 2002, 3, 166–174. [Google Scholar] [CrossRef]
- Pantziarka, P.; Verbaanderd, C.; Sukhatme, V.; Rica Capistrano, I.; Crispino, S.; Gyawali, B.; Rooman, I.; Van Nuffel, A.M.; Meheus, L.; Sukhatme, V.P.; et al. ReDO_DB: The repurposing drugs in oncology database. Ecancermedicalscience 2018, 12, 886. [Google Scholar] [CrossRef] [PubMed] [Green Version]
- Saini, M.K.; Vaiphei, K.; Sanyal, S.N. Chemoprevention of DMH-induced rat colon carcinoma initiation by combination administration of piroxicam and C-phycocyanin. Mol. Cell Biochem. 2012, 361, 217–228. [Google Scholar] [CrossRef]
- Calaluce, R.; Earnest, D.L.; Heddens, D.; Einspahr, J.G.; Roe, D.; Bogert, C.L.; Marshall, J.R.; Alberts, D.S. Effects of piroxicam on prostaglandin E2 levels in rectal mucosa of adenomatous polyp patients: A randomized phase IIb trial. Cancer Epidemiol. Biomark. Prev. 2000, 9, 1287–1292. [Google Scholar]
- Geller, M.A.; Bui-Nguyen, T.M.; Rogers, L.M.; Ramakrishnan, S. Chemotherapy induces macrophage chemoattractant protein-1 production in ovarian cancer. Int. J. Gynecol. Cancer 2010, 20, 918–925. [Google Scholar] [CrossRef]
- Hatnapure, G.D.; Keche, A.P.; Rodge, A.H.; Birajdar, S.S.; Tale, R.H.; Kamble, V.M. Synthesis and biological evaluation of novel piperazine derivatives of flavone as potent anti-inflammatory and antimicrobial agent. Bioorg. Med. Chem. Lett. 2012, 22, 6385–6390. [Google Scholar] [CrossRef] [PubMed]
- Dogruer, D.; Kupeli, E.; Yesilada, E.; Sahin, M.F. Synthesis of new 2-[1(2H)-Phthalazinon-2-yl]-acetamide and 3-[1(2H)-Phthalazinon-2-yl]-propanamide derivatives as antinociceptive and anti-inflammatory agents. Arch. Pharm. Med. Chem. 2004, 337, 303–310. [Google Scholar] [CrossRef] [PubMed]
- Bravatà, V.; Minafra, L.; Forte, G.I.; Cammarata, F.P.; Russo, G.; Di Maggio, F.M.; Augello, G.; Lio, D.; Gilardi, M.C. Cytokine profile of breast cell lines after different radiation doses. Int. J. Radiat. Biol. 2017, 93, 1217–1226. [Google Scholar] [CrossRef]
- Tang, S.; Yuan, X.; Song, J.; Chen, Y.; Tan, X.; Li, Q. Association analyses of the JAK/STAT signaling pathway with the progression and prognosis of colon cancer. Oncol. Lett. 2019, 17, 159–164. [Google Scholar] [CrossRef] [Green Version]
- Bieche, I.; Chavey, C.; Andrieu, C.; Busson, M.; Vacher, S.; Le, C.L.; Guinebretiere, J.M.; Burlinchon, S.; Lidereau, R.; Lazennec, G. CXC chemokines located in the 4q21 region are up-regulated in breast cancer. Endocr. Relat. Cancer 2007, 14, 1039–1052. [Google Scholar] [CrossRef] [PubMed] [Green Version]
- Gupta, V.; Yeo, G.; Kawakubo, H.; Rangnekar, V.; Ramaswamy, P.; Hayashida, T.; MacLaughlin, D.T.; Donahoe, P.K.; Maheswaran, S. Mullerian-inhibiting substance induces Gro-beta expression in breast cancer cells through a nuclear factor-kappaBdependent and Smad1-dependent mechanism. Cancer Res. 2007, 67, 2747–2756. [Google Scholar] [CrossRef] [Green Version]
- Cao, Y.; Chen, C.; Weatherbee, J.A.; Tsang, M.; Folkman, J. Grobeta, a -C-X-C- chemokine, is an angiogenesis inhibitor that suppresses the growth of Lewis lung carcinoma in mice. J. Exp. Med. 1995, 182, 2069–2077. [Google Scholar] [CrossRef] [Green Version]
- Matsuo, N.; Azuma, K.; Sasada, T. Assessment of soluble immune mediators as potential biomarkers during immune checkpoint inhibitor therapy. Oncotarget 2019, 10, 1866–1867. [Google Scholar] [CrossRef]
- Cuenca, R.E.; Azizkhan, R.G.; Haskill, S. Characterization of GRO alpha, beta and gamma expression in human colonic tumours: Potential significance of cytokine involvement. Surg. Oncol. 1992, 1, 323–329. [Google Scholar] [CrossRef]
- McLean, M.H.; Murray, G.I.; Stewart, K.N.; Norrie, G.; Mayer, C.; Hold, G.L.; Thomson, J.; Fyfe, N.; Hope, M.; Mowat, N.A.; et al. The inflammatory microenvironment in colorectal neoplasia. PLoS ONE 2011, 6, e15366. [Google Scholar] [CrossRef] [PubMed] [Green Version]
- Doll, D.; Keller, L.; Maak, M.; Boulesteix, A.L.; Siewert, J.R.; Holzmann, B.; Janssen, K.P. Differential expression of the chemokines GRO-2, GRO-3, and interleukin-8 in colon cancer and their impact on metastatic disease and survival. Int. J. Colorectal Dis. 2010, 25, 573–581. [Google Scholar] [CrossRef] [PubMed]
- Baek, S.J.; Wilson, L.C.; Lee, C.H.; Eling, T.E. Dual function of nonsteroidal anti-inflammatory drugs (NSAIDs): Inhibition of cyclooxygenase and induction of NSAID-activated gene. J. Pharmacol. Exp. Ther. 2002, 301, 1126–1131. [Google Scholar] [CrossRef] [Green Version]
- Moon, Y. NSAID-activated gene 1 and its implications for mucosal integrity and intervention beyond NSAIDs. Pharmacol. Res. 2017, 121, 122–128. [Google Scholar] [CrossRef] [PubMed]
- Eling, T.E.; Baek, S.J.; Shim, M.; Lee, C.H. NSAID activated gene (NAG-1), a modulator of tumorigenesis. J. Biochem. Mol. Biol. 2006, 39, 649–655. [Google Scholar] [CrossRef] [Green Version]
- Yoshioka, H.; Kamitani, H.; Watanabe, T.; Eling, T.E. Nonsteroidal anti-inflammatory drug-activated gene (NAG-1/GDF15) expression is increased by the histone deacetylase inhibitor trichostatin A. J. Biol. Chem. 2008, 283, 33129–33137. [Google Scholar] [CrossRef] [Green Version]
- Choi, H.J.; Do, K.H.; Park, J.H.; Kim, J.; Yu, M.; Park, S.H.; Moon, Y. Early epithelial restitution by nonsteroidal anti-inflammatory drug-activated gene 1 counteracts intestinal ulcerative injuries. J. Immunol. 2016, 197, 1415–1424. [Google Scholar] [CrossRef] [Green Version]
- Hong, Q.; Li, B.; Cai, X.; Lv, Z.; Cai, S.; Zhong, Y.; Wen, B. Transcriptomic analyses of the adenoma-carcinoma sequence identify hallmarks associated with the onset of colorectal cancer. Front. Oncol. 2021, 11, 704531. [Google Scholar] [CrossRef] [PubMed]
- Yang, C.; Chen, D.; Huang, K.; Zhang, H.; Xu, D.; Tian, Y.; Zhang, J. The expression of chemokine MCP-1 in colorectal carcinoma and its relationship to the infiltration of macrophage. Chin. Ger. J. Clin. Oncol. 2006, 5, 343–346. [Google Scholar] [CrossRef]
- Bailey, C.; Negus, R.; Morris, A.; Ziprin, P.; Goldin, R.; Allavena, P.; Peck, D.; Darzi, A. Chemokine expression is associated with the accumulation of tumour associated macrophages (TAMs) and progression in human colorectal cancer. Clin. Exp. Metastasis 2007, 24, 121–130. [Google Scholar] [CrossRef] [PubMed]
- Yoshidome, H.; Kohno, H.; Shida, T.; Kimura, F.; Shimizu, H.; Ohtsuka, M.; Nakatani, Y.; Miyazaki, M. Significance of monocyte chemoattractant protein-1 in angiogenesis and survival in colorectal liver metastases. Int. J. Oncol. 2009, 34, 923–930. [Google Scholar] [CrossRef] [Green Version]
- Wolf, M.J.; Hoos, A.; Bauer, J.; Boettcher, S.; Knust, M.; Weber, A.; Simonavicius, N.; Schneider, C.; Lang, M.; Sturzl, M.; et al. Endothelial CCR2 signaling induced by colon carcinoma cells enables extravasation via the JAK2-Stat5 and p38MAPK pathway. Cancer Cell 2012, 22, 91–105. [Google Scholar] [CrossRef] [Green Version]
- Chu, S.; Wang, H.; Yu, M. A putative molecular network associated with colon cancer metastasis constructed from microarray data. World J. Surg. Oncol. 2017, 15, 115. [Google Scholar] [CrossRef] [PubMed] [Green Version]
- Xu, M.; Wang, S.; Qi, Y.; Chen, L.; Frank, J.A.; Yang, X.H.; Zhang, Z.; Shi, X.; Luo, J. Role of MCP-1 in alcohol-induced aggressiveness of colorectal cancer cells. Mol. Carcinog. 2016, 55, 1002–1011. [Google Scholar] [CrossRef] [Green Version]
- Diakowska, D.; Krzystek-Korpacka, M. Local and systemic interleukin-32 in esophageal, gastric, and colorectal cancers: Clinical and diagnostic significance. Diagnostics 2020, 10, 785. [Google Scholar] [CrossRef]
- Bednarz-Misa, I.; Fortuna, P.; Fleszar, M.G.; Lewandowski, Ł.; Diakowska, D.; Rosińczuk, J.; Krzystek-Korpacka, M. Esophageal squamous cell carcinoma is accompanied by local and systemic changes in L-arginine/NO pathway. Int. J. Mol. Sci. 2020, 21, 6282. [Google Scholar] [CrossRef]
- Lewandowska, P.; Wierzbicki, J.; Zawadzki, M.; Agrawal, A.; Krzystek-Korpacka, M. Biphasic expression of atypical chemokine receptor (ACKR) 2 and ACKR4 in colorectal neoplasms in association with histopathological findings. Biomolecules 2020, 11, 8. [Google Scholar] [CrossRef]
- Patel, A.; Tripathi, G.; Gopalakrishnan, K.; Williams, N.; Arasaradnam, R.P. Field cancerisation in colorectal cancer: A new frontier or pastures past? World J. Gastroenterol. 2015, 21, 3763–3772. [Google Scholar] [CrossRef]
- Lee, J.M.; Han, Y.D.; Cho, M.S.; Hur, H.; Min, B.S.; Lee, K.Y.; Kim, N.K. Impact of tumor sidedness on survival and recurrence patterns in colon cancer patients. Ann. Surg. Treat. Res. 2019, 96, 296–304. [Google Scholar] [CrossRef] [Green Version]
- Farmaki, E.; Chatzistamou, I.; Kaza, V.; Kiaris, H. A CCL8 gradient drives breast cancer cell dissemination. Oncogene 2016, 35, 6309–6318. [Google Scholar] [CrossRef]
- McClellan, J.L.; Davis, J.M.; Steiner, J.L.; Enos, R.T.; Jung, S.H.; Carson, J.A.; Pena, M.M.; Carnevale, K.A.; Berger, F.G.; Murphy, E.A. Linking tumor-associated macrophages, inflammation, and intestinal tumorigenesis: Role of MCP-1. Am. J. Physiol. Gastrointest. Liver Physiol. 2012, 303, G1087–G1095. [Google Scholar] [CrossRef] [Green Version]
- Song, M.; Sasazuki, S.; Camargo, M.C.; Shimazu, T.; Charvat, H.; Yamaji, T.; Sawada, N.; Kemp, T.J.; Pfeiffer, R.M.; Hildesheim, A. Circulating inflammatory markers and colorectal cancer risk: A prospective case-cohort study in Japan. Int. J. Cancer 2018, 143, 2767–2776. [Google Scholar] [CrossRef] [Green Version]
- Popivanova, B.K.; Kostadinova, F.I.; Furuichi, K.; Shamekh, M.M.; Kondo, T.; Wada, T.; Egashira, K.; Mukaida, N. Blockade of a chemokine, CCL2, reduces chronic colitis-associated carcinogenesis in mice. Cancer Res. 2009, 69, 7884–7892. [Google Scholar] [CrossRef] [PubMed] [Green Version]
- Lu, J.; Zhao, J.; Feng, H.; Wang, P.; Zhang, Z.; Zong, Y.; Ma, J.; Zheng, M.; Lu, A. Antitumor efficacy of CC motif chemokine ligand 19 in colorectal cancer. Dig. Dis. Sci. 2014, 59, 2153–2162. [Google Scholar] [CrossRef] [PubMed]
- Xu, Z.; Zhu, C.; Chen, C.; Zong, Y.; Feng, H.; Liu, D.; Feng, W.; Zhao, J.; Lu, A. CCL19 suppresses angiogenesis through promoting miR-206 and inhibiting Met/ERK/Elk-1/HIF-1α/VEGF-A pathway in colorectal cancer. Cell Death Dis. 2018, 9, 974. [Google Scholar] [CrossRef] [PubMed] [Green Version]
- Chen, L.; Lu, D.; Sun, K.; Xu, Y.; Hu, P.; Li, X.; Xu, F. Identification of biomarkers associated with diagnosis and prognosis of colorectal cancer patients based on integrated bioinformatics analysis. Gene 2019, 692, 119–125. [Google Scholar] [CrossRef]
- Liu, X.; Wang, B.; Li, Y.; Hu, Y.; Li, X.; Yu, T.; Ju, Y.; Sun, T.; Gao, X.; Wei, Y. Powerful anticolon tumor effect of targeted gene immunotherapy using folate-modified nanoparticle delivery of CCL19 to activate the immune system. ACS Cent. Sci. 2019, 5, 277–289. [Google Scholar] [CrossRef] [PubMed]
- Lu, J.; Ma, J.; Cai, W.; Wangpu, X.; Feng, H.; Zhao, J.; Guan, S.; Zong, Y.; Lu, A. CC motif chemokine ligand 19 suppressed colorectal cancer in vivo accompanied by an increase in IL-12 and IFN-γ. Biomed. Pharmacother. 2015, 69, 374–379. [Google Scholar] [CrossRef]
- De la Fuente López, M.; Landskron, G.; Parada, D.; Dubois-Camacho, K.; Simian, D.; Martinez, M.; Romero, D.; Roa, J.C.; Chahuán, I.; Gutiérrez, R.; et al. The relationship between chemokines CCL2, CCL3, and CCL4 with the tumor microenvironment and tumor-associated macrophage markers in colorectal cancer. Tumor Biol. 2018, 40. [Google Scholar] [CrossRef] [PubMed] [Green Version]
- Krzystek-Korpacka, M.; Diakowska, D.; Kapturkiewicz, B.; Bębenek, M.; Gamian, A. Profiles of circulating inflammatory cytokines in colorectal cancer (CRC), high cancer risk conditions, and health are distinct. Possible implications for CRC screening and surveillance. Cancer Lett. 2013, 337, 107–114. [Google Scholar] [CrossRef]
- Nishikawa, G.; Kawada, K.; Nakagawa, J.; Toda, K.; Ogawa, R.; Inamoto, S.; Mizuno, R.; Itatani, Y.; Sakai, Y. Bone marrow-derived mesenchymal stem cells promote colorectal cancer progression via CCR5. Cell Death Dis. 2019, 10, 264. [Google Scholar] [CrossRef] [PubMed] [Green Version]
- Liao, Y.Y.; Tsai, H.C.; Chou, P.Y.; Wang, S.W.; Chen, H.T.; Lin, Y.M.; Chiang, I.P.; Chang, T.M.; Hsu, S.K.; Chou, M.C.; et al. CCL3 promotes angiogenesis by dysregulation of miR-374b/VEGF-A axis in human osteosarcoma cells. Oncotarget 2016, 7, 4310–4325. [Google Scholar] [CrossRef] [PubMed] [Green Version]
- Pender, S.L.; Chance, V.; Whiting, C.V.; Buckley, M.; Edwards, M.; Pettipher, R.; MacDonald, T.T. Systemic administration of the chemokine macrophage inflammatory protein 1alpha exacerbates inflammatory bowel disease in a mouse model. Gut 2005, 54, 1114–1120. [Google Scholar] [CrossRef] [Green Version]
- Sasaki, S.; Baba, T.; Shinagawa, K.; Matsushima, K.; Mukaida, N. Crucial involvement of the CCL3-CCR5 axis-mediated fibroblast accumulation in colitis-associated carcinogenesis in mice. Int. J. Cancer 2014, 135, 1297–1306. [Google Scholar] [CrossRef] [PubMed] [Green Version]
- Väyrynen, J.P.; Kantola, T.; Väyrynen, S.A.; Klintrup, K.; Bloigu, R.; Karhu, T.; Mäkelä, J.; Herzig, K.H.; Karttunen, T.J.; Tuomisto, A.; et al. The relationships between serum cytokine levels and tumor infiltrating immune cells and their clinical significance in colorectal cancer. Int. J. Cancer 2016, 139, 112–121. [Google Scholar] [CrossRef]
- Slattery, M.L.; Mullany, L.E.; Sakoda, L.; Samowitz, W.S.; Wolff, R.K.; Stevens, J.R.; Herrick, J.S. The NF-κB signalling pathway in colorectal cancer: Associations between dysregulated gene and miRNA expression. J. Cancer Res. Clin. Oncol. 2018, 144, 269–283. [Google Scholar] [CrossRef] [Green Version]
- Allen, F.; Bobanga, I.D.; Rauhe, P.; Barkauskas, D.; Teich, N.; Tong, C.; Myers, J.; Huang, A.Y. CCL3 augments tumor rejection and enhances CD8+ T cell infiltration through NK and CD103+ dendritic cell recruitment via IFNγ. Oncoimmunology 2017, 7, e1393598. [Google Scholar] [CrossRef] [PubMed] [Green Version]
- Luo, X.; Yu, Y.; Liang, A.; Xie, Y.; Liu, S.; Guo, J.; Wang, W.; Qi, R.; An, H.; Zhang, M.; et al. Intratumoral expression of MIP-1beta induces antitumor responses in a pre-established tumor model through chemoattracting T cells and NK cells. Cell Mol. Immunol. 2004, 1, 199–204. [Google Scholar] [PubMed]
- Krzyżak, E.; Szczęśniak-Sięga, B.; Malinka, W. Synthesis and thermal behaviour of new benzo-1,2-thiazine long-chain aryl-piperazine derivatives. J. Therm. Anal. Calorim. 2014, 115, 793–802. [Google Scholar] [CrossRef] [Green Version]
- Szczęśniak-Sięga, B.; Maniewska, J.; Poła, A.; Środa-Pomianek, K.; Malinka, W.; Michalak, K. Synthesis of new Piroxicam derivatives and their influence on lipid bilayers. Acta Pol. Pharm. Drug Res. 2014, 71, 1045–1050. [Google Scholar]
- Maniewska, J.; Szczęśniak-Sięga, B.; Poła, A.; Środa-Pomianek, K.; Malinka, W.; Michalak, K. The interaction of new piroxicam analogues with lipid bilayers—A calorimetric and fluorescence spectroscopic study. Acta Pol. Pharm. Drug Res. 2014, 71, 1004–1012. [Google Scholar] [CrossRef]
- Hellemans, J.; Vandesompele, J. qPCR data analysis—Unlocking the secret to successful results. In PCR Troubleshooting and Optimization: The Essential Guide, 1st ed.; Kennedy, S., Oswald, N., Eds.; Caister Academic Press: Poole, UK, 2011; pp. 1–13. [Google Scholar]
- Krzystek-Korpacka, M.; Diakowska, D.; Bania, J.; Gamian, A. Expression stability of common housekeeping genes is differently affected by bowel inflammation and cancer: Implications for finding suitable normalizers for inflammatory bowel disease studies. Inflamm. Bowel Dis. 2014, 20, 1147–1156. [Google Scholar] [CrossRef]
- Krzystek-Korpacka, M.; Hotowy, K.; Czapinska, E.; Podkowik, M.; Bania, J.; Gamian, A.; Bednarz-Misa, I. Serum availability affects expression of common house-keeping genes in colon adenocarcinoma cell lines: Implications for quantitative real-time PCR studies. Cytotechnology 2016, 68, 2503–2517. [Google Scholar] [CrossRef] [PubMed] [Green Version]
- Krzystek-Korpacka, M.; Zawadzki, M.; Lewandowska, P.; Szufnarowski, K.; Bednarz-Misa, I.; Jacyna, K.; Witkiewicz, W.; Gamian, A. Distinct chemokine dynamics in early postoperative period after open and robotic colorectal surgery. J. Clin. Med. 2019, 8, 879. [Google Scholar] [CrossRef] [PubMed] [Green Version]
- Krzystek-Korpacka, M.; Zawadzki, M.; Kapturkiewicz, B.; Lewandowska, P.; Bednarz-Misa, I.; Gorska, S.; Witkiewicz, W.; Gamian, A. Subsite heterogeneity in the profiles of circulating cytokines in colorectal cancer. Cytokine 2018, 110, 435–441. [Google Scholar] [CrossRef]


| Chemokines | Gene | N | Adjacent [NRQ] | Tumor [NRQ] | Fold Change in Tumors | p Value |
|---|---|---|---|---|---|---|
| MCP | CCL2 | 101 | 1.44 (1.11–1.87) | 0.68 (0.50–0.91) | ↓ 2.1 (1.5–3.1) | 0.0001 |
| CCL7 | 86 | 0.90 (0.70–1.17) | 0.91 (0.66–1.25) | 1 (0.7–1.4) | 0.963 | |
| CCL8 | 51 | 2.13 (1.64–2.75) | 0.42 (0.25–0.71) | ↓ 5.1 (2.8–9.0) | <0.0001 | |
| MIP | CCL3 | 86 | 0.82 (0.61–1.10) | 1.09 (0.74–1.60) | ↑ 1.3 (0.9–2.0) | 0.171 |
| CCL4 | 101 | 0.87 (0.71–1.07) | 1.23 (0.97–1.55) | ↑ 1.4 (1.1–2.0) | 0.022 | |
| CCL19 | 51 | 1.29 (0.85–1.94) | 0.58 (0.35–0.96) | ↓ 2.2 (1.3–3.8) | 0.005 | |
| CXCL2 | 51 | 0.75 (0.54–1.05) | 1.50 (0.95–2.36) | ↑ 2.0 (1.3–3.10) | 0.003 |
| Gene | CCL3 | CCL4 | CCL7 | CCL8 | CCL19 | CXCL2 | |
|---|---|---|---|---|---|---|---|
| CCL2 | N | ns | 0.78 1 | ns | 0.60 3 | ns | ns |
| A | 0.30 3 | 0.54 1 | 0.36 2 | 0.35 3 | ns | 0.55 1 | |
| T | 0.44 1 | 0.57 1 | 0.76 1 | 0.89 1 | 0.46 2 | 0.36 3 | |
| CCL3 | N | ns | ns | ns | ns | ns | |
| A | 0.44 1 | ns | ns | ns | 0.47 2 | ||
| T | 0.56 1 | 0.37 2 | 0.69 1 | 0.33 4 | 0.53 1 | ||
| CCL4 | N | 0.58 3 | 0.66 3 | ns | ns | ||
| A | 0.25 4 | ns | ns | 0.36 3 | |||
| T | 0.53 1 | 0.49 2 | 0.45 2 | ns | |||
| CCL7 | N | 0.57 3 | ns | ns | |||
| A | 0.27 4 | ns | 0.27 4 | ||||
| T | 0.83 1 | 0.29 4 | 0.39 3 | ||||
| CCL8 | N | ns | ns | ||||
| A | ns | ns | |||||
| T | 0.40 3 | 0.40 3 | |||||
| CCL19 | N | ns | |||||
| A | −0.40 3 | ||||||
| T | ns |
| Parameter | Characteristics | ||
|---|---|---|---|
| CCL2/CCL4 | CCL3/CCL7 | CCL8/CCL19/CXCL2 | |
| Number of patients, n | 101 | 86 | 51 |
| Sex distribution [F/M], n | 37/64 | 31/55 | 21/30 |
| Age [years], mean (95% CI) | 67.4 (65.3–69.5) | 67.5 (65.3–69.7) | 67.5 (64.5–70.5) |
| Cancer TNM stage [0/I/II/III/IV], n | 8/11/33/41/8 | 8/11/23/36/8 | 8/5/11/23/4 |
| Depth of tumor invasion [Tis/T2/T3/T4], n | 8/18/48/27 | 8/17/38/23 | 8/8/27/8 |
| Lymph node metastasis [N0/N1/N2], n | 54/26/21 | 44/22/20 | 24/14/13 |
| Distant metastasis [M0/M1], n | 93/8 | 78/8 | 47/4 |
| Histological grade [G1/G2/G3/x], n | 12/58/10/21 | 11/52/10/13 | 10/34/7/0 |
| Primary tumor location, n: | |||
| left colon | 32 | 26 | 17 |
| right colon | 36 | 28 | 17 |
| rectum | 33 | 32 | 17 |
| Oxicam | Structure |
|---|---|
| Piroxicam (#6) |  |
| Meloxicam (#7) |  |
| Compound #1 |  |
| Compound #2 |  |
| Compound #3 |  |
| Compound #4 |  |
| Compound #5 |  |
| Symbol | Encoded Protein | Sequence (5′→3′) | Size [bp] |
|---|---|---|---|
| PPIA1 | Peptidylprolyl isomerase A | F: ggcaaatgctggacccaacaca R: tgctggtcttgccattcctgga | 161 |
| RPLP01 | Ribosomal protein, large, P0 | F: tcacaacaagcataccaagaagc R: gtatccgatgtccacaatgtcaag | 263 |
| GAPDH2 | Glyceraldehyde-3-phosphate dehydrogenase | F: tagattattctctgatttggtcgtattgg R: gctcctggaagatggtgatgg | 223 |
| CCL22 | Monocyte chemotactic protein (MCP)-1 | F: tctgtgcctgctgctcatag R: acttgctgctggtgattcttc | 155 |
| CCL31 | Macrophage inflammatory protein (MIP)-1 α | F: actttgagacgagcagccagtg R: tttctggacccactcctcactg | 101 |
| CCL41 | Macrophage inflammatory protein (MIP)-1 β | F: ggtcatacacgtactcctggac R: gcttcctcgcaactttgtggtag | 140 |
| CCL71 | Monocyte chemotactic protein (MCP)-3 | F: acagaaggaccaccagtagcca R: ggtgcttcataaagtcctggacc | 117 |
| CCL81 | Monocyte chemotactic protein (MCP)-2 | F: tatccagaggctggagagctac R: tggaatccctgacccatctctc | 128 |
| CXCL21 | Macrophage inflammatory protein (MIP)-2 | F: ggcagaaagcttgtctcaaccc R: ctccttcaggaacagccaccaa | 127 |
| CCL191 | Macrophage inflammatory protein (MIP)-3 β | F: cgtgaggaacttccactaccttc R: gtctctggatgatgcgttctacc | 131 |
| NAG11 | Nonsteroidal anti-inflammatory drug-activated gene (also known as growth differentiation factor (GDF)-15 and macrophage inhibitory cytokine (MIC)-1) | F: caaccagagctgggaagattcg R: cccgagagatacgcaggtgca | 116 |
| NFKBIA1 | Nuclear factor of kappa light polypeptide gene enhancer in B-cells inhibitor, alpha (IκBα) | F: tccactccatcctgaaggctac R: caaggacaccaaaagctccacg | 101 |
| MYD881 | Myeloid differentiation factor 88 (MyD88) | F: gaggctgagaagcctttacagg R: gcagatgaaggcatcgaaacgc | 129 |
| RELA1 | Nuclear factor of kappa light polypeptide gene enhancer in B-cells, p65 subunit | F: tgaaccgaaactctggcagctg R: catcagcttgcgaaaaggagcc | 135 |
Publisher’s Note: MDPI stays neutral with regard to jurisdictional claims in published maps and institutional affiliations. |
© 2021 by the authors. Licensee MDPI, Basel, Switzerland. This article is an open access article distributed under the terms and conditions of the Creative Commons Attribution (CC BY) license (https://creativecommons.org/licenses/by/4.0/).
Share and Cite
Lewandowska, P.; Szczuka, I.; Bednarz-Misa, I.; Szczęśniak-Sięga, B.M.; Neubauer, K.; Mierzchała-Pasierb, M.; Zawadzki, M.; Witkiewicz, W.; Krzystek-Korpacka, M. Modulating Properties of Piroxicam, Meloxicam and Oxicam Analogues against Macrophage-Associated Chemokines in Colorectal Cancer. Molecules 2021, 26, 7375. https://doi.org/10.3390/molecules26237375
Lewandowska P, Szczuka I, Bednarz-Misa I, Szczęśniak-Sięga BM, Neubauer K, Mierzchała-Pasierb M, Zawadzki M, Witkiewicz W, Krzystek-Korpacka M. Modulating Properties of Piroxicam, Meloxicam and Oxicam Analogues against Macrophage-Associated Chemokines in Colorectal Cancer. Molecules. 2021; 26(23):7375. https://doi.org/10.3390/molecules26237375
Chicago/Turabian StyleLewandowska, Paulina, Izabela Szczuka, Iwona Bednarz-Misa, Berenika M. Szczęśniak-Sięga, Katarzyna Neubauer, Magdalena Mierzchała-Pasierb, Marek Zawadzki, Wojciech Witkiewicz, and Małgorzata Krzystek-Korpacka. 2021. "Modulating Properties of Piroxicam, Meloxicam and Oxicam Analogues against Macrophage-Associated Chemokines in Colorectal Cancer" Molecules 26, no. 23: 7375. https://doi.org/10.3390/molecules26237375