3.1. Acid–Base Properties of L-glutamic-N,N-diacetic Acid
The acid–base properties of the L-glutamic-N,N-diacetic acid were obtained in the molar concentration scale at different ionic strengths, temperatures and various ionic media. Conditional protonation constant values were then converted to a molal concentration scale as reported in the experimental section. As the amount of data is too large, the full record of the values obtained, both in the molar and in the molal concentration scales, is reported as
Supplementary Materials (Table S1).
The data analysis, according to all models mentioned, was performed using the protonation constants reported in this work at different temperatures and ionic strengths in aqueous NaCl, KCl, and (C
2H
5)
4NI solutions and those already published by Bretti et al. [
43] at 298.15 K in aqueous NaCl, (CH
3)
4NCl and (C
2H
5)
4NI at
I ≤ 2.134 mol kg
−1. This last choice was required to fit protonation data as in Equation (9), with the consideration that the term
f(
I) is linear, whereas Bretti et al. [
43] used a two-parameter approach.
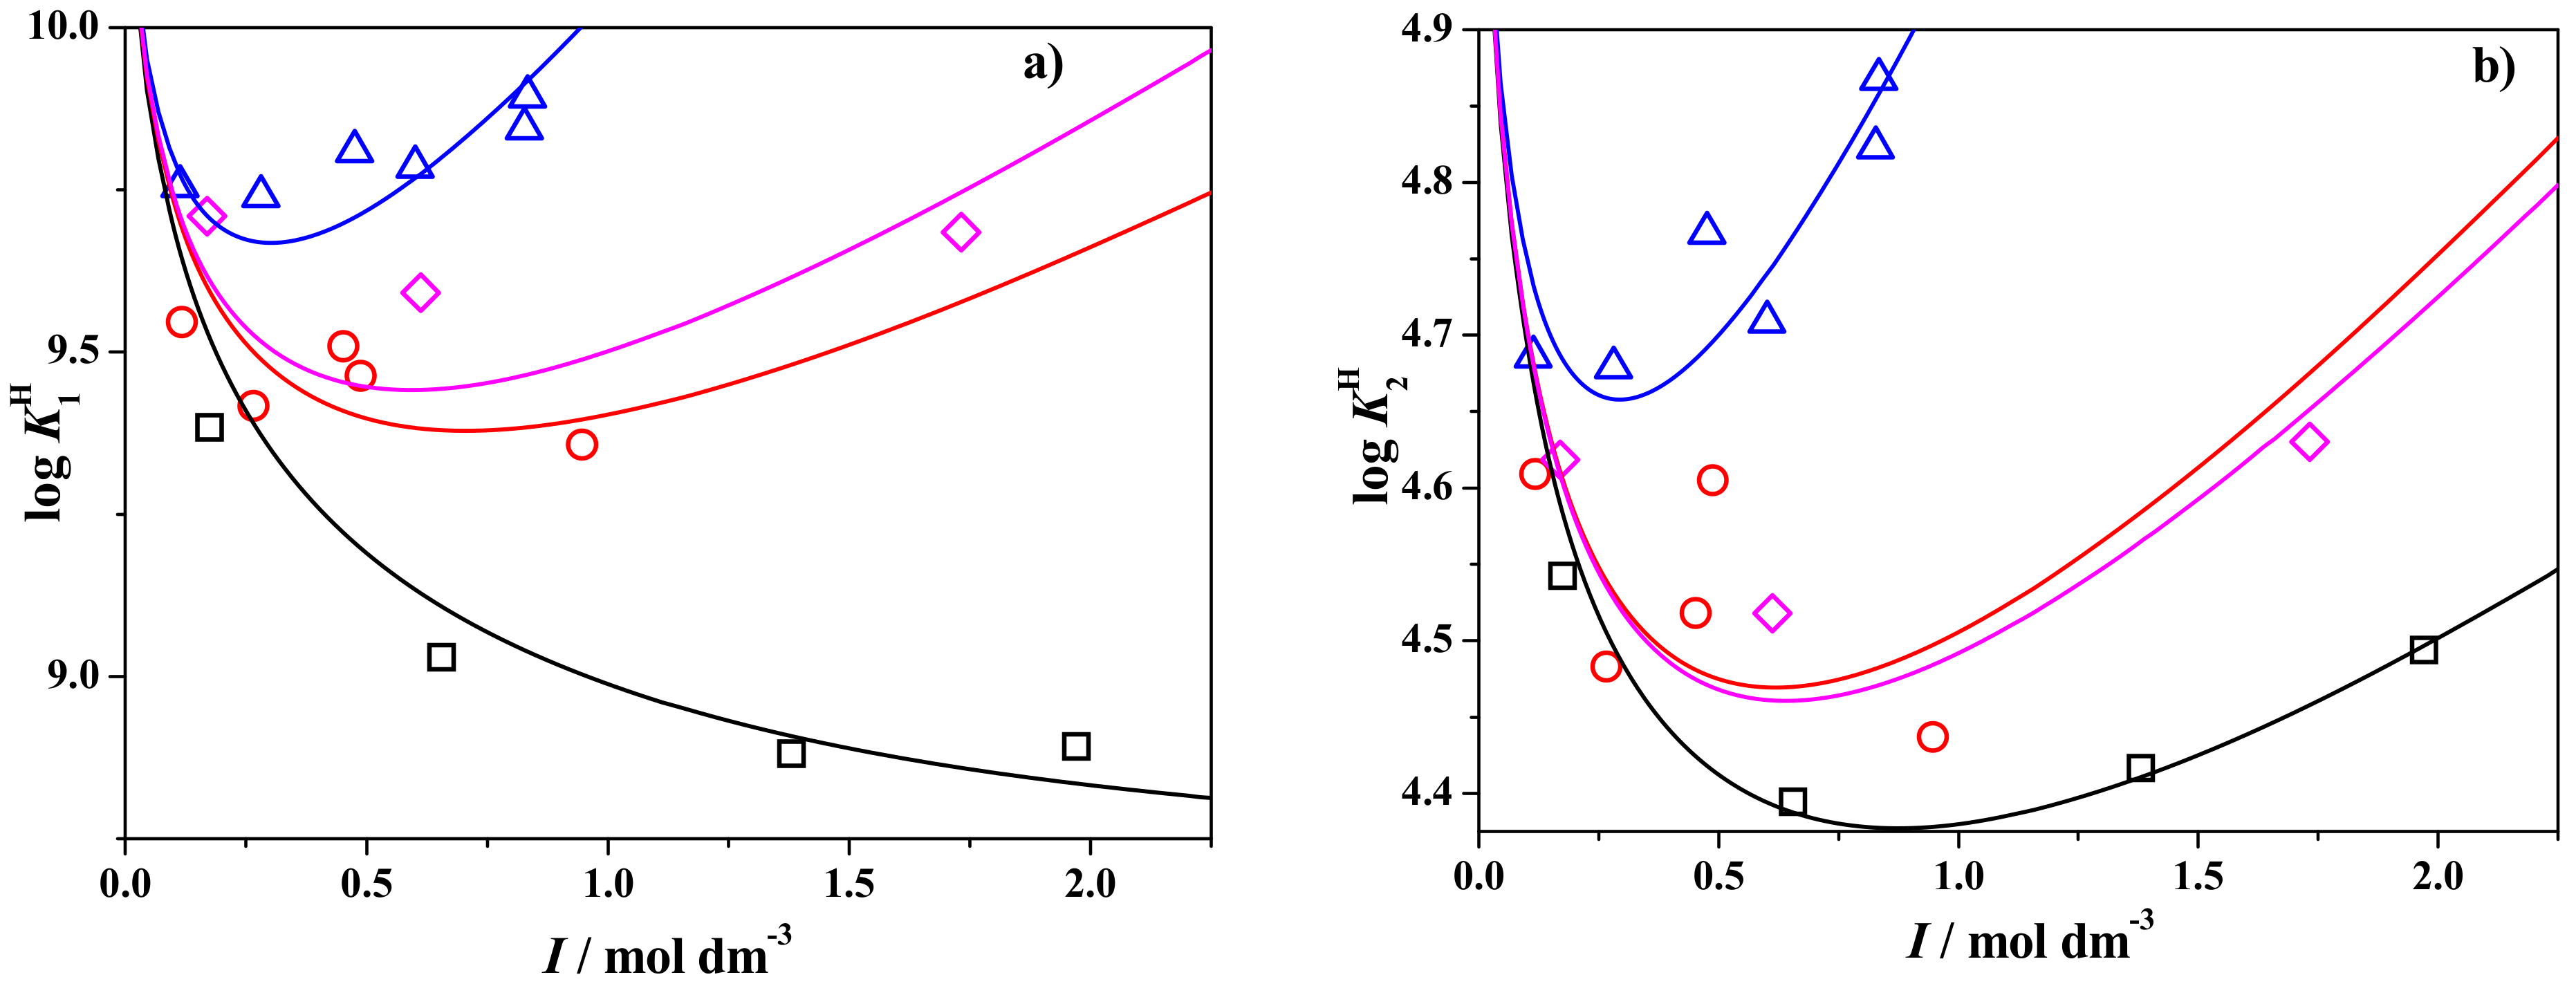
The trend observed for the protonation constants values, especially regarding the HL and H
2L species, is reported in
Figure 1 and it traces what has already been discussed by Bretti et al. [
43] as values in (C
2H
5)
4NI are higher than those in (CH
3)
4NCl, which in turn, is higher than KCl and NaCl. This behavior indicates that sodium cation can interact with the fully deprotonated and the monoprotonated GLDA anion more when compared to the potassium cation and tetramethylammonium, whereas tetraethylammonium seems to be the cation less able to interact among those used as the background electrolyte. The continuous line depicted in
Figure 1 represents the fitting to the EDH model.
For the H3L and H4L species, whose values are much lower compared to the first two protonation constants, the trend is less evident.
The trend discussed is well-established regarding log
KH1 with relevant differences among ionic media, i.e., the whole stability constant values are spread within one order of magnitude in terms of the protonation constant. Contrarily, differences among log
KH2 (
Figure 1b) are less important and in some cases, such as in the comparison between KCl and (CH
3)
4NCl, are within the experimental errors.
Once the protonation constants, both in the molar and in the molal concentration scales are provided, the data analysis was performed with the EDH, SIT and pure water model approaches. Regarding the EDH and SIT approaches, the whole set of conditional protonation constants (
Table S2) was fitted to Equation (17) and a set of parameters useful for calculating the protonation constants of GLDA at any value of temperature and ionic strength within the experimental domain was obtained (
Table 3). During this fitting procedure, the values of the protonation constants at infinite dilution and
T = θ = 298.15 K (log
) were fixed in accordance with those already published by Bretti et al. [
43].
The parameters reported in
Table 3 show some trends, for example, the values of
Ci within the same ionic medium decrease with increasing the number of protons of the species. The only exception to this trend is represented by the
C1 reported for NaCl
aq.
Regarding the values of protonation enthalpy changes, the value found for the first step, namely
= (−11.6 ± 1.4) kJ mol
−1, is slightly less negative compared to other values reported in the literature for the interaction of a proton with a ternary amine; for example,
= −25 kJ mol
−1 for methylglycindiacetic acid [
44],
= −19 kJ mol
−1 for risedronic acid [
45],
= −23 kJ mol
−1 for ethylenediaminetetracetic acid [
46] and
= −19 kJ mol
−1 for nitrilotriacetic acid was found [
46]. Compared to the parent glutamic acid molecule [
47], the protonation constant at infinite dilution of
Glda4− is slightly higher (log
= 10.56 and 10.01, for
Glda4− and glutamate, respectively), whereas the protonation enthalpy is significantly lower (
= −12 and −40, same order), resulting in different thermodynamic behavior for proton binding, being enthalpically-driven for glutamate and entropically-driven for
Glda4−.
Using the data listed in
Table 3 in the molal concentration scale, thermodynamic parameters (∆
G0, ∆
H0, and
T∆
S0, in kJ mol
−1) were calculated at different ionic strength values. The data given in
Table 4 reveal that the first (relative to the amino group) and the fourth protonation steps are exothermic in all conditions; the second and the third steps are slightly endothermic at low ionic strength values and tend to become less positive at
I ≥ 0.25 mol kg
−1 or negative in the case of sodium chloride. The contribution to the proton binding is generally entropic in nature for the first, second and third protonation steps in all ionic media and at all ionic strength values. Conversely, the fourth protonation step is enthalpic in nature with this trend even more evident at
I ≥ 0.75 mol kg
−1 in NaCl
aq. Similar behaviors were observed in the literature for molecules with the same functional groups (e.g., [
38,
44]).
Experimental protonation constants (
Table S2) were also analyzed by the “pure water model”. This approach is based on a chemical model, in which the different ionic strength dependence of conditional protonation constants observed in different ionic media are dependent on the chemical interaction taking place between the ligand (L) and the ions of the supporting electrolyte (e.g., NaCl), through the formation of several “weak species”, such as NaL. The aim of this approach is to split the conditional protonation constants to obtain “pure” protonation constants valid in any ionic media and weak species relative to the specific cation or anion interacting with the ligand. The ionic strength dependence of both protonation constants and weak species is a function only of the reaction stoichiometry within a reasonably narrow ionic strength range (0 <
I/mol L
−1 ≤ 1.0). The chemical speciation of a ligand in a multi-component solution must be drawn considering the “pure” protonation constants and the weak species relative to all the components of the solution calculated at the ionic strength of such solution and considering the concentration of all the interacting ions. Theoretical bases about this approach are available in the literature, including the requirements of using the molar concentration scale, both for ionic strength and equilibrium constants [
48,
49], the presence of a background electrolyte not—or very weakly—interacting with the ligand (generally tetraethylammonium iodide), and the ionic strength range not exceeding
I = 1.0 mol dm
−3 [
50,
51,
52,
53]. Some successful examples of applications of this model to other molecules are reported in the literature (e.g., [
44,
45,
54]), where the readers may also find extensive discussion about the fitting ability and the analogy with the hybrid SIT model in terms of the chemical information carried.
As already mentioned, according to the pure water model the ionic strength dependence of the equilibrium constants is just a function of the stoichiometric coefficients and it is described by the following Equation:
where log
K can be the protonation constant (
KH) or the weak complex formation constant (
KMjHiL), log
K0 is the same quantity at infinite dilution,
c0 and
c1 are the ionic strength dependence parameters common to all the species, and z* is given in Equation (8).
Whenever data at different temperatures are available, adjustable parameters of Equation (18) (i.e., log
K0,
c0,
c1) can be written as follows:
where Y
T is the value of the parameters at the temperature
T, Y
θ is the value at the reference temperature θ (298.15 K) and the partial derivative accounts for the temperature dependence. The first derivative parameter originates from the expansion to the Taylor series of the parameter Y approximately at the point θ. For Y = log
K this is the first derivative on the temperature of Equation (13), which in turn corresponds to
divided by R
T2 ln (10) (Equation (21)).
To avoid misinterpretations, protonation constants at infinite dilution were kept fixed to values reported in
Table 3 (in the molar concentration scale) and the value of the partial derivative accounting for the temperature dependence of log
K was obtained dividing the value of
reported in
Table 3 by the value of 1702 (Equation (21)). Moreover, to bypass the correlation between
c0 and
c1 parameters of Equation (18) during the fitting procedure, it was chosen to refine only one of them. Since values of z* are higher than those of p* (see
Table 5), it was preferred to refine
c1 and to fix the value of
c0 at
c0 = 0.165.
The conditional protonation data in the molar concentration scale at different ionic strengths and temperatures and in different ionic media were analyzed with ES2WC software [
30], the best fit was obtained by refining the equilibrium constants of thirteen weak species, namely NaL, Na
2L, NaHL, NaH
2L, NaH
3L, KL, KHL, KH
2L, KH
3L, (CH
3)
4NL, (CH
3)
4NHL, (CH
3)
4NH
2L and (CH
3)
4NH
3L. A summary of all the parameters refined is given in
Table 5.
Data reported in
Table 5 indicate that the ligand anion (L
4−) interaction with the sodium cation is stronger than that with the potassium and tetramethylammonium cations. In fact, the formation constant values of the ML species at infinite dilution are log
K = 2.50, 2.20 and 1.89, respectively. Moreover, for the sodium cation only, the presence of a dinuclear M
2L species was evidenced. The stepwise formation constant value of this species can be obtained by subtracting the value of the NaL from that of the Na
2L, thus, is log
K = 3.01 − 2.50 = 0.51. Similarly, the stepwise formation constant values of the protonated species can be obtained by subtracting the values of the protonation constants from those of the MH
iL species. Values so obtained decrease linearly with the increasing number of the protons of the species, the slopes obtained for the three cations are not statistically different from each other. Additionally, in this case, similar trends have been observed in the literature [
52,
55].
3.2. Interaction of L-glutamic-N,N-diacetic Acid with Cd2+
Interaction of L-glutamic-N,N-diacetic acid with Cd
2+ was studied by means of potentiometric titrations at different ionic strength values and at
T = 298.15 K in aqueous NaCl solutions. The data analysis was performed using the BSTAC4 computer program to analyze titrations carried out at different ionic strength values to obtain the formation constants of the Cd
jH
iL species at infinite dilution together with the relative ionic strength dependence parameters of Equation (9), thus, no experimental data at different ionic strength values are available. During this process, the protonation constants of
Glda4− relative to the NaCl medium were kept fixed to the values reported in
Table 3; the equilibrium constants of the Cd
2+/Cl
− and Cd
2+/OH
− species were taken from [
56]. The results of the data analysis performed in the pH range 2 ≤ pH ≤ 11 are summarized in
Table 6, reporting the formation constant at infinite dilution (log
) of the found species, the ionic strength dependence parameters (
Cij), the maximum of formation of each species (Max (%)) and the pH value at which it was achieved.
The choice of the best speciation model is always a challenging task. In this work, a statistical approach based on the variance ratio and goodness-of-fit (GOF) criteria was used for this purpose. According to Crea et al. [
57], the criteria used to select the chemical model are: (a) the value of the variance ratio among different speciation models; (b) the simplicity of the model (other minor species can be added to the chosen ones but the model becomes unrealistically complicated); (c) the likelihood of the proposed species, in particular, in relation to similar systems.
The mean deviation of the whole fit (i.e., the average deviation of the experimental e.m.f. of each datum point, in absolute value, from the fitted value) is 3.7 mV. This value is acceptable for a complex system, also considering the variable ionic strength and the wide pH range considered.
The speciation model reported in
Table 6 seems to be the most likely for the system under analysis. Together with these species reported, the possible presence of the M
3L species was also tested (log
=21.92 ± 0.05 and C
03 = 2.33 ± 0.11) but the formation percentage reached was significant (~15%) only in a few titrations with a high
CCd:
CGLDA ratio to include it in the final speciation scheme. Moreover, limiting the pH to the acidic range (2.0 < pH < 5.0), several minor species were determined. Some examples of possible speciation schemes refined in the mentioned pH range are reported as
Supplementary Materials (Table S2) and also contain polynuclear species such as M
2H
3L, M
2H
2L
2, M
2H
3L
3, M
3H
2L
2, M
3H
3L
3, M
3H
4L
3, M
3H
2L
4 and M
4H
2L
4. Interestingly, the value of the stability constant of the ML species obtained in such trials is always considerably lower than that refined in the selected speciation scheme because the value was refined in a pH range where the formation of this species never reaches the maximum, thus, is underestimated.
Although their presence in the final speciation scheme was not taken into account, the formation of the M3L and other minor polynuclear species mentioned cannot be excluded. However, considering the stoichiometry of the species, their presence is not fundamental for the assessment of speciation in natural fluids because their formation may occur only in experimental conditions hardly found in nature, namely CCd > CGLDA and total concentrations exceeding 2.0 mmol dm−3. In any case, the identification of polynuclear species is always an interesting task, but dedicated experiments with proper techniques (e.g., ESI-MS) should be performed to confirm or exclude the presence of such species.
The importance of the complex formation constants of the Cd
2+/
Glda4− species is depicted in
Figure 2, where the speciation diagram of the system is given at low ionic strength (
I = 0.05 mol kg
−1, dashed line) and at the ionic strength of seawater (
I = 0.72 mol kg
−1, solid line). At low ionic strength values, the importance of the chloro complexes is marginal so that the complexation with the ligand is more relevant. Moreover, as ionic strength increases the complexation is shifted to more alkaline pH values by ~ 0.5 pH units. In the experimental conditions selected (
CCd = 10
−5 mol kg
−1;
CL = 10
−3 mol kg
−1), the CdH
2L
0(aq) species reach the maximum formation percentages at pH = 2.63 (52 %) and pH = 3.07 (31 %) at
I = 0.05 and 0.72 mol kg
−1, respectively, whereas for CdHL
- it is at pH = 3.92 (74 %) and pH = 4.43 (50 %) in the same conditions. This also applies to the CdL
2− species, but the formation percentage reaches 100 % in both cases, and to the Cd(OH)L
3− species, even if the maximum of formation is not reached in the selected pH range. The Cd
2L
0(aq) species is not formed in these experimental conditions.
Apart from the numerical value of the equilibrium constants, an operational measure to quantify the sequestering ability and, therefore, select the most suitable chelating agent for the sequestration of a given metal cation is required. Many parameters have been proposed and most of them are reviewed by Bazzicalupi et al. [
58] and Gama et al. [
59]. In this work, the sequestering ability of GLDA toward Cd
2+ is assessed by computing pL
0.5. The value of the pL
0.5 represents the antilogarithm of the total ligand concentration required to sequester 50 % of the metal cation present as the trace level in each condition. Crea et al. [
39] pointed out the similarity of pL
0.5 and the Schwarzenbach’s (
Kʹ or apparent,
Kapp) constant; in this light, it is noticeable that the shape of the function reported in
Figure 3 is very similar to that reported in the technical report by AkzoNobel, computed starting from NIST data [
60], for the apparent formation constants (i.e., Schwarzenbach) of other cations with weak hydrolysis, such as Mg
2+ and Ca
2+. However, the use of pL
0.5 has some relevant advantages over the apparent constants, especially in very complex systems. Among them, it is significant that it is easier also to be determined by non-specialist users by means of dedicated computer programs, without any deep knowledge of the treatment of simultaneous equilibria and mass balance equations.
The dependence of pL
0.5 of GLDA toward Cd
2+ on pH at
I = 0.05 (dotted line) and 0.72 (solid line) mol kg
−1 is displayed in
Figure 3. It can be noted that pL
0.5 increases almost linearly with pH at both ionic strength values, inverting the trend at pH ~10 due to the hydrolysis of the Cd
2+ cation. Tracing what was found for the formation percentage of complex species noted in
Figure 2, complexation is generally greater at low ionic strength values; in terms of pL
0.5 it may be noted that values at
I = 0.05 mol kg
−1 are higher than those at
I = 0.72 mol kg
−1 by one or two orders of magnitude. In this context, it should be noted that experimental data were analyzed up to pH = 10; no information about further complex species with stoichiometry M
j(OH)
2L, whose formation occurs at pH > 10, are available, but their presence seems very unlikely in the case of Cd
2+.
3.3. Comparisons with the Literature Data
Minor discrepancies reported for protonation constants have already been discussed, and data are sufficient to assess a robust dependence on temperature and ionic strength.
Regarding the Cd
2+/
Glda4− complex formation constants, direct formation constant comparisons with the ones already published can hardly be made since so few values were reported in the literature, and typically only in a single experimental condition. For example, Begun et al. [
7] indicated the formation of four complex species, namely CdL
2−, CdHL
−, CdH
2L
0aq and Cd(OH)L
3−, in KCl
aq at
I = 0.1 mol dm
−3 and
T = 298.15 K, but all the data were obtained by working in only one experimental condition of equimolar concentration of metal cation and GLDA (1 mmol dm
−3). Although the four cited species were also found in the current work, the formation constant values suffer from some numerical discrepancies likely deriving from the different ionic mediums and, thus, from the different values of the protonation constants used. Moreover, from the distribution diagram reported by Begun et al. [
7], it seems that the Cd
2+/Cl
− species were not considered in the speciation model so that the formation constant values for the Cd
2+/
Glda4− species must be considered as conditional. Besides the mentioned differences in the evaluation of equilibrium constants, distribution diagrams reported in
Figure 2 are comparable to the ones found by Begun et al. [
7] but only if, in our case, the formation percentages of the Cd
2+, CdCl
+ and CdCl
20(aq) are summed up.
By taking from the literature the most reliable data for the interaction of Cd
2+ with some complexones, such as ethylendiaminetetracetic acid (EDTA [
61]), triethylenetetraminehexaacetic acid (TTHA, [
62]), ethylenediamine-N,N’-disuccinic acid (S,S-EDDS, [
63]), N-(2-hydroxyethyl)iminodiacetic acid (HIDA, [
64]), nitrilotriacetic acid (NTA, [
65]), Cyclohexanediaminetetraacetic acid (CDTA, [
60]), diethylenetriaminepentaacetic acid (DTPA, [
66]), ethylene glycol-bis(β-aminoethyl ether)-N,N,N′,N′-tetraacetic acid (EGTA, [
67]) and methylglycindiacetic acid (MGDA, [
68]) the pL
0.5 was computed in the same conditions of temperature (
T = 298.15 K) and ionic strength (
I = 0.1 mol dm
−3) in the pH window of natural waters (4 ≤ pH ≤ 10,
Figure 4). The plots obtained are almost parallel, depending on the protonation constants of the complexone, with a maximum between pH ~9 and pH ~10. Complexones with more binding sites display higher pL
0.5 values, as in the case of TTHA (ten binding sites) and DTPA (eight binding sites). Quite surprisingly, CDTA (with six binding sites) shows the highest pL
0.5 values among all complexones. GLDA, with five binding sites and depicted with a solid line, has an average value between MGDA (four binding sites) and EGTA (six binding sites). Interestingly, among the new generation biodegradable chelants, namely MGDA, NTA, EDDS and HIDA, GLDA achieves the highest pL
0.5 value.


 ,
, 


