
Comprehensive Characterisation of the Ketoprofen-β-Cyclodextrin Inclusion Complex Using X-ray Techniques and NMR Spectroscopy

 , , and
Abstract
:
1. Introduction
2. Materials and Methods
2.1. Materials
2.2. Preparation of Complexes
2.2.1. Co-Precipitation (1)
2.2.2. Evaporation (2)
2.2.3. Heating-under-Reflux (3)
2.3. XRPD Studies
2.3.1. Obtaining of Single Crystals
2.3.2. X-ray Single-Crystal Technique
2.4. NMR Studies
2.4.1. Instrumentation
2.4.2. Methodology
2.4.3. Calculating Binding Constants from the Diffusion Coefficients
3. Results and Discussion
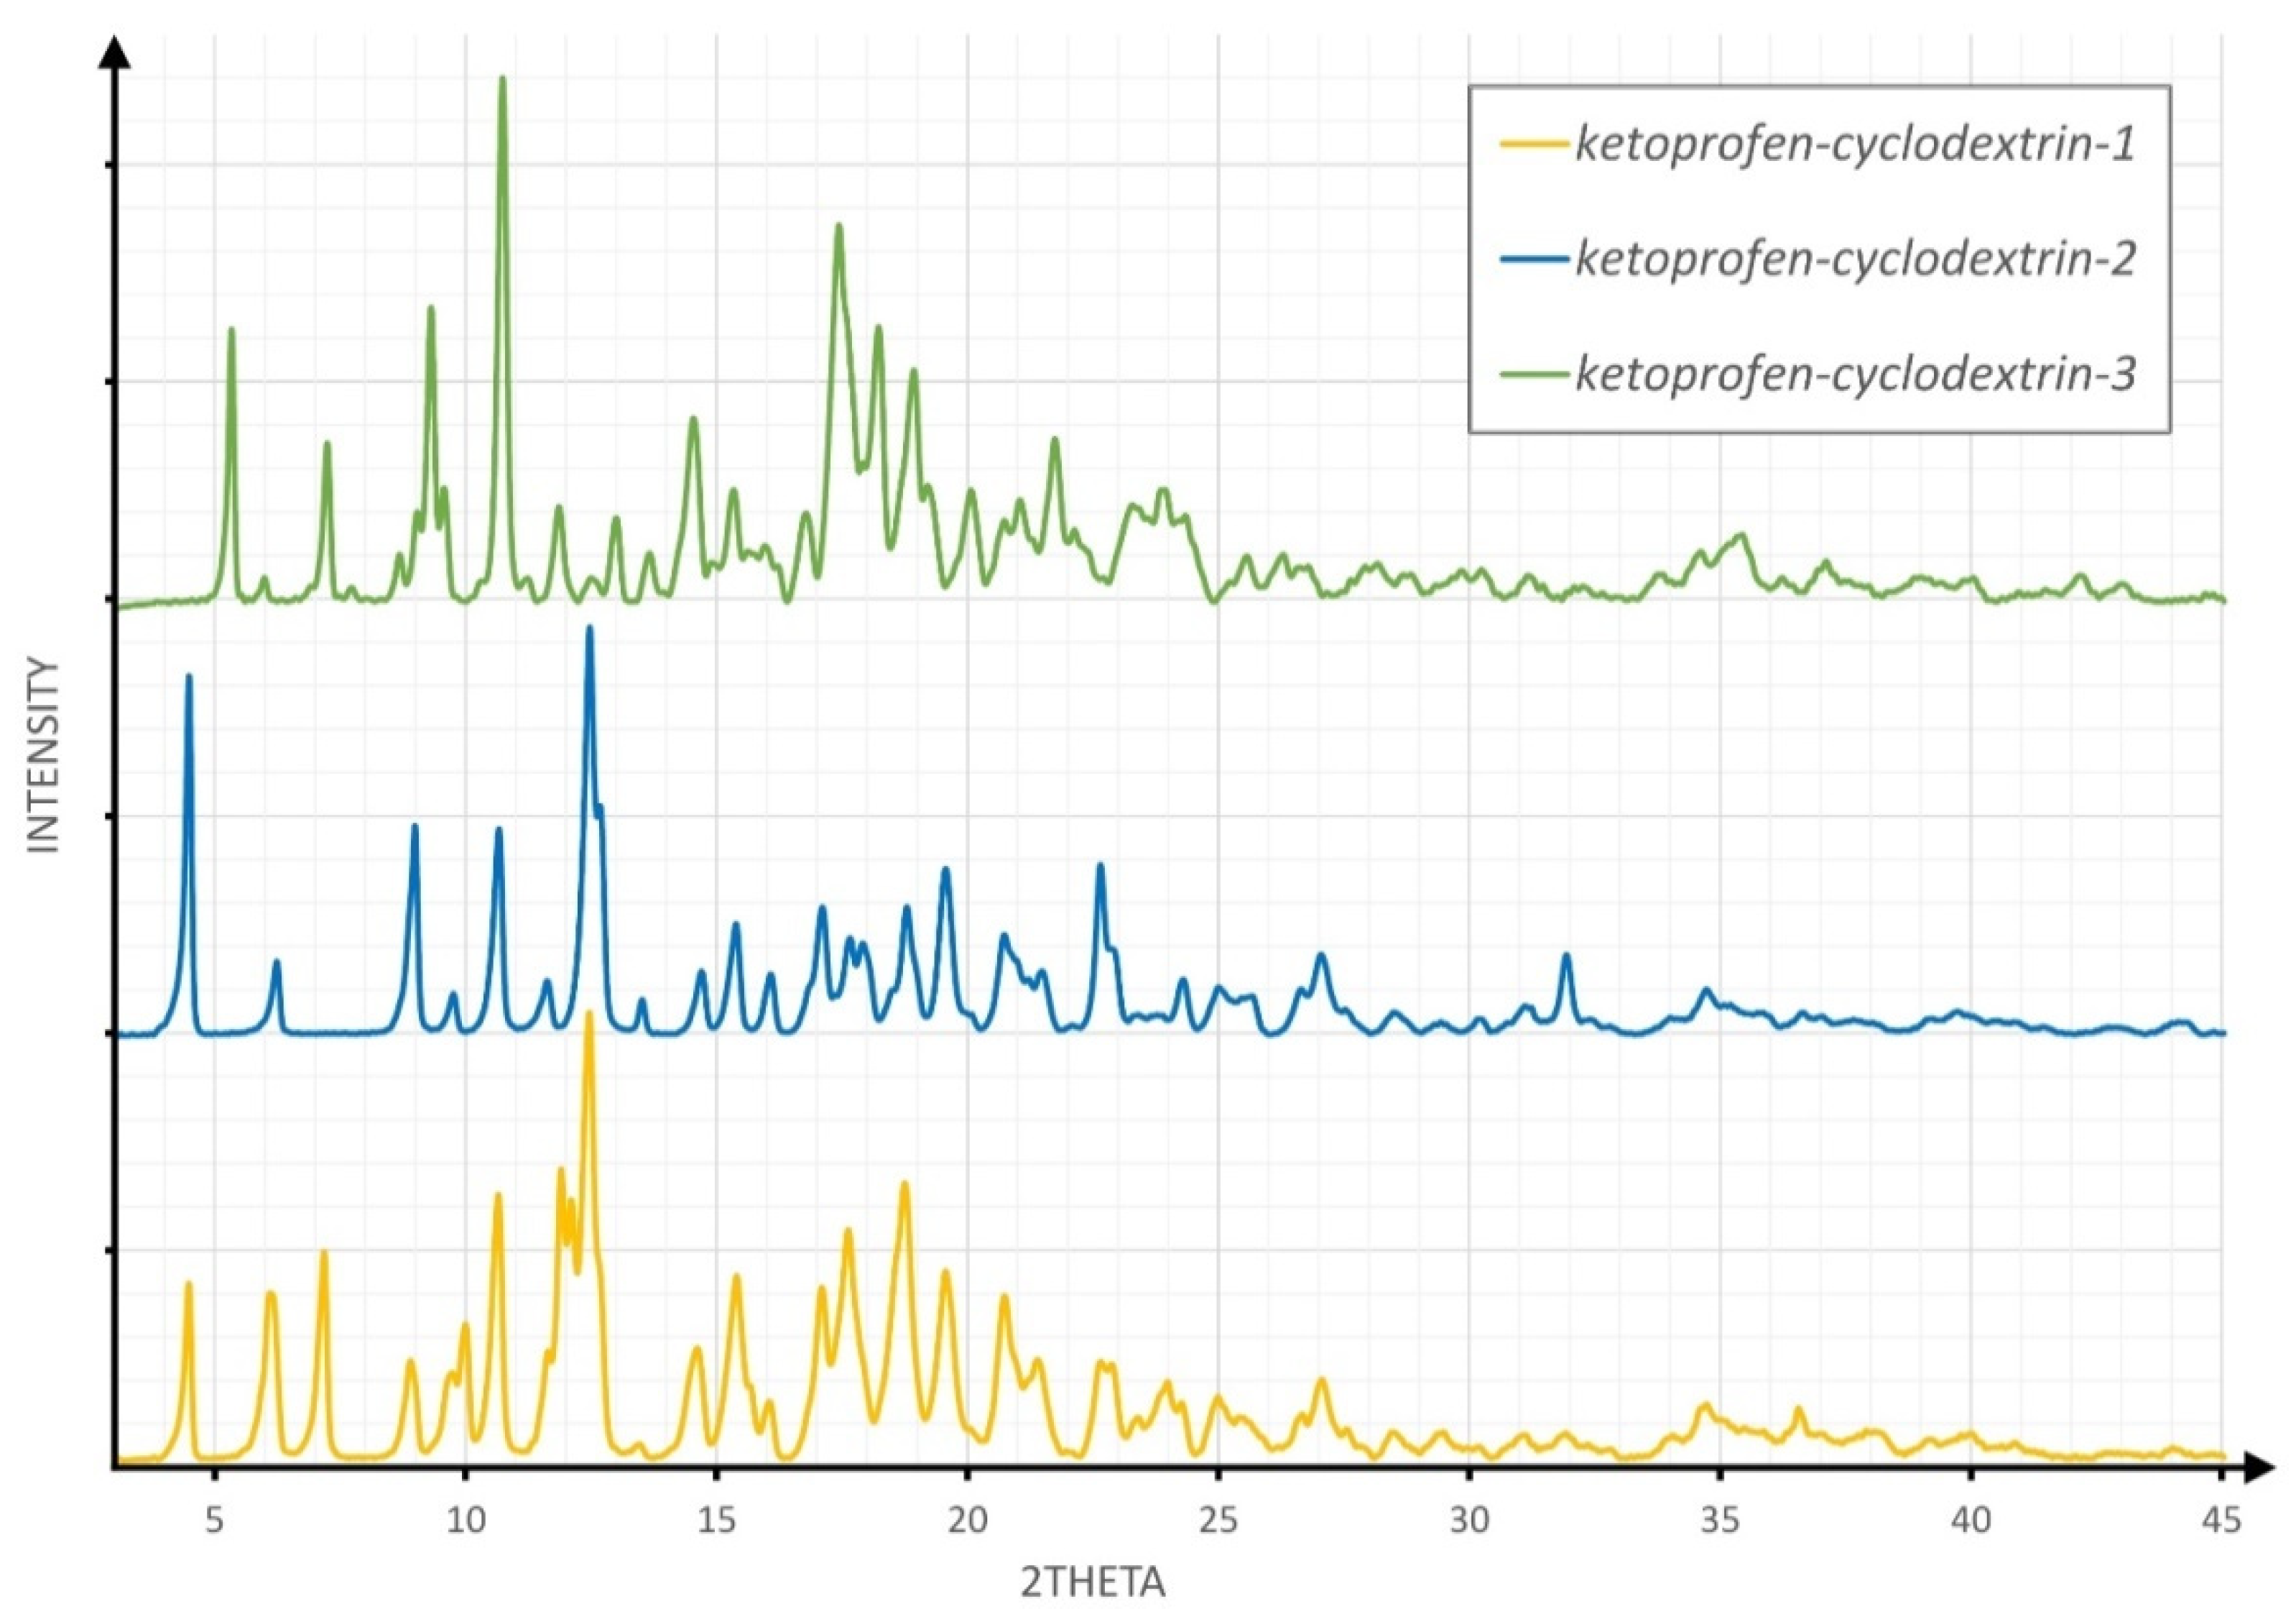
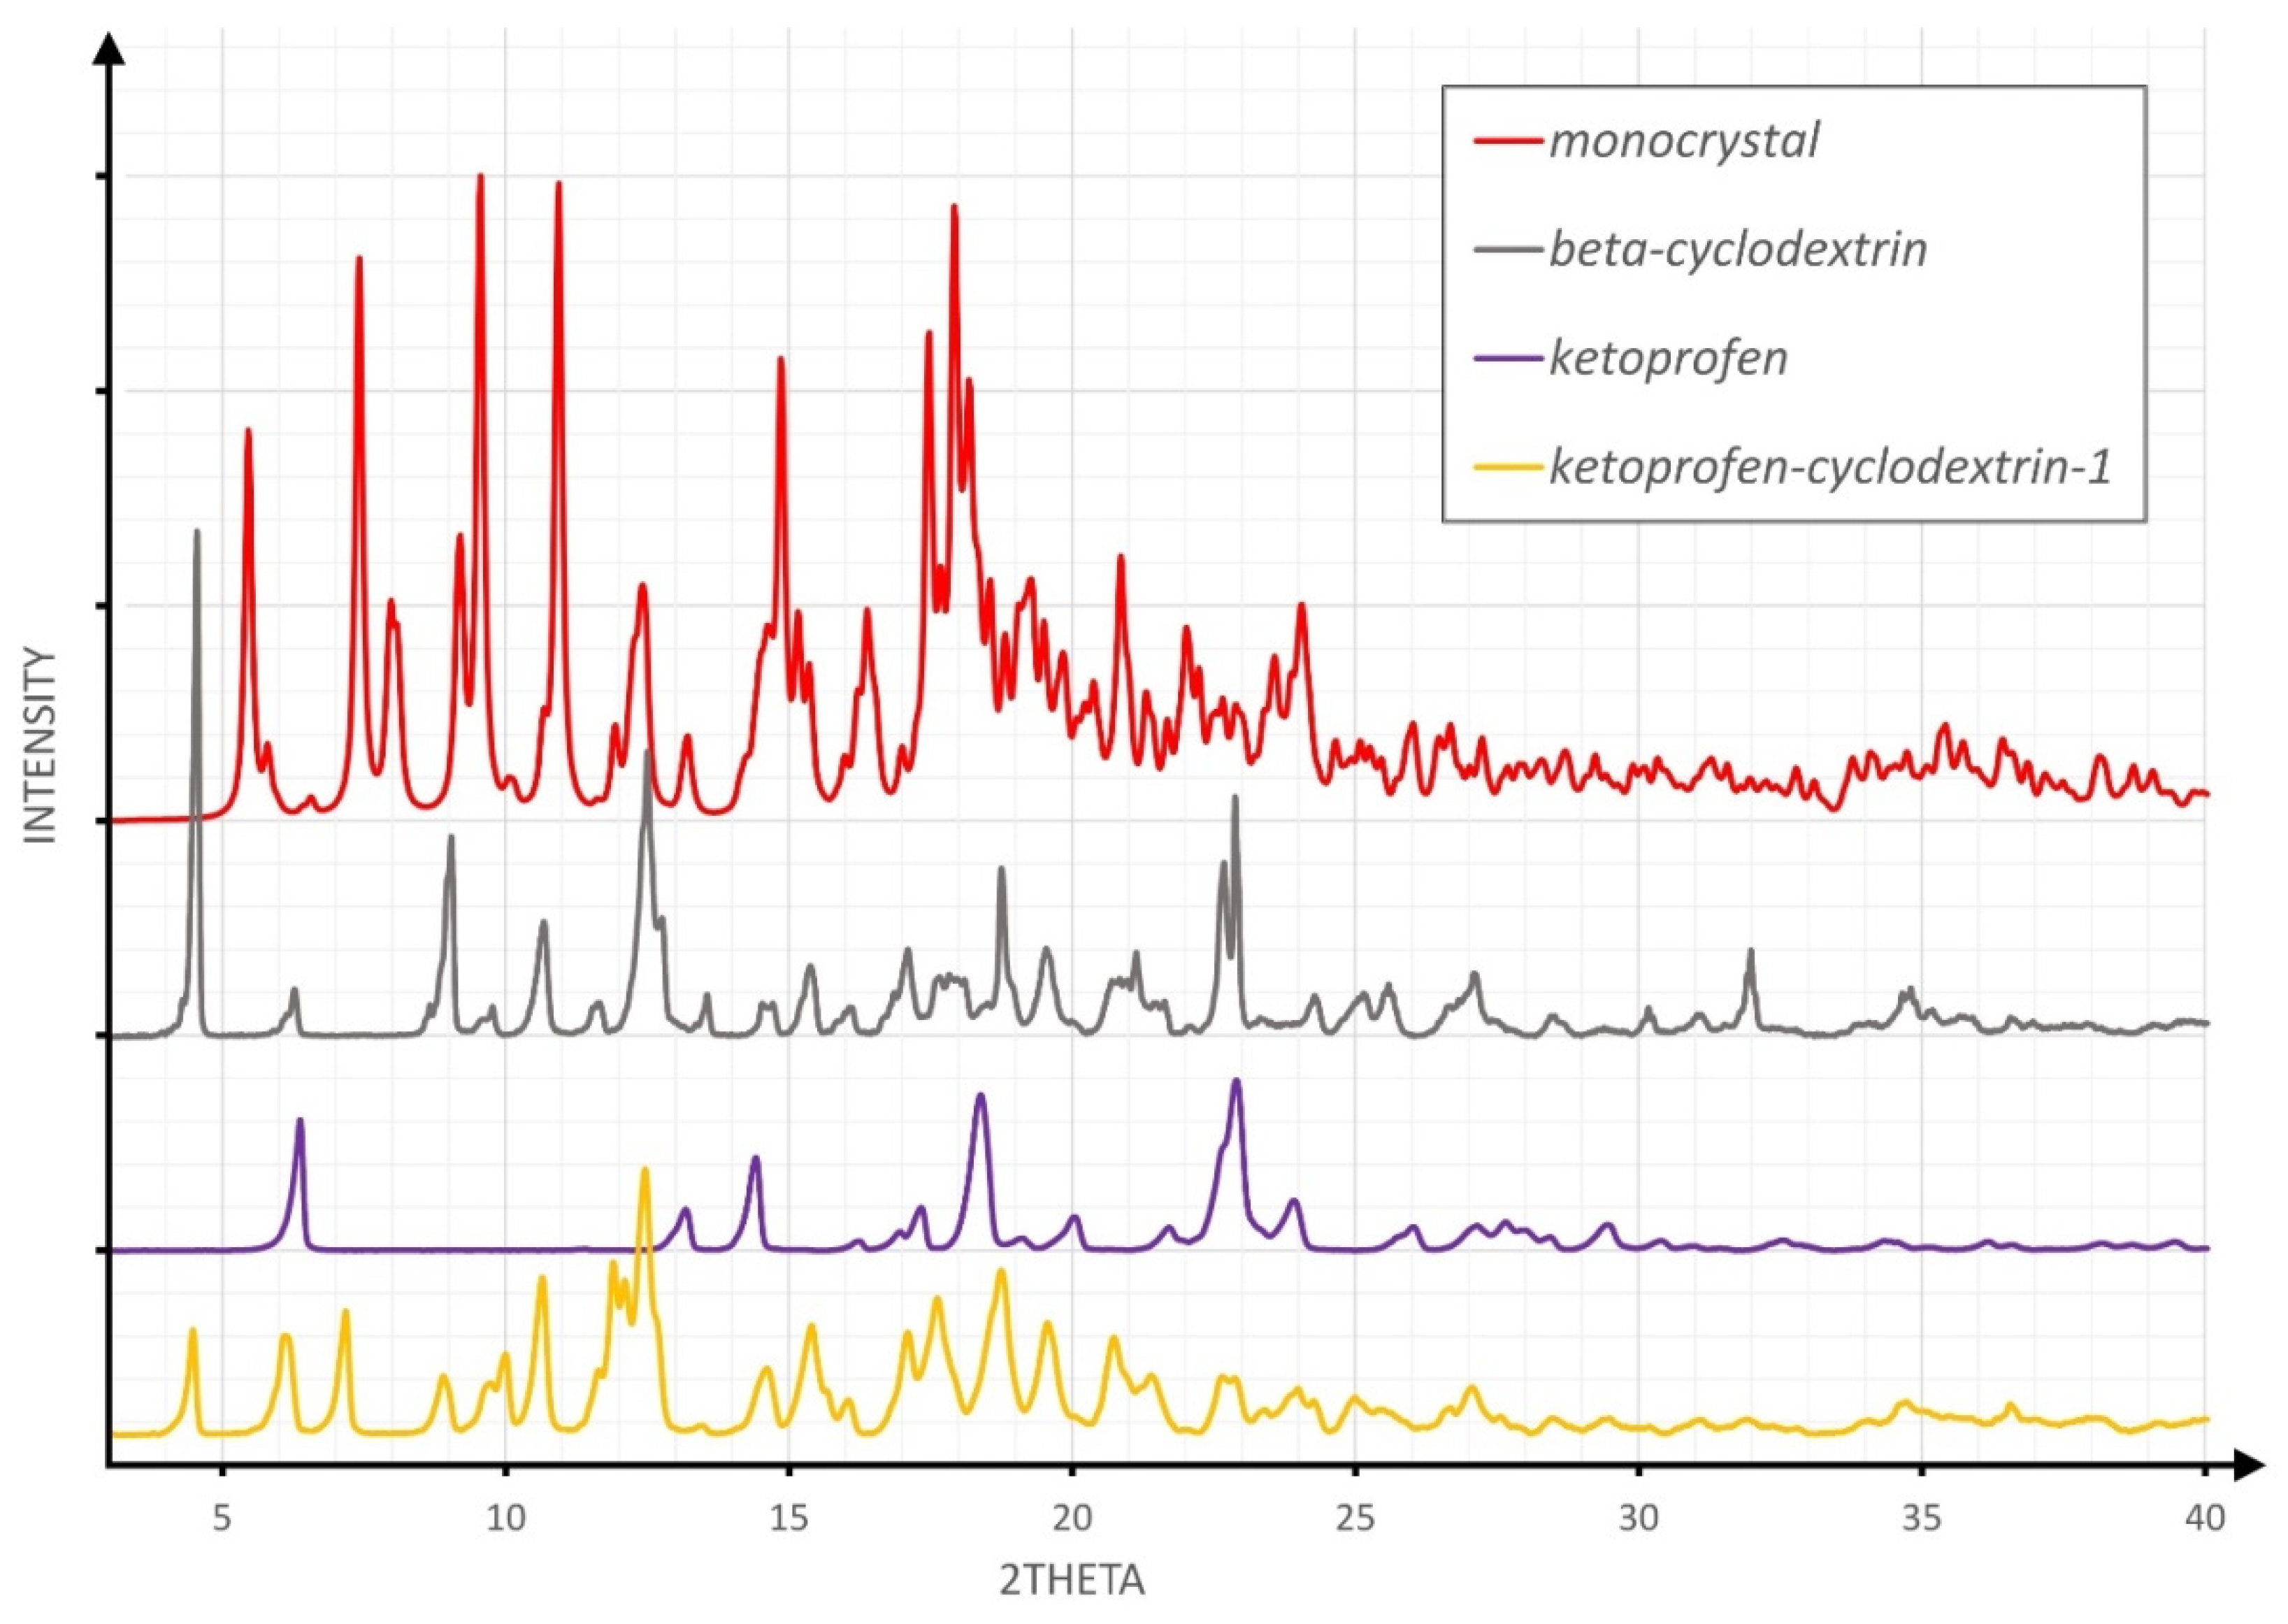
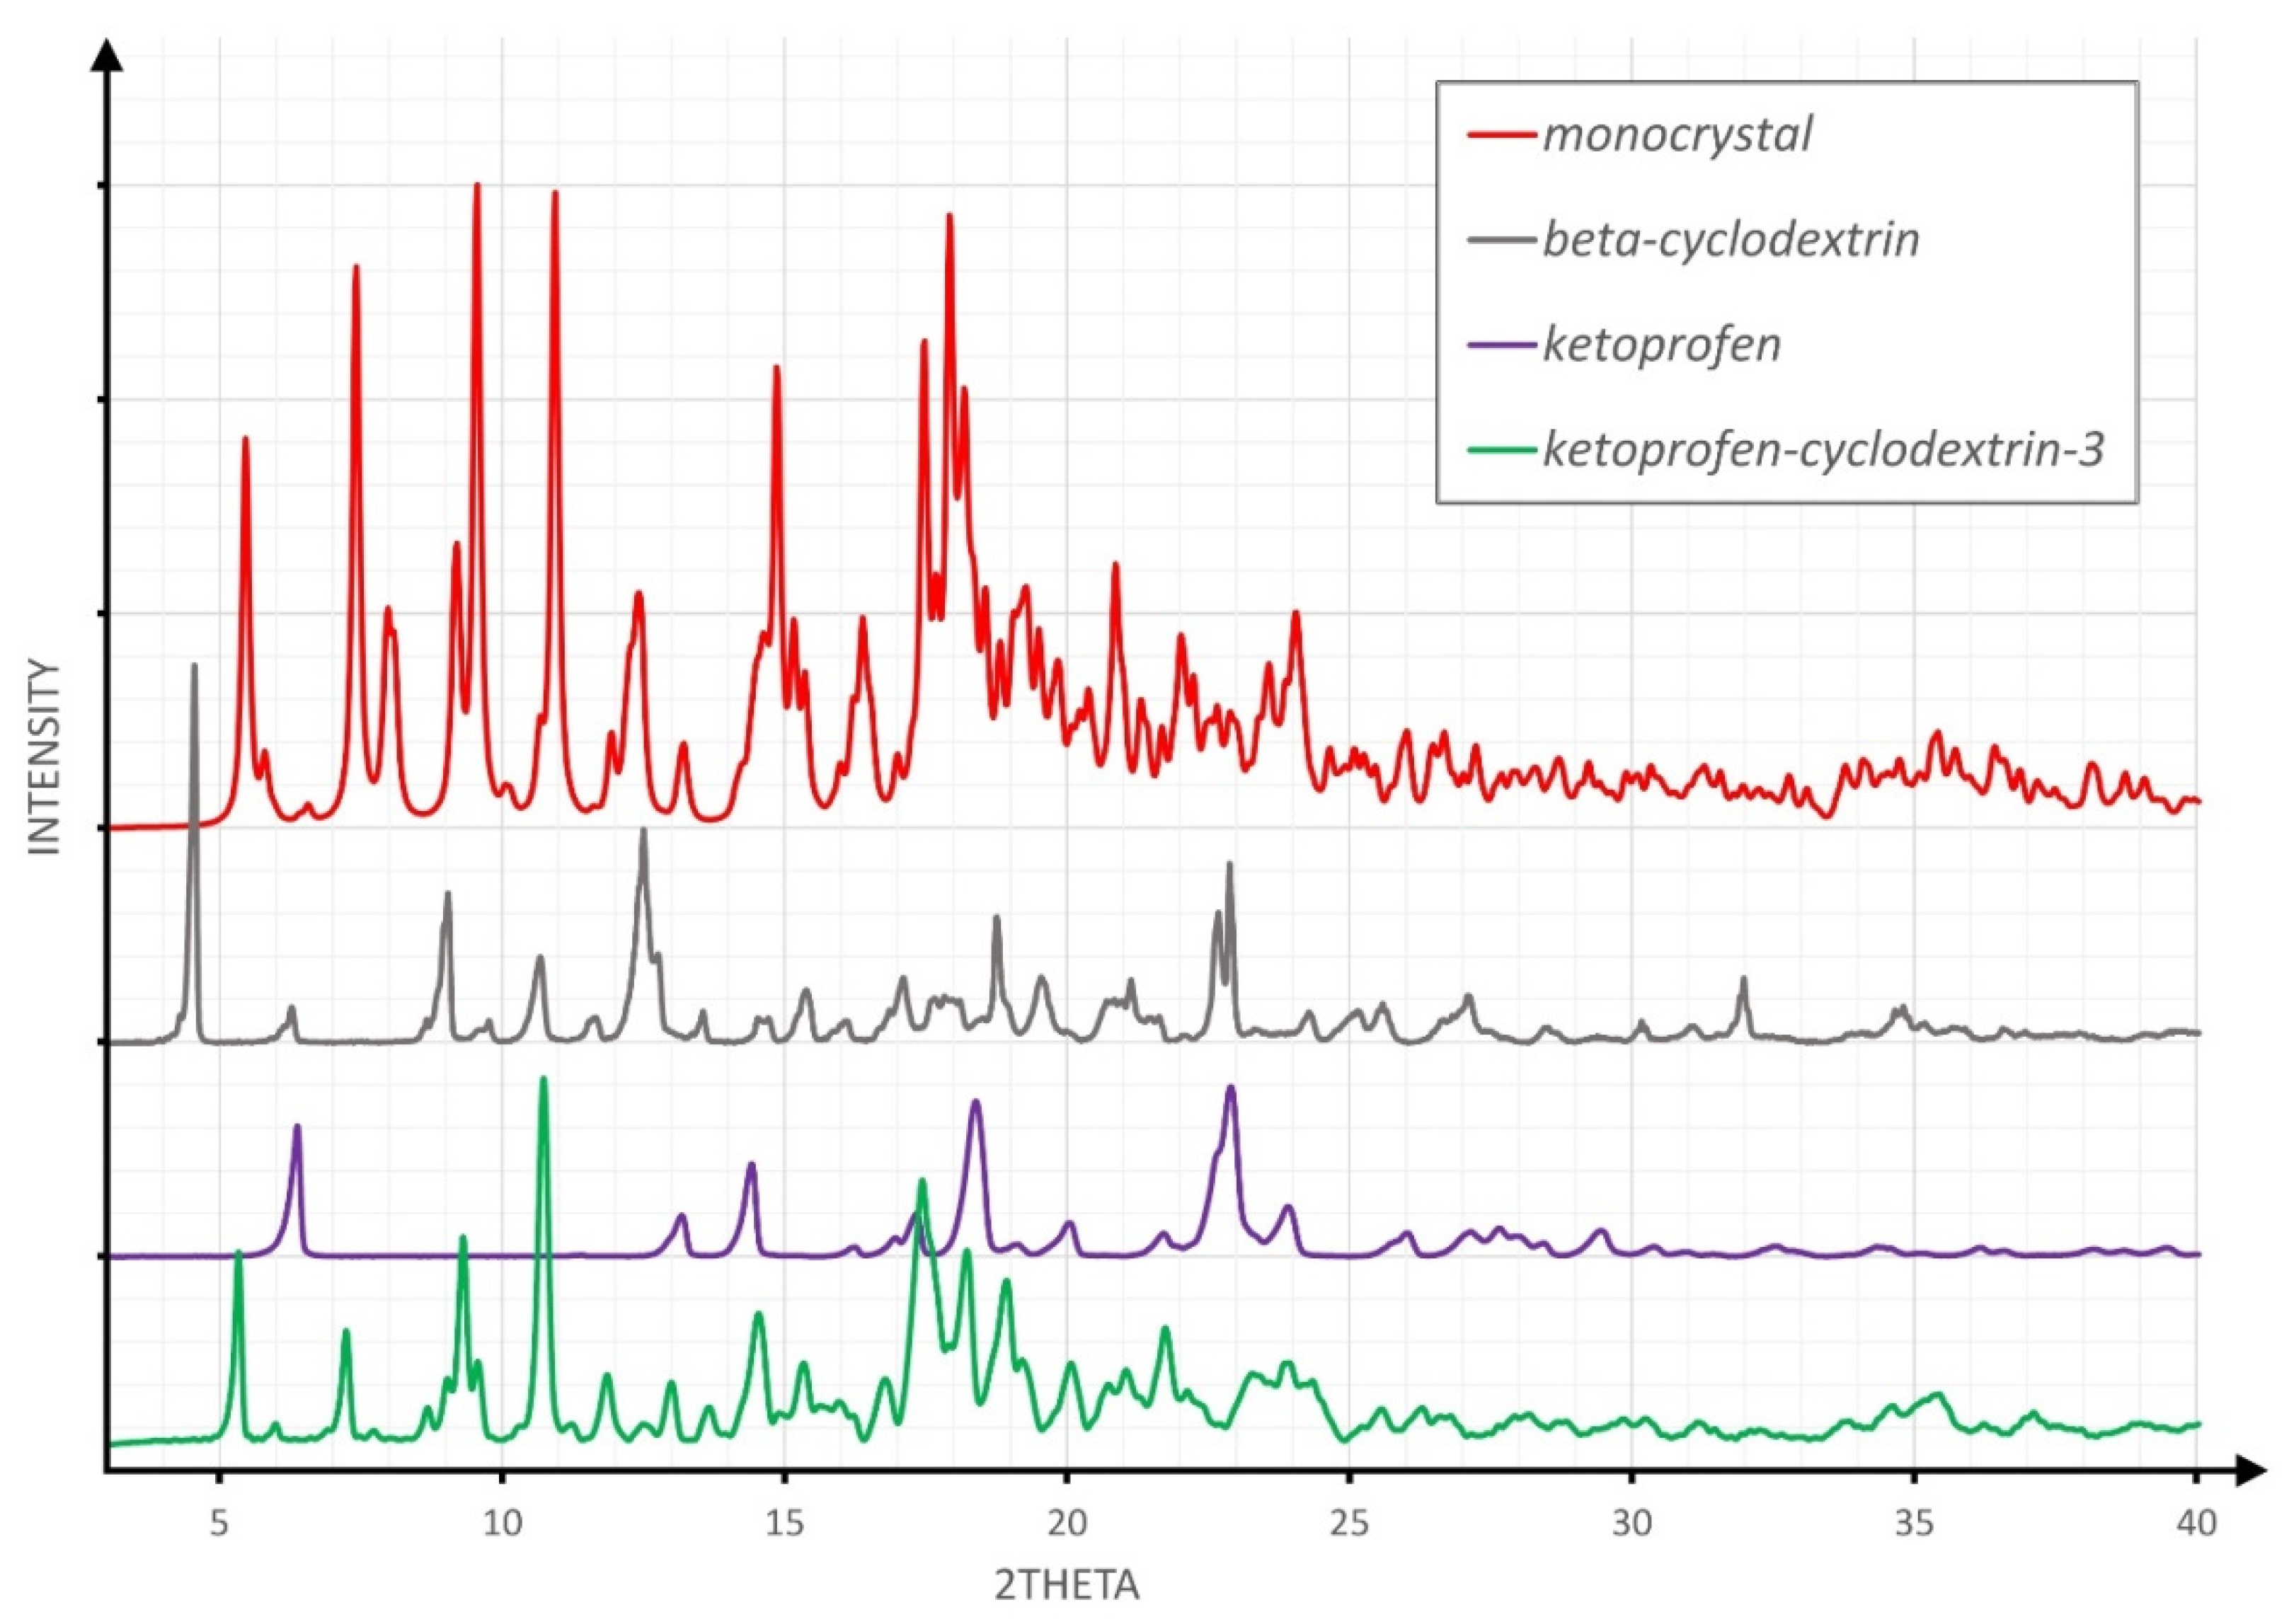
3.1. XRPD Studies
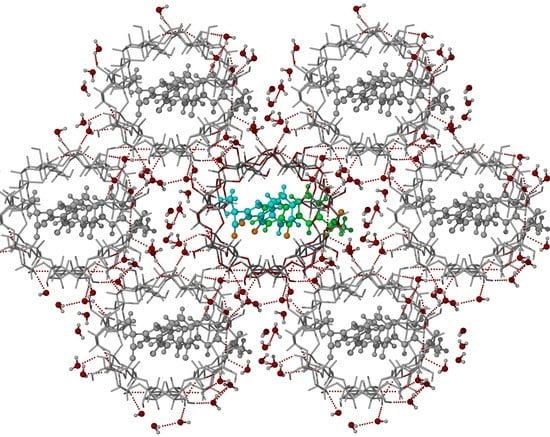
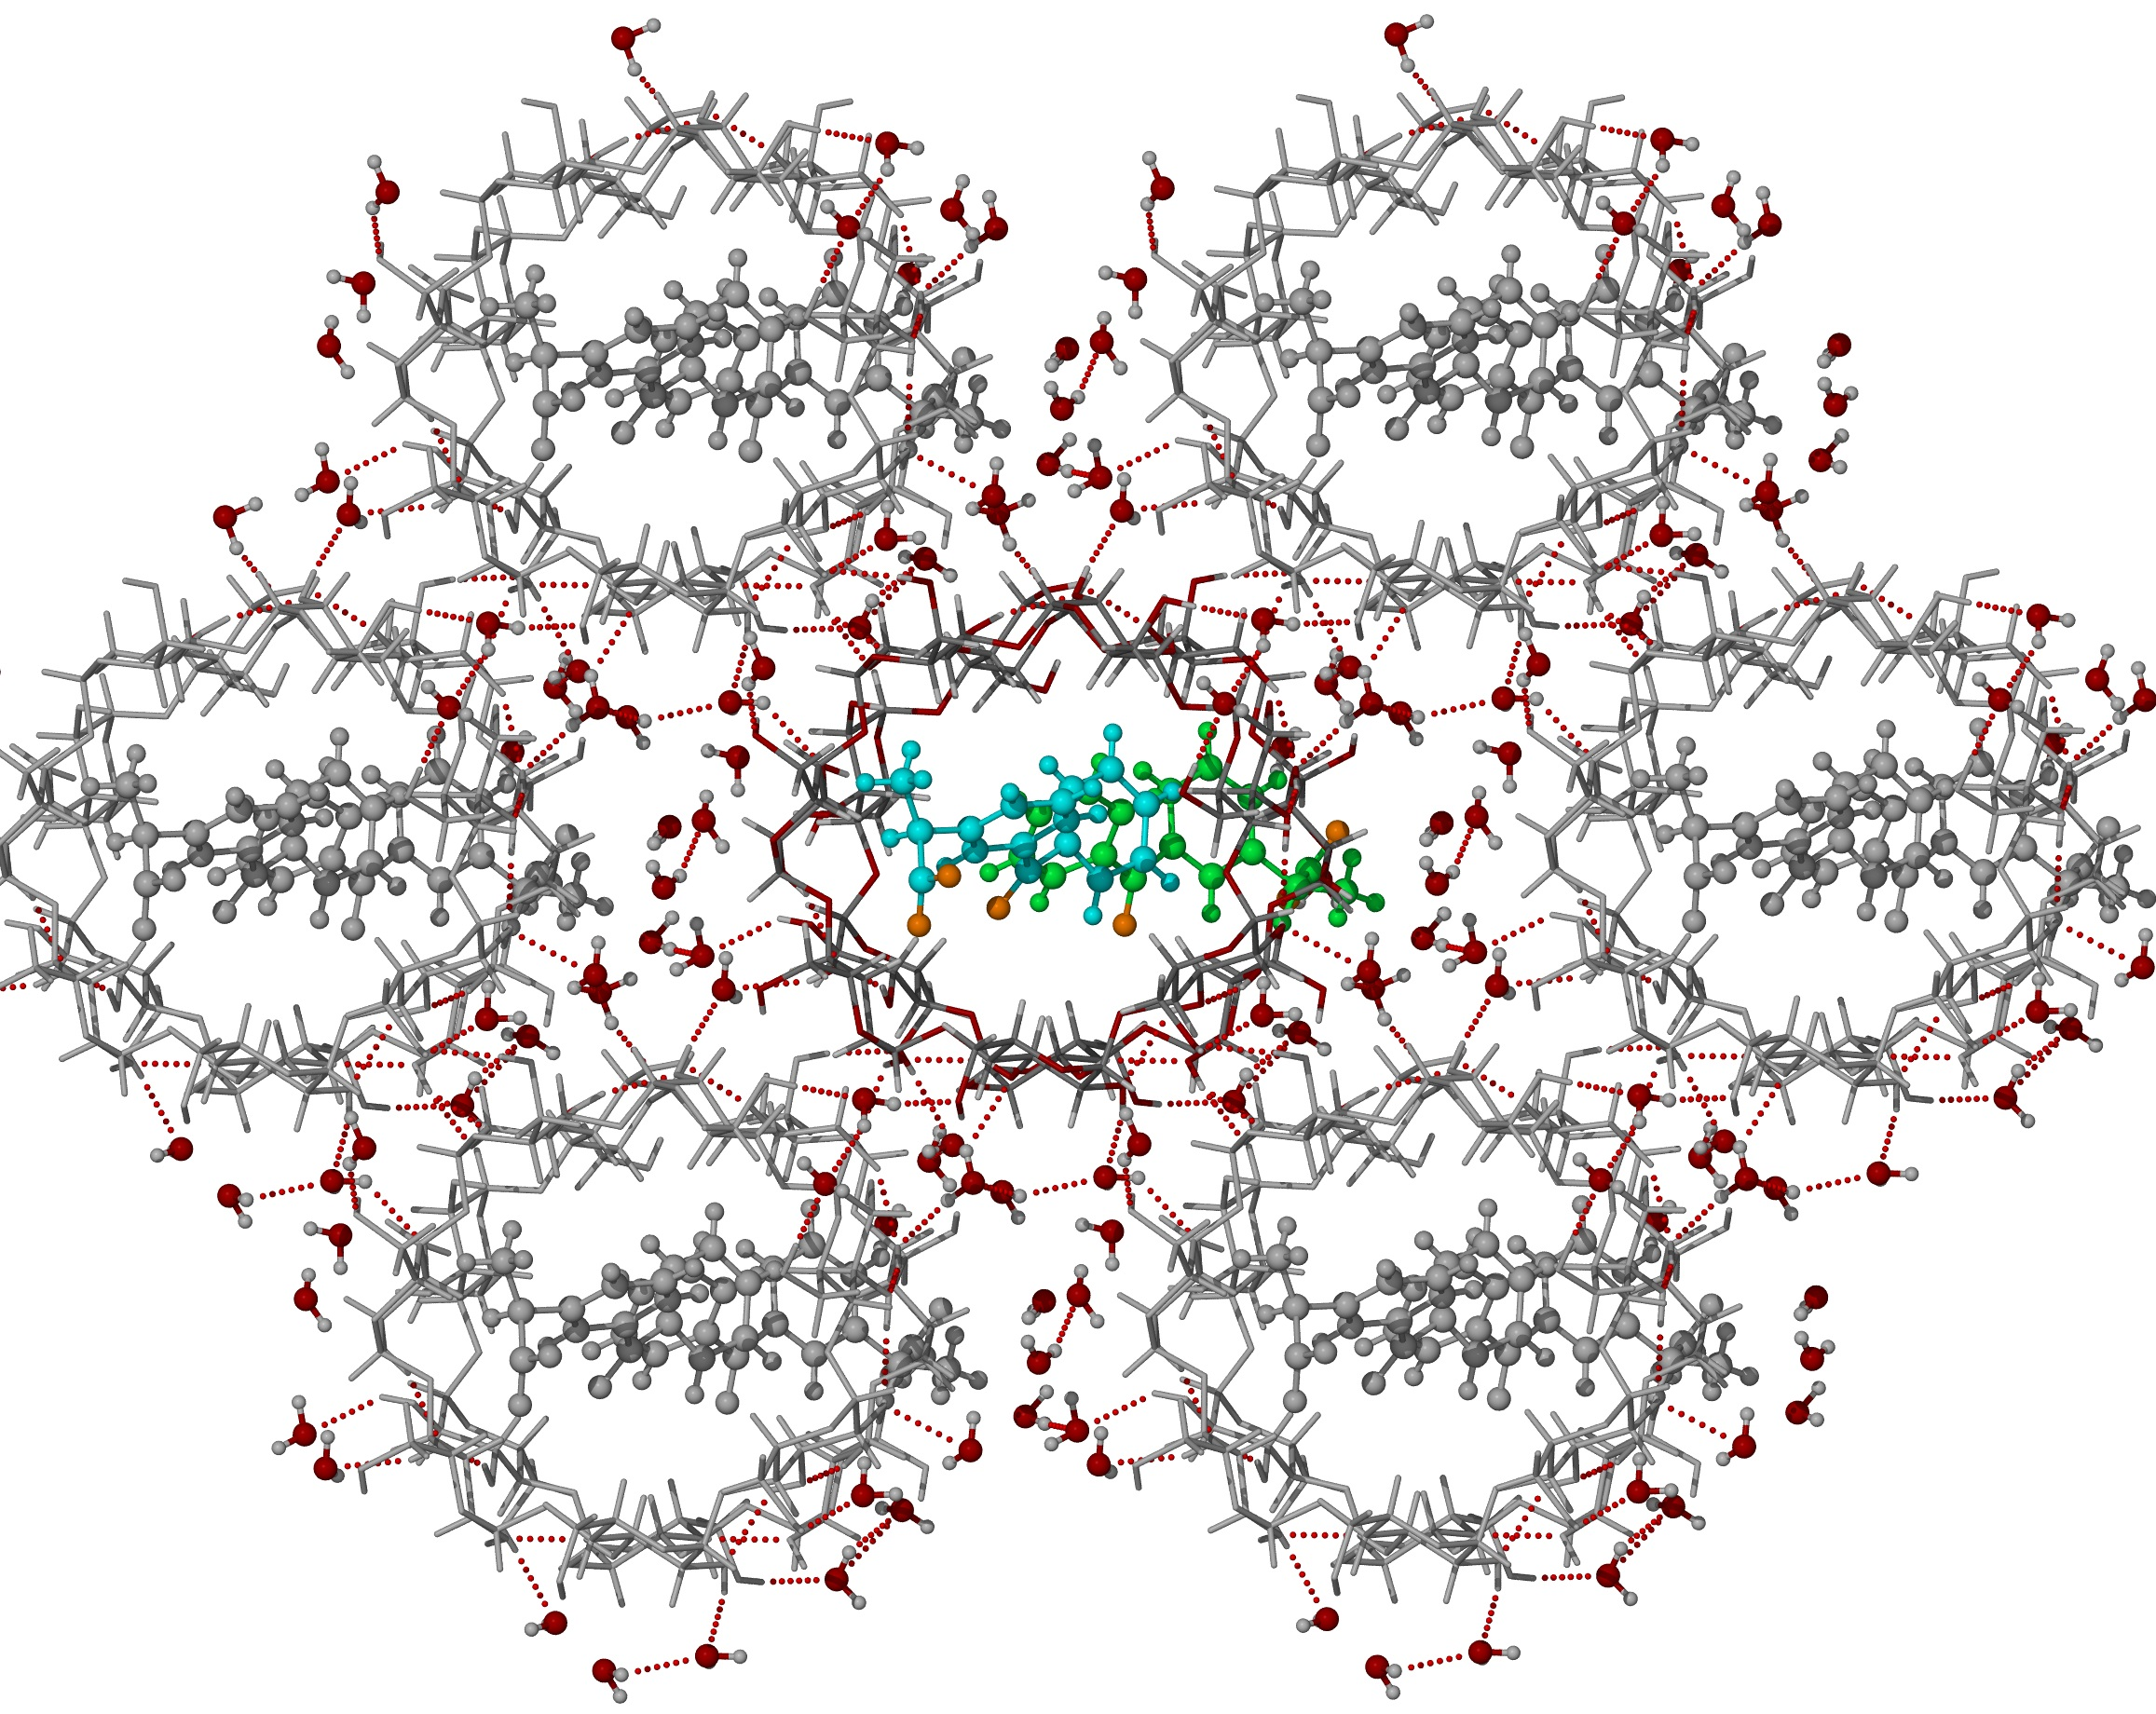
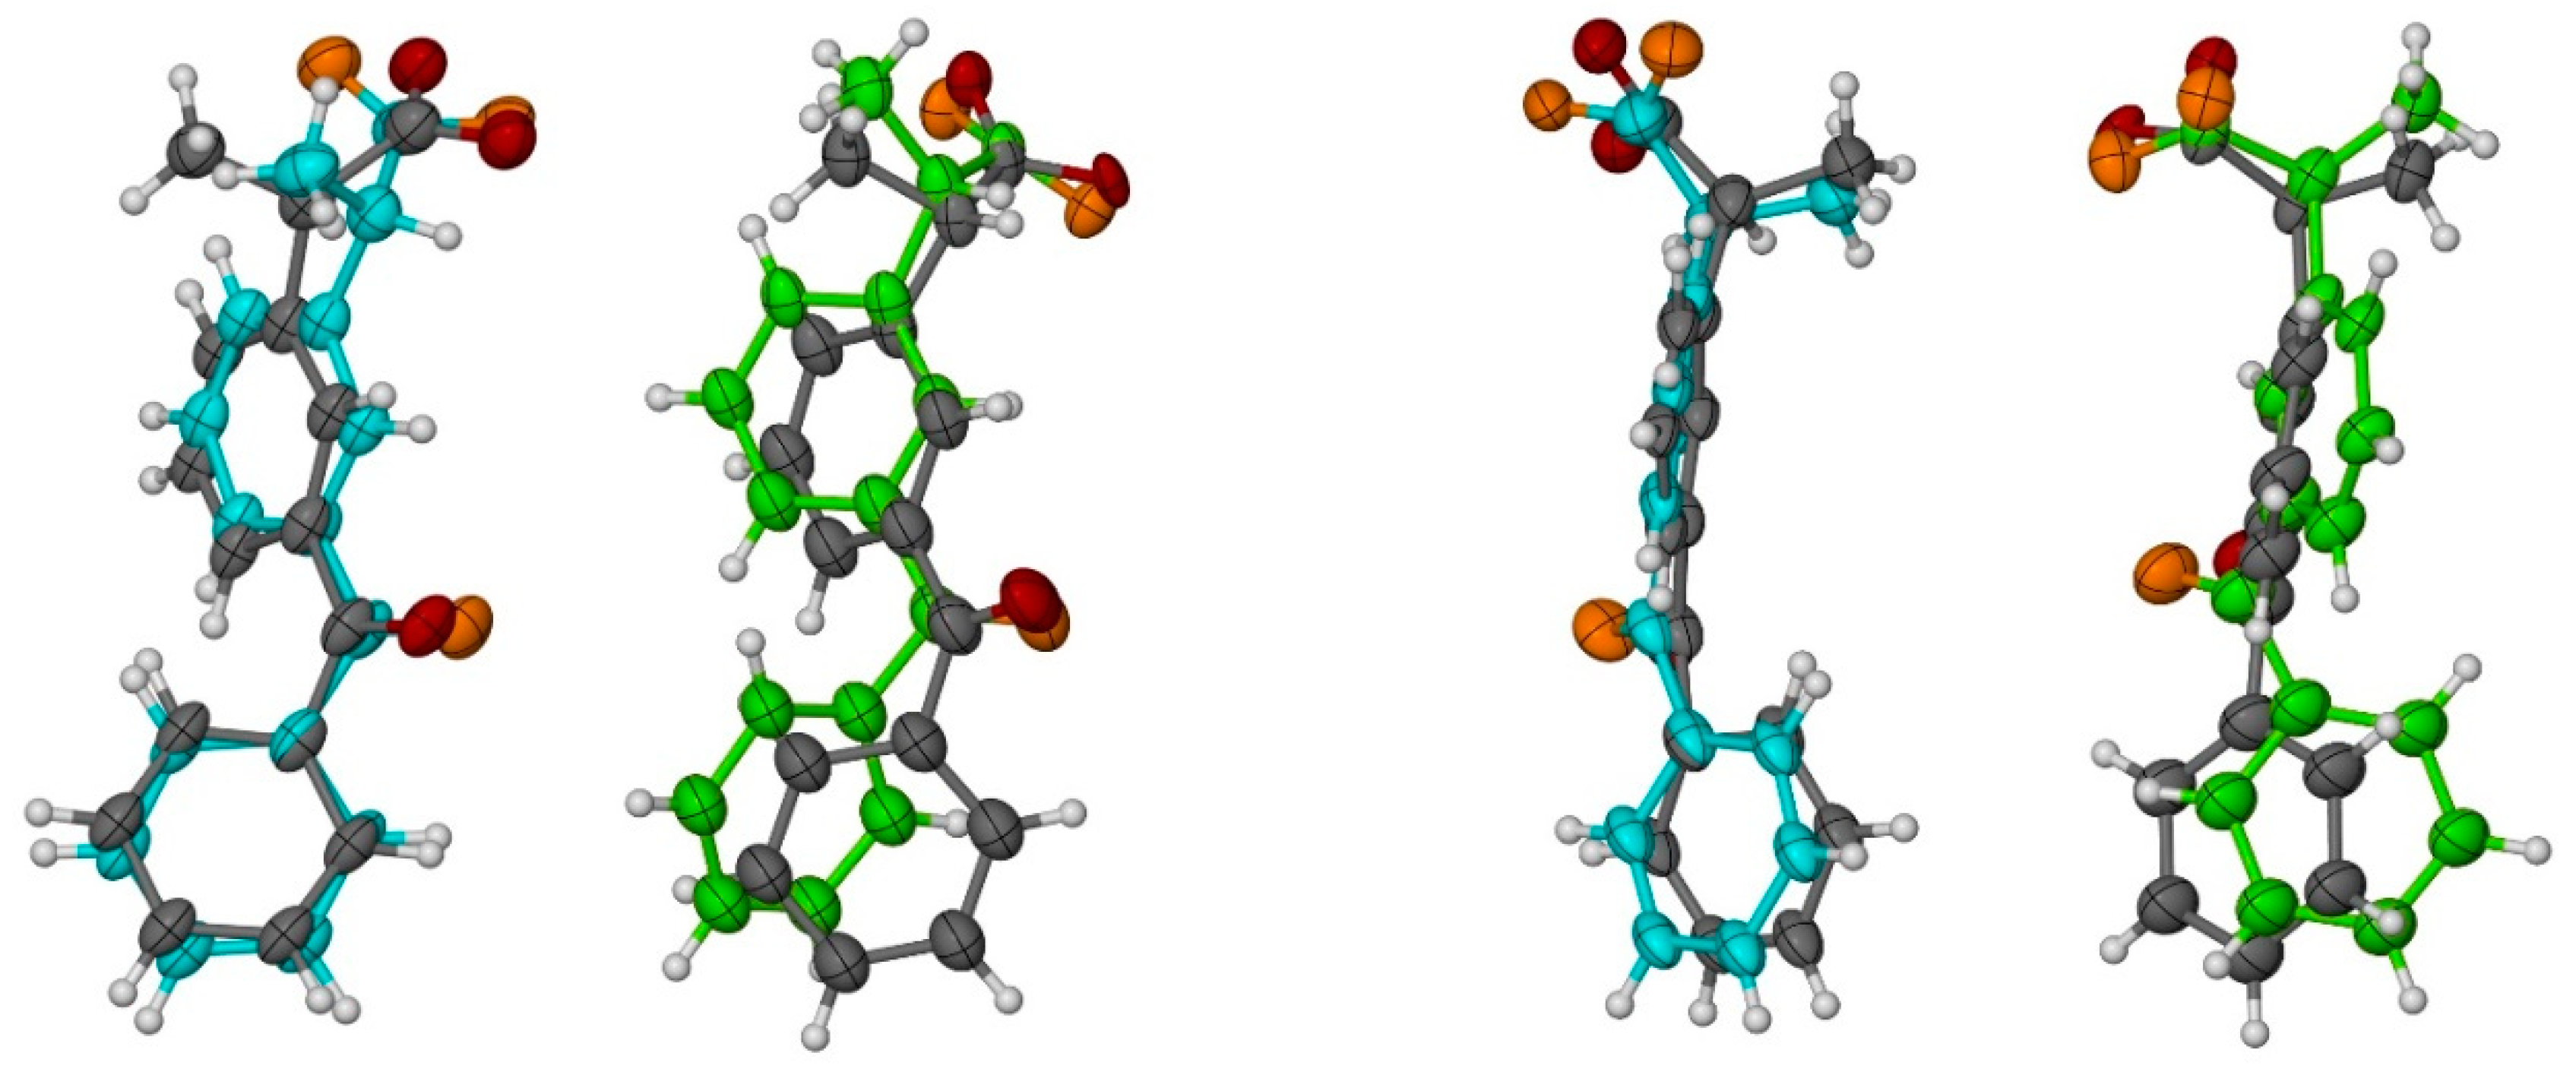
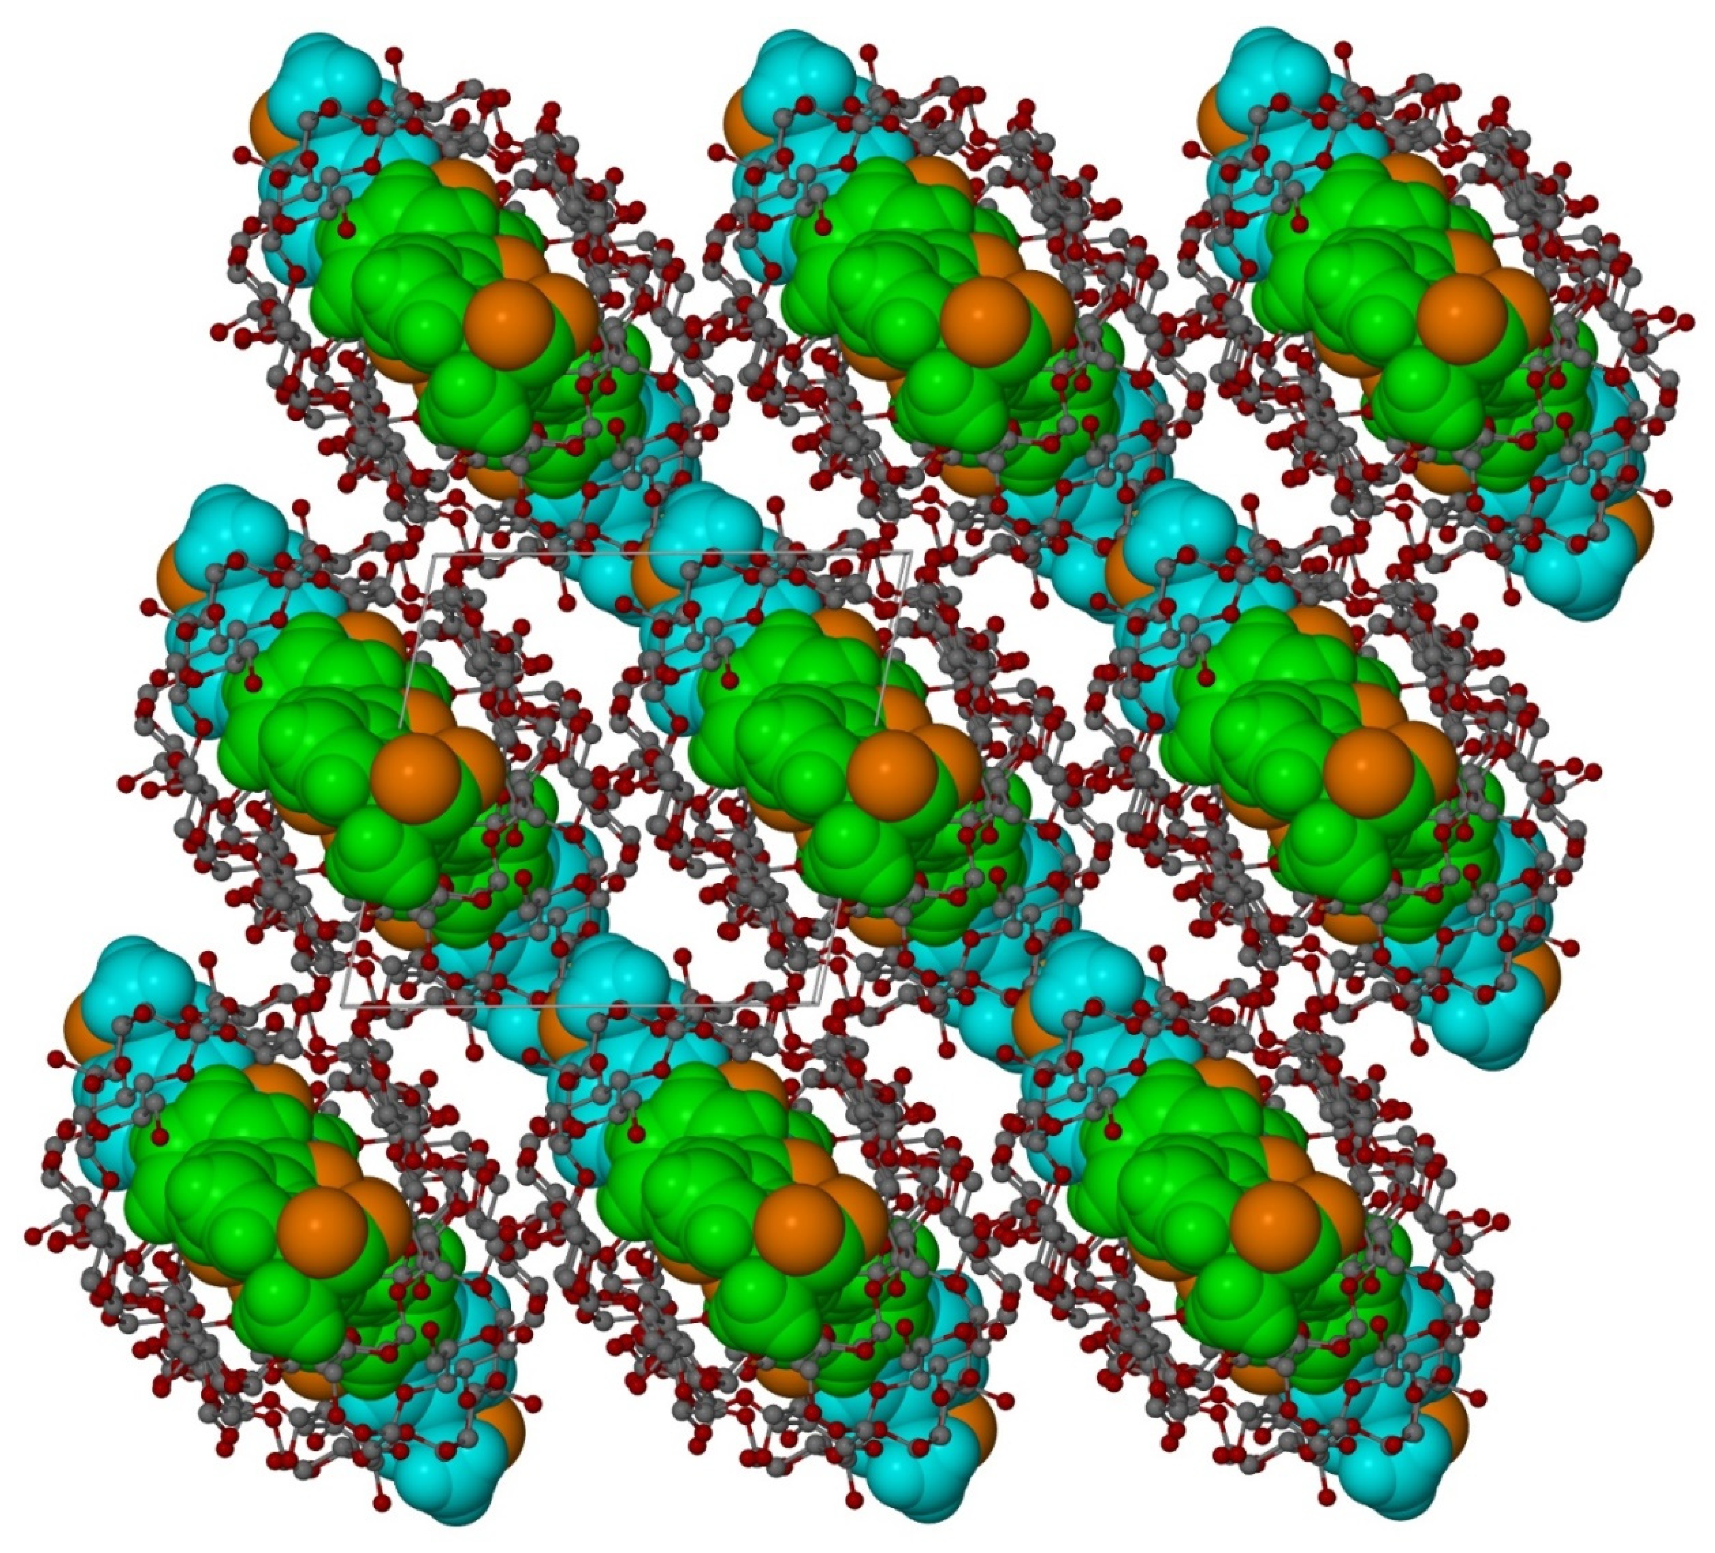
3.2. X-ray Single-Crystal Analysis
3.3. NMR Studies
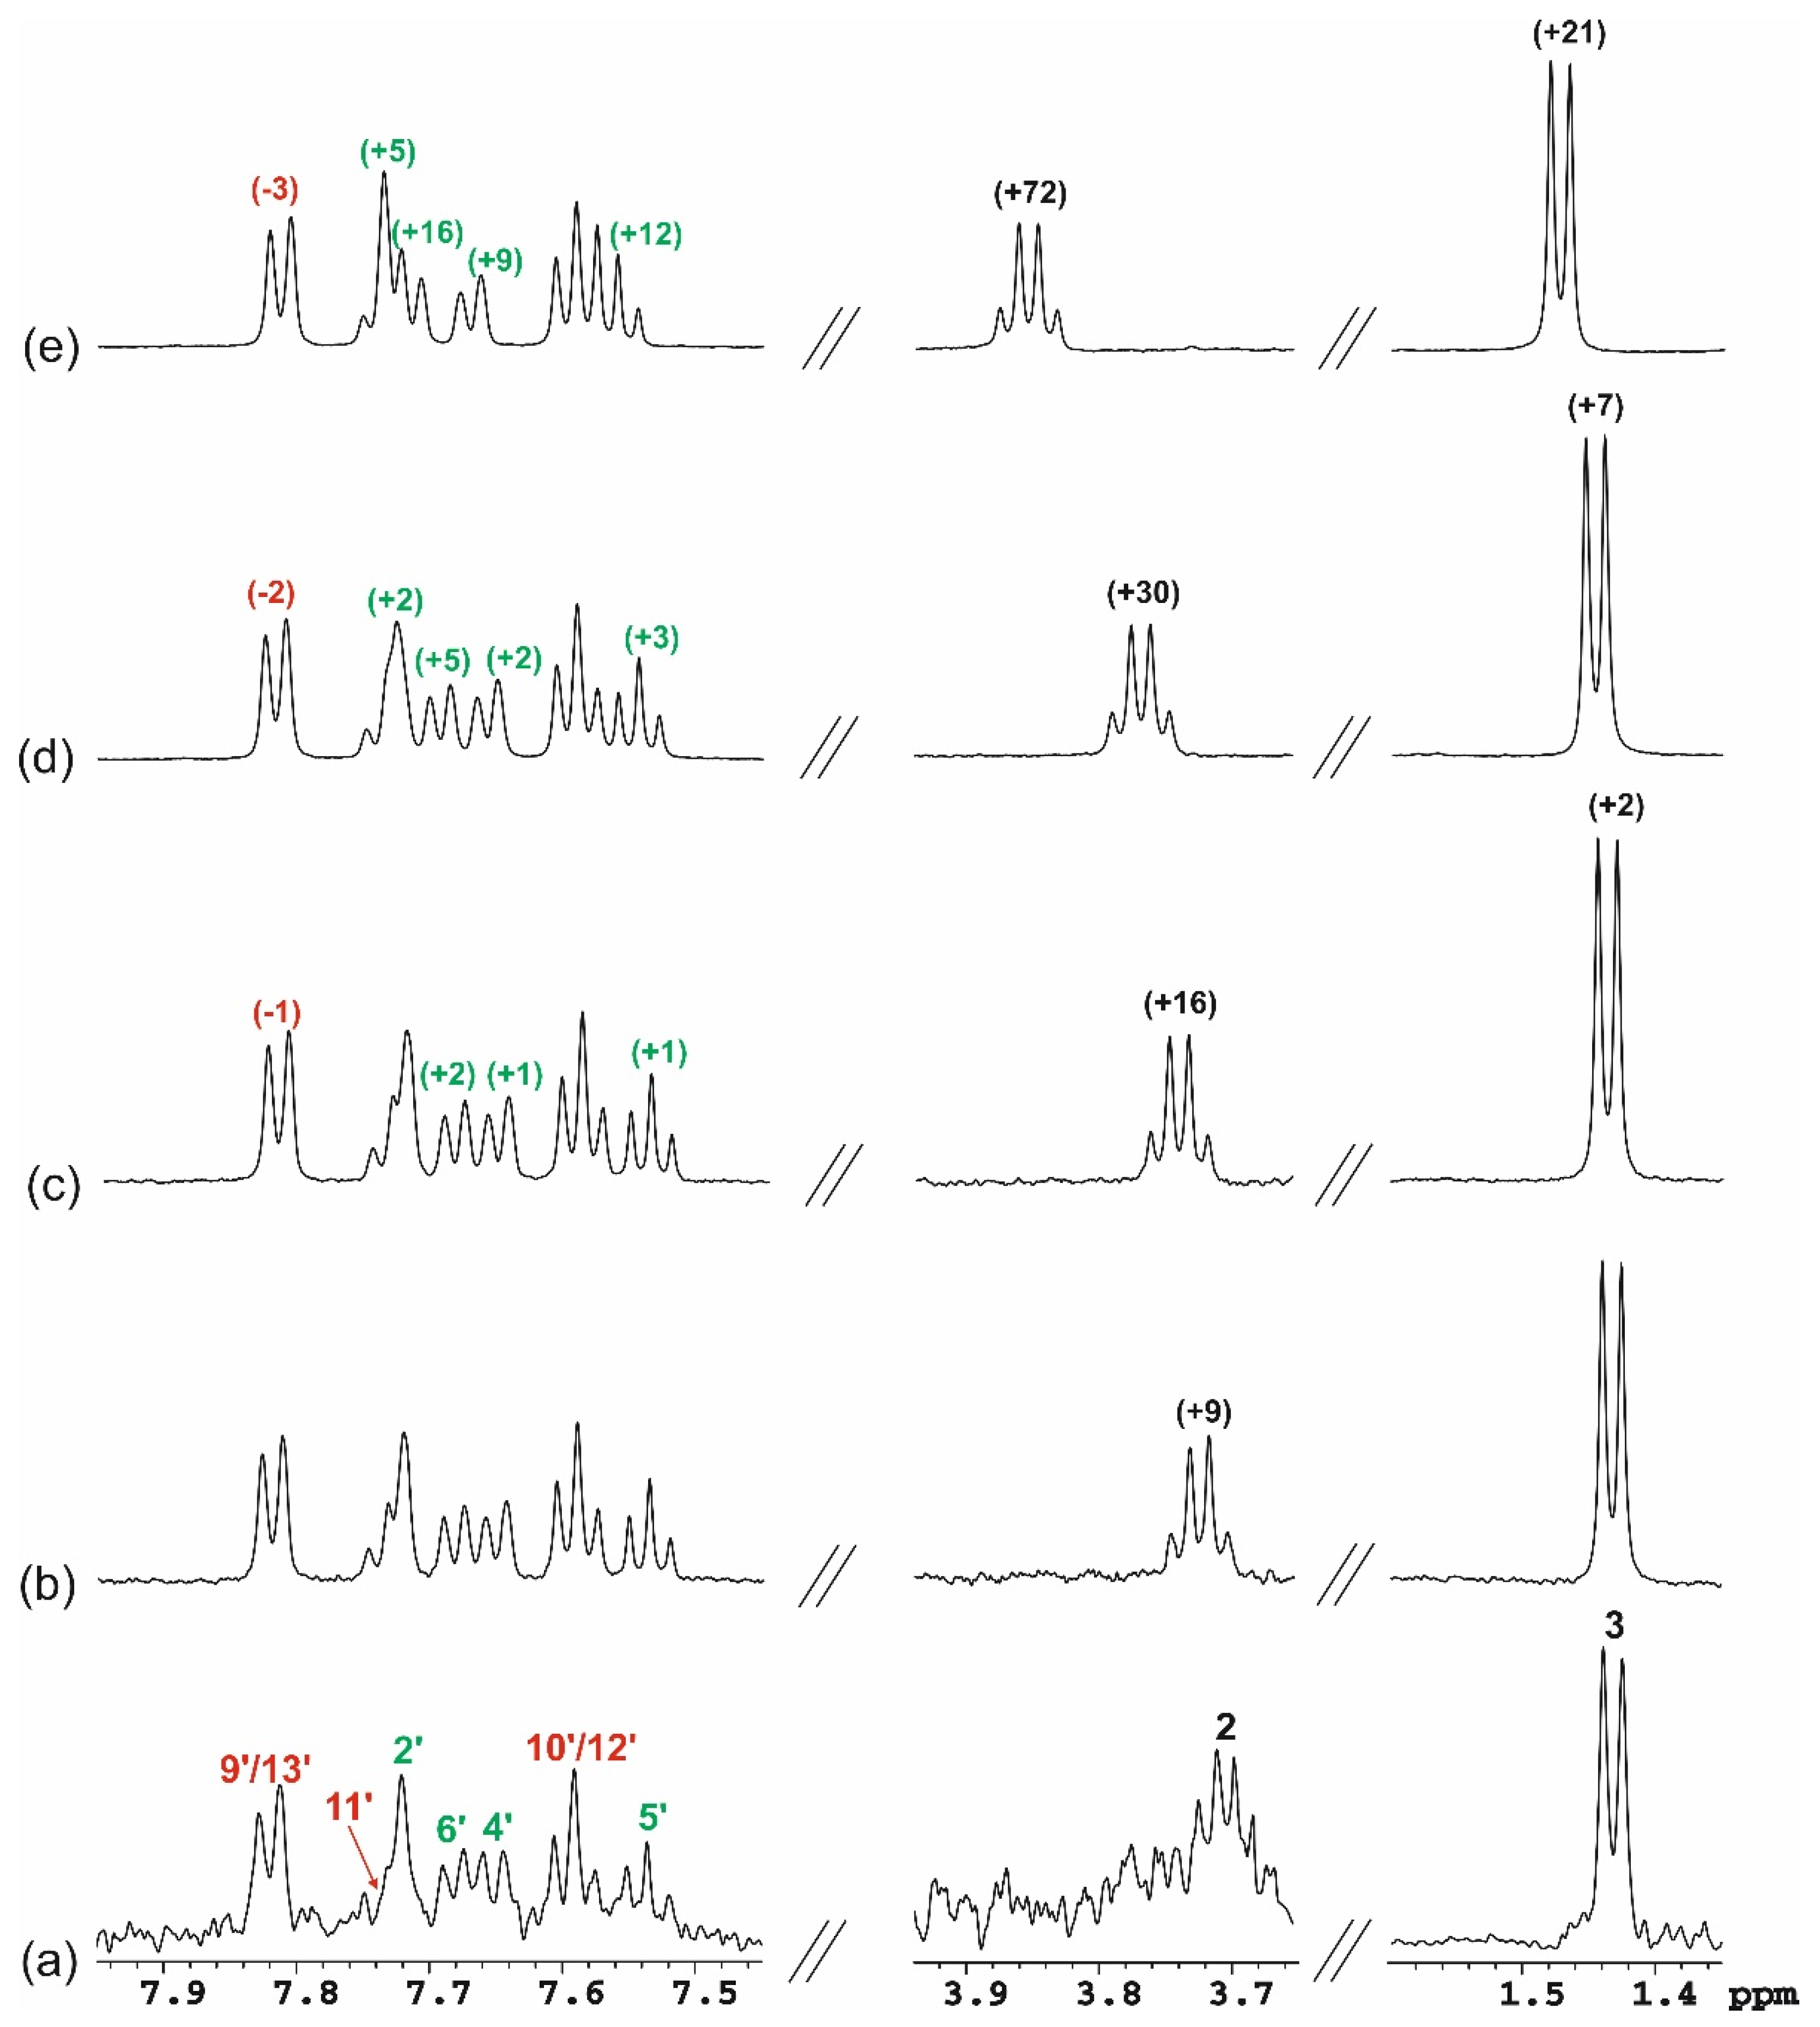
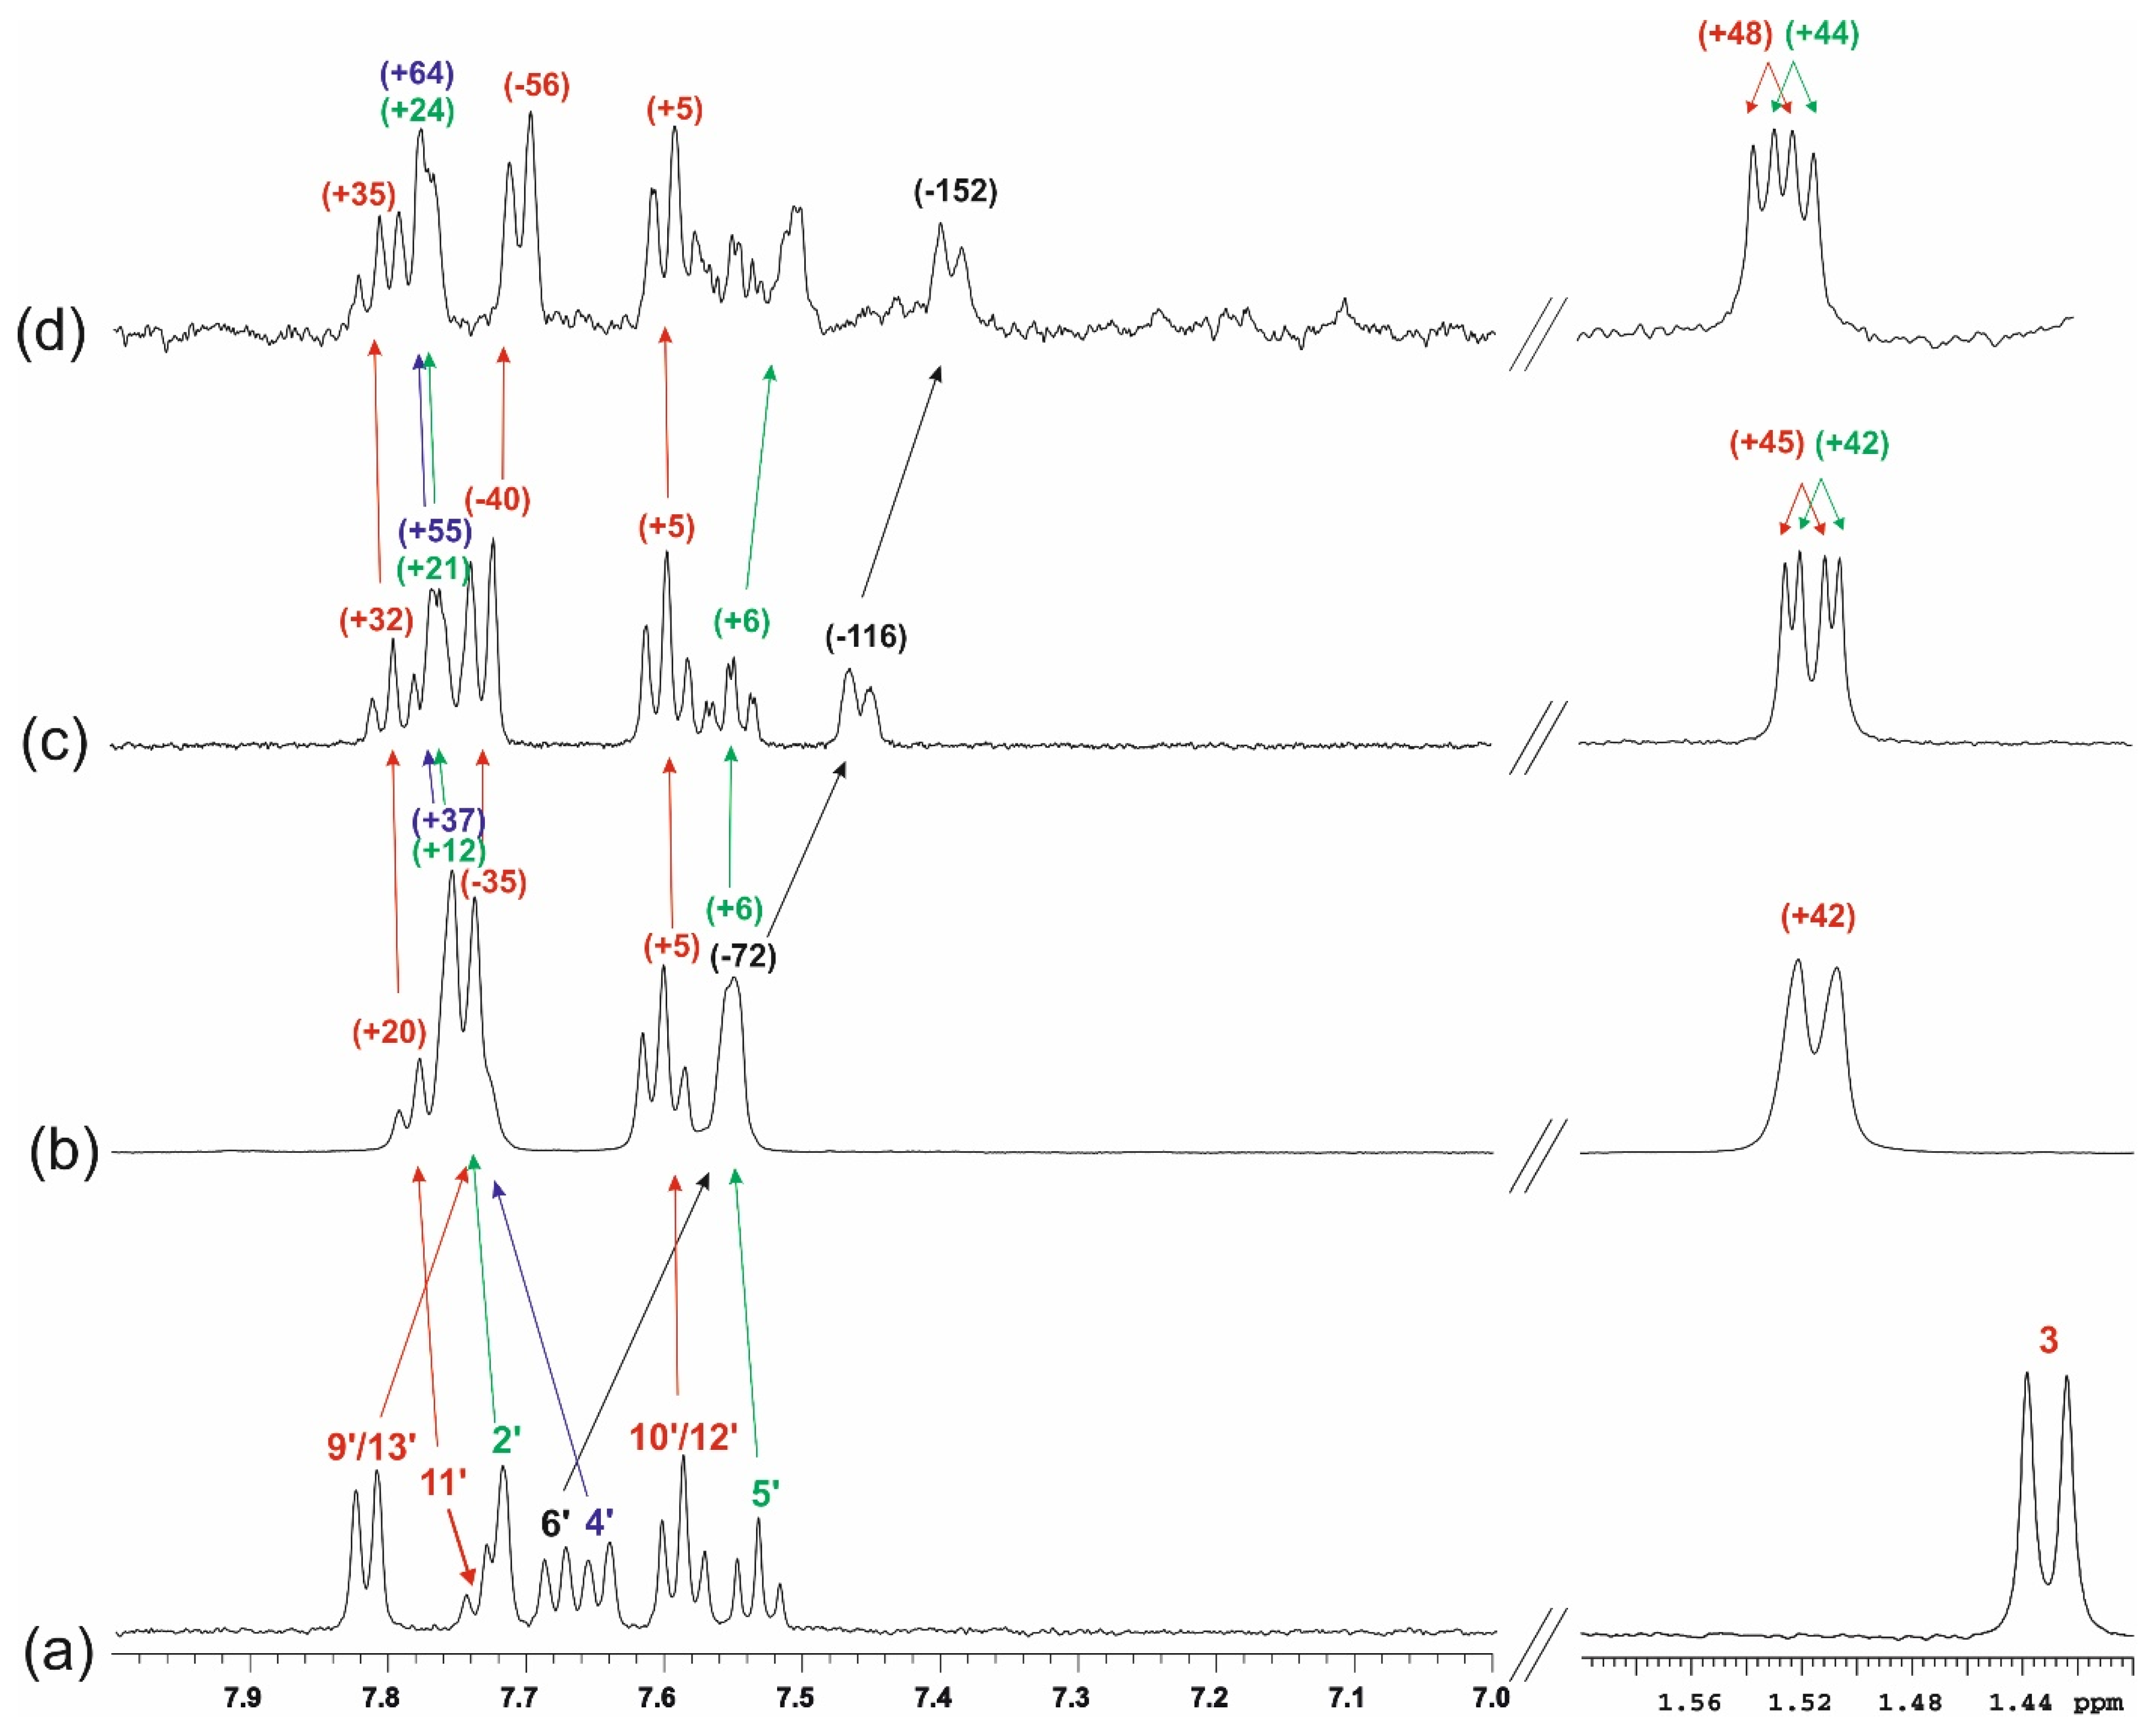
3.3.1. One-Dimensional (1D) 1H NMR Self-Titration Study of KP in Aqueous Solutions
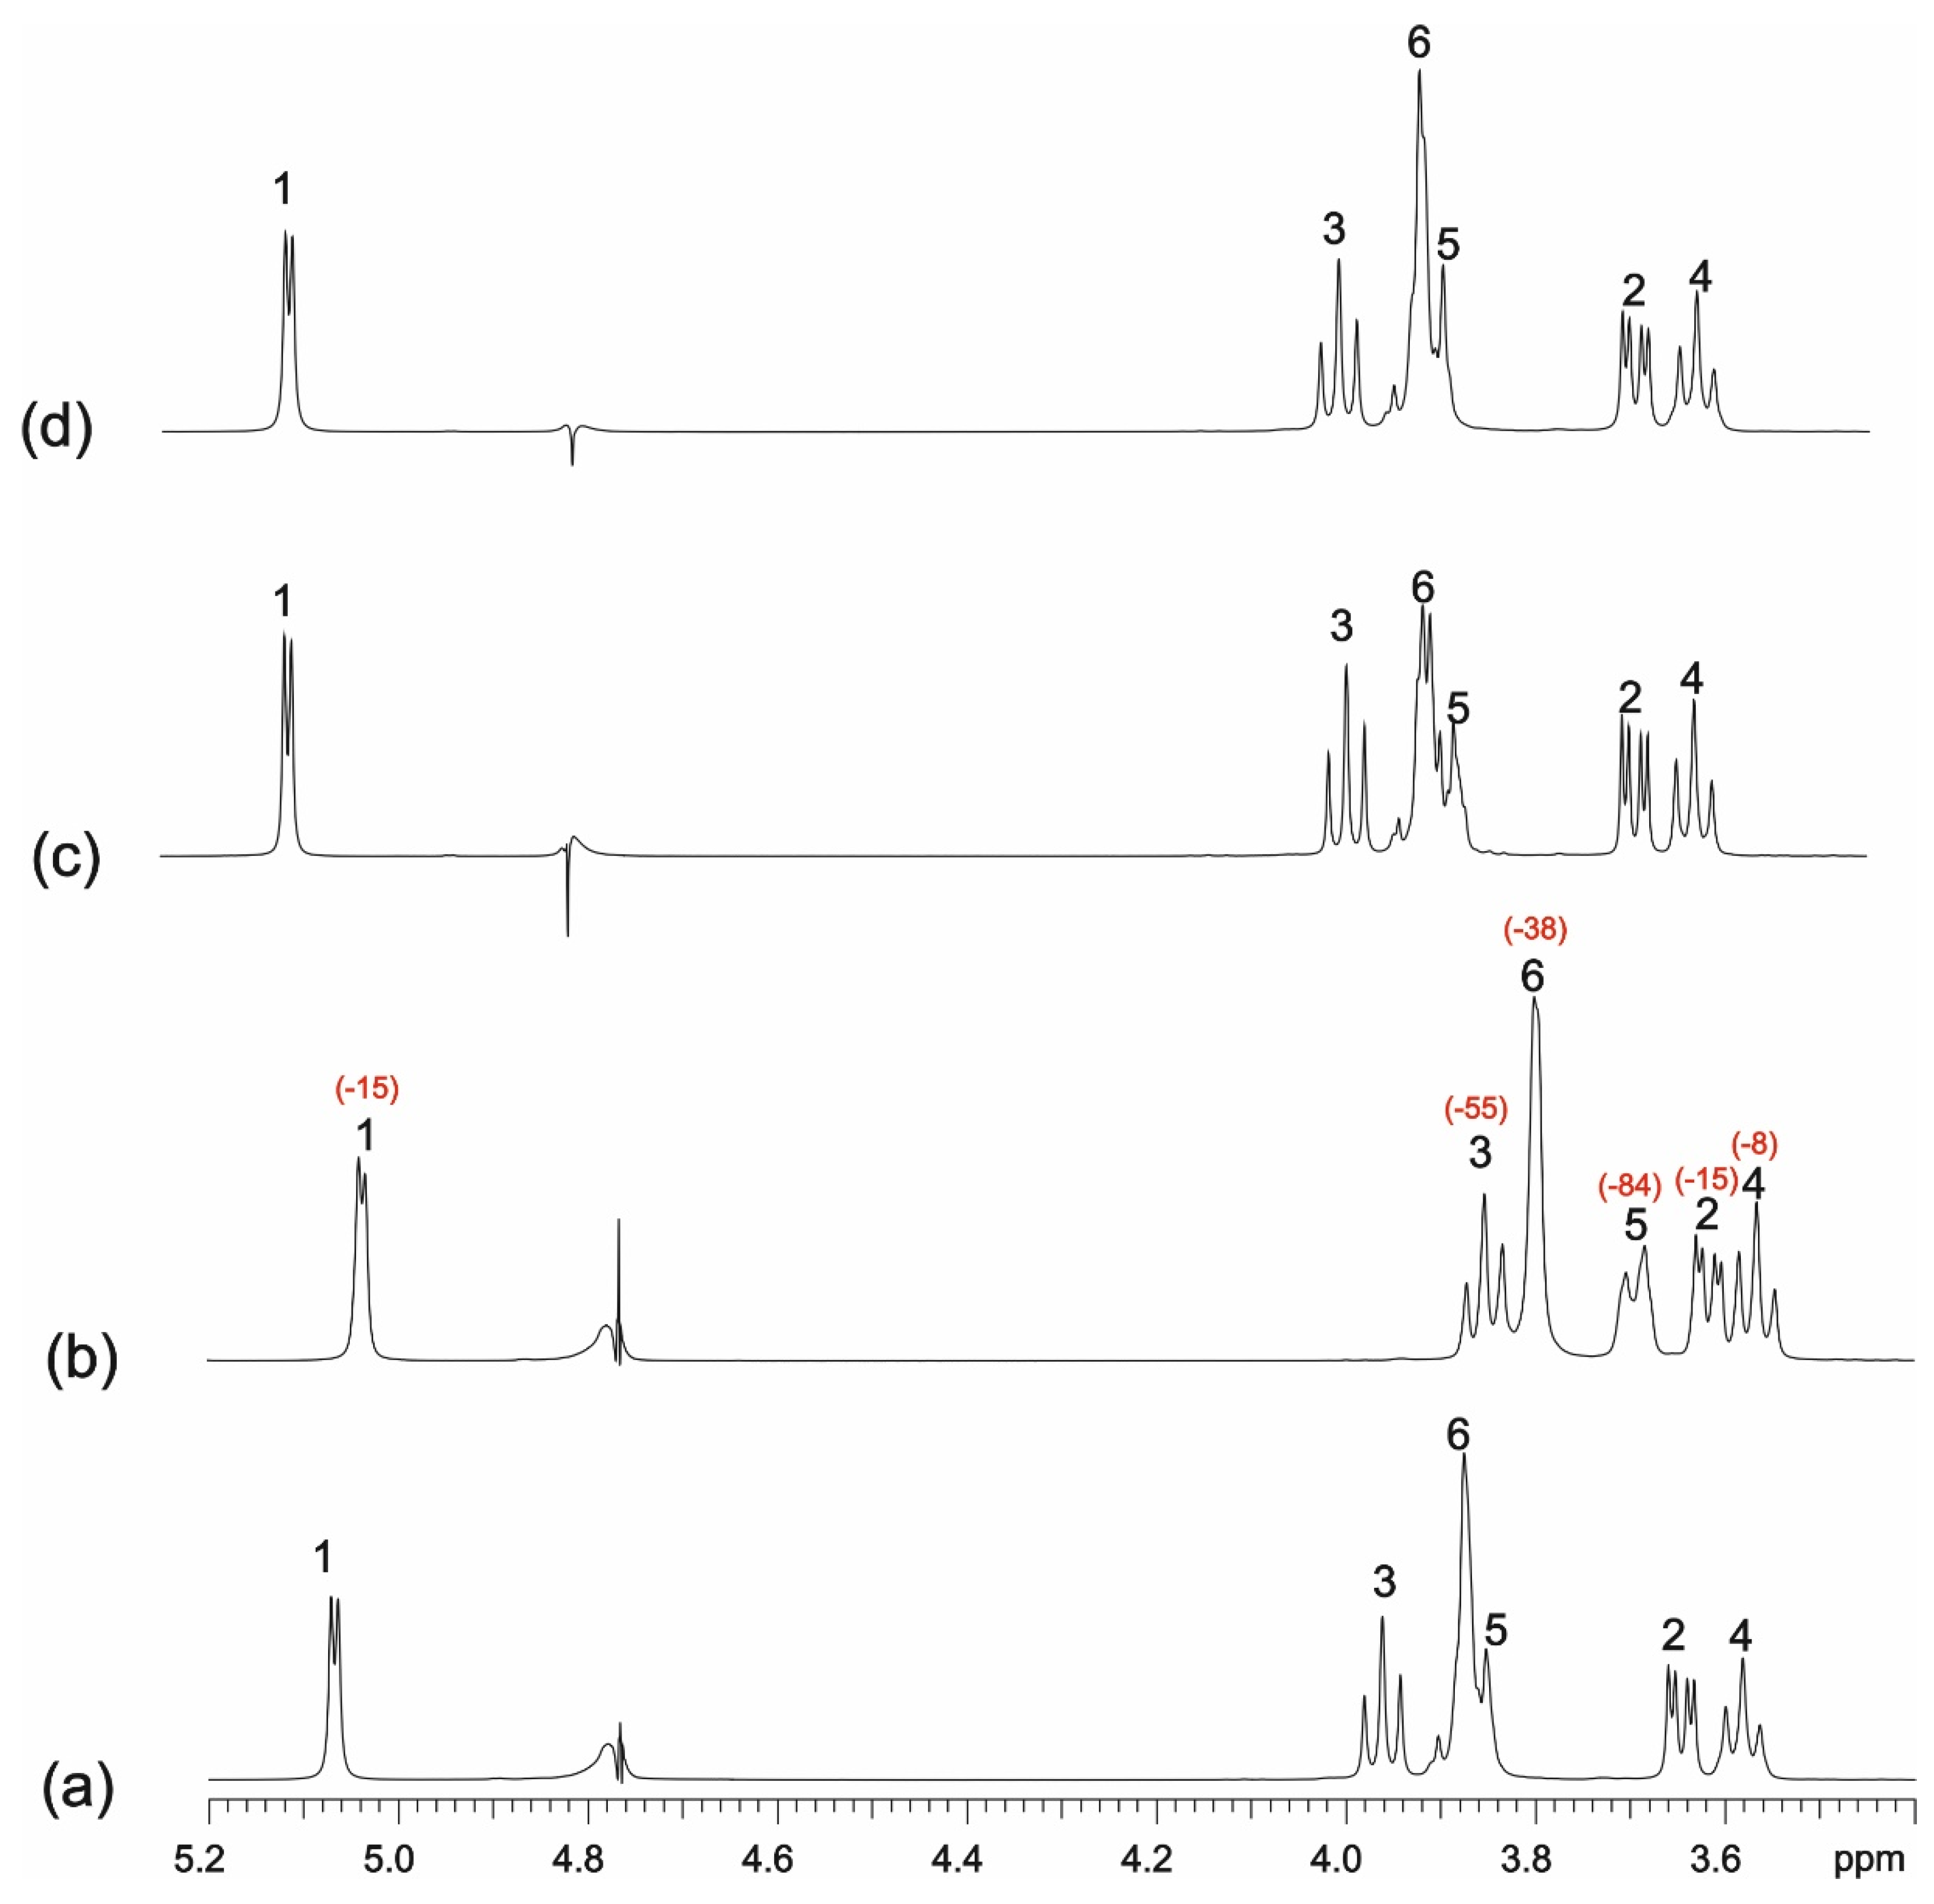
3.3.2. KP/β-CD Complexes
3.3.3. Calculating Binding Constants from the Diffusion Coefficients
4. Conclusions
Supplementary Materials
Author Contributions
Funding
Institutional Review Board Statement
Informed Consent Statement
Data Availability Statement
Acknowledgments
Conflicts of Interest
Sample Availability
References
- Bindu, S.; Mazumder, S.; Bandyopadhyay, U. Non-steroidal anti-inflamatory drugs (NSAIDs) and organ damage: A current perspective. Biochem. Pharmacol. 2020, 180, 1–21. [Google Scholar] [CrossRef] [PubMed]
- Briard, P.; Rossi, J.C. Ketoprofen. Act Cryst. 1990, C46, 1036–1038. [Google Scholar] [CrossRef]
- Pawlędzio, S.; Makal, A.; Trzybiński, D.; Woźniak, K. Crystal Structure, interaction energies and experimental electron density of the popular drug ketoprophen. IUCrJ 2018, 5, 841–853. [Google Scholar] [CrossRef] [PubMed] [Green Version]
- Katzung, B.G. Basic and Clinical Pharmacology, 10th ed.; McGraw-Hill Companies, Inc.: New York, NY, USA, 2007; pp. 581–582. [Google Scholar]
- Roda, A.; Sabatini, I.; Mirasoli, M.; Baraldini, M.; Roda, E. Bioavaibility of a new ketoprofen formulation for once-daily oral administration. Int. J. Pharm. 2002, 241, 165–172. [Google Scholar] [CrossRef]
- Wang, M.; Li, L.; Xie, J.; Sun, Y.; Ling, G.; He, Z. Transdermal adhesive patches loaded with ketoprofen evaluated by dynamic detection of percutaneous absorption. AAPS Pharm. Sci. Tech. 2017, 18, 2141–2148. [Google Scholar] [CrossRef]
- Mura, P.; Bettinetti, G.P.; Manderioli, A.; Faucci, M.T.; Bramanti, G.; Sorrenti, M. Interactions of ketoprofen and ibuprofen with β-cyclodextrins in solution and in the solid state. Int. J. Pharm. 1998, 166, 189–203. [Google Scholar] [CrossRef]
- Szejtli, J. Past present and future of cyclodextrin research. Pure Appl. Chem. 2004, 76, 1825–1845. [Google Scholar] [CrossRef] [Green Version]
- Samprasit, W.; Rojanarata, T.; Akkaramongkolporn, P.; Ngawhirunpat, T.; Opanaspoit, P. The influence of cyclodextrin and pH on the solubility of ketoprofen. Adv. Mat. Res. 2012, 506, 433–436. [Google Scholar] [CrossRef]
- Safia, H.; Ismahan, L.; Abdelkrim, G.; Mouna, C.; Leila, N.; Faitha, M. Density functional theories study of interactions between host β-cyclodextrin and guest 8-anilnonaphthalene-1-sulfonate: Molecular structure, HOMO, LUMO, NBO, QTAIM, and NMR analyses. J. Molec. Liq. 2019, 280, 218–229. [Google Scholar] [CrossRef]
- Jambhekar, S.S.; Breen, P. Cyclodextrins in pharmaceutical formulation I: Structure and physicochemical properties, formation of complexes, and types of complex. Drug Discov. Today 2016, 21, 359–362. [Google Scholar] [CrossRef]
- Cirri, M.; Maestrelli, F.; Meninni, N.; Mura, P. Physical–chemical characterization of binary and ternary systems of ketoprofen with cyclodextrins and phospholipids. J. Pharm. Biomed. Anal. 2009, 50, 683–689. [Google Scholar] [CrossRef] [PubMed]
- Braga, S.S.; Goncalves, I.S.; Herdtweck, E.; Teixieria-Dias, J.J.C. Solid state inclusion compound of S-ibuprofen in β-cyclodextrin: Structure and characterization. New J. Chem. 2003, 27, 597–601. [Google Scholar] [CrossRef]
- Pinto, L.M.A.; Fraceto, L.F.; Santana, M.H.A.; Pertinhez, T.A.; Junior, S.O.; de Paula, E. Physico-chemical characterization of benzacoine- β-cylodextrin inclusion complexes. J. Pharm. Biomed. Anal. 2005, 39, 956–963. [Google Scholar] [CrossRef]
- Aleem, O.; Kuchekar, B.; Pore, Y.; Late, S. Effect of β-cyclodextrin and hydroxypropyl β-cyclodextrin complexation on physicochemical properties and antimicrobial activity of cefdinir. J. Pharm. Biomed. Anal. 2008, 47, 535–540. [Google Scholar] [CrossRef]
- Carrier, R.L.; Miller, L.A.; Ahmed, I. The utility of cyclodextrins for enhancing oral bioavailability. J. Control. Release 2007, 123, 78–99. [Google Scholar] [CrossRef]
- Cheirslip, B.; Rakmai, J. Inclusion complex formation of cyclodextrin with its guest and their applications. Bio. Eng. Med. 2016, 2, 1–6. [Google Scholar] [CrossRef] [Green Version]
- Caira, M.R.; Griffith, V.J.; Nassimbeni, L.R. X-ray structural comparison of the modes of inclusion of meclofenamate sodium and diclofenac dodium by β-cyclodextrin. J. Inclusion Phenom. Mol. Recog. Chem. 1998, 32, 461–476. [Google Scholar] [CrossRef]
- Nishioka, F.; Nakanishi, I.; Fujiwara, T.; Tomita, K. The crystal and molecular structure of the β-cyclodextrin inclusion complex with aspirin and salicylic acid. J. Incl. Phenom. Mol. Recognit. Chem. 1984, 2, 701–714. [Google Scholar] [CrossRef]
- Brown, G.R.; Caira, M.R.; Nassimbeni, L.R.; van Oudtshoorn, B. Inclusion of ibuprofen by heptakis(2,3,6-tri-O-methyl)-β-cyclodextrin: An X-ray diffraction and thermal analysis study. J. Incl. Phenom. Mol. Recognit. Chem. 1996, 26, 281–294. [Google Scholar] [CrossRef]
- Harata, K.; Uekama, K.; Imai, T.; Hirayama, F.; Otagiri, M. Crystal structures of heptakis(2,3,6-tri-O-methyl)-β-cyclodextrin complexes with (R)- and (S)-flurbiprofen. J. Incl. Phenom. Mol. Recognit. Chem. 1988, 6, 443–460. [Google Scholar] [CrossRef]
- Caira, M.R.; Griffith, V.J.; Nassimbeni, L.R.; van Oudtshoorn, B. X-ray structure and thermal analysis of a 1:1 complex between (S)-naproxen and heptakis(2,3,6-tri-O-methyl)-β-cyclodextrin. J. Incl. Phenom. Mol. Recognit. Chem. 1995, 20, 277–290. [Google Scholar] [CrossRef]
- Tayade, P.T.; Vavia, P.R. Inclusion complexes of ketoprofen with β-cyclodextrins: Oral pharmacokinetics of ketoprofen in human. Indian J. Pharm. Sci. 2006, 68, 164–170. [Google Scholar] [CrossRef] [Green Version]
- Obaid, A.; Jamil, A.K.M.; Prabu, S.; Saharin, S.M.; Mohamad, S. Spectroscopic studies for the inclusion complexation of ketoprofen enantiomers with β-cyclodextrin. Spectrocim. Acta A Mol. Biomol. Spectrosc. 2020, 241, 1–9. [Google Scholar] [CrossRef] [PubMed]
- Mura, P.; Faucci, M.T.; Parrini, P.L.; Furlanetto, S.; Pinzauti, S. Influence of the preparation method on the physicochemical properties of ketoprofen-cyclodextrin binary systems. Int. J. Pharm. 1999, 179, 117–128. [Google Scholar] [CrossRef]
- Pereva, S.; Nikolova, V.; Sarafska, T.; Angelova, S.; Spassov, T.; Dudev, T. Inclusion complexes of ibuprofen and β-cyklodextrin: Submolecular structure and stability. J. Mol. Struct. 2020, 1205, 1–7. [Google Scholar] [CrossRef]
- Sharma, N.; Baldi, A. Exploring versatile applications of cyclodextrins: An overview. Drug Deliv. 2014, 23, 1–19. [Google Scholar] [CrossRef]
- Pereva, S.; Sarafska, T.; Bogdanova, S.; Spassov, T. Efficiency of ‘’cyclodextrin-ibuorofen’’ inclusion complex formation. J. Drug Deliv. Sci. Technol. 2016, 35, 34–39. [Google Scholar] [CrossRef] [Green Version]
- Lin, S.Z.; Wouessidjewe, D.; Poelman, M.C.; Duchene, D. Indomethacin and cyclodextrin complexes. Int. J. Pharm. 1991, 69, 211–219. [Google Scholar] [CrossRef]
- EMA. Cyclodextrins Used as Excipients. 2017. Available online: https://www.ema.europa.eu/en/documents/scientific-guideline/questions-answers-cyclodextrins-used-excipients-medicinal-products-human-use_en.pdf (accessed on 19 May 2021).
- Osadebe, P.O.; Onugwu, L.E.; Attama, A.A. Energetics of the interaction between piroxicam and beta-cyclodextrin (β-CD) in inclusion complexes. Sci. Res. Essay 2008, 3, 086–093. [Google Scholar] [CrossRef]
- Kriegner, D.; Matěj, Z.; Kužel, R.; Holý, V. Powder diffraction in Bragg-Brentano geometry with straight linear detectors. J. Appl. Crystallogr. 2015, 48 Pt 2, 613–618. [Google Scholar] [CrossRef] [Green Version]
- Wang, I.C.; Lee, M.J.; Seo, D.Y.; Lee, H.E.; Choi, Y.; Kim, W.S.; Kim, C.S.; Jeong, M.Y.; Choi, G.J. Polymorph transformation in paracetamol monitored by in-line NIR spectroscopy during a cooling crystallization process. AAPS Pharm. Sci. Tech. 2011, 12, 764–770. [Google Scholar] [CrossRef] [PubMed] [Green Version]
- Rigaku Oxford Diffraction; CrysAlisPro Software System 1.171.38.35a; Rigaku Corporation: Oxford, UK, 29 June 2015.
- Burla, M.C.; Caliandro, R.; Carrozzini, B.; Cascarano, G.L.; Cuocci, C.; Giacovazzo, C.; Mallamo, M.; Mazzone, A.; Polidori, G. Crystal structure determination and refinement via SIR2014. J. Appl. Cryst. 2015, 48, 306–309. [Google Scholar] [CrossRef]
- Burla, M.C.; Caliandro, R.; Camalli, M.; Carrozzini, B.; Cascarano, G.L.; de Caro, L.; Giacovazzo, C.; Polidori, G.; Spagna, R. SIR2004: An improved tool for crystal structure determination and refinement. J. Appl. Cryst. 2005, 38, 381–388. [Google Scholar] [CrossRef] [Green Version]
- Barbour, L.J. X-Seed – A Software Tool for Supramolecular Crystallography. J. Supramol. Chem. 2001, 1, 189–191. [Google Scholar] [CrossRef]
- Hübschle, C.B.; Sheldrick, G.M.; Dittrich, B. ShelXle: A Qt graphical user interface for SHELXL. J. Appl. Cryst. 2011, 44, 1281–1284. [Google Scholar] [CrossRef] [Green Version]
- Sheldrick, G.M. Crystal structure refinement with SHELXL. Acta Cryst. 2015, C71, 3–8. [Google Scholar] [CrossRef]
- Katrusiak, A. Crystallographic autostereograms. J. Mol. Graph. Model 2001, 19, 363–367. [Google Scholar] [CrossRef]
- Persistence of Vision Pty. Ltd. Persistence of Vision (TM) Raytracer; Persistence of Vision Pty. Ltd.: Williamstown, VIC, Australia, 2004; Available online: http://www.povray.org/ (accessed on 19 May 2021).
- Wishart, D.S.; Bigam, C.G.; Yao, J.; Abildgaard, F.; Dyson, H.J.; Oldfield, E.; Markley, J.L.; Sykes, B.D. 1H, 13C and 15N chemical shift referencing in biomolecular NMR. J. Biomol. NMR 1995, 6, 135–140. [Google Scholar] [CrossRef]
- Li, Z.Z.; Guo, Q.X.; Ren, T.; Zhu, X.Q.; Liu, Y.C. Can TMS and DSS be used as NMR references for cyclodextrin species in aqueous solution? J. Incl. Phenom. Mol. Recognit. Chem. 1993, 15, 37–42. [Google Scholar] [CrossRef]
- Wider, G.; Dötsch, V.; Wüthrich, K. Self-Compensating Pulsed Magnetic-Field Gradients for Short Recovery Times. J. Magn. Reson. A 1994, 108, 255–258. [Google Scholar] [CrossRef]
- Wu, D.; Chen, A.; Johnson, C.S., Jr. An Improved Diffusion-Ordered Spectroscopy Experiment Incorporating Bipolar-Gradient Pulses. J. Magn. Reson. A 1995, 115, 260–264. [Google Scholar] [CrossRef]
- Waldeck, A.R.; Kuchel, P.W.; Lennon, A.J.; Chapman, B.E. NMR diffusion measurements to characterize membrane transport and solute binding. Prog. Nucl. Magn. Reson. Spectr. 1997, 30, 39–68. [Google Scholar] [CrossRef]
- Marconi, G.; Mezzina, E.; Manet, I.; Manoli, F.; Zambelli, B.; Monti, S. Stereoselective interaction of ketoprofen enantiomers with β-cyclodextrin: Ground state binding and photochemistry. Photochem. Photobiol. Sci. 2011, 10, 48–59. [Google Scholar] [CrossRef] [PubMed]
- Guzzo, T.; Mandaliti, W.; Nepravishta, R.; Aramini, A.; Bodo, E.; Daidone, I.; Allegretti, M.; Topai, A.; Paci, M. Conformational change in the mechanism of inclusion of ketoprofen in β-cyclodextrin: NMR spectroscopy, Abi calculations, molecular dynamics simulations, and photoreactivity. J. Phys. Chem. B 2016, 120, 10668–10678. [Google Scholar] [CrossRef]
- Rozou, S.; Michaleas, S.; Antoniadou-Vyza, E. Study of structural features and thermodynamic parameters, determining the chromatographic behavior of drug-cyclodextrin complexes. J. Chromatogr. A 2005, 1087, 86–94. [Google Scholar] [CrossRef] [PubMed]
- Evans, R.; Poggetto, G.D.; Nilsson, M.; Morris, G. Improving the interpretation of small molecule diffusion coefficients. Anal. Chem. 2018, 90, 3987–3994. [Google Scholar] [CrossRef] [Green Version]


| Empirical formula | C58H106O49 |
| Formula weight | 1587.42 |
| Temperature | 297(2) K |
| Wavelength | 1.54184 Å |
| Crystal system | Monoclinic |
| Space group | P21 |
| Unit cell dimensions | a = 15.1158(3) Å |
| b = 32.3308(7) Å | |
| c = 15.5546(2) Å | |
| ß = 101.966(2)°. | |
| Volume | 7436.4(2) Å3 |
| Z | 4 |
| Density (calculated) | 1.418 mg/cm3 |
| Absorption coefficient | 1.085 mm−1 |
| F(000) | 3384 |
| Crystal size | 0.177 × 0.222 × 0.451 mm3 |
| θ range for data collection | 2.733 to 64.506° |
| Index ranges | −17 ≤ h ≤ 17, −37 ≤ k ≤ 37, −18 ≤ l ≤ 17 |
| Reflections collected | 129291 |
| Independent reflections | 24,889 [Rint = 0.0376] |
| Completeness to theta = 64.506° | 99.7% |
| Data/restraints/parameters | 24,889 / 2607 / 2212 |
| Goodness-of-fit on F2 | 1.075 |
| Final R indices [I > 2σ(I)] | R1 = 0.0661, wR2 = 0.1806 |
| R indices (all data) | R1 = 0.0708, wR2 = 0.1889 |
| Absolute structure parameter | 0.00(4) |
| Extinction coefficient | n/a |
| Largest diff. peak and hole | 0.691 and −0.440 e·Å−3 |
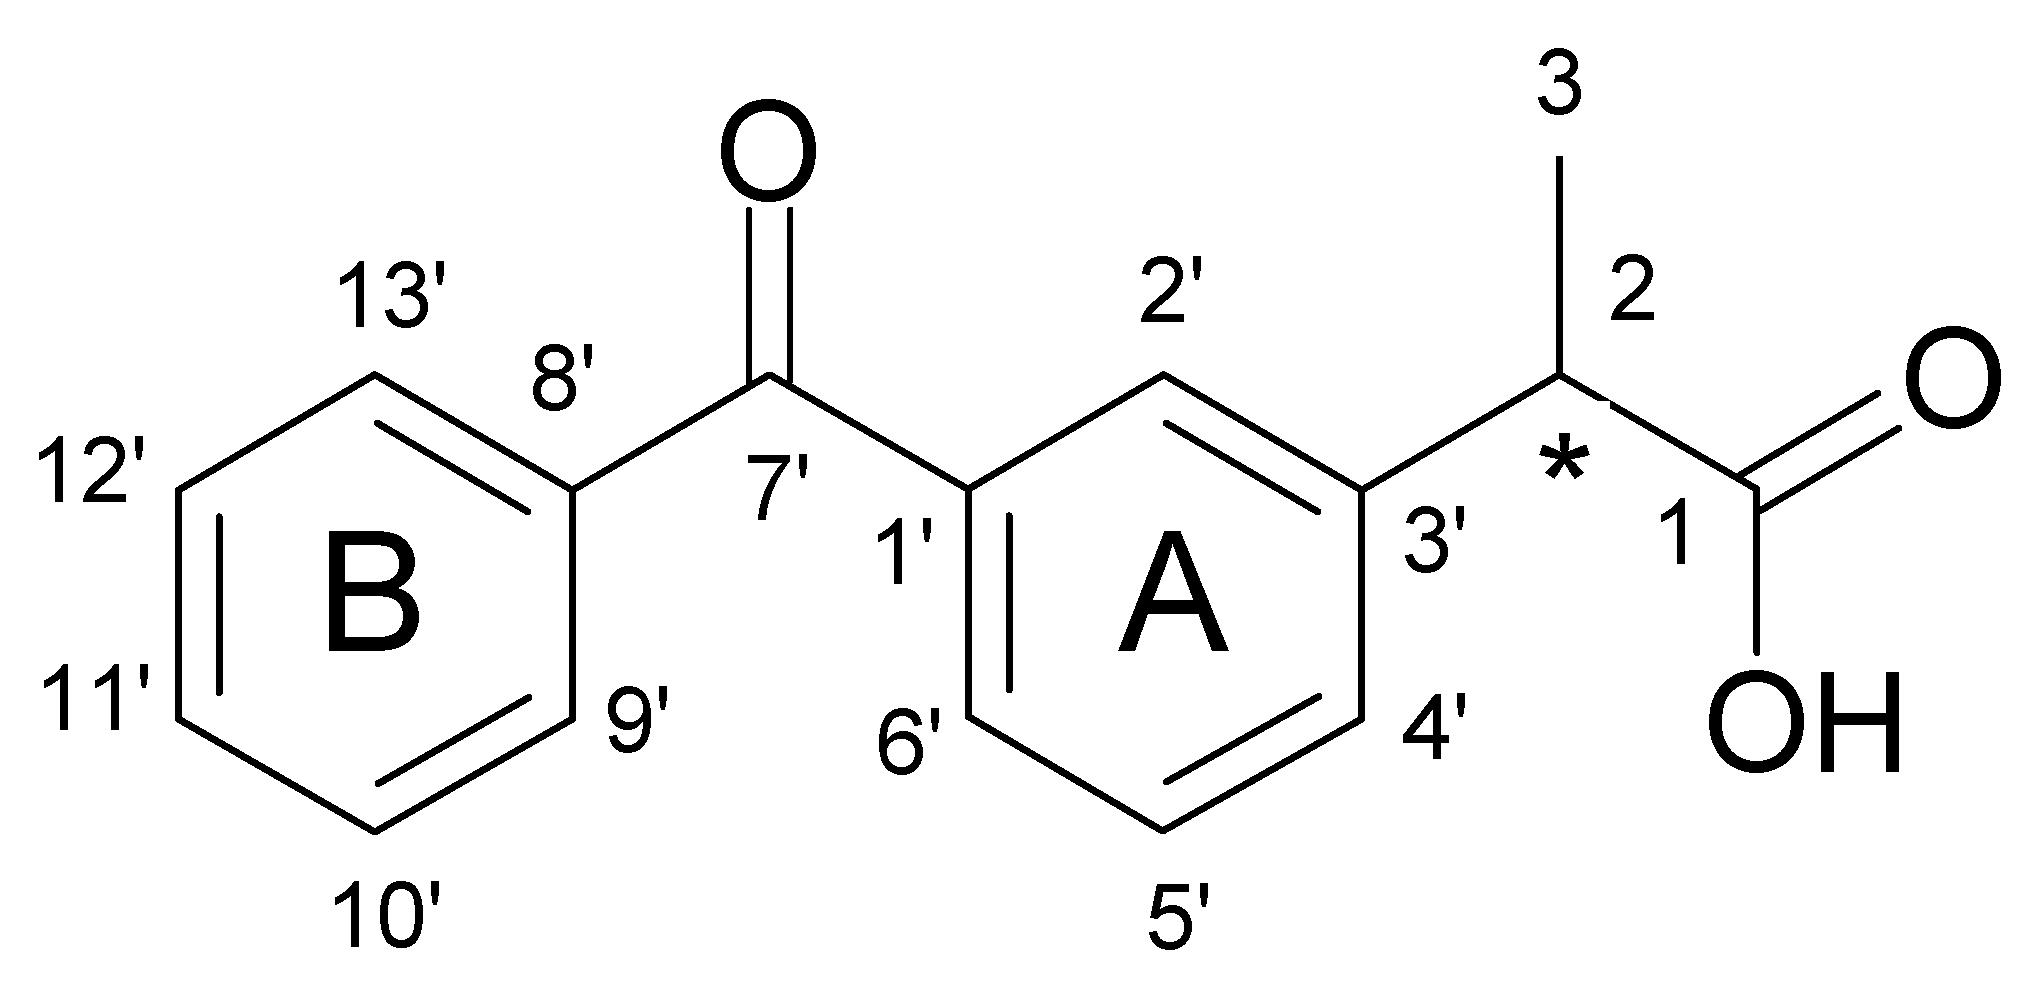
| Numbering of Atom Position (See Figure 9) | Corresponding Atoms Numbering in Crystal Structure (See Figure S1) | δ1H * | δ13C # |
|---|---|---|---|
| 1 (C = O) | C(3) | - | 184.0 (H3, H2) |
| 2 (CH) | C(4) | 3.84 (q, 1H, JHH = 7.2) | 49.6 (H3, H4′) |
| 3 (CH3) | C(5) | 1.47 (d, 3H, JHH = 7.2) | 20.8 (H2) |
| 1′ (C) | C(10) | - | 140.2 (H5′) |
| 2′ (CH) | C(11) | 7.74 (overlapped, 1H) | 132.3 (H2) |
| 3′ (C) | C(6) | - | 145.2 (H3, H2, H5′) |
| 4′ (CH) | C(7) | 7.67 (d, 1H, JHH = 7.7) | 135.6 (H2, H2′) |
| 5′ (CH) | C(8) | 7.56 (dd, 1H, JHH = 7.7, 7.7) | 131.9 |
| 6′ (CH) | C(9) | 7.72 (overlapped, 1H) | 131.9 (H4′) |
| 7′ (C = O) | C(12) | - | 204.0 (H9′/13′, H6′) |
| 8′ (C) | C(14) | - | 139.8 (H10′/12′) |
| 9′/13′ (CH) | C(15)/C(19) | 7.81 (dd, 2H, JHH = 8.3, 1.4) | 133.3 (H9′/13′, H11′) |
| 10′/12′ (CH) | C(16)/C(18) | 7.59 (dd, 2H, JHH = 8.3, 7.6) | 131.6 (H10′/12′) |
| 11′ (CH) | C(17) | 7.74 (overlapped, 1H) | 136.5 (H9′/13′) |
| Method Used to Obtain KP/β-CD Complex | Concentration | pH | Concentration [mM] | Molar Ration KP:β-CD | |
|---|---|---|---|---|---|
| KP | β-CD | ||||
| co-precipitation (1) | 3.0 mg/0.6 mL | 5.8 | 0.34 | 3.42 | 1:10 |
| evaporation (2) | 3.0 mg/0.6 mL | 5.8 | 0.05 | 3.73 | 1:75 |
| heating-under-reflux (3) | 1.2 mg/0.6 mL | 5.8 | 1.22 | 1.22 | 1:1 |
| Numbering of Atom Position (See Figure 9) | δ1H * | δ13C # |
|---|---|---|
| 1 (C = O) | - | 183.5 (H3, H2) |
| 2 (CH) | 3.83 (overlapped, 1H) | 49.6 (H3, H2′) |
| 3 (CH3) | 1.52 (d, 3H, JHH = 7.3) | 21.00 (H2) |
| 1′ (C) | - | 139.6 (H5′) |
| 2′ (CH) | 7.75 (overlapped, 1H) | 131.1 (H2) |
| 3′ (C) | - | 145.8 (H3, H2, H5′) |
| 4′ (CH) | 7.73 (overlapped, 1H) | 135.1 (H2, H2′, H6′) |
| 5′ (CH) | 7.55 (overlapped, 1H) | 131.4 |
| 6′ (CH) | 7.55 (overlapped, 1H) | 131.4 (H4′, H2′) |
| 7′ (C = O) | - | 202.5 (H9′/13′, H4′) |
| 8′ (C) | - | 139.5 (H10′/12′) |
| 9′/13′ (CH) | 7.75 (overlapped, 2H) | 132.3 (H9′/13′, H11′) |
| 10′/12′ (CH) | 7.60 (dd, 2H, JHH = 7.6, 7.6) | 131.2 (H10′/12′) |
| 11′ (CH) | 7.78 (overlapped, 1H) | 136.2 (H9′/13′) |
| Methods | Concentration (mM) | DOBS-L × 10−10m2s−1 | DOBS-CD × 10−10 m2s−1 | MF[CD·L] | Ka (M−1) | |
|---|---|---|---|---|---|---|
| CL | Cβ-CD | |||||
| 1 | 0.34 | 3.42 | 3.10 ± 0.10 | 2.70 ± 0.01 | 0.82 ± 0.05 | 1 460 ± 100 |
| 2 | 0.05 | 3.73 | 2.74 ± 0.10 | 2.56 ± 0.01 | 0.91 ± 0.05 | 3 320 ± 200 |
| 3 | 1.22 | 1.22 | 3.59 ± 0.10 | 2.56 ± 0.01 | 0.58 ± 0.05 | 2 480 ± 100 |
Publisher’s Note: MDPI stays neutral with regard to jurisdictional claims in published maps and institutional affiliations. |
© 2021 by the authors. Licensee MDPI, Basel, Switzerland. This article is an open access article distributed under the terms and conditions of the Creative Commons Attribution (CC BY) license (https://creativecommons.org/licenses/by/4.0/).
Share and Cite
Betlejewska-Kielak, K.; Bednarek, E.; Budzianowski, A.; Michalska, K.; Maurin, J.K. Comprehensive Characterisation of the Ketoprofen-β-Cyclodextrin Inclusion Complex Using X-ray Techniques and NMR Spectroscopy. Molecules 2021, 26, 4089. https://doi.org/10.3390/molecules26134089
Betlejewska-Kielak K, Bednarek E, Budzianowski A, Michalska K, Maurin JK. Comprehensive Characterisation of the Ketoprofen-β-Cyclodextrin Inclusion Complex Using X-ray Techniques and NMR Spectroscopy. Molecules. 2021; 26(13):4089. https://doi.org/10.3390/molecules26134089
Chicago/Turabian StyleBetlejewska-Kielak, Katarzyna, Elżbieta Bednarek, Armand Budzianowski, Katarzyna Michalska, and Jan K. Maurin. 2021. "Comprehensive Characterisation of the Ketoprofen-β-Cyclodextrin Inclusion Complex Using X-ray Techniques and NMR Spectroscopy" Molecules 26, no. 13: 4089. https://doi.org/10.3390/molecules26134089