Synthesis and Anti-Hepatocarcinoma Effect of Amino Acid Derivatives of Pyxinol and Ocotillol


Abstract
:1. Introduction
2. Results and Discussion
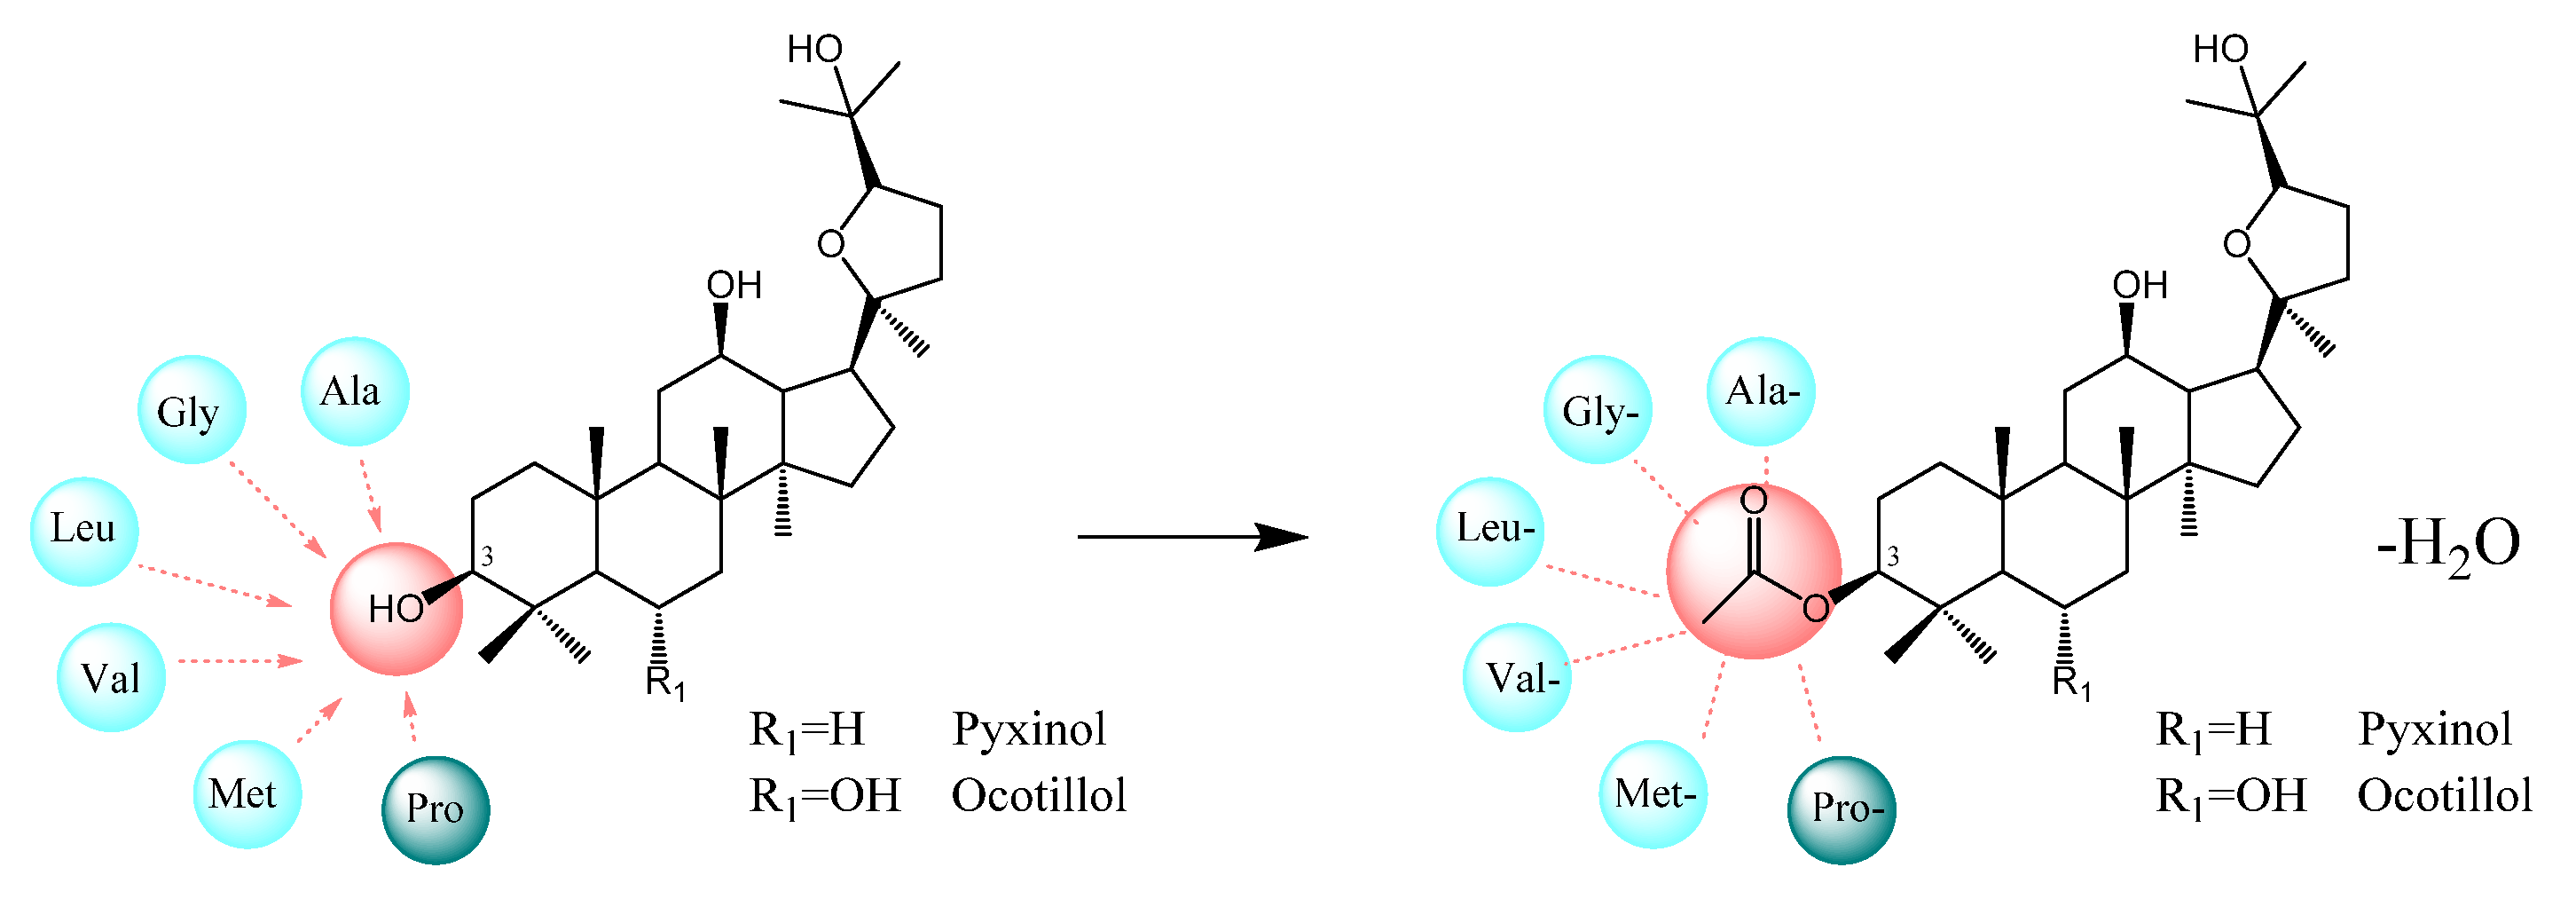
2.1. Design
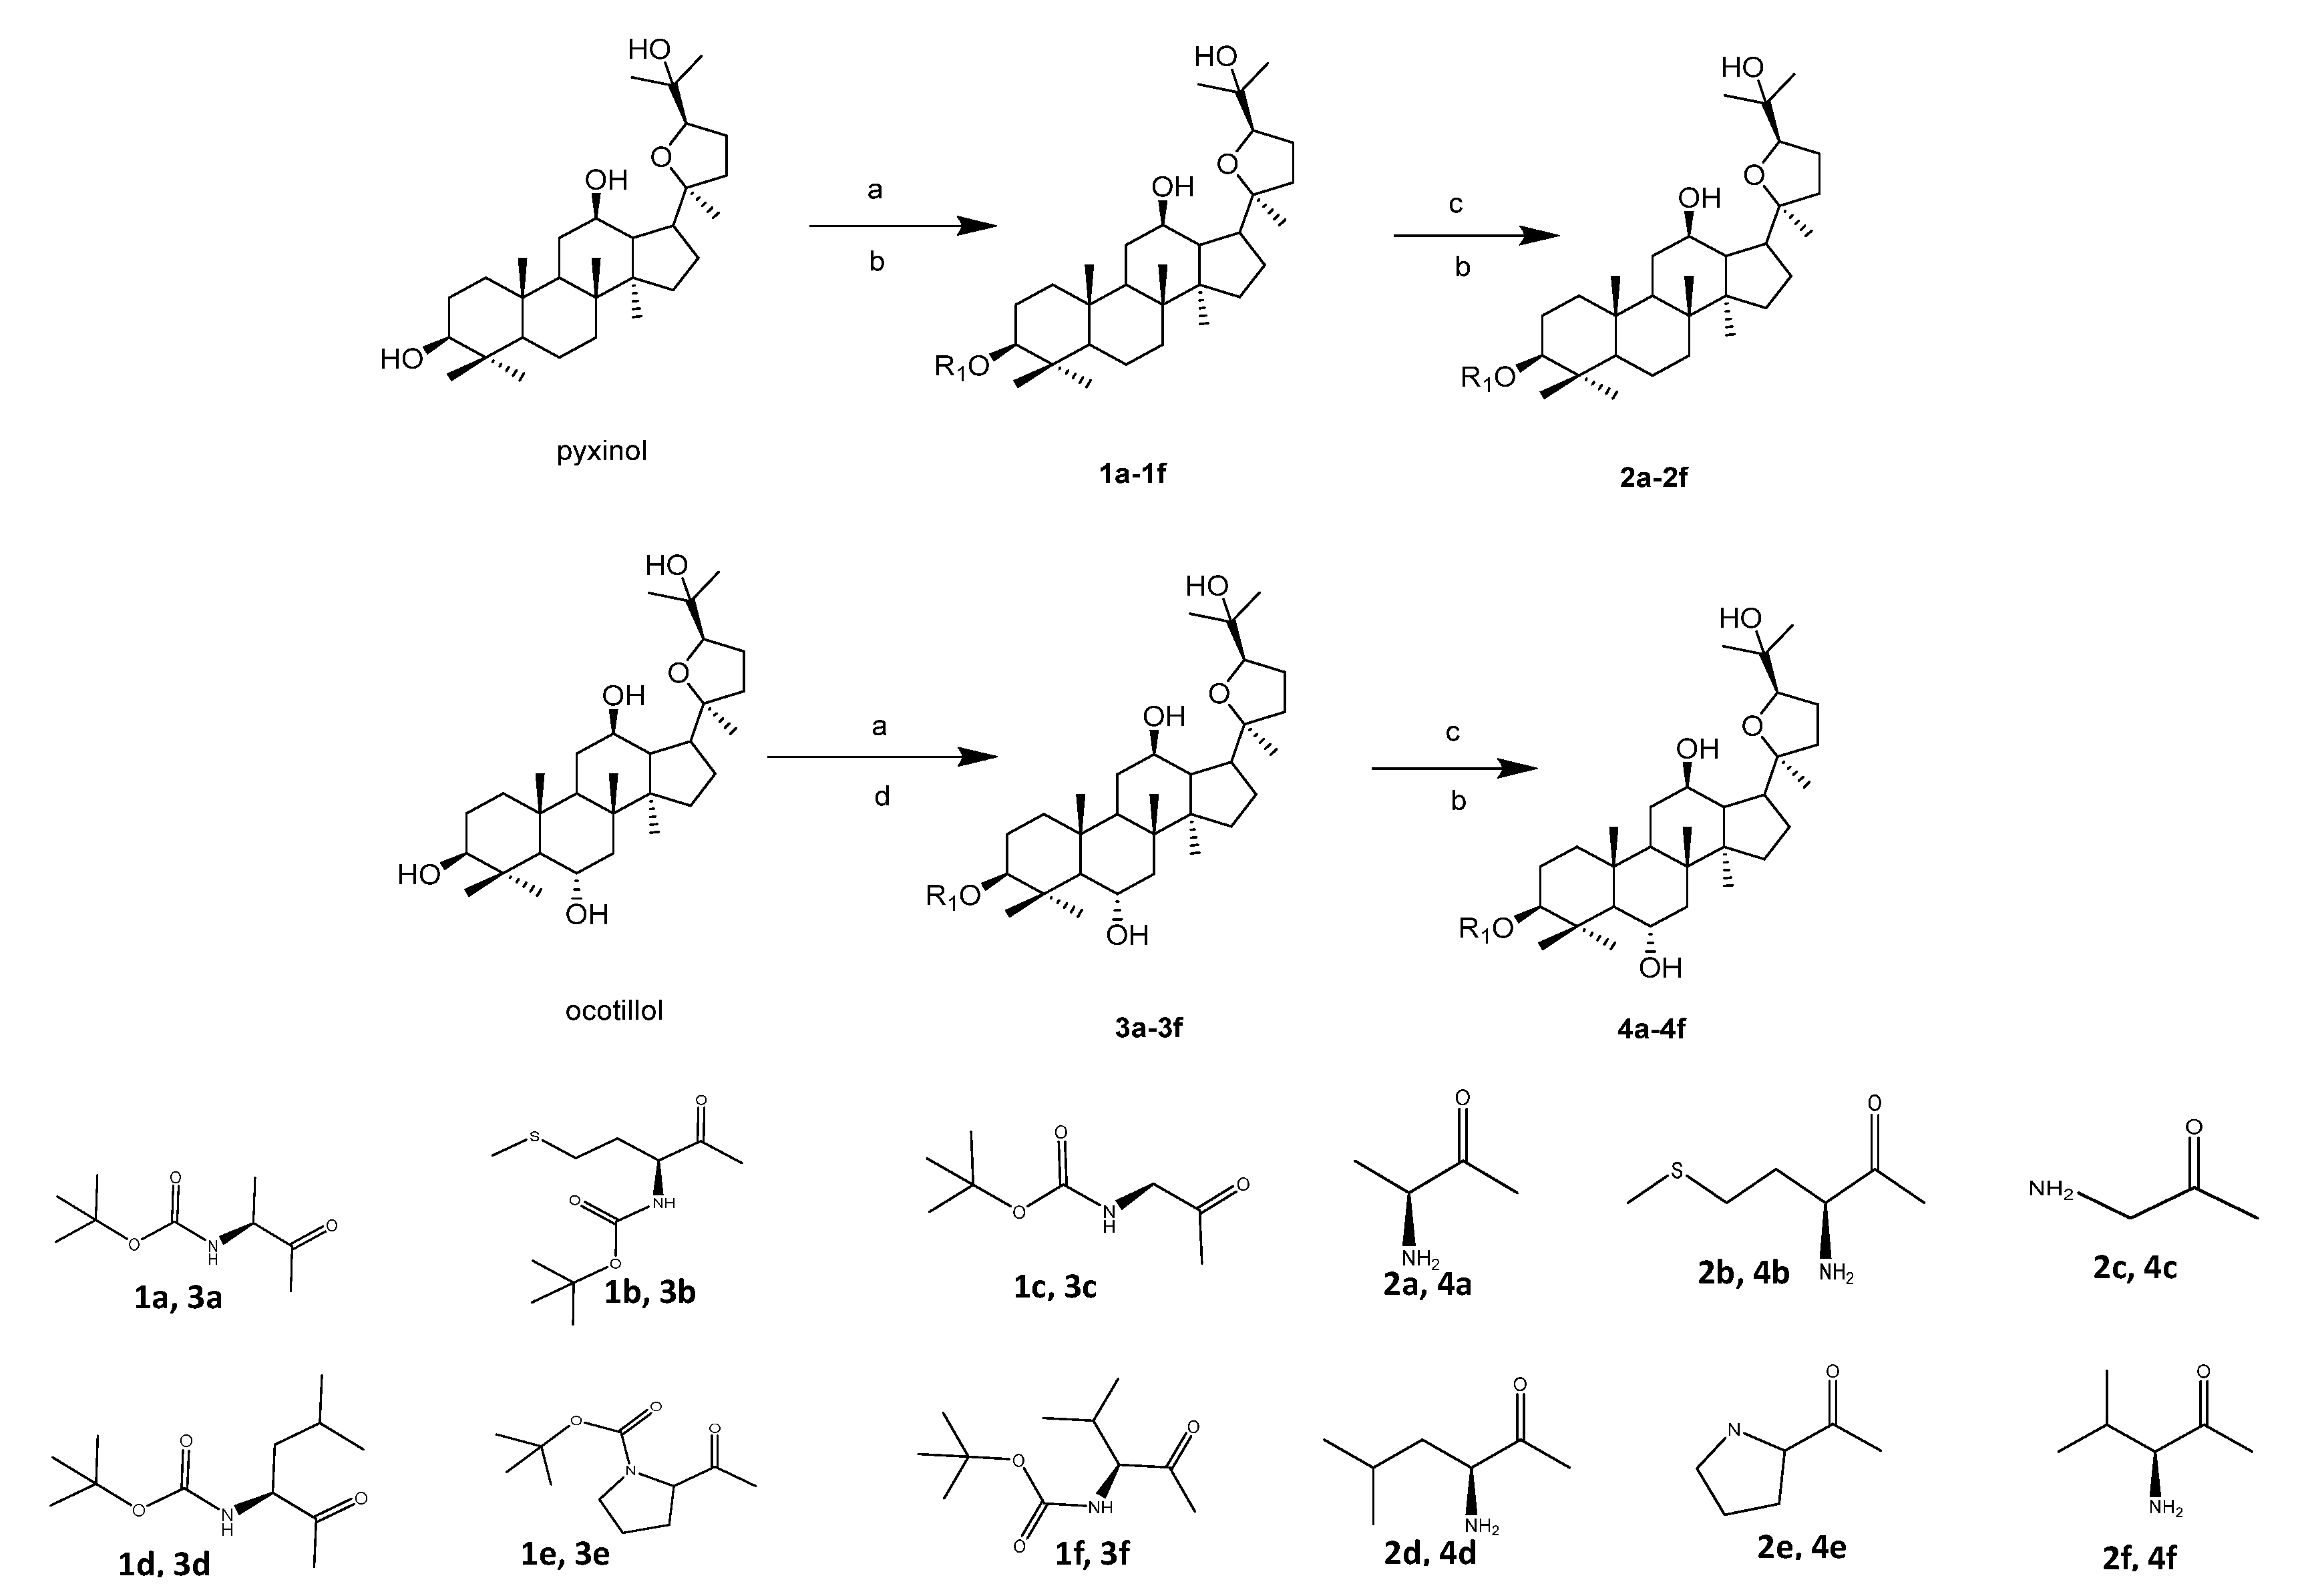
2.2. Chemistry
2.3. Cytotoxic Activity Determination on HepG2 Cells
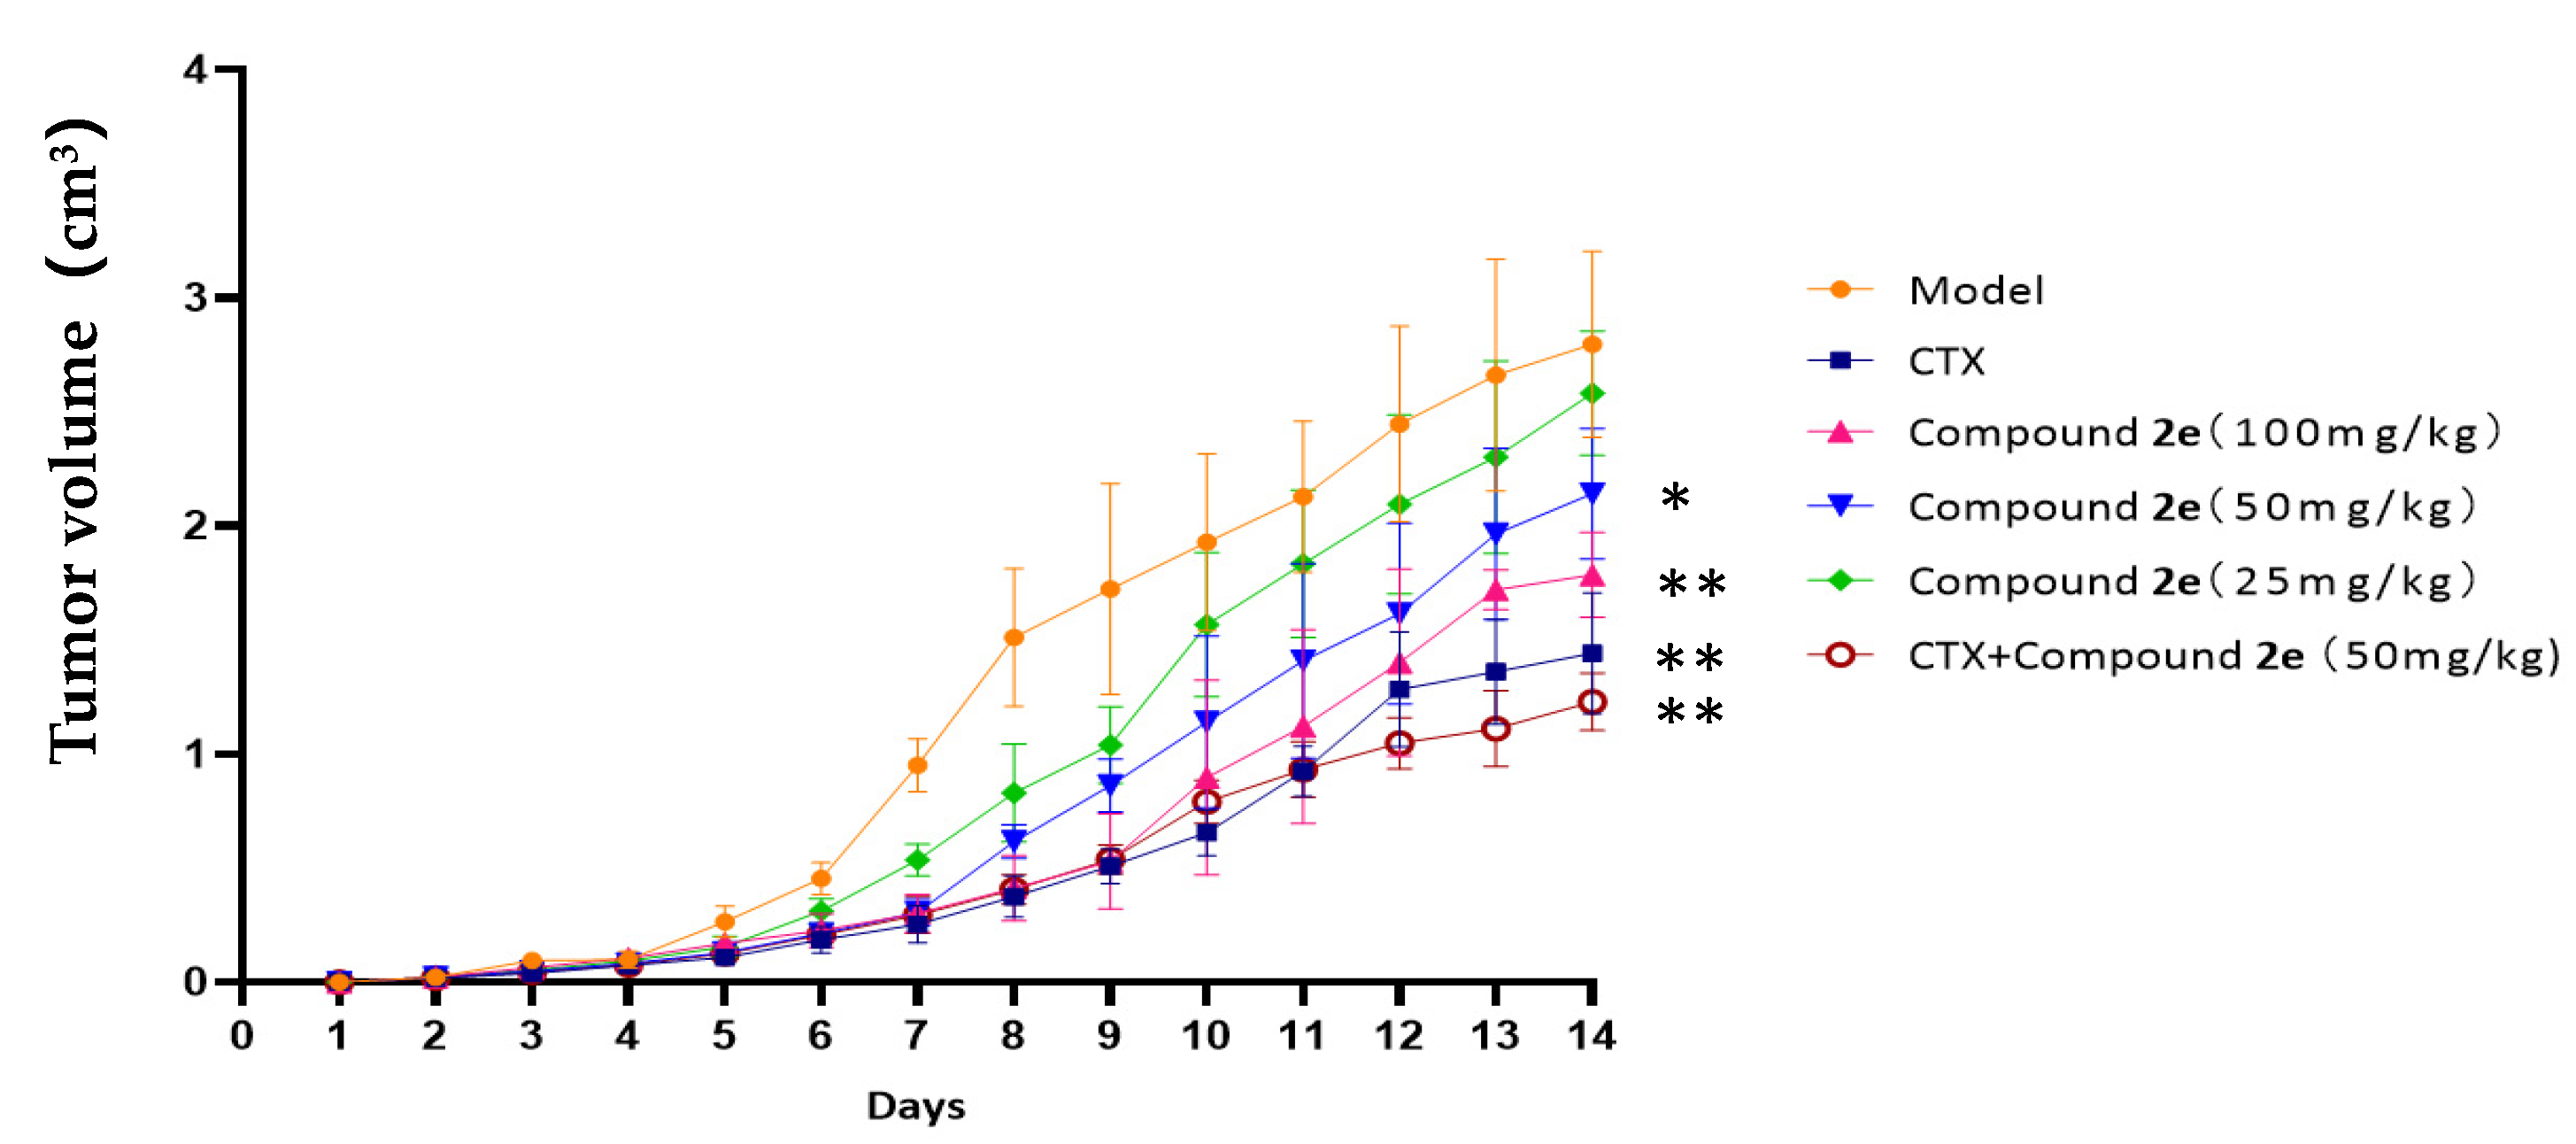
2.4. Effects of Compound 2e on H22 Tumor-Bearing Mice
2.4.1. Effect on Body Weight, Tumor Weight, Tumor Volume and Organ Indexes
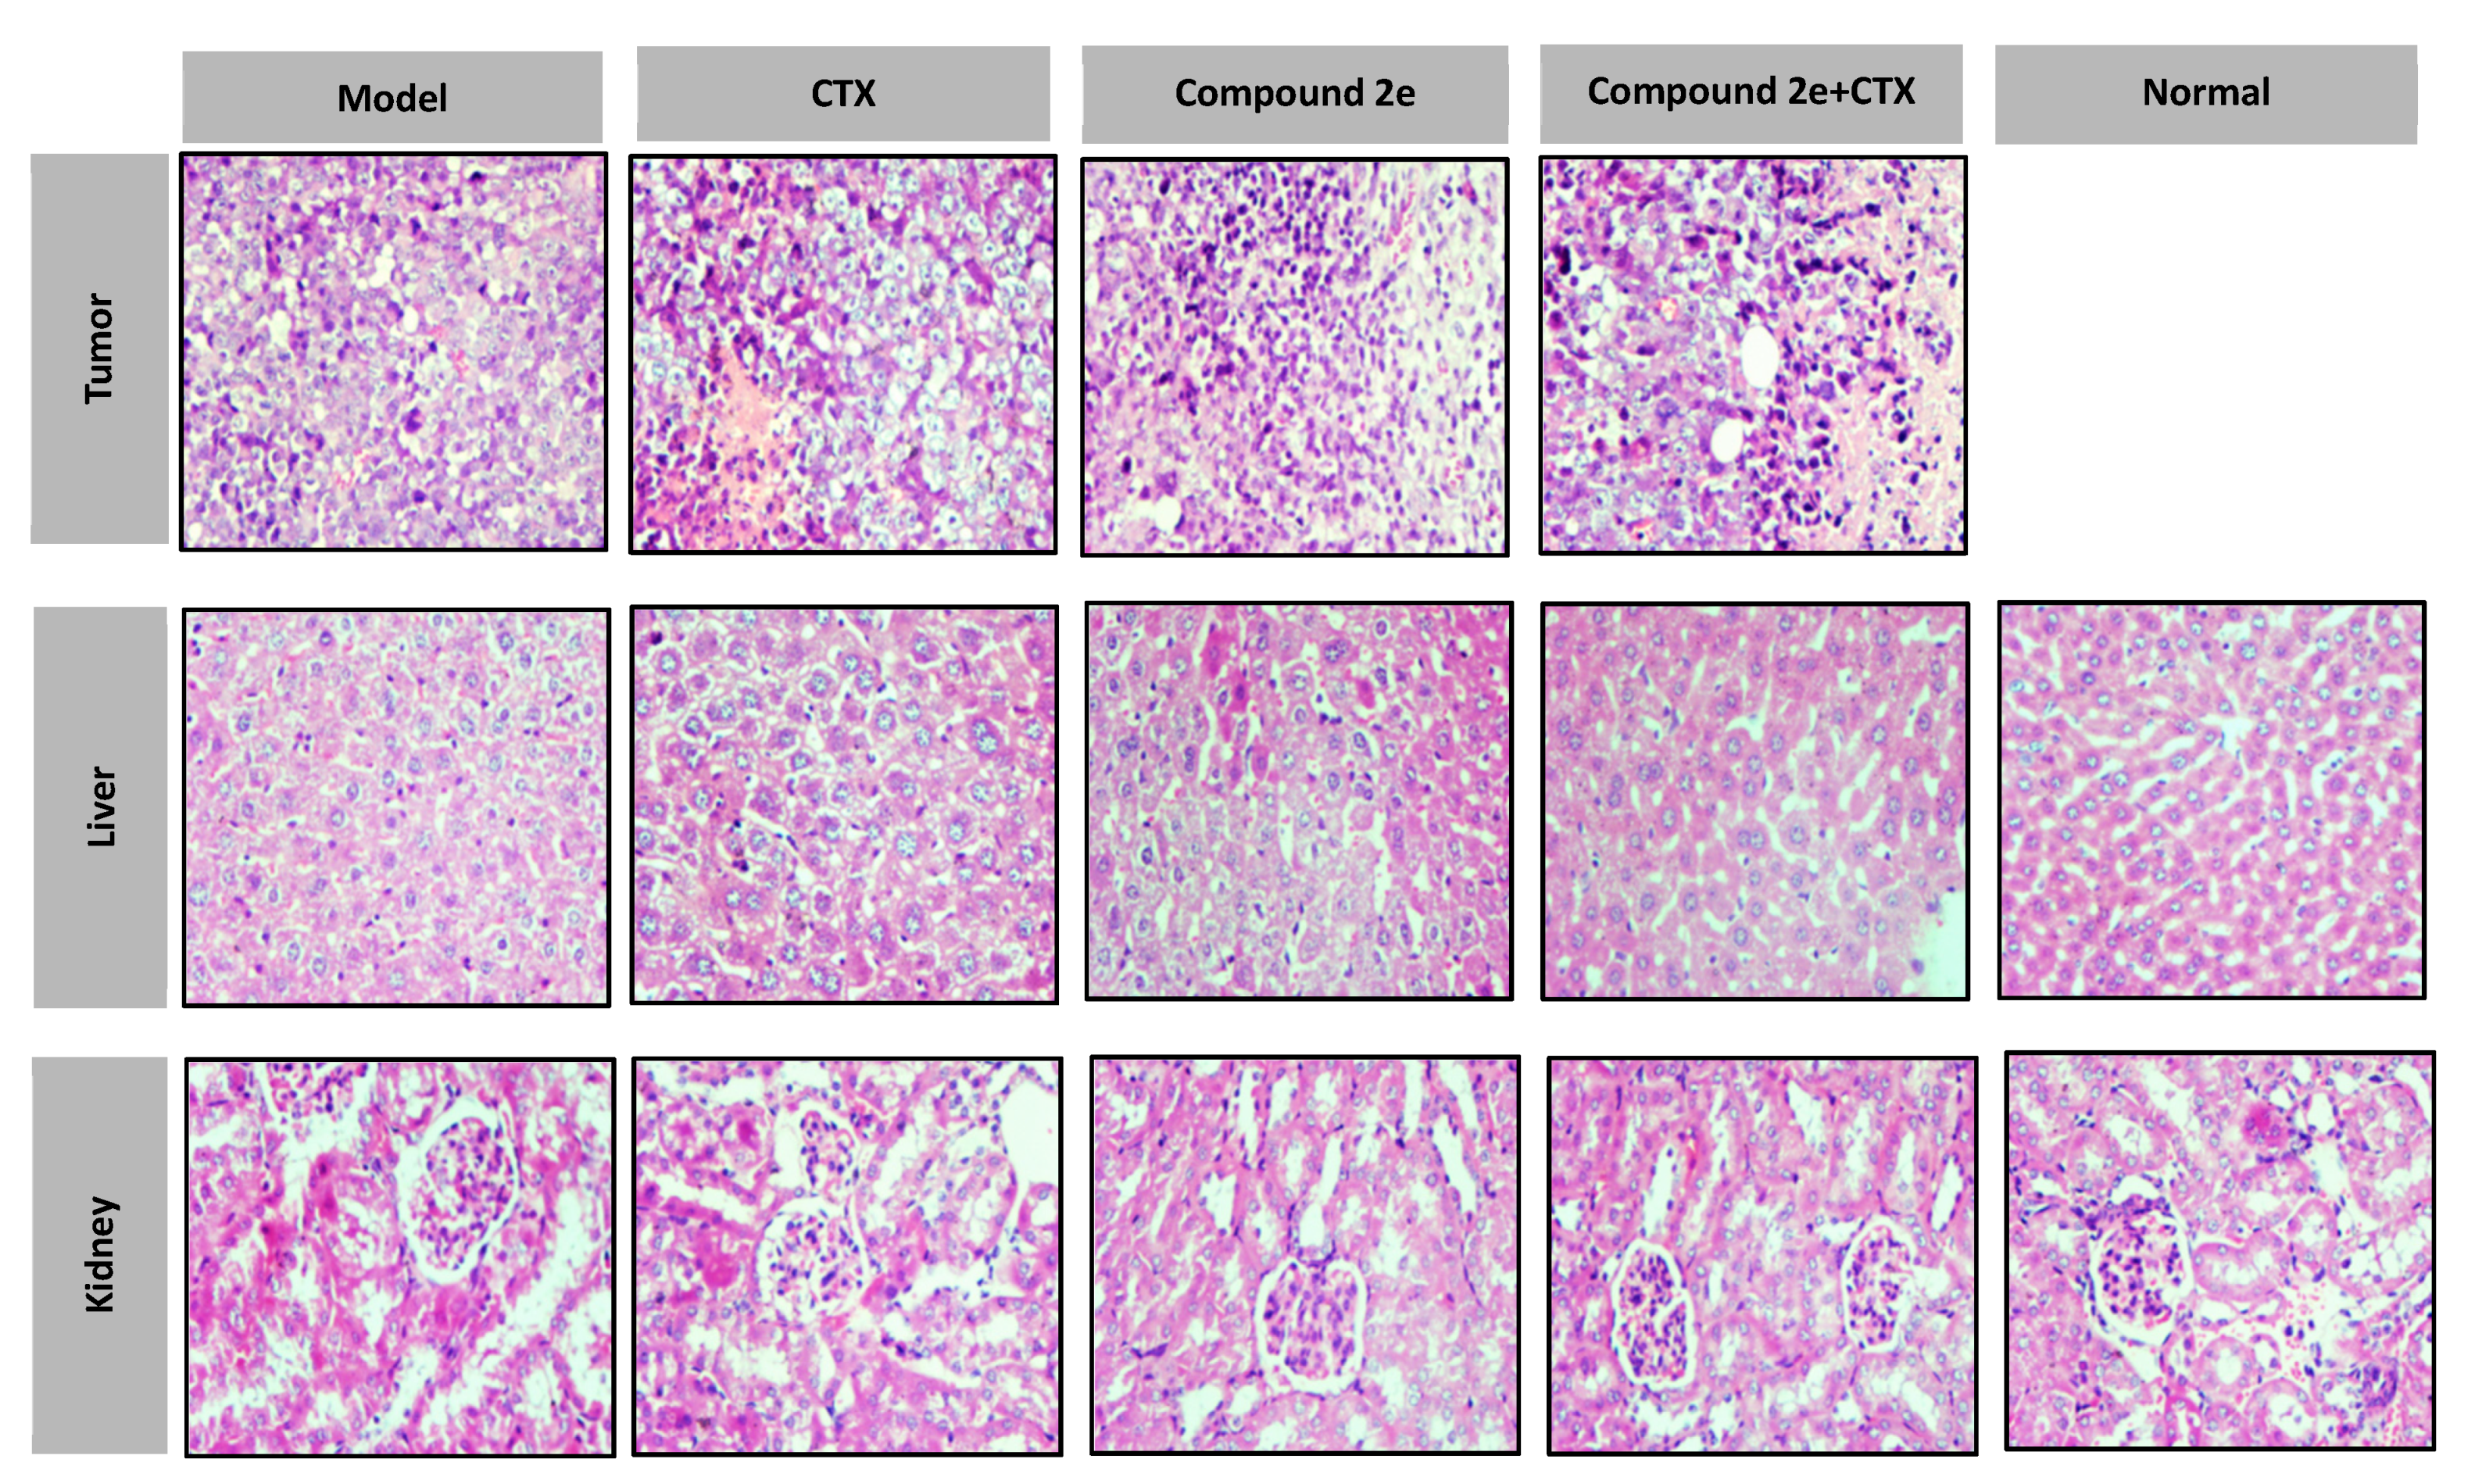
2.4.2. Histopathological Examination
2.4.3. Effects of Compound 2e Treatment on Cytokine Levels in Mice
2.4.4. Effects of Compound 2e Treatment on Hepatic and Renal Function
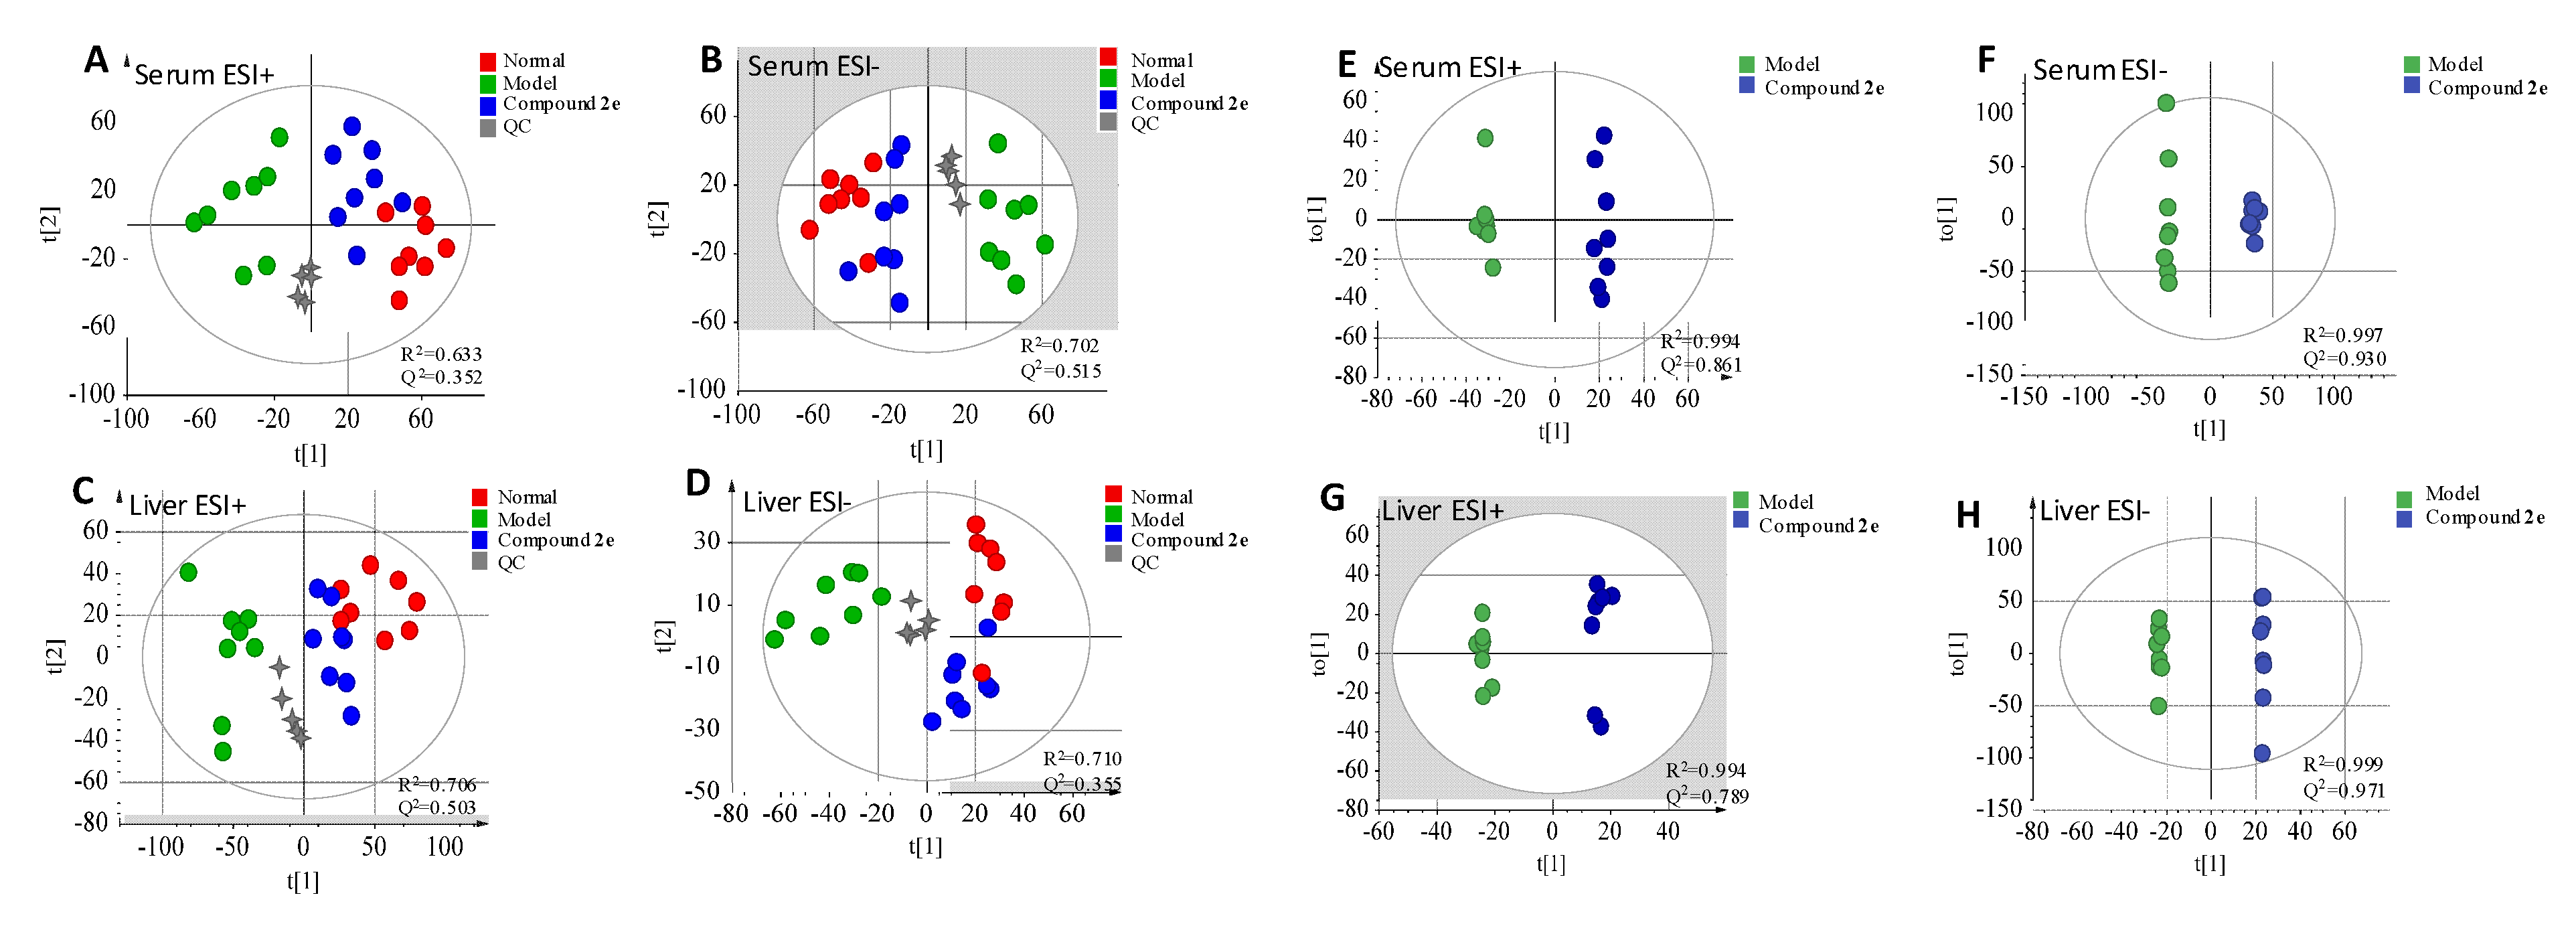
2.5. Metabolomics Study
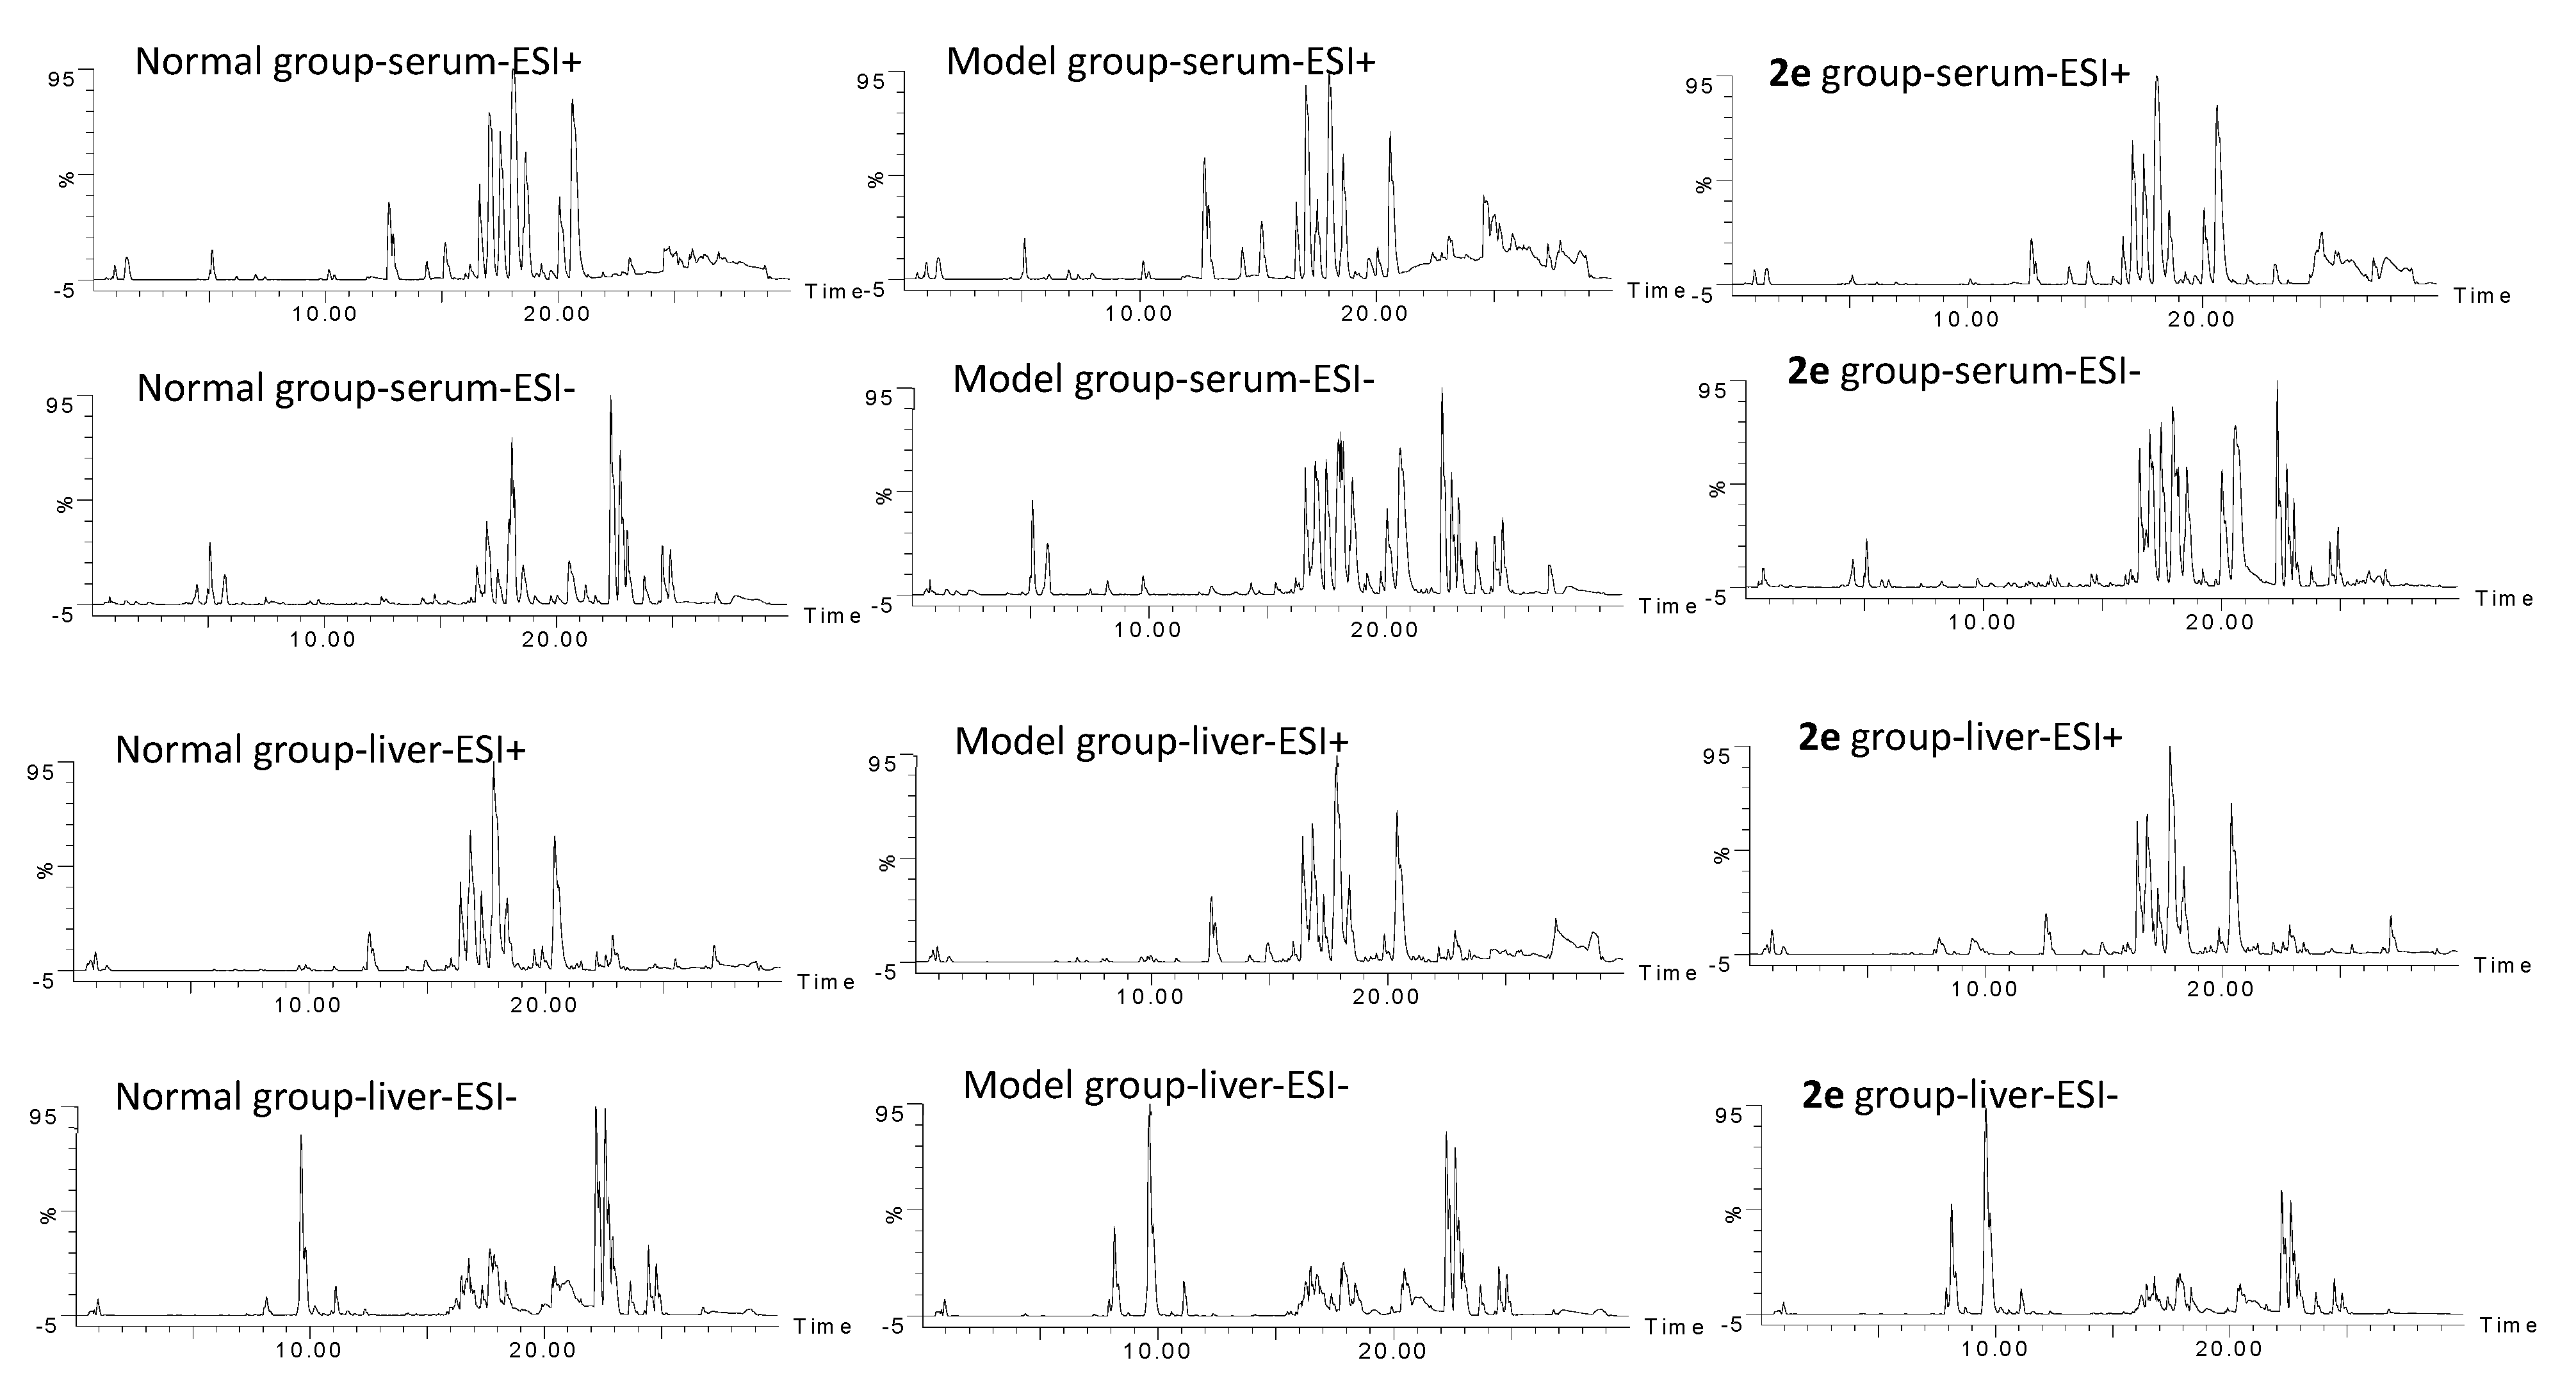
2.5.1. Validation of UPLC-QTOF-MS
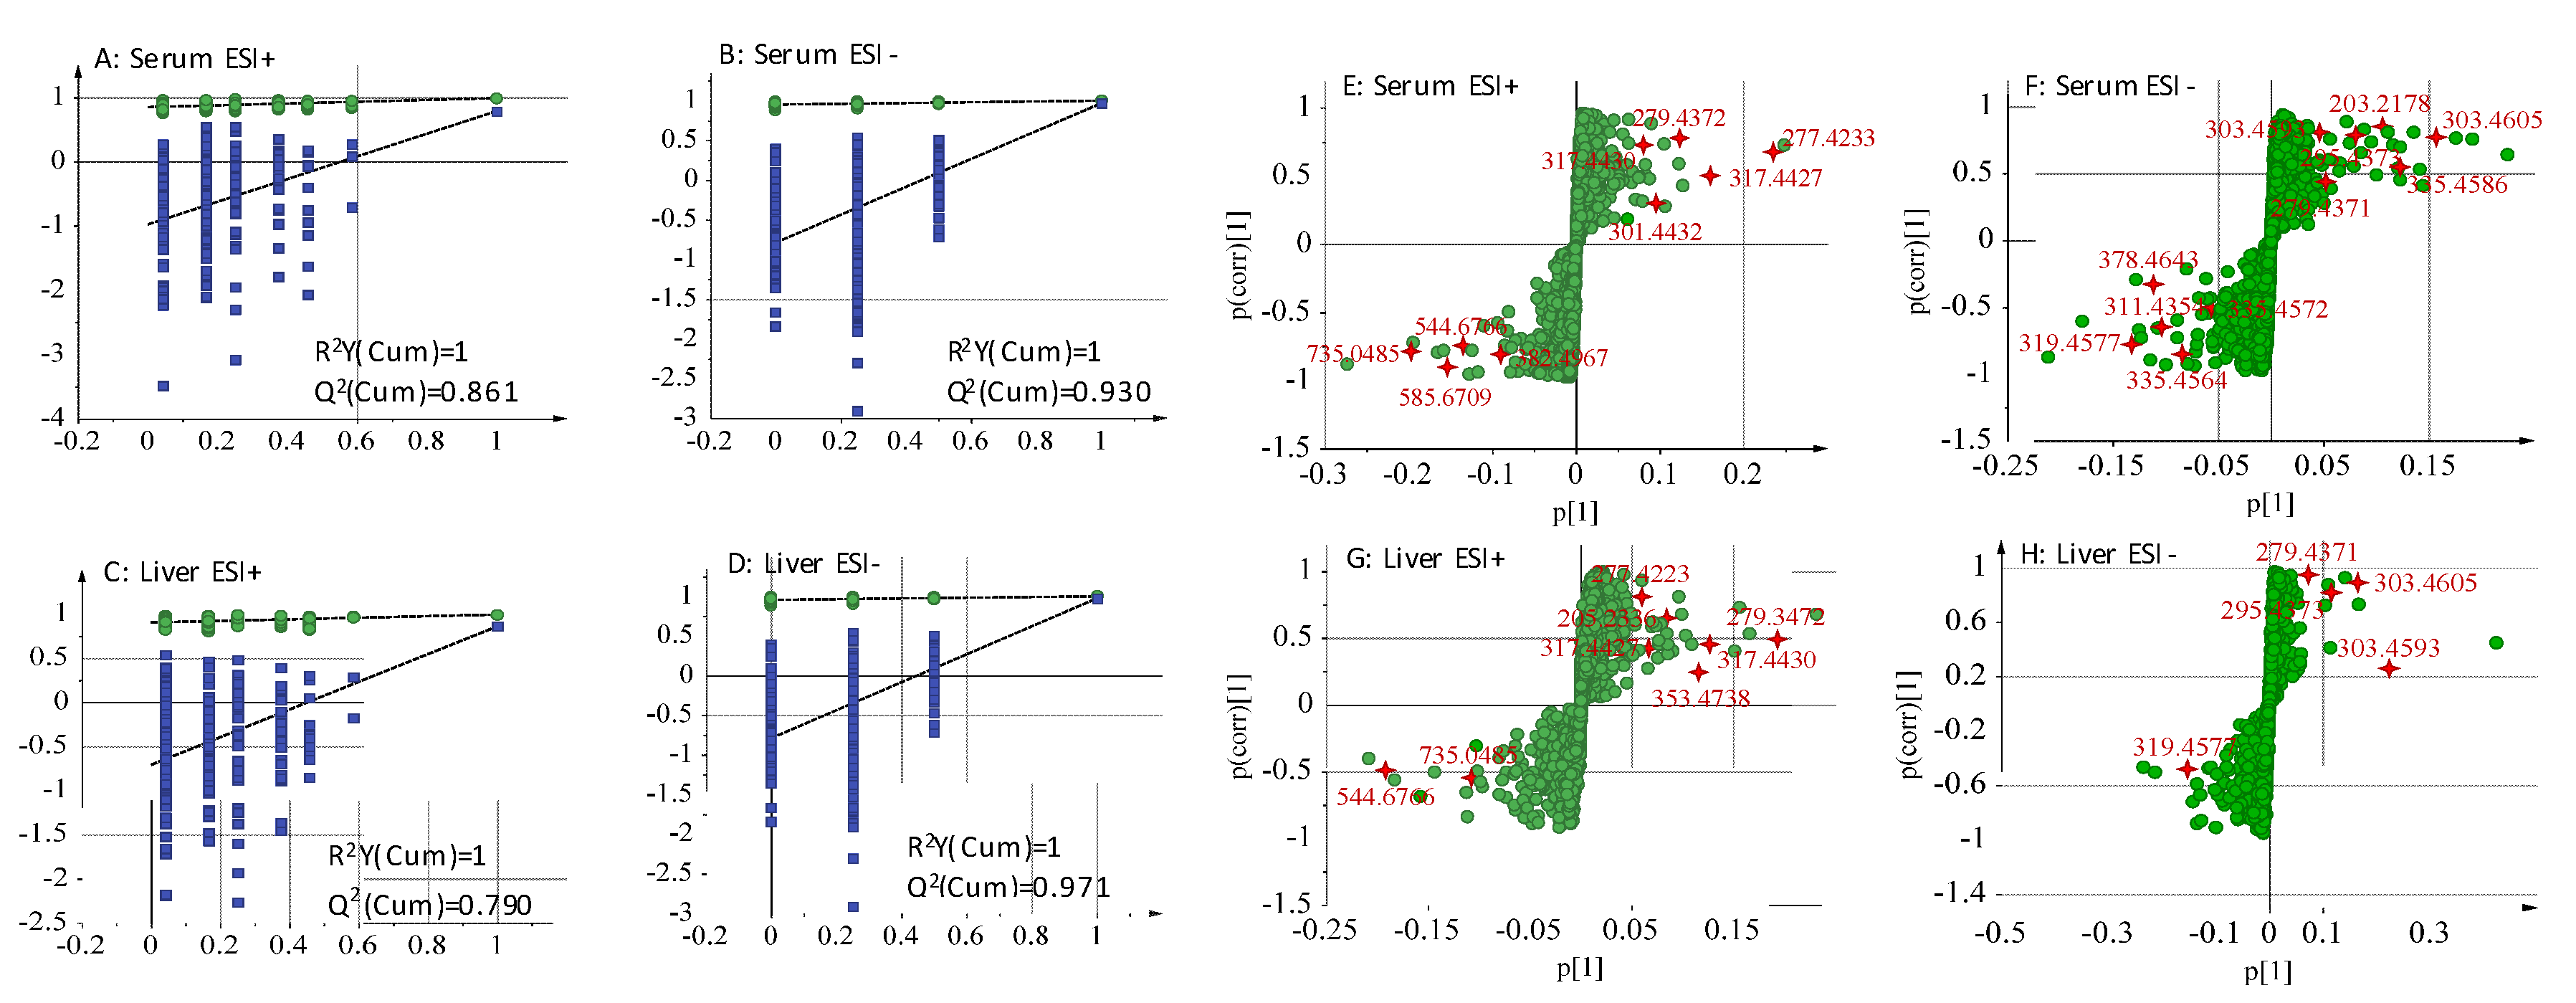
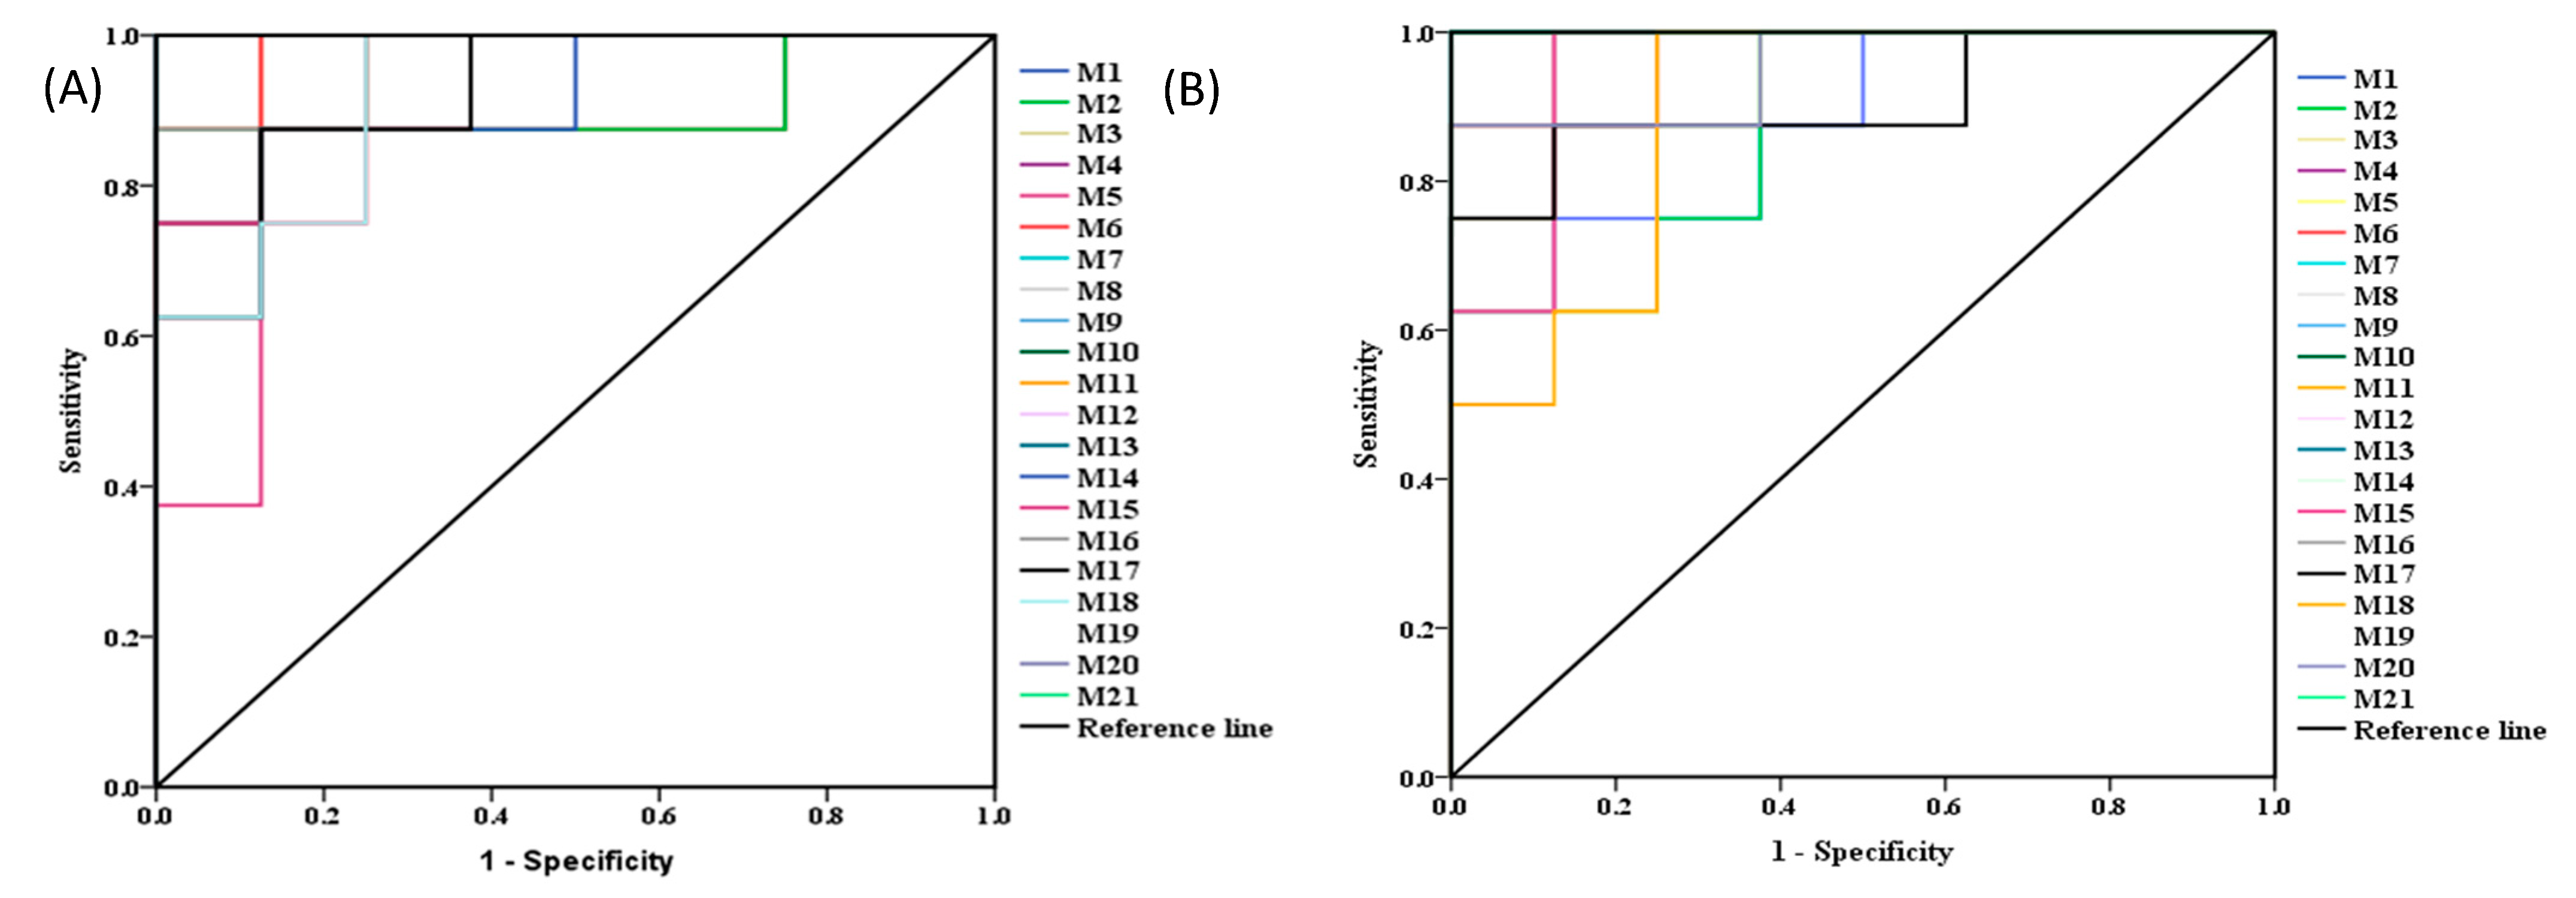
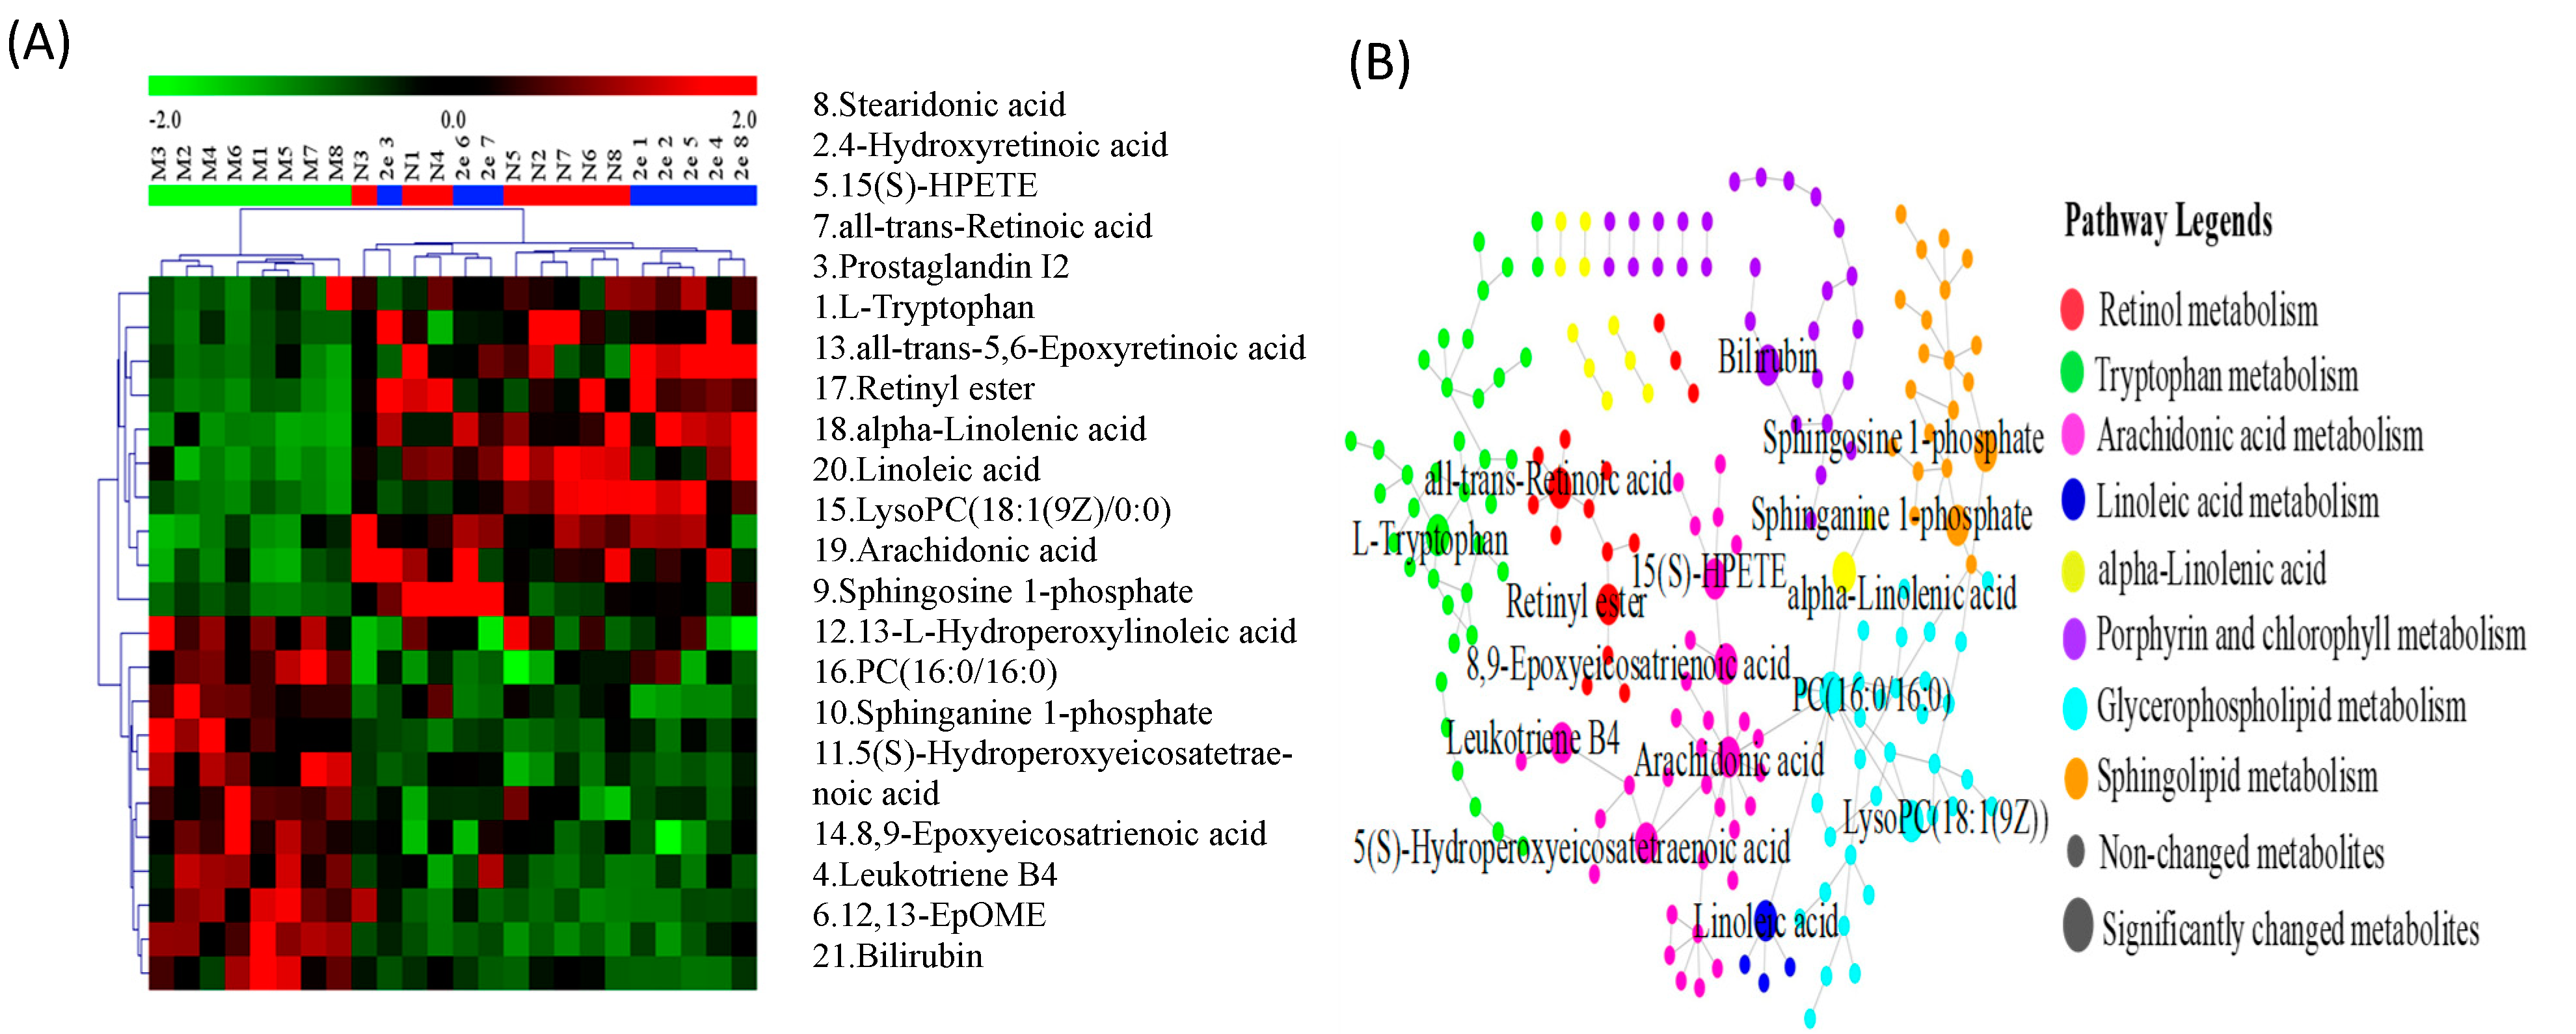
2.5.2. Identification of the Differential Metabolites and Metabolic Pathways
3. Materials and Method
3.1. Chemistry
3.1.1. The Synthesis of Compounds 1a–1f and 3a–3f
3.1.2. Synthesis of Compounds 2a–2f and 4a–4f
3.2. Cytotoxic Activity Determination on HepG2 Cells
3.2.1. Cell Culture
3.2.2. Cell Viability Assay
3.3. Effects of Compound 2e on H22 Tumor-Bearing Mice
3.3.1. Cell Lines and Animals
3.3.2. Materials
3.3.3. Tumor-Bearing Mice Model and Drug Administration
3.3.4. Antitumor Activity Evaluation
3.3.5. Statistical Analysis
3.4. Metabolomics Study
3.4.1. Materials
3.4.2. UPLC-QTOF-MS Conditions
3.4.3. Metabolomics Study
4. Conclusions
Author Contributions
Funding
Institutional Review Board Statement
Data Availability Statement
Conflicts of Interest
Sample Availability
References
- Liu, Z.; Suo, C.; Mao, X.; Jiang, Y.; Jin, L.; Zhang, T.; Chen, X. Global incidence trends in primary liver cancer by age at diagnosis, sex, region, and etiology, 1990–2017. Cancer 2020, 126, 2267–2278. [Google Scholar] [CrossRef]
- New Global Cancer Data: GLOBOCAN 2018|UICC. Available online: https://www.uicc.org/new-global-cancer-data-globocan (accessed on 22 November 2020).
- Yang, J.D.; Hainaut, P.; Gores, G.J.; Amadou, A.; Plymoth, A.; Roberts, L.R. A global view of hepatocellular carcinoma: Trends, risk, prevention and management. Nature reviews. Gastroenterol. Hepatol. 2019, 16, 589–604. [Google Scholar]
- Liu, H.S.; Pan, C.E.; Yang, W.; Liu, X.M. Antitumor and immunomodulatory activity of resveratrol on experimentally implanted tumor of H22 in Balb/c mice. World J. Gastroenterol. 2003, 9, 1474–1476. [Google Scholar] [CrossRef] [PubMed]
- Quan, L.H.; Min, J.W.; Yang, D.U.; Kim, Y.J.; Yang, D.-C. Enzymatic biotransformation of ginsenoside Rb1 to 20 (S)-Rg3 by recombinant β-glucosidase from Microbacterium esteraromaticum. Appl. Microbiol. Biotechnol. 2012, 94, 377–384. [Google Scholar] [CrossRef] [PubMed]
- Bae, E.A.; Han, M.J.; Kim, E.J.; Kim, D.H. Transformation of ginseng saponins to ginsenoside Rh2 by acids and human intestinal bacteria and biological activities of their transformants. Arch. Pharmacal Res. 2004, 27, 61–67. [Google Scholar] [CrossRef] [PubMed]
- Liu, X.; Ye, B.; Wu, Y.; Lin, Z.; Zhao, Y.; Piao, H. Synthesis and anti-tumor evaluation of panaxadiol derivatives. Eur. J. Med. Chem. 2011, 46, 1997–2002. [Google Scholar] [CrossRef]
- Lin, X.H.; Cao, M.N.; He, W.N.; Yu, S.W.; Guo, D.A.; Ye, M. Biotransformation of 20 (R)-panaxadiol by the fungus Rhizopus chinensis. Phytochemistry 2014, 105, 129–134. [Google Scholar] [CrossRef]
- Mann, J. Natural products in cancer chemotherapy: Past, present and future. Nat. Rev. Cancer 2002, 2, 143–148. [Google Scholar] [CrossRef]
- Chikara, S.; Nagaprashantha, L.D.; Singhal, J.; Horne, D.; Awasthi, S.; Singhal, S.S. Oxidative stress and dietary phytochemicals: Role in cancer chemoprevention and treatment. Cancer Lett. 2018, 413, 122–134. [Google Scholar] [CrossRef]
- Yang, G.; Gao, M.; Sun, Y.; Wang, C.; Fang, X.; Gao, H.; Diao, W.; Yu, H. Design, synthesis and anti-inflammatory activity of 3-amino acid derivatives of ocotillol-type sapogenins. Eur. J. Med. Chem. 2020, 202, 112507. [Google Scholar] [CrossRef]
- Liu, Y.; Ren, Y.; Cao, Y.; Huang, H.; Wu, Q.; Li, W.; Wu, S.; Zhang, J. Discovery of a low toxicity O-GlcNAc transferase (OGT) inhibitor by structure-based virtual screening of natural products. Sci. Rep. 2017, 7, 1–11. [Google Scholar] [CrossRef] [PubMed] [Green Version]
- Zhang, Q.H.; Lu, D.; Li, P.Y.; Liu, J.P. Review on the Study of Ocotillol-type Saponins. Ginseng Res. 2011, 4, 47–51. [Google Scholar]
- Chen, S.; Staba, E.; Taniyasu, S.; Kasai, R.; Tanaka, O. Further study on dammarane-saponins of leaves and stems of American ginseng, Panax quinquefolium. Planta Med. 1981, 42, 406–409. [Google Scholar] [CrossRef]
- Yosioka, I.; Yamauchi, H.; Kitagawa, I. Lichen triterpenoids. V. On the neutral triterpenoids of Pyxine endochrysina nyl. Chem. Pharm. Bull. 1972, 20, 502–513. [Google Scholar] [CrossRef] [Green Version]
- Arriaga, F.J.; Rumbero, A.; Wollenweber, E. Three Further Dammarane Type Triterpenes from the Frond Exudate of the Fern Notholaena rigida. Z. Für Nat. C 1996, 51, 750–752. [Google Scholar] [CrossRef]
- Pokhilo, N.; Denisenko, V.; Makhan’kov, V.; Uvarova, N. Terpenoids and flavonoids from the leaves of Siberian species of the genus Betula. Chem. Nat. Compd. 1983, 19, 374–375. [Google Scholar] [CrossRef]
- Kolak, U.; Kabouche, A.; Öztürk, M.; Kabouche, Z.; Topçu, G.; Ulubelen, A. Antioxidant diterpenoids from the roots of Salvia barrelieri. Phytochem. Anal. 2009, 20, 320–327. [Google Scholar] [CrossRef]
- Li, L.; Chen, X.; Li, D.; Zhong, D. Identification of 20(S)-Protopanaxadiol Metabolites in Human Liver Microsomes and Human Hepatocytes. Drug Metab. Dispos. 2011, 39, 472–483. [Google Scholar] [CrossRef] [Green Version]
- Atopkina, L.N.; Malinovskaya, G.V.; Elyakov, G.B.; Uvarova, N.I.; Woerdenbag, H.J.; Koulman, A.; Pras, N.; Potier, P. Cytotoxicity of natural ginseng glycosides and semisynthetic analogues. Planta Med. 1999, 65, 30–34. [Google Scholar] [CrossRef]
- Prokofeva, N.; Chaikina, E.; Pokhilo, N.; Anisimov, M. Hemolytic and cytotoxic activity of dammarane-type triterpenoids. Chem. Nat. Compd. 2007, 43, 72–75. [Google Scholar] [CrossRef]
- Yang, J.; Li, X.; Sun, T.; Gao, Y.; Chen, Y.; Jin, Y.; Li, Y. Semisynthesis and bioactive evaluation of oxidized products from 20(S)-ginsenoside Rg3, Rh2, protopanaxadiol (PPD) and their 20(R)-epimers as cytotoxic agents. Steroids 2016, 106, 26–34. [Google Scholar] [CrossRef] [PubMed]
- Zhang, Q.; Xu, Y.; Li, H.; Zhao, F.; Wang, C.; Liu, Z.; Liu, P.; Liu, Y.; Meng, Q. Synthesis and in vitro anti-inflammatory activity of C20 epimeric ocotillol-type triterpenes and protopanaxadiol. Planta Med. 2019, 85, 292–301. [Google Scholar] [CrossRef] [PubMed] [Green Version]
- Tanaka, O.; Yahara, S. Dammarane saponins of leaves of Panax pseudo-ginseng subsp. himalaicus. Phytochemistry 1978, 17, 1353–1358. [Google Scholar] [CrossRef]
- da Silva, K.P.; Pinchin, R.; Pinto, A.D. Phytochemical studies on Brazilian Velloziaceae. II. Triterpenes from Barbacenia flava. Cienc. Cult. 1980, 32, 120–123. [Google Scholar]
- Wang, H.; Yu, P.; Bai, J.; Zhang, J.; Kong, L.; Zhang, F.; Du, G.; Pei, S.; Zhang, L.; Jiang, Y.; et al. Ocotillol Enhanced the Antitumor Activity of Doxorubicin via p53-Dependent Apoptosis. Evid. Based Complementary Altern. Med. 2013, 2013, 468537. [Google Scholar] [CrossRef]
- Konoshima, T.; Takasaki, M.; Tokuda, H.; Nishino, H.; Duc, N.M.; Kasai, R.; Yamasaki, K. Anti-tumor-promoting Activity of Majonoside-R2 from Veitnamese Ginseng, Panax vietnamensis HA et GRUSHV. Biol. Pharm. Bull. 1998, 21, 834–838. [Google Scholar] [CrossRef] [Green Version]
- Tian, J.; Geng, M.; Fu, F. Inhibitory effects of ocotillol on tumor growth in nude mice bearing human ovarian cancer cells. Anticancer Res. 2004, 24, 3653–3654. [Google Scholar]
- Liu, N. Studies on Chemical Constituents and Antitumor Activity of Stem and Leaf Saponins Hydrolyzed by Panax Quinceti. Master’s Thesis, Yanbian University, Yanji, China, 2008. [Google Scholar]
- Lee, S.Y.; Jeong, J.J.; Le, T.H.; Eun, S.H.; Nguyen, M.D.; Park, J.H.; Kim, D.H. Ocotillol, a majonoside R2 metabolite, ameliorates 2, 4, 6-trinitrobenzenesulfonic acid-induced colitis in mice by restoring the balance of Th17/Treg cells. J. Agric. Food Chem. 2015, 63, 7024–7031. [Google Scholar] [CrossRef]
- Bi, Y.; Ma, C.; Zhang, H.; Zhou, Z.; Yang, J.; Zhang, Z.; Meng, Q.; Lewis, P.J.; Xu, J. Novel 3-Substituted Ocotillol-Type Triterpenoid Derivatives as Antibacterial Candidates. Chem. Biol. Drug Des. 2014, 84, 489–496. [Google Scholar] [CrossRef]
- Liu, J.P. Studies on Isolation, Structure Modification and Pharmacological Activities of Saponins from the Leaves and Stems of Panax Quiquefolium L. Cultivated in China. Ph.D. Thesis, Shenyang Pharmaceutical University, Shenyang, China, 2005. [Google Scholar]
- Wang, W.; Wu, X.; Wang, L.; Meng, Q.; Liu, W. Stereoselective Property of 20(S)-Protopanaxadiol Ocotillol Type Epimers Affects Its Absorption and Also the Inhibition of P-Glycoprotein. PLoS ONE 2014, 9, e98887. [Google Scholar] [CrossRef] [Green Version]
- Liu, J.; Liu, Y.; Yu, H.; Zhang, Y.; Liu, J. Design, synthesis and biological evaluation of novel pyxinol derivatives with anti-heart failure activity. Biomed. Pharmacother. 2021, 133, 111050. [Google Scholar] [CrossRef] [PubMed]
- Li, Z.; Gao, Z.; Gong, A.; Li, X.; Wu, J.; Zhang, L.; Yu, S.; Geng, C. Pharmacokinetic Study of Ocotillol in Rats by LC-MS/MS. Chin. Pharm. J. 2018, 53, 749–754. [Google Scholar]
- Yan, X.; Li, Z.; Jiang, J.; Ying, Z.; Geng, C. Rat Plasma Protein Binding Rates of Ocotillol Type Ginsenosides. Chin. Pharm. J. 2020, 55, 2029–2035. [Google Scholar]
- Li, Y.; Hu, H.; Li, Z.; Li, R.; Xu, F.; Zhao, C.; An, Y.; Liu, Y.; Wang, Z. Pharmacokinetic Characterizations of Ginsenoside Ocotillol, RT5 and F11, the Promising Agents for Alzheimer’s Disease from American Ginseng, in Rats and Beagle Dogs. Pharmacology 2019, 104, 7–20. [Google Scholar] [CrossRef] [PubMed]
- Wang, J.; Hu, X.L.; Wen, W.H.; Yang, L.L.; Xu, S.; Zhu, Y.L. Structural modification of natural medicines by amino acids and short peptides. China Mod. Appl. Pharm. 2011, 28, 1095–1100. [Google Scholar]
- Landowski, C.P.; Lorenzi, P.L.; Song, X.; Amidon, G.L. Nucleoside ester prodrug substrate specificity of liver carboxylesterase. J. Pharmacol. Exp. Ther. 2006, 316, 572–580. [Google Scholar] [CrossRef] [Green Version]
- Vig, B.S.; Huttunen, K.M.; Laine, K.; Rautio, J. Amino acids as promoieties in prodrug design and development. Adv. Drug Deliv. Rev. 2013, 65, 1370–1385. [Google Scholar] [CrossRef]
- Diaz-Padilla, I.; Siu, L.L. Brivanib alaninate for cancer. Expert Opin. Investig. Drugs 2011, 20, 577–586. [Google Scholar] [CrossRef]
- Kim, M.K.; Park, K.-S.; Yeo, W.-S.; Choo, H.; Chong, Y. In vitro solubility, stability and permeability of novel quercetin–amino acid conjugates. Bioorganic Med. Chem. 2009, 17, 1164–1171. [Google Scholar] [CrossRef]
- Suhas, R.; Chandrashekar, S.; Gowda, D.C. Synthesis of uriedo and thiouriedo derivatives of peptide conjugated heterocycles–A new class of promising antimicrobials. Eur. J. Med. Chem. 2012, 48, 179–191. [Google Scholar] [CrossRef]
- Vardhan, D.M.S.; Shantharam, C.S.; Suhas, R.; Sridhara, M.B.; Gowda, D.C. Synthesis and SAR studies of urea and thiourea derivatives of Gly/Pro conjugated to piperazine analogue as potential AGE inhibitors. Protein Pept. Lett. 2013, 20, 888–897. [Google Scholar] [CrossRef] [PubMed]
- Fang, L.; Wang, M.; Gou, S.; Liu, X.; Zhang, H.; Cao, F. Combination of amino acid/dipeptide with nitric oxide donating oleanolic acid derivatives as PepT1 targeting antitumor prodrugs. J. Med. Chem. 2014, 57, 1116–1120. [Google Scholar] [CrossRef] [PubMed]
- Yuan, W.; Guo, J.; Wang, X.; Su, G.; Zhao, Y. Non-protein amino acid derivatives of 25-methoxylprotopanaxadiol/25-hydroxyprotopanaxadioland their anti-tumour activity evaluation. Steroids 2018, 129, 1–8. [Google Scholar] [CrossRef] [PubMed]
- Tedesco, L.; Corsetti, G.; Ruocco, C.; Ragni, M.; Rossi, F.; Carruba, M.O.; Valerio, A.; Nisoli, E. A specific amino acid formula prevents alcoholic liver disease in rodents. Am. J. Physiol. Gastrointest. Liver Physiol. 2018, 314, G566–G582. [Google Scholar] [CrossRef] [PubMed]
- Meng, Q.G.; Tan, W.J.; Hou, G.G.; Zhang, X.Y.; Hu, X.Y.; Yang, F.; Bai, G.J.; Zhu, W.W.; Cai, Y.; Bi, Y. Synthesis and structural characterization of two epimers driven from 20 (S)-protopanaxadiol. J. Mol. Struct. 2013, 1054, 1–5. [Google Scholar] [CrossRef]
- Schmeda-Hirschmann, G.; Rodríguez, J.A.; Theoduloz, C.; Valderrama, J.A. Gastroprotective effect and cytotoxicity of labdeneamides with amino acids. Planta Med. 2011, 77, 340–345. [Google Scholar] [CrossRef] [PubMed] [Green Version]
- Hayaishi, S.; Chung, H.; Kudo, M.; Ishikawa, E.; Takita, M.; Ueda, T.; Kitai, S.; Inoue, T.; Yada, N.; Hagiwara, S. Oral branched-chain amino acid granules reduce the incidence of hepatocellular carcinoma and improve event-free survival in patients with liver cirrhosis. Dig. Dis. 2011, 29, 326–332. [Google Scholar] [CrossRef]
- Ma, L.; Wang, X.; Li, W.; Qu, F.; Liu, Y.; Lu, J.; Su, G.; Zhao, Y. Conjugation of Ginsenoside with Dietary Amino Acids: A Promising Strategy to Suppress Cell Proliferation and Induce Apoptosis in Activated Hepatic Stellate Cells (Article). J. Agric. Food Chem. 2019, 67, 10245–10255. [Google Scholar] [CrossRef]
- Wang, K.Y.; Zhou, Z.W.; Zhang, H.Y.; Cao, Y.C.; Xu, J.Y.; Ma, C.; Meng, Q.G.; Bi, Y. Design, Synthesis and Antibacterial Evaluation of 3-Substituted Ocotillol-Type Derivatives. Molecules. 2018, 23, 3320. [Google Scholar] [CrossRef] [Green Version]
- Zhou, Z.; Ma, C.; Zhang, H.; Bi, Y.; Chen, X.; Tian, H.; Xie, X.; Meng, Q.; Lewis, P.J.; Xu, J. Synthesis and biological evaluation of novel ocotillol-type triterpenoid derivatives as antibacterial agents. Eur. J. Med. Chem. 2013, 68, 444–453. [Google Scholar] [CrossRef]
- Duan, L.Z. The Semisynthesis of 20(S)-PPD Derivatives and Screening of its Antitumor Activity in Vitro. Master’s Thesis, Fudan University, Shanghai, China, 2014. [Google Scholar]
- Bi, Y.; Liu, X.-X.; Zhang, H.-Y.; Yang, X.; Liu, Z.-Y.; Lu, J.; Lewis, P.J.; Wang, C.-Z.; Xu, J.-Y.; Meng, Q.-G. Synthesis and antibacterial evaluation of novel 3-substituted ocotillol-type derivatives as leads. Molecules 2017, 22, 590. [Google Scholar] [CrossRef] [PubMed] [Green Version]
- Sun, Y.; Fang, X.; Gao, M.; Wang, C.; Gao, H.; Bi, W.; Tang, H.; Cui, Y.; Zhang, L.; Fan, H.; et al. Synthesis and Structure-Activity Relationship of Pyxinol Derivatives as Novel Anti-Inflammatory Agents. ACS Med. Chem. Lett. 2020, 11, 457–463. [Google Scholar] [CrossRef] [PubMed]
- Ren, Q.; Yang, G.; Guo, M.; Guo, J.; Li, Y.; Lu, J.; Yang, Q.; Tang, H.; Li, Y.; Fang, X.; et al. Design, synthesis, and discovery of ocotillol-type amide derivatives as orally available modulators of P-glycoprotein-mediated multidrug resistance. Eur. J. Med. Chem. 2019, 161, 118–130. [Google Scholar] [CrossRef] [PubMed]
- Holeček, M.; Vodeničarovová, M. Muscle wasting and branched-chain amino acid, alpha-ketoglutarate, and ATP depletion in a rat model of liver cirrhosis. Int. J. Exp. Pathol. 2018, 99, 274–281. [Google Scholar] [CrossRef]
- Kuwahata, M.; Kubota, H.; Kanouchi, H.; Ito, S.; Ogawa, A.; Kobayashi, Y.; Kido, Y. Supplementation with branched-chain amino acids attenuates hepatic apoptosis in rats with chronic liver disease. Nutrres 2012, 32, 522–529. [Google Scholar] [CrossRef]
- Barakat, H.A.; Hamza, A.H. Glycine alleviates liver injury induced by deficiency in methionine and or choline in rats. Eur. Rev. Med. Pharmacol. Sci. 2012, 16, 72. [Google Scholar]
- Heidari, R.; Mohammadi, H.; Ghanbarinejad, V.; Ahmadi, A.; Ommati, M.M.; Niknahad, H.; Jamshidzadeh, A.; Azarpira, N.; Abdoli, N. Proline supplementation mitigates the early stage of liver injury in bile duct ligated rats. J. Basic Clin. Physiol. Pharmacol. 2018, 30, 91–101. [Google Scholar] [CrossRef]
- Qin, X.Y.; Lu, J.; Cai, M.; Kojima, S. Arachidonic acid suppresses hepatic cell growth through ROS-mediated activation of transglutaminase. FEBS Open Bio 2018, 8, 1703–1710. [Google Scholar] [CrossRef]
- Zhou, L.A.; Ding, L.B.; Yin, P.A.; Lu, X.A.; Wang, X.B.; Niu, J.B.; Gao, P.B.; Xu, G.A. Serum metabolic profiling study of hepatocellular carcinoma infected with hepatitis B or hepatitis C virus by using liquid chromatography-mass spectrometry. J. Proteome Res. 2012, 11, 5433–5442. [Google Scholar] [CrossRef]
- Panigrahy, D.; Greene, E.R.; Pozzi, A.; Wang, D.W.; Zeldin, D.C. EET signaling in cancer. Cancer Metastasis Rev. 2011, 30, 525–540. [Google Scholar] [CrossRef] [Green Version]
- Soumya, S.J.; Binu, S.; Helen, A.; Reddanna, P.; Sudhakaran, P.R. 15-LOX metabolites and angiogenesis: Angiostatic effect of 15(S)-HPETE involves induction of apoptosis in adipose endothelial cells. PeerJ 2014, 2, e635. [Google Scholar] [CrossRef] [PubMed] [Green Version]
- Soumya, S.J.; Binu, S.; Helen, A.; Anil Kumar, K.; Reddanna, P.; Sudhakaran, P.R. Effect of 15-lipoxygenase metabolites on angiogenesis: 15(S)-HPETE is angiostatic and 15(S)-HETE is angiogenic. Inflamm. Res. 2012, 61, 707–718. [Google Scholar] [CrossRef] [PubMed]
- Zhang, X. Promoter Activity and Regulation of Human CYP4F2 LTB (4) Omega-Hydroxylase Gene in HEPG2 Cells. Ph.D. Thesis, Kent State University, St. Kent, OH, USA, 2000. [Google Scholar]
- Honn, K.V.; Meyer, J. Thromboxanes and prostacyclin: Positive and negative modulators of tumor growth. Biochem. Biophys. Res. Commun. 1981, 102, 1122–1129. [Google Scholar] [CrossRef]
- Kurabe, N.; Hayasaka, T.; Ogawa, M.; Masaki, N.; Ide, Y.; Waki, M.; Nakamura, T.; Kurachi, K.; Kahyo, T.; Shinmura, K.; et al. Accumulated phosphatidylcholine (16:0/16:1) in human colorectal cancer; possible involvement of LPCAT4. Cancer Sci. 2013, 104, 1295–1302. [Google Scholar] [CrossRef]
- He, Q.; Takizawa, Y.; Hayasaka, T.; Masaki, N.; Kusama, Y.; Su, J.; Mineta, H.; Setou, M. Increased phosphatidylcholine (16:0/16:0) in the folliculus lymphaticus of Warthin tumor. Anal. Bioanal. Chem. 2014, 406, 5815–5825. [Google Scholar] [CrossRef] [Green Version]
- Kim, D.; Lee, Y.; Lee, Y.; Oh, S.; Yun, Y.; Yoo, H. Elevation of sphingoid base 1-Phosphate as a potential contributor to hepatotoxicity in Fumonisin B1-exposed mice. Arch. Pharmacal Res. 2007, 30, 962–969. [Google Scholar] [CrossRef]
- Jin, J.; Liao, W.; Yao, W.; Zhu, R.; Li, Y.; He, S. Aldo-keto Reductase Family 1 Member B 10 Mediates Liver Cancer Cell Proliferation through Sphingosine-1-Phosphate. Sci. Rep. 2016, 2, IJTR-S2129. [Google Scholar] [CrossRef] [Green Version]
- Okuno, M.; Kato, M.; Kanai, M.; Muto, Y. Determination of cellular retinol-binding protein in human hepatocellular and colorectal carcinomas by radioimmunoassay. J. Gastroenterol. Hepatol. 1987, 2, 397–406. [Google Scholar] [CrossRef]
- Idres, N.; Benoit, G.; Flexor, M.A.; Lanotte, M.; Chabot, G.G. Granulocytic differentiation of human NB4 promyelocytic leukemia cells induced by all-trans retinoic acid metabolites. Cancer Res. 2001, 61, 700–705. [Google Scholar]
- Xie, R.; Li, Z.; Chen, P.; Zhou, X. Bufothionine induced the mitochondria-mediated apoptosis in H22 liver tumor and acute liver injury. Chin. Med. 2015, 10, 1–11. [Google Scholar] [CrossRef] [Green Version]
- Richard, D.M.; Dawes, M.A.; Mathias, C.W.; Acheson, A.; Hill-Kapturczak, N.; Dougherty, D.M. L-Tryptophan: Basic Metabolic Functions, Behavioral Research and Therapeutic Indications. Intj. Tryptophan Res. 2009, 2, 45–60. [Google Scholar] [CrossRef] [PubMed] [Green Version]
- Stratakis, N.; Conti, D.; Jin, R.; Margetaki, K.; Valvi, D.; Siskos, A.P.; Maitre, L.; Garcia, E.; Varo, N.; Zhao, Y.; et al. Prenatal Exposure to Perfluoroalkyl Substances Associated with Increased Susceptibility to Liver Injury in Children. Hepatology (Baltim. Md.) 2020, 72, 1758–1770. [Google Scholar] [CrossRef] [PubMed]
- Deng, P.; Barney, J.; Petriello, M.C.; Morris, A.J.; Wahlang, B.; Hennig, B. Hepatic metabolomics reveals that liver injury increases PCB 126-induced oxidative stress and metabolic dysfunction. Chemosphere 2019, 217, 140–149. [Google Scholar] [CrossRef] [PubMed]
- Kwee, S.A.; Franke, A.A.; Custer, L.J.; Li, X.; Wong, L.L. Fatty acid and phospholipid profiling of liver tumor tissue: Correlation with in vivo molecular PET imaging of phosphocholine synthesis. Cancer Res. 2015, 75, 1486. [Google Scholar] [CrossRef]
- Pan, P.; Skaer, C.W.; Wang, H.; Kreiser, M.A.; Stirdivant, S.M.; Oshima, K.; Huang, Y.; Young, M.R.; Wang, L. Systemic Metabolite Changes in Wild-type C57BL/6 Mice Fed Black Raspberries. Nutr. Cancer 2017, 69, 299–306. [Google Scholar] [CrossRef] [Green Version]
- Tang, J.; Tao, Z.; Wen, D. miR-612 suppresses the stemness of liver cancer via Wnt/beta-catenin signaling. Biochem. Biophys. Res. Commun. 2014, 447, 210–215. [Google Scholar] [CrossRef]


| Compounds | IC50 (µM) | Compounds | IC50 (µM) |
|---|---|---|---|
| Pyxinol | 74.49 ± 1.09 | Ocotillol | 92.65 ± 3.07 |
| 1a | 26.33 ± 0.72 | 3a | 60.95 ± 1.57 |
| 1b | 73.55 ± 2.60 | 3b | 88.60 ± 5.03 |
| 1c | 26.63 ± 1.52 | 3c | 32.62 ± 1.55 |
| 1d | 73.14 ± 1.67 | 3d | 74.91 ± 2.87 |
| 1e | 30.46 ± 2.98 | 3e | 41.75 ± 2.58 |
| 1f | 62.15 ± 3.78 | 3f | 80.10 ± 2.03 |
| 2a | 16.46 ± 1.66 | 4a | 33.99 ± 0.90 |
| 2b | 20.29 ± 2.04 | 4b | 50.65 ± 0.62 |
| 2c | 16.31 ± 0.31 | 4c | 20.55 ± 2.47 |
| 2d | 20.13 ± 3.49 | 4d | 35.44 ± 1.59 |
| 2e | 11.26 ± 0.43 | 4e | 24.62 ± 0.35 |
| 2f | 19.74 ± 1.96 | 4f | 44.74 ± 3.07 |
| Cyclophosphamide | 9.18 ± 0.34 | - | - |
| Groups | Dosages (mg/kg) | BODYWEIGHT (g) | Increase of Body Weight (g) | Tumor Weight (g) | Inhibitory Rate (%) | Liver Index(mg/g) | Kidney Index (mg/g) | |
|---|---|---|---|---|---|---|---|---|
| D1 | D14 | |||||||
| Normal | - | 22.35 ± 1.58 | 36.59 ± 3.63 | 14.24 ± 2.61 | - | - | 37.99 ± 6.03 | 11.08 ± 1.72 |
| Model | - | 21.24 ± 1.66 | 35.86 ± 3.53 | 14.62 ± 3.49 | 1.61 ± 0.35 | - | 45.69 ± 6.19 | 13.89 ± 2.24 |
| CTX | 20 | 21.20 ± 1.71 | 32.76 ± 3.14 | 11.56 ± 3.23 | 0.81 ± 0.18 ** | 49.69% | 51.54 ± 7.69 | 13.27 ± 1.96 |
| Compound 2e | 25 | 23.12 ± 2.18 | 35.27 ± 3.18 | 12.15 ± 3.71 | 1.35 ± 0.26 | 16.20% | 42.89 ± 6.04 | 12.24 ± 1.92 |
| 50 | 22.45 ± 1.89 | 34.99 ± 3.22 | 12.54 ± 2.72 | 1.21 ± 0.34 * | 24.76% | 42.77 ± 4.55 | 12.61 ± 1.42 | |
| 100 | 22.51 ± 1.70 | 35.64 ± 2.89 | 13.13 ± 3.36 | 1.04 ± 0.23 ** | 35.32% | 41.83 ± 4.31 | 12.42 ± 1.21 | |
| 2e + CTX | 50 + 20 | 23.07 ± 2.29 | 37.65 ± 3.70 | 14.58 ± 2.68 | 0.72 ± 0.20 ** | 55.30% | 37.01 ± 4.47 ** | 11.72 ± 2.24 * |
| Groups | Dosages (mg/kg) | TNF-α (pg/mL) | IL-2 (pg/mL) | VEGF (pg/mL) |
|---|---|---|---|---|
| Normal | - | 306.77 ± 17.47 | 150.93 ± 6.01 | 97.76 ± 13.75 |
| Model | - | 388.35 ± 28.22 ## | 95.81 ± 16.50 ## | 188.94 ± 22.43 ## |
| CTX | 20 | 207.47 ± 23.37 ##, ** | 110.52 ± 17.54 ## | 103.43 ± 14.00 ** |
| Compound 2e | 25 | 287.01 ± 39.10 ** | 111.13 ± 13.28 ## | 158.32 ± 15.97 ##, * |
| 50 | 321.97 ± 55.57 * | 136.86 ± 22.66 ** | 127.62 ± 17.46 ##, ** | |
| 100 | 358.35 ± 45.19 # | 174.11 ± 28.90 ** | 114.67 ± 15.42 ** | |
| 2e + CTX | 50 + 20 | 276.48 ± 26.89 #, ** | 214.81 ± 26.20 ##, ** | 109.86 ± 22.90 ** |
| Groups | Dosages (mg/kg) | ALT (IU/L) | AST (IU/L) | CRE (μmol/L) | BUN (mmol/L) |
|---|---|---|---|---|---|
| Normal | - | 19.48 ± 2.36 | 24.78 ± 3.38 ** | 20.71 ± 7.77 | 9.09 ± 1.81 |
| Model | - | 73.60 ± 2.76 ##, ** | 91.8 ± 6.62 ##, ** | 41.89 ± 10.27 ## | 20.75 ± 4.96 ## |
| CTX | 20 | 50.61 ± 3.22 ##, ** | 53.47 ± 5.04 ##, ** | 32.86 ± 7.74 # | 14.23 ± 2.38 ##, * |
| Compound 2e | 25 | 43.62 ± 5.15 ##, ** | 42.51 ± 5.22 ##, ** | 31.17 ± 9.03 | 12.70 ± 2.24 #, ** |
| 50 | 42.31 ± 5.00 ##, ** | 38.69 ± 6.43 ##, ** | 28.95 ± 9.16 * | 11.06 ± 2.16 ** | |
| 100 | 35.37 ± 3.32 ##, ** | 31.47 ± 4.48 #, ** | 26.93 ± 10.60 * | 10.32 ± 2.77 ** | |
| 2e + CTX | 50+20 | 39.95 ± 7.21 ##, ** | 40.17 ± 6.27 ##, ** | 30.45 ± 8.62 | 12.66 ± 3.06 #, ** |
| Serum | Liver | |||||||
|---|---|---|---|---|---|---|---|---|
| Peak Intensity | Retention Time | Peak Intensity | Retention Time | |||||
| ESI+ | ESI- | ESI+ | ESI- | ESI+ | ESI- | ESI+ | ESI- | |
| Stability of LC-MS system | 1.56–5.57 | 1.02–4.98 | 0.23–2.35 | 0.64–2.74 | 1.97–7.14 | 1.34–6.61 | 0.63–3.22 | 0.89–2.71 |
| Injection Precision | 0.92–3.09 | 1.06–5.14 | 0.66–2.48 | 0.97–3.05 | 1.36–6.47 | 2.14–6.83 | 0.74–3.53 | 0.98–3.33 |
| Reproducibility of sample preparation | 2.12–6.69 | 1.68–6.57 | 1.02–4.39 | 1.25–3.35 | 2.77–5.61 | 2.19–5.88 | 1.30–2.94 | 1.28–4.38 |
| Post-preparation stability of sample | 2.39–6.41 | 2.01–5.27 | 1.23–4.18 | 1.36–3.99 | 1.44–4.34 | 1.67–5.25 | 1.33–3.36 | 1.41–3.79 |
| No. | tR/min | Measured Mass (Da) | VIPvalue | Formula | Mass Error (ppm) | Adducts | Biomarkers | HMDB ID | Pathway | Content Level | Source |
|---|---|---|---|---|---|---|---|---|---|---|---|
| 1 * | 1.51 | 203.2178 | 5.25 | C11H12N2O2 | 3.13 | M − H | l-Tryptophan | 0000929 | TrpM | CM < C2e < CN | Serum |
| 1.49 | 205.2336 | 2.84 | 2.21 | M + H | Liver | ||||||
| 2 a | 10.1 | 317.4430 | 4.34 | C20H28O3 | 1.45 | M + H | 4-Hydroxyretinoic acid | 0006254 | RM | CM < C2e ≈ CN | Serum |
| 4.66 | M + H | Liver | |||||||||
| 3 a | 10.19 | 353.4738 | 7.20 | C20H32O5 | 2.13 | M + H | Prostaglandin I2 | 0001335 | AM | CM < CN < C2e | Liver |
| 4 a | 14.06 | 335.4564 | 4.17 | C20H32O4 | –3.87 | M − H | Leukotriene B4 | 0001085 | AM | CM > C2e ≈CN | Serum |
| 5 a | 14.58 | 335.4586 | 7.36 | C20H32O4 | 2.62 | M − H | 15(S)-HPETE | 0004244 | AM | CM < CN<C2e | Serum |
| 6 a | 14.59 | 295.4373 | 4.04 | C18H32O3 | 1.19 | M − H | 12,13-EpOME | 0004702 | LM | CM > C2e ≈ CN | Serum |
| 3.57 | M − H | Liver | |||||||||
| 7 a | 14.61 | 301.4432 | 6.29 | C20H28O2 | 0.37 | M + H | all-trans-Retinoic acid | 0001852 | RM | CM < CN < C2e | Serum |
| 8 a | 14.64 | 277.4223 | 12.73 | C18H28O2 | 2.11 | M + H | Stearidonic acid | 0006547 | ALAM | CM < C2e ≈ CN | Serum |
| 2.44 | M + H | Liver | |||||||||
| 9 a | 15.38 | 378.4643 | 8.27 | C18H38NO5P | 1.21 | M − H | Sphingosine 1-phosphate | 0000277 | SM | CM > CN > C2e | Serum |
| 10 a | 16.02 | 382.4967 | 5.18 | C18H40NO5P | 2.87 | M + H | Sphinganine 1-phosphate | 0001383 | SM | CM > C2e ≈ CN | Serum |
| 11 a | 16.28 | 335.4572 | 3.18 | C20H32O4 | −1.4 | M − H | 5(S)-Hydroperoxyeicosatetraenoic acid | 0001193 | AM | CM >C2e ≈ CN | Serum |
| 12 a | 16.93 | 311.4354 | 5.29 | C18H32O4 | −2.97 | M − H | 13-l-Hydroperoxylinoleic acid | 0003871 | LM | CM > C2e ≈ CN | Serum |
| 13 a | 17.74 | 317.4427 | 11.07 | C20H28O3 | 0.53 | M + H | all-trans-5,6-Epoxyretinoic acid | 0012451 | RM | CM < C2e ≈ CN | Serum |
| 17.49 | 2.14 | M + H | Liver | ||||||||
| 14 a | 18.13 | 319.4577 | 7.58 | C20H32O3 | −1.78 | M − H | 8,9-Epoxyeicosatrienoic acid | 0002232 | AM | CM > C2e > CN | Serum |
| 2.19 | M − H | Liver | |||||||||
| 15 a | 18.24 | 544.6766 | 8.01 | C26H52NO7P | 2.43 | M + Na | LysoPC(18:1(9Z)/0:0) | 0002815 | GlyM | CM > CN > C2e | Serum |
| 10.90 | −1.32 | M + H | Liver | ||||||||
| 16 a | 20.35 | 735.0485 | 10.77 | C40H80NO8P | 2.3 | M + H | PC(16:0/16:0) | 0000564 | LM,AM,GlyM,ALAM | CM > C2e ≈ CN | Serum |
| 4.89 | M + Na | Liver | |||||||||
| 17 a | 21.3 | 303.4593 | 2.20 | C20H30O2 | 1.32 | M − H | Retinyl ester | 0003598 | RM | CM < C2e < CN | Serum |
| 12.45 | M − H | Liver | |||||||||
| 18 a | 21.27 | 279.4372 | 6.65 | C18H30O2 | −1.23 | M + H | alpha-Linolenic acid | 0001388 | ALAM | CM < C2e < CN | Serum |
| 6.64 | M + H | Liver | |||||||||
| 19 * | 22.8 | 303.4605 | 8.16 | C20H32O2 | 5.21 | M − H | Arachidonic acid | 0001043 | AM | CM > C2e > CN | Serum |
| 4.95 | M − H | Liver | |||||||||
| 20 * | 23.08 | 279.4371 | 2.78 | C18H32O2 | −1.35 | M − H | Linoleic acid | 0000673 | LM | CM < CN < C2e | Serum |
| 2.15 | M − H | Liver | |||||||||
| 21 a | 26.03 | 585.6709 | 8.30 | C33H36N4O6 | 1.32 | M + H | Bilirubin | 0000054 | PCM | CM>CN>C2e | Serum |
| Pathway Name | Match Status | p-Value | -log (p) | Holm p | FDR | Impact |
|---|---|---|---|---|---|---|
| Arachidonic acid metabolism (AM) | 24/36 | <0.0001 | 9.5736 | <0.0001 | <0.0001 | 0.7712 |
| Linoleic acid metabolism (LM) | 5/5 | <0.0001 | 3.6273 | 0.0191 | 0.0066 | 1.0000 |
| Retinol metabolism (RM) | 7/16 | 0.0192 | 1.7123 | 1.0000 | 0.4073 | 0.6347 |
| Sphingolipid metabolism (SM) | 6/21 | 0.1913 | 0.7183 | 1.0000 | 1.0000 | 0.3185 |
| Alpha-linolenic acid metabolism (ALAM) | 3/13 | 0.4586 | 0.3386 | 1.0000 | 1.0000 | 0.3333 |
| Glycerophospholipid metabolism (GlyM) | 5/36 | 0.8408 | 0.075 | 1.0000 | 1.0000 | 0.4032 |
| Porphyrin and chlorophyll metabolis (PCM) | 4/30 | 0.8486 | 0.071 | 1.0000 | 1.0000 | 0.2986 |
| Tryptophan metabolism (TryM) | 1/41 | 0.9998 | <0.0001 | 1.0000 | 1.0000 | 0.1430 |
| No. | M and N | M and Compound 2e | No. | M and N | M and Compound 2e | ||||
|---|---|---|---|---|---|---|---|---|---|
| AUC | p-Value | AUC | p-Value | AUC | p-Value | AUC | p-Value | ||
| 1 | 1 | 0.001 | 0.953 | 0.001 | 12 | 0.984 | 0.002 | 1.000 | 0.002 |
| 2 | 0.906 | 0.020 | 0.875 | 0.015 | 13 | 1.000 | 0.001 | 1.000 | 0.001 |
| 3 | 0.953 | 0.001 | 0.984 | 0.001 | 14 | 0.922 | 0.001 | 0.891 | 0.004 |
| 4 | 0.938 | 0.001 | 0.969 | 0.001 | 15 | 0.938 | 0.003 | 0.953 | 0.001 |
| 5 | 0.891 | 0.010 | 0.938 | 0.001 | 16 | 0.953 | 0.003 | 0.969 | 0.001 |
| 6 | 1.000 | 0.001 | 1.000 | 0.001 | 17 | 0.922 | 0.002 | 0.906 | 0.005 |
| 7 | 1.000 | 0.001 | 1.000 | 0.001 | 18 | 0.922 | 0.001 | 0.891 | 0.006 |
| 8 | 0.969 | 0.001 | 0.938 | 0.002 | 19 | 0.953 | 0.001 | 0.891 | 0.019 |
| 9 | 0.938 | 0.002 | 1.000 | 0.001 | 20 | 0.906 | 0.014 | 0.953 | 0.005 |
| 10 | 0.953 | 0.003 | 1.000 | 0.002 | 21 | 0.891 | 0.008 | 1.000 | 0.021 |
| 11 | 0.953 | 0.002 | 0.969 | 0.001 | -- | - | - | - | - |
Publisher’s Note: MDPI stays neutral with regard to jurisdictional claims in published maps and institutional affiliations. |
© 2021 by the authors. Licensee MDPI, Basel, Switzerland. This article is an open access article distributed under the terms and conditions of the Creative Commons Attribution (CC BY) license (http://creativecommons.org/licenses/by/4.0/).
Share and Cite
Zhang, Y.; Yu, H.; Fu, S.; Tan, L.; Liu, J.; Zhou, B.; Li, L.; Liu, Y.; Wang, C.; Li, P.; et al. Synthesis and Anti-Hepatocarcinoma Effect of Amino Acid Derivatives of Pyxinol and Ocotillol. Molecules 2021, 26, 780. https://doi.org/10.3390/molecules26040780
Zhang Y, Yu H, Fu S, Tan L, Liu J, Zhou B, Li L, Liu Y, Wang C, Li P, et al. Synthesis and Anti-Hepatocarcinoma Effect of Amino Acid Derivatives of Pyxinol and Ocotillol. Molecules. 2021; 26(4):780. https://doi.org/10.3390/molecules26040780
Chicago/Turabian StyleZhang, Ying, Hui Yu, Shuzheng Fu, Luying Tan, Junli Liu, Baisong Zhou, Le Li, Yunhe Liu, Caixia Wang, Pingya Li, and et al. 2021. "Synthesis and Anti-Hepatocarcinoma Effect of Amino Acid Derivatives of Pyxinol and Ocotillol" Molecules 26, no. 4: 780. https://doi.org/10.3390/molecules26040780