
Pharmacokinetic Characterization of (Poly)phenolic Metabolites in Human Plasma and Urine after Acute and Short-Term Daily Consumption of Mango Pulp

 , , ,
, , ,
Abstract
:
1. Introduction
2. Results and Discussion
2.1. Mango Pulp
2.2. Acute Study
2.3. Short-Term 14 Day Mango Feeding Trial
2.4. Inter-Individual Variability
3. Materials and Methods
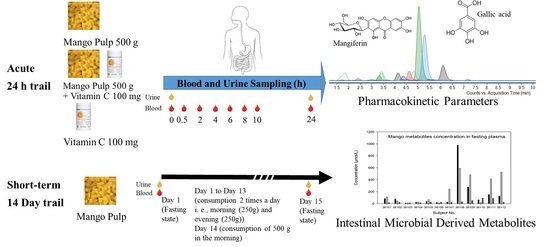
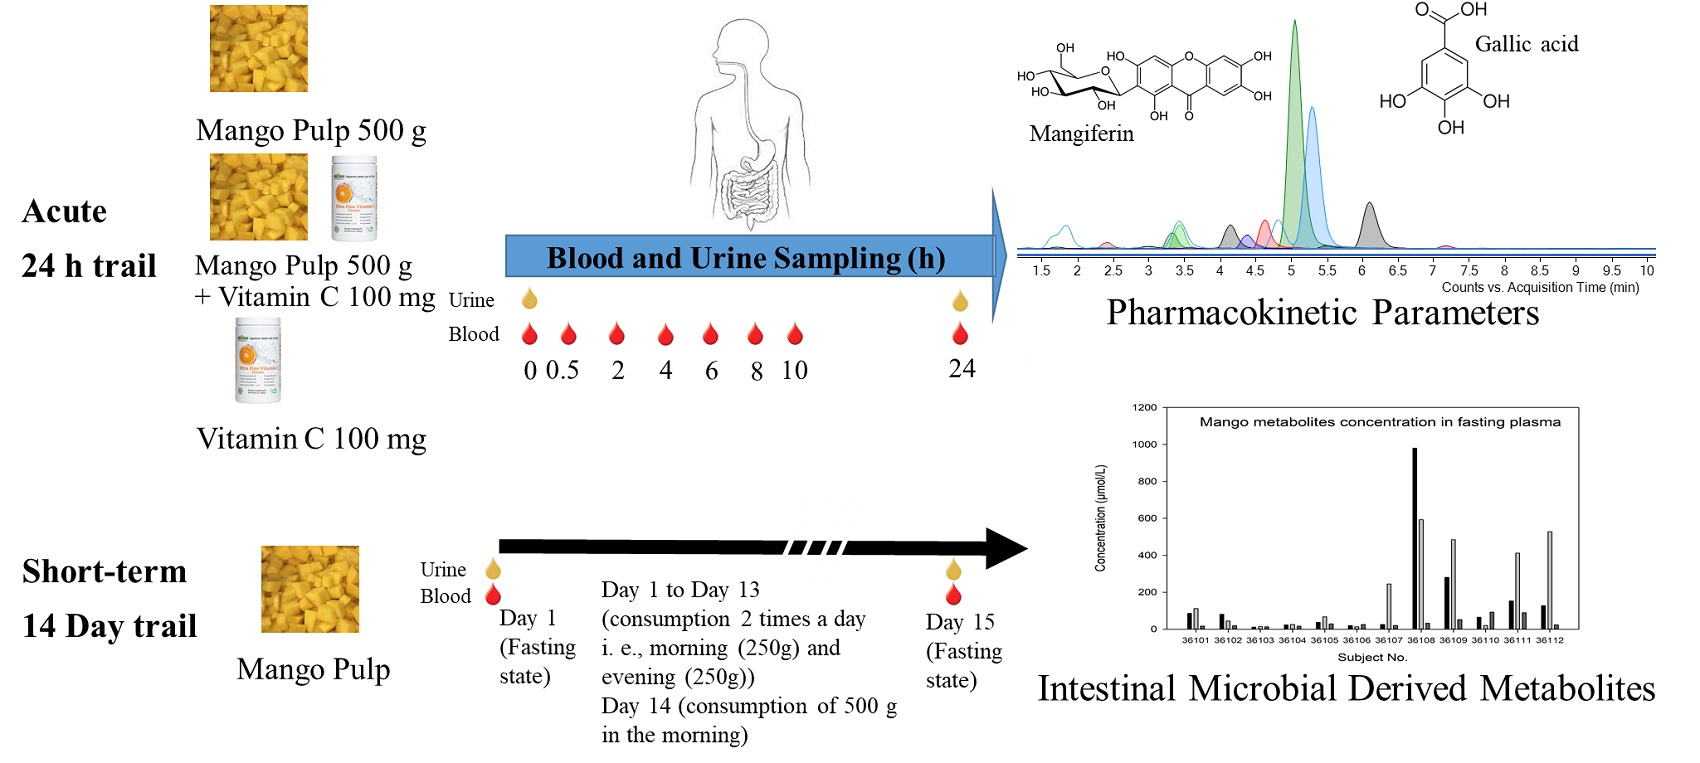
3.1. Ethics, Study Design and Study Subjects
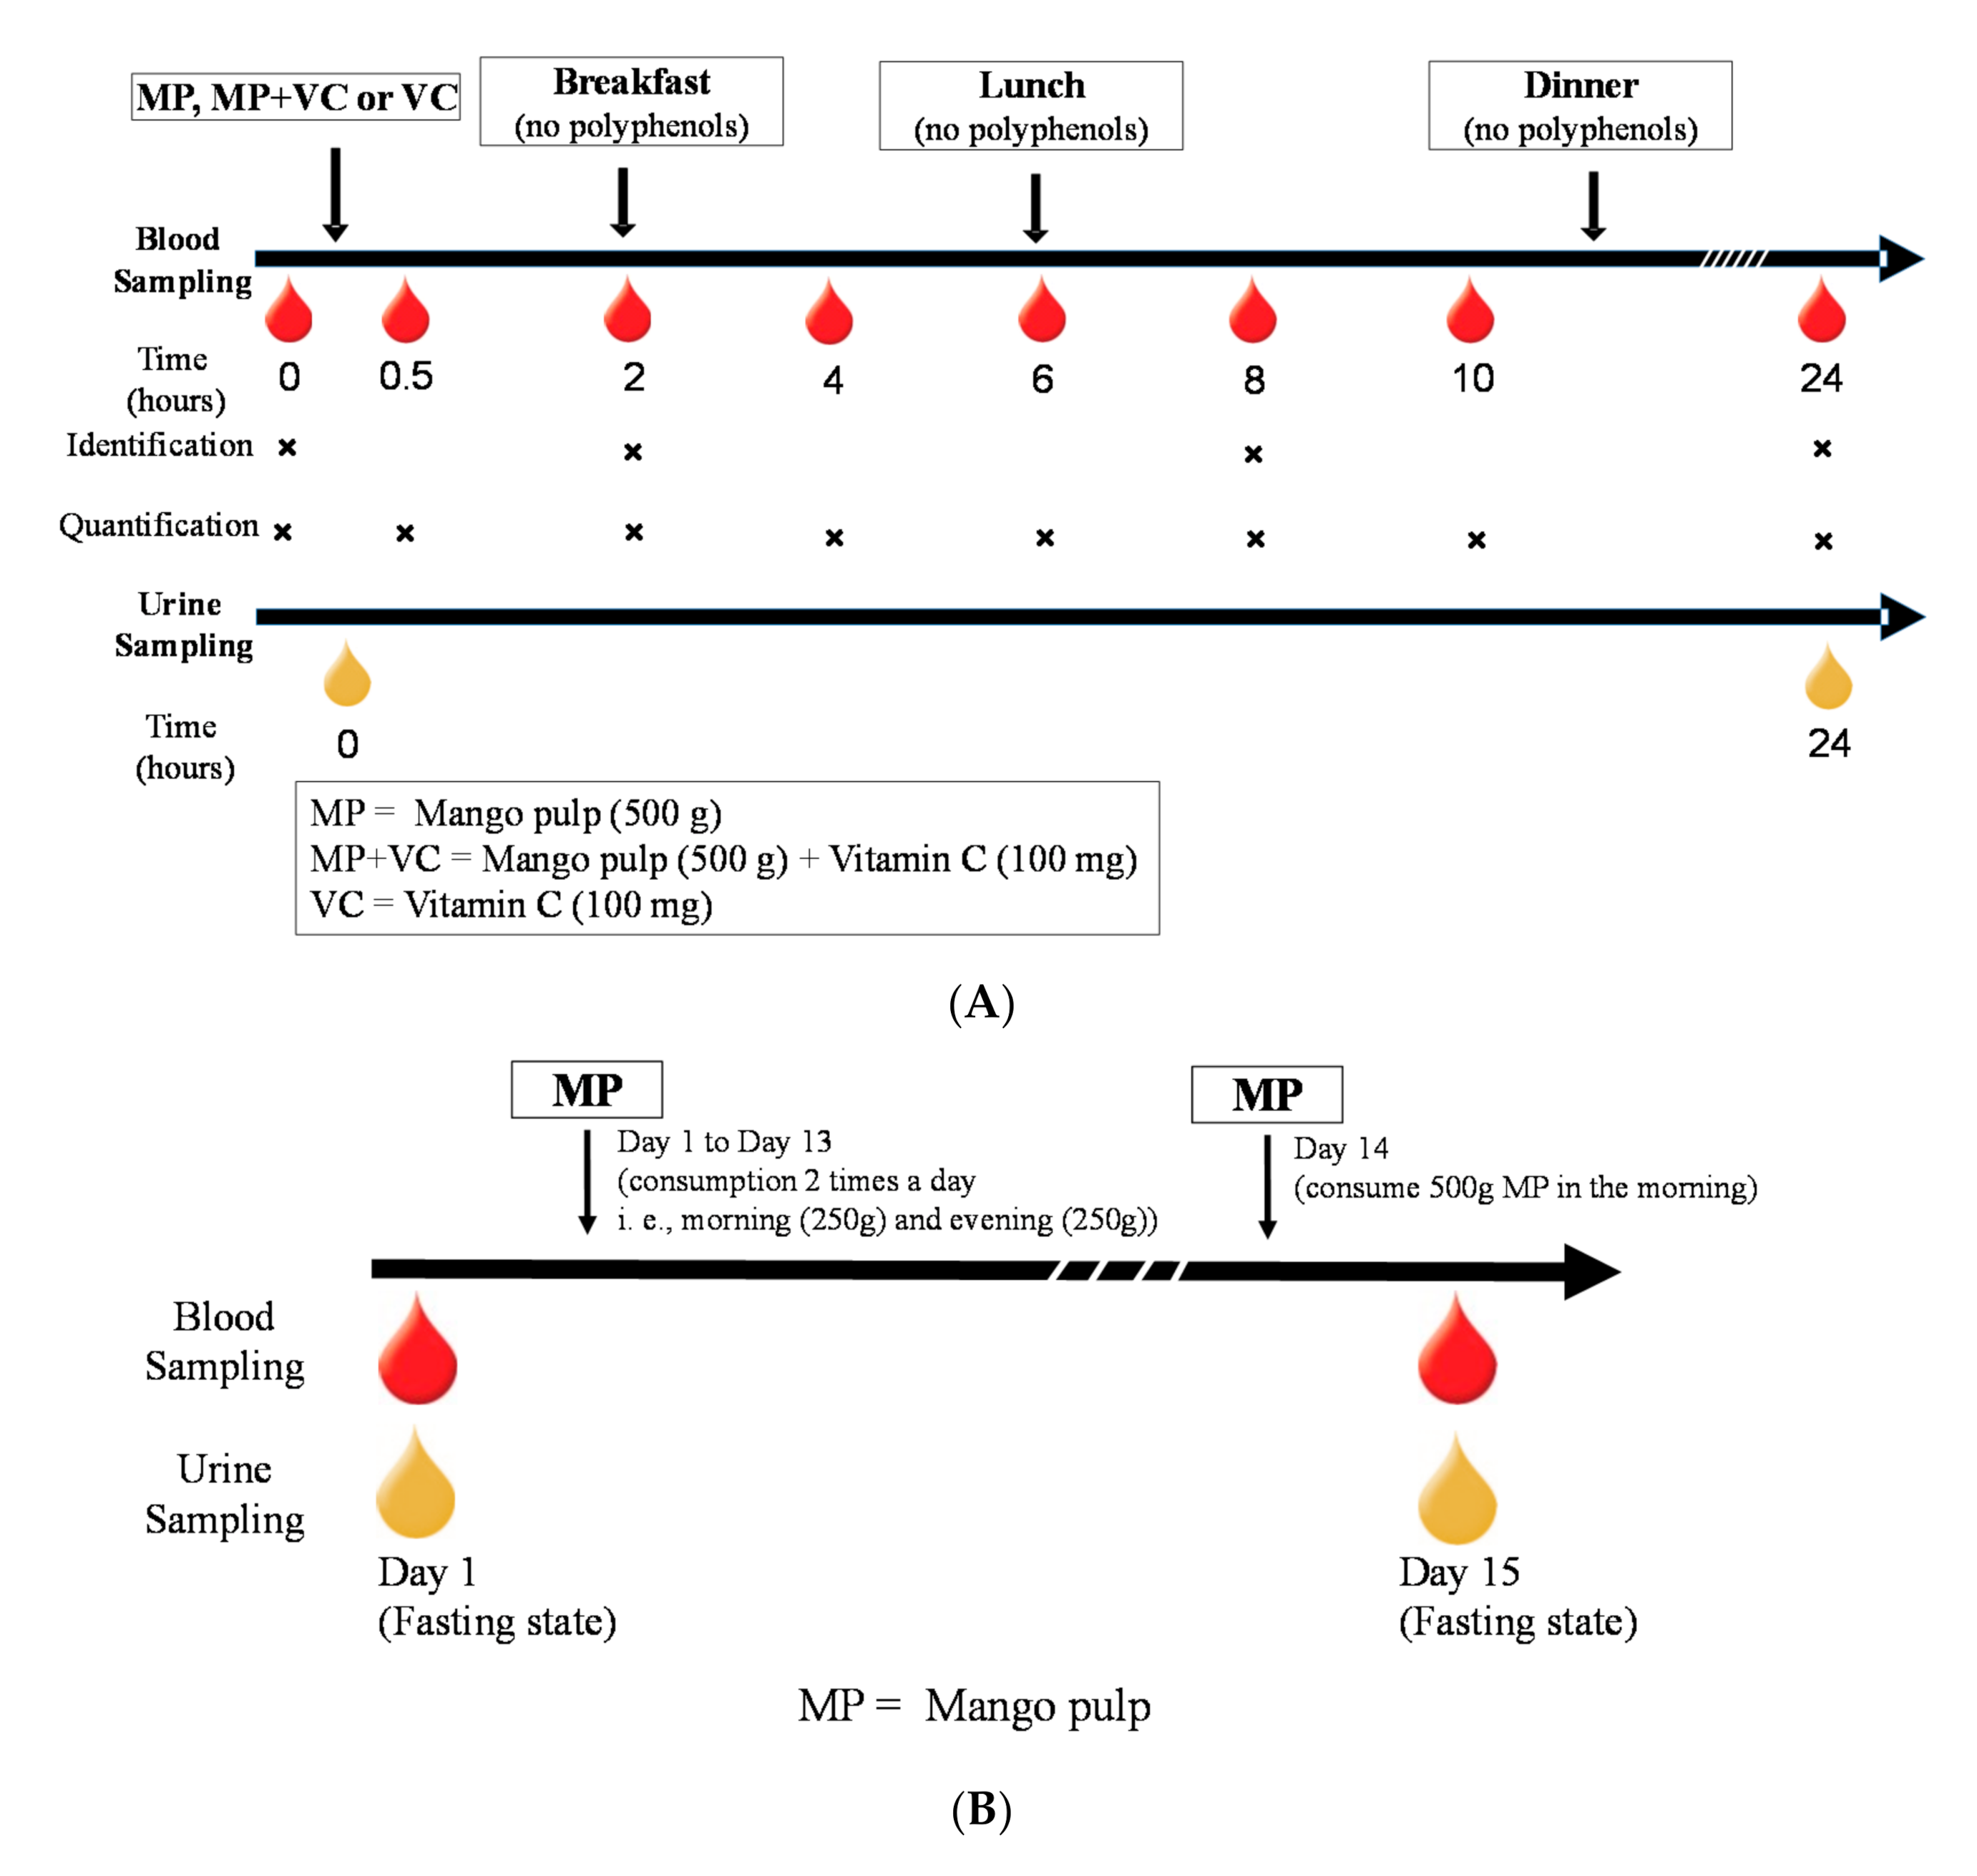
3.1.1. Acute 24 h Trial
3.1.2. Short-Term 14-Day Trial
3.2. Chemicals and Materials
3.3. Sample Preparation
3.3.1. Extraction of (Poly)phenolic Compounds from MP
3.3.2. Extraction of (Poly)phenolic Compounds from Plasma
3.3.3. Extraction of (Poly)phenolic Compounds from Urine
3.4. Identification and Quantification of (Poly)phenolic Compounds
3.5. Pharmacokinetic and Statistical Analysis
Author Contributions
Funding
Conflicts of Interest
Appendix A

| Compound Number | Retention Time (min) | Precursor Ion (m/z) | Calculated (m/z) | Mass Error | Molecular Formula | Product Ion (m/z) | Tentative Compound Identification |
|---|---|---|---|---|---|---|---|
| 1 | 1.3 | 191.05544 | 191.05556 | −0.6 | C7H12O6 | 191.05575, 129.04033, 145.10961 | Quinic acid * |
| 2 | 1.5 | 191.01904 | 191.01917 | −0.7 | C6H8O7 | 111.00075, 129.70383 | Citric acid |
| 3 | 2.1 | 493.11906 | 493.11934 | −0.6 | C19H26O15 | 169.01264, 313.05263, 405.25778 | Galloyl diglucoside |
| 4, 5 | 2.4, 2.8 | 331.06624 | 331.06652 | −0.8 | C13H16O10 | 125.02369, 169.01343 | Galloyl glucose |
| 6 | 2.9 | 153.01858 | 153.01878 | −1.3 | C7H6O4 | 125.02388, 136.94855, 108.99133 | Protocatechuic acid (3,4-Dihydroxybenzoic acid) * |
| 7 | 3.0 | 167.03402 | 167.03443 | −2.5 | C8H8O4 | 152.00786, 132.86693, 110.59943 | Vanillic acid * |
| 8 | 3.1 | 343.06588 | 343.06652 | −1.9 | C14H16O10 | 168.91982, 191.05969 | Galloylquinic acid |
| 9 | 3.3 | 299.07664 | 299.07669 | −0.2 | C13H16O8 | 137.02997, 179.03352 | Hydroxybenzoic acid glucoside |
| 10 | 3.9 | 179.03412 | 179.03443 | −1.7 | C9H8O4 | 135.04455, 118.93691 | Caffeic acid (3,4-Dihydroxycinnamic acid) * |
| 11 | 3.9 | 341.08707 | 341.08725 | −0.5 | C15H18O9 | 135.04457, 179.03434 | Caffeoyl glucose |
| 12 | 4.0 | 325.09221 | 325.09234 | −0.4 | C15H18O8 | 119.04938, 163.03948 | Coumaroyl hexoside |
| 13 | 4.0 | 163.03947 | 163.03951 | −0.2 | C9H8O3 | 163.03878, 119.04942 | Coumaric acid |
| 14, 15, 16, 17, 18, 19 | 4.1, 4.7, 4.9, 5.6, 7.0 | 635.08856 | 635.08843 | −0.2 | C27H24O18 | 169.01003, 465.06588 | Trigalloyl glucose |
| 4.5, 6.7 | 443.19130 | 443.19172 | −0.9 | C21H32O10 | 101.02350, 113.02310 | Dihydrophaseic acid glucoside | |
| 20 | 4.7 | 137.02392 | 137.02386 | −0.4 | C7H6O3 | 136.95173, 65.0389, 93.03008 | Hydroxybenzoic acid |
| 21 | 4.7 | 193.04965 | 193.05008 | −2.2 | C10H10O4 | 134.03702, 178.02565, 149.05928 | Ferulic acid * |
| 22 | 4.7, 5.9 | 355.10269 | 355.10290 | −0.6 | C16H20O9 | 134.03661, 193.04963, 178.02627 | Ferulic acid hexoside |
| 23 | 5.0 | 289.07077 | 289.07121 | −1.5 | C15H14O6 | 109.02822, 245.08098, 203.06967 | Catechin * |
| 24 | 5.4 | 223.05998 | 223.06064 | −3.0 | C11H12O5 | 123.90067, 193.01364, 135.04564 | Sinapic acid * |
| 25, 26, 27, 28, 29, 30 | 5.7, 6.1, 6.6, 7.0, 7.5, 7.7 | 403.16012 | 403.16042 | −0.7 | C21H24O8 | 197.11786, 241.10404 | Hydroxy-dimethyl decadiene-dioic acid glucopiranosylester |
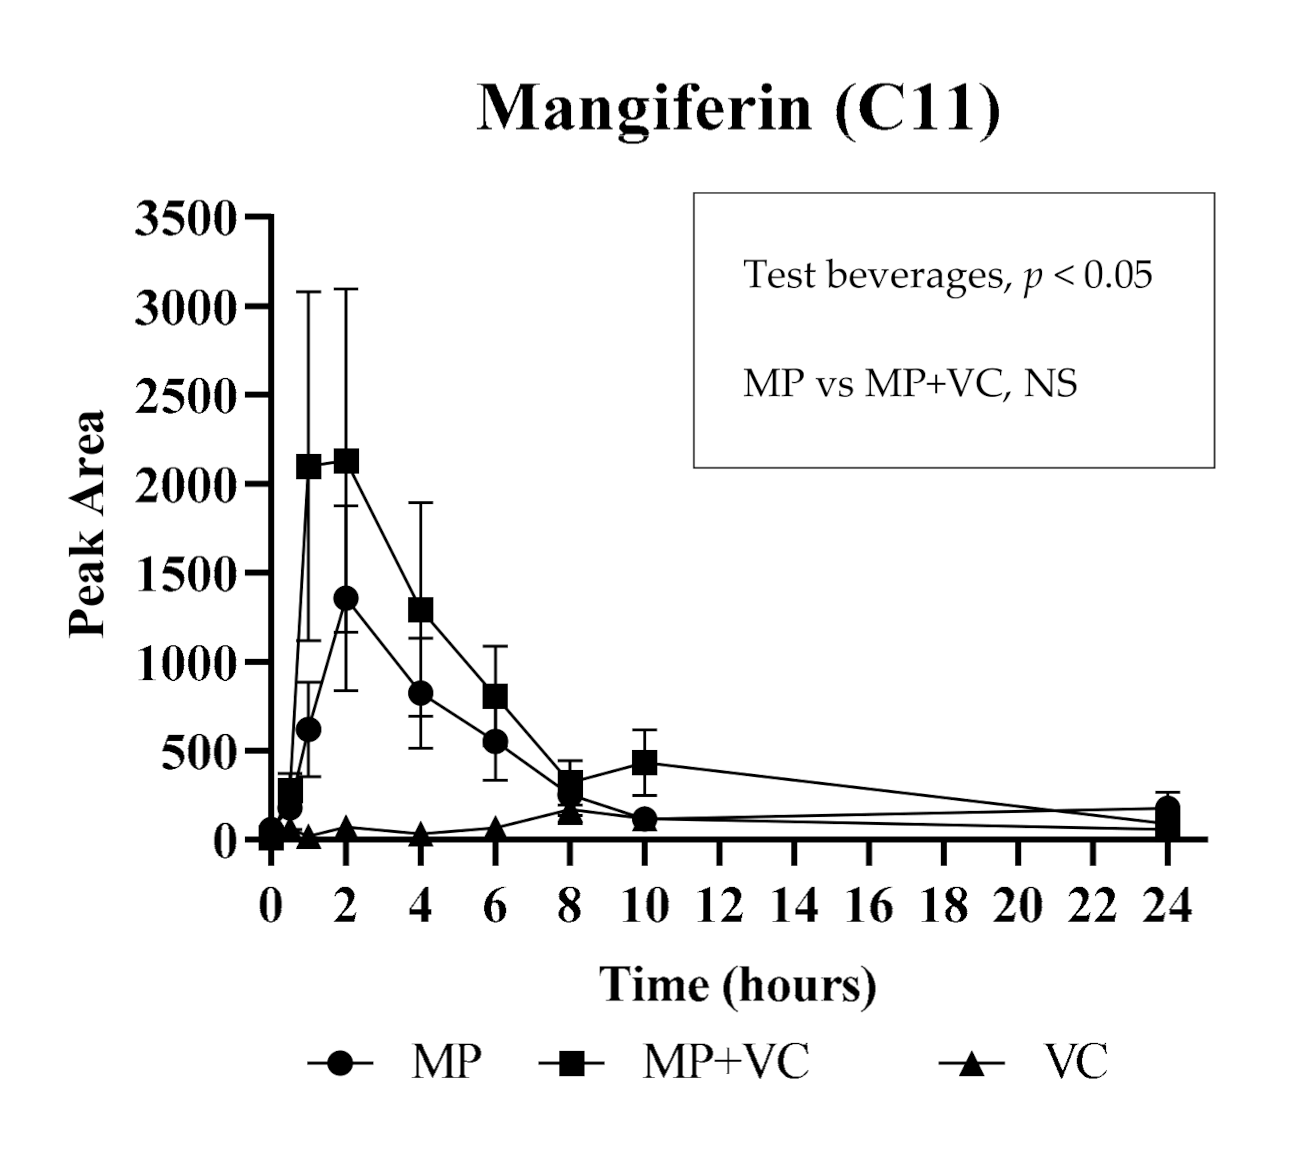
| 31 | 6.1 | 421.07560 | 421.07708 | −3.5 | C19H18O11 | 331.04450, 301.03487 | Mangiferin |
| 32 | 6.5 | 447.09407 | 447.09273 | 3.0 | C21H20O11 | 169.01225, 284.95930 | Kaempferol 3-O-glucoside * |
| 33 | 6.7 | 353.08664 | 353.08725 | −1.7 | C16H18O9 | 173.13091 | Caffeoyl quinic acid (chlorogenic acid) * |
| 34 | 6.8 | 477.10296 | 477.10330 | −0.7 | C22H22O12 | 315.05587, 163.03885, 119.04845 | Isorhamnetin hexoside |
| 35, 36, 37, 38, 39 | 6.8, 7.1, 8.0, 8.5, 8.9 | 787.09950 | 787.09939 | −0.1 | C34H28O22 | 169.01361, 393.34982 | Tetragalloyl glucose |
| 40 | 9.2 | 300.99786 | 300.99844 | −1.9 | C14H6O8 | 145.02748, 229.01413, 283.99356 | Ellagic acid * |
| 41 | 9.5 | 449.10773 | 449.10838 | −1.4 | C21H22O11 | 151.00166, 227.12791, 287.05559 | Eriodictyol hexoside |
| 42 | 9.9 | 463.08719 | 463.08765 | −1.0 | C21H20O12 | 300.02418, 301.03161, 271.02316 | Quercetin−3-O-glucoside * |
| 43 | 10.1 | 471.18617 | 471.18663 | −1.0 | C22H32O11 | 153.09122, 263.13877, 219.13877 | Abscisic acid glucose ester (formate adduct) |
| 44, 45 | 10.2, 16.0 | 263.12825 | 263.12833 | −0.3 | C15H20O4 | 153.09088, 219.13969, 245.84075 | Abscisic acid |
| 46 | 11.0 | 939.11025 | 939.11035 | −0.1 | C41H32O26 | 169.01349, 617.07628, 769.08941 | Pentagalloyl glucose |
| Compounds | Retention Time | Mean ± std Error (µmol/L) | p Value | Transition | ||
|---|---|---|---|---|---|---|
| (min) | 0 h (Fasting) | 24 h (Fasting) | 15 Days (Fasting) | 24 h vs. 15 Days | (m/z) | |
| Benzoic acid Derivatives | ||||||
| * 3,4-Dihydroxybenzoic acid q | 4.2 | 2.4 ± 0.7 | 1.1 ± 0.3 | 0.8 ± 0.2 | NS | 153.0 → 109.0 |
| * 2,5-Dihydroxybenzoic acid r | 5.8 | 6.7 ± 1.6 | 4.9 ± 1.0 | 7.9 ± 2.7 | NS | 153.0 → 109.0 |
| * 2,3-Dihydroxybenzoic acid s | 6.5 | 0.3 ± 0.1 | 0.2 ± 0.1 | 0.3 ± 0.1 | NS | 153.0 → 109.0 |
| Dihydroxybenzoic acid sulfate isomer 1 t | 3.5 | 1.3 ± 0.5 | 0.7 ± 0.2 | 2.3 ± 1.0 | NS | 233.0 → 153.0 |
| Dihydroxybenzoic acid sulfate isomer 2 t | 4.2 | 18.3 ± 4.7 | 8.1 ± 1.8 | 12.8 ± 3.3 | NS | 233.0 → 153.0 |
| Dihydroxybenzoic acid sulfate isomer 3 t | 5.0 | 5.8 ± 1.8 | 2.7 ± 0.6 | Not detected | N/A | 233.0 → 153.0 |
| Dihydroxybenzoic acid sulfate isomer 4 t | 6.6 | 1.1 ± 0.7 | 1.0 ± 0.3 | 1.3 ± 0.2 | NS | 233.0 → 153.0 |
| * 4-Hydroxybenzoic acid a | 5.4 | 6.1 ± 1.0 | 5.9 ± 0.9 | 5.4 ± 0.8 | NS | 137.0 → 93.0 |
| * Hydroxybenzoic acid 1 a | 5.0 | 3.8 ± 0.8 | 2.7 ± 0.5 | 2.4 ± 0.7 | NS | 137.0 → 93.0 |
| * Hydroxybenzoic acid 2 a | 4.4 | 3.4 ± 1.7 | 1.3 ± 0.1 | 2.6 ± 1.8 | NS | 137.0 → 93.0 |
| * Hydroxybenzoic acid 3 a | 10.9 | 1.9 ± 0.3 | 2.9 ± 0.6 | 3.2 ± 1.5 | NS | 137.0 → 93.0 |
| Hydroxybenzoic acid hexoside a | 4.4 | 0.6 ± 0.0 | 0.5 ± 0.0 | 0.2 ± 0.0 | NS | 299.1 → 137.0 |
| Hydroxybenzoic acid sulfate isomer 1 a | 4.5 | 6.9 ± 4.3 | 2.5 ± 0.5 | 6.3 ± 4.2 | NS | 217.0 → 137.0 |
| Hydroxybenzoic acid sulfate isomer 2 a | 11.7 | 5.0 ± 1.4 | 7.0 ± 3.6 | 16.7 ± 7.0 | NS | 217.0 → 137.0 |
| Hydroxybenzoic acid glucuronide isomer 1 a | 3.7 | 0.6 ± 0.0 | 0.4 ± 0.0 | 0.3 ± 0.0 | <0.05 | 313.1 → 137.0 |
| Hydroxybenzoic acid glucuronide isomer 2 a | 4.7 | 1.0 ± 0.2 | 0.8 ± 0.1 | 0.8 ± 0.4 | NS | 313.1 → 137.0 |
| Hydroxybenzoic acid glucuronide isomer 3 a | 6.6 | 0.9 ± 0.1 | 0.7 ± 0.1 | 0.6 ± 0.2 | NS | 313.1 → 137.0 |
| Hydroxybenzoic acid glucuronide isomer 4 a | 8.0 | 0.5 ± 0.0 | 0.4 ± 0.0 | 0.2 ± 0.0 | <0.05 | 313.1 → 137.0 |
| * Vanillic acid (4-Hydroxy-3-methoxybenzoic acid) b | 6.4 | 4.9 ± 0.9 | 4.4 ± 0.7 | 4.1 ± 1.0 | NS | 167.0 → 152.0 |
| * Hydroxymethoxybenzoic acid isomer 1 b | 5.6 | 4.6 ± 0.7 | 3.4 ± 0.3 | 5.5 ± 1.2 | NS | 167.0 → 152.0 |
| Methoxybenzoic acid glucuronide isomer 1 d | 1.3 | 14.0 ± 8.0 | 7.4 ± 3.0 | 2.7 ± 0.6 | NS | 343.1 → 167.0 |
| Methoxybenzoic acid glucuronide isomer 2 d | 3.6 | 2.8 ± 0.7 | 1.4 ± 0.2 | 2.2 ± 0.6 | NS | 343.1 → 167.0 |
| Methoxybenzoic acid glucuronide isomer 3 d | 4.3 | 5.8 ± 2.7 | 2.9 ± 0.6 | 7.3 ± 2.5 | NS | 343.1 → 167.0 |
| Methoxybenzoic acid sulfate isomer 1 d | 3.7 | 132.2 ± 26.0 | 59.4 ± 12.3 | 77.2 ± 23.2 | NS | 247.0 → 167.0 |
| Methoxybenzoic acid sulfate isomer 2 d | 5.7 | 43.7 ± 14.3 | 33.6 ± 76 | 45.7 ± 10.9 | NS | 247.0 → 167.0 |
| Methoxybenzoic acid sulfate isomer 3 d | 7.2 | 2.0 ± 0.5 | 0.8 ± 0.1 | 1.1 ± 0.2 | NS | 247.0 → 167.0 |
| Methoxybenzoic acid sulfate isomer 4 d | 9.0 | 5.7 ± 1.6 | 4.3 ± 0.7 | 4.3 ± 2.4 | NS | 247.0 → 167.0 |
| * Gallic acid (3,4,5-Trihydroxybenzoic acid) c | 2.4 | 0.2 ± 0.0 | 0.2 ± 0.0 | 0.1 ± 0.0 | <0.05 | 169.0 → 125.0 |
| Gallic acid derivative isomer 1 c | 9.0 | 0.3 ± 0.1 | 0.4 ± 0.2 | 1.0 ± 0.3 | NS | 311.0 → 125.0 |
| Gallic acid derivative isomer 2 c | 12.0 | 0.1 ± 0.0 | 0.1 ± 0.0 | 0.2 ± 0.1 | NS | 311.0 → 125.0 |
| Galloylshikimic acid isomer 1 c | 1.7 | 0.6 ± 0.1 | 0.4 ± 0.1 | 0.3 ± 0.1 | NS | 325.1 → 125.0 |
| Galloylshikimic acid isomer 2 c | 2.4 | 0.5 ± 0.1 | 0.2 ± 0.0 | 0.4 ± 0.1 | NS | 325.1 → 125.0 |
| Galloylshikimic acid isomer 3 c | 4.7 | 0.4 ± 0.2 | 0.5 ± 0.1 | 0.8 ± 0.2 | NS | 325.1 → 125.0 |
| Galloylshikimic acid isomer 4 c | 9.7 | 0.1 ± 0.0 | 0.1 ± 0.1 | 0.4 ± 0.1 | NS | 325.1 → 125.0 |
| Galloyl glucose isomer 1 c | 1.3 | 0.2 ± 0.0 | 0.1 ± 0.0 | 0.1 ± 0.0 | NS | 331.1 → 125.0 |
| Galloyl glucose isomer 2 c | 3.5 | 0.1 ± 0.0 | 0.1 ± 0.0 | 0.2 ± 0.1 | NS | 331.1 → 169.0 |
| Methyl gallate isomer 1 c | 4.6 | 0.6 ± 0.1 | 0.5 ± 0.1 | 2.2 ± 1.1 | NS | 183.2 → 124.0 |
| Methyl gallate isomer 2 c | 9.4 | 0.9 ± 0.3 | 0.6 ± 0.2 | 0.7 ± 0.2 | NS | 183.2 → 124.0 |
| Methylgallic acid sulfate isomer 1 c | 2.3 | 1.9 ± 0.2 | 1.9 ± 0.2 | 1.2 ± 0.2 | <0.05 | 263.1 → 168.0 |
| Methylgallic acid sulfate isomer 2 c | 4.8 | 2.0 ± 0.6 | 2.7 ± 0.5 | 23.2 ± 11.4 | NS | 263.1 → 168.0 |
| Methylgallic acid sulfate isomer 3 c | 5.2 | 1.4 ± 0.6 | 0.6 ± 0.1 | 1.8 ± 0.6 | <0.05 | 263.1 → 168.0 |
| Methylgallic acid sulfate isomer 4 c | 6.8 | 0.6 ± 0.1 | 0.9 ± 0.2 | 0.5 ± 0.2 | NS | 263.1 → 168.0 |
| Methylgallic acid sulfate isomer 5 c | 7.7 | 3.8 ± 0.7 | 4.6 ± 0.9 | 4.3 ± 1.4 | NS | 263.1 → 168.0 |
| Syringic acid (3,5-Dimethoxy-4-hydroxybenzoic acid) m | 2.4 | 3.6 ± 0.4 | 5.9 ± 0.8 | 1.7 ± 0.2 | <0.05 | 197.0 → 137.0 |
| Total | 299.3 ± 40.6 | 181.2 ± 25.7 | 253.2 ± 47.5 | NS | ||
| Phenylacetic acid Derivatives | ||||||
| * 3,4-Dihydroxyphenylacetic acid d | 4.2 | 8.0 ± 1.6 | 4.5 ± 0.8 | 3.8 ± 0.4 | NS | 167.0 → 123.0 |
| * Dihydroxyphenylacetic acid isomer 1 d | 1.4 | 4.7 ± 0.4 | 5.1 ± 0.4 | 2.6 ± 0.1 | <0.05 | 167.0 → 123.0 |
| * Dihydroxyphenylacetic acid isomer 2 d | 2.9 | 2.3 ± 0.3 | 2.0 ± 0.2 | 1.5 ± 0.2 | NS | 167.0 → 123.0 |
| Hydroxymethoxyphenylacetic acid sulfate isomer 1 b | 1.8 | 19.5 ± 2.6 | 14.9 ± 2.3 | 9.7 ± 1.4 | <0.05 | 261.0 → 181.0 |
| Hydroxymethoxyphenylacetic acid sulfate isomer 2 b | 4.5 | 8.7 ± 2.2 | 7.6 ± 1.5 | 8.9 ± 1.8 | NS | 261.0 → 181.0 |
| Hydroxymethoxyphenylacetic acid sulfate isomer 3 b | 5.4 | 7.8 ± 3.7 | 2.9 ± 0.8 | 5.5 ± 1.3 | NS | 261.0 → 181.0 |
| Hydroxymethoxyphenylacetic acid sulfate isomer 4 b | 6.2 | 20.1 ± 4.2 | 12.4 ± 2.6 | 56.7 ± 18.2 | <0.05 | 261.0 → 181.0 |
| Hydroxymethoxyphenylacetic acid sulfate isomer 5 b | 7.6 | 21.2 ± 5.0 | 11.5 ± 2.9 | 39.2 ± 10.1 | <0.05 | 261.0 → 181.0 |
| * 4-Hydroxyphenylacetic acid e | 6.5 | 4.2 ± 1.3 | 2.6 ± 0.6 | 3.0 ± 0.9 | NS | 151.0 → 107.0 |
| *Hydroxyphenylacetic acid isomer 1e | 1.5 | 45.7 ± 8.1 | 42.0 ± 6.2 | 26.1 ± 3.9 | NS | 151.0 → 108.0 |
| Methylphenylacetic acid sulfate isomer 1 e | 3.6 | 262.2 ± 44.6 | 166.8 ± 34.0 | 201.3 ± 37.3 | NS | 229.0 → 149.0 |
| Methylphenylacetic acid sulfate isomer 2 e | 4.4 | 61.7 ± 9.3 | 39.6 ± 7.8 | 50.8 ± 11.3 | NS | 229.0 → 149.0 |
| Methylphenylacetic acid sulfate isomer 3 e | 6.7 | 19.6 ± 3.8 | 12.9 ± 2.8 | 10.2 ± 1.5 | NS | 229.0 → 149.0 |
| Methylphenylacetic acid sulfate isomer 4 e | 10.7 | 16.1 ± 3.1 | 14.2 ± 3.4 | 37.7 ± 11.2 | NS | 229.0 → 149.0 |
| Methylphenylacetic acid sulfate isomer 5 e | 13.6 | 141.4 ± 71.2 | 74.0 ± 24.0 | 265.4 ± 126.5 | NS | 229.0 → 149.0 |
| Methylphenylacetic acid sulfate isomer 6 e | 14.5 | 13.8 ± 4 | 6.8 ± 2.5 | 16.5 ± 3.9 | <0.05 | 229.0 → 149.0 |
| Methylphenylacetic acid glucuronide isomer 1 e | 1.9 | 14.8 ± 9 | 10.6 ± 2.1 | 3.5 ± 0.9 | <0.05 | 325.1 → 149.0 |
| Methylphenylacetic acid glucuronide isomer 2 e | 7.3 | 1.6 ± 3.0 | 2.0 ± 0.8 | 2.6 ± 0.8 | NS | 325.1 → 149.0 |
| Methylphenylacetic acid glucuronide isomer 3 e | 9.7 | 4.1 ± 1.2 | 2.2 ± 0.6 | 3.6 ± 1.3 | NS | 325.1 → 149.0 |
| Methylphenylacetic acid glucuronide isomer 4 e | 10.7 | 3.3 ± 1.5 | 1.7 ± 0.8 | 5.0 ± 2.5 | NS | 325.1 → 149.0 |
| Methylphenylacetic acid glucuronide isomer 5 e | 11.2 | 1.0 ± 0.3 | 0.4 ± 0.1 | 2.3 ± 0.9 | <0.05 | 325.1 → 149.0 |
| Methylphenylacetic acid glucuronide isomer 6 e | 14.7 | 20.3 ± 7.5 | 25.4 ± 17.8 | 24.2 ± 11.0 | NS | 325.1 → 149.0 |
| Total | 702.1 ± 120.0 | 462.1 ± 67.5 | 780.1 ± 158.8 | NS | ||
| Phenylpropanoic acid Derivatives | ||||||
| * 3-Hydroxyphenylpropanoic acid f | 8.0 | 3.1 ± 0.8 | 2.0 ± 0.3 | 4.4 ± 1.9 | NS | 165.1 → 121.0 |
| * Hydroxyphenylpropanoic acid isomer 1 f | 5.5 | 4.0 ± 0.6 | 6.3 ± 2.4 | 8.2 ± 5.8 | NS | 165.1 → 121.0 |
| * Hydroxyphenylpropanoic acid isomer 2 f | 6.5 | 9.7 ± 2.0 | 12.3 ± 4.6 | 40.5 ± 26.9 | NS | 165.1 → 121.0 |
| * Hydroxyphenylpropanoic acid isomer 3 f | 6.9 | 1.7 ± 0.9 | 2.8 ± 1.8 | 1.3 ± 0.4 | NS | 165.1 → 121.0 |
| Hydroxyphenylpropanoic acid sulfate isomer 1 f | 2.4 | 55.5 ± 9.5 | 33.0 ± 8.4 | 18.7 ± 2.7 | NS | 245.0 → 165.0 |
| Hydroxyphenylpropanoic acid sulfate isomer 2 f | 9.0 | 57.9 ± 21.5 | 44.9 ± 18.8 | 72.2 ± 33.2 | NS | 245.0 → 165.0 |
| Hydroxyphenylpropanoic acid sulfate isomer 3 f | 10.3 | 42.1 ± 18.3 | 30.4 ± 12.0 | 39.3 ± 15.1 | NS | 245.0 → 165.0 |
| Hydroxyphenylpropanoic acid sulfate isomer 4 f | 13.8 | 57.9 ± 14.1 | 106.3 ± 23.7 | 68.0 ± 21.7 | NS | 245.0 → 165.0 |
| Hydroxyphenylpropanoic acid glucuronide isomer 1 m | 3.3 | 0.5 ± 0.1 | 0.3 ± 0.1 | 0.3 ± 0.1 | NS | 357.1 → 113.0 |
| Hydroxyphenylpropanoic acid glucuronide isomer 2 m | 4.8 | 0.4 ± 0.1 | 0.1 ± 0.0 | 0.3 ± 0.0 | <0.05 | 357.1 → 113.0 |
| Hydroxyphenylpropanoic acid glucuronide isomer 3 m | 4.3 | 0.1 ± 0.0 | 0.1 ± 0.0 | 0.1 ± 0.0 | <0.05 | 357.1 → 113.0 |
| Hydroxyphenylpropanoic acid glucuronide isomer 4 m | 5.8 | 0.2 ± 0.1 | 0.1 ± 0.0 | 0.2 ± 0.1 | <0.05 | 357.1 → 113.0 |
| Hydroxyphenylpropanoic acid glucuronide isomer 5 m | 6.6 | 0.1 ± 0.1 | 0.04 ± 0.01 | 0.2 ± 0.1 | <0.05 | 357.1 → 113.0 |
| Dihydroxyphenylpropanoic acid isomer 1 m | 3.1 | 0.1 ± 0.0 | 0.1 ± 0.0 | 0.1 ± 0.0 | NS | 181.1 → 119.0 |
| Dihydroxyphenylpropanoic acid isomer 2 m | 4.0 | 4.4 ± 1.3 | 1.5 ± 0.3 | 3.6 ± 0.8 | <0.05 | 181.1 → 119.0 |
| Dihydroxyphenylpropanoic acid isomer 3 m | 4.8 | 0.1 ± 0.1 | 0.04 ± 0.02 | 0.1 ± 0.1 | NS | 181.1 → 119.0 |
| Hydroxymethoxyphenylpropanoic acid isomer 1 n | 3.8 | 0.9 ± 0.1 | 0.5 ± 0.1 | 1.0 ± 0.3 | NS | 195.1 → 121.0 |
| Hydroxymethoxyphenylpropanoic acid isomer 2 n | 8.2 | 0.8 ± 0.2 | 0.8 ± 0.2 | 0.8 ± 0.2 | NS | 195.1 → 121.0 |
| Hydroxymethoxyphenylpropanoic acid isomer 3 n | 10.5 | 0.6 ± 0.2 | 1.1 ± 0.6 | 1.3 ± 0.8 | NS | 195.1 → 121.0 |
| Methoxyphenylpropanoic acid glucuronide isomer 1 f | 4.4 | 2.5 ± 0.8 | 1.6 ± 0.3 | 2.1 ± 1.2 | NS | 371.1 → 195.0 |
| Methoxyphenylpropanoic acid glucuronide isomer 2 f | 5.4 | 4.9 ± 1.1 | 3.8 ± 0.9 | 5.3 ± 1.8 | NS | 371.1 → 195.0 |
| Methoxyphenylpropanoic acid glucuronide isomer 3 f | 6.5 | 8.4 ± 1.9 | 6.0 ± 1.4 | 22.4 ± 14.9 | NS | 371.1 → 195.0 |
| Methoxyphenylpropanoic acid sulfate isomer 1 f | 4.9 | 10.8 ± 2.5 | 9.5 ± 2.1 | 13.3 ± 5.3 | NS | 275.0 → 195.0 |
| Methoxyphenylpropanoic acid sulfate isomer 2 f | 6.2 | 2.7 ± 1.3 | 0.8 ± 0.4 | Not detected | N/A | 275.0 → 195.0 |
| Methoxyphenylpropanoic acid sulfate isomer 3 f | 6.9 | 39.3 ± 15.3 | 23.2 ± 5.6 | 49.8 ± 13.8 | NS | 275.0 → 195.0 |
| Methoxyphenylpropanoic acid sulfate isomer 4 f | 8.4 | 14.2 ± 8.4 | 16.6 ± 10.1 | 6.5 ± 2.0 | NS | 275.0 → 195.0 |
| Total | 322.7 ± 44.7 | 304.0 ± 50.2 | 360.0 ± 79.3 | NS | ||
| Benzaldehyde Derivatives | ||||||
| * 4-Hydroxybenzaldehyde g | 6.6 | 0.2 ± 0.1 | 0.2 ± 0.0 | 0.2 ± 0.0 | NS | 121.0 → 92.0 |
| Total | 0.2 ± 0.1 | 0.2 ± 0.1 | 0.3 ± 0.0 | NS | ||
| Pyrogallol Derivatives | ||||||
| Pyrogallol sulfate isomer 1 h | 1.7 | 107.1 ± 16.5 | 84.5 ± 15.9 | 84.1 ± 18.8 | NS | 205. 0 → 125.0 |
| Pyrogallol sulfate isomer 2 h | 2.6 | 93.2 ± 30.5 | 105.8 ± 19.1 | 80.9 ± 30.4 | NS | 205. 0 → 125.0 |
| Pyrogallol sulfate isomer 3 h | 4.9 | 3377.4 ± 1910.4 | 4728.0 ± 1052.2 | 8496.0 ± 2091.8 | <0.05 | 205. 0 → 125.0 |
| Pyrogallol sulfate isomer 4 h | 7.7 | 21.5 ± 5.2 | 10.5 ± 2.1 | 16.6 ± 2.9 | NS | 205. 0 → 125.0 |
| Methylpyrogallol sulfate isomer 1 h | 3.2 | 138.4 ± 23.8 | 130.6 ± 27.3 | 83.1 ± 33.0 | NS | 219.2 → 139.0 |
| Methylpyrogallol sulfate isomer 2 h | 3.9 | 119.3 ± 60.6 | 82.3 ± 20.0 | 134.7 ± 31.7 | NS | 219.2 → 139.0 |
| Methylpyrogallol sulfate isomer 3 h | 5.8 | 279.4 ± 152.6 | 421.8 ± 104.3 | 520.8 ± 98.9 | NS | 219.2 → 139.0 |
| Methylpyrogallol sulfate isomer 4 h | 8.2 | 22.6 ± 6.9 | 8.1 ± 2.4 | 30.3 ± 10.6 | NS | 219.2 → 139.0 |
| Methylpyrogallol glucuronide isomer 1 h | 5.0 | Not detected | 1.7 ± 1.0 | 9.5 ± 1.5 | <0.05 | 315.1 → 216.9 |
| Methylpyrogallol glucuronide isomer 2 h | 5.4 | Not detected | 0.6 ± 0.6 | 0.9 ± 0.6 | NS | 315.1 → 216.9 |
| Total | 4158.9 ± 2151.9 | 5574.0 ± 1196.6 | 9456.9 ± 2208.5 | <0.05 | ||
| Catechol Derivatives | ||||||
| * Catechol (Benzene-1,2-diol) h | 4.1 | 18.7 ± 12.2 | 15.7 ± 4.1 | 15.1 ± 4.0 | NS | 109.0 → 108.0 |
| Catechol methyl sulfate isomer 1 h | 5.7 | 1189.1 ± 1011.8 | 694.8 ± 244.2 | 768.9 ± 252.8 | NS | 203.0 → 123.0 |
| Catechol methyl sulfate isomer 2 h | 7.7 | 8228. 2 ± 1836.0 | 4126.2 ± 827.0 | 5717. 8 ± 903.8 | NS | 203.0 → 123.0 |
| Catechol sulfate isomer 1 h | 2.6 | 442.0 ± 118.7 | 265.0 ± 77.6 | 337.5 ± 76.5 | NS | 189.0 → 109.0 |
| Catechol sulfate isomer 2 h | 3.5 | 36.4 ± 21.6 | 93.8 ± 58.3 | 664.8 ± 575.0 | NS | 189.0 → 109.0 |
| Catechol sulfate isomer 3 h | 4.6 | 42919.4 ± 26,920.7 | 26,826.7 ± 5601.6 | 35,686.6 ± 8264.9 | NS | 189.0 → 109.0 |
| Catechol sulfate isomer 4 h | 8.5 | 287.3 ± 79.8 | 182.0 ± 50.9 | 201.2 ± 44.3 | NS | 189.0 → 109.0 |
| Catechol glucuronide isomer 1 h | 1.7 | 38.7 ± 5.8 | 36.0 ± 5.8 | 14.7 ± 3.8 | <0.05 | 285.1 → 109.0 |
| Catechol glucuronide isomer 2 h | 2.4 | 0.1 ± 0.1 | 2.2 ± 0.9 | 2.8 ± 2.3 | NS | 285.1 → 109.0 |
| Catechol glucuronide isomer 3 h | 4.3 | 123.2 ± 116.6 | 14.6 ± 6.8 | 15.7 ± 5.7 | NS | 285.1 → 109.0 |
| Catechol glucuronide isomer 4 h | 6.7 | 1.4 ± 0.6 | 0.8 ± 0.4 | 1.4 ± 0.4 | NS | 285.1 → 109.0 |
| Dicatechol sulfate isomer 1 h | 3.8 | 21.5 ± 4.3 | 14.2 ± 3.0 | 14.8 ± 4.2 | NS | 299.0 → 109.0 |
| Dicatechol sulfate isomer 2 h | 4.3 | 5.2 ± 1.4 | 1.1 ± 0.5 | 2.3 ± 0.8 | NS | 299.0 → 109.0 |
| Dicatechol sulfate isomer 3 h | 5.2 | 15.9 ± 2.1 | 5.1 ± 1.0 | 3.1 ± 0.5 | <0.05 | 299.0 → 109.0 |
| Total | 53327.3 ± 28063.0 | 32278.3 ± 5964.0 | 43446.6 ± 9154.8 | NS | ||
| Hippuric acid Derivatives | ||||||
| * Hippuric acid i | 5.1 | 2805. 9 ± 568.8 | 3706.9 ± 582.3 | 2023.6 ± 241.9 | <0.05 | 178.1 → 77.0 |
| Hippuric acid conjugate 1 i | 1.3 | 1.3 ± 0.4 | 0.8 ± 0.4 | 0.4 ± 0.1 | NS | 311.0 → 135.0 |
| Hippuric acid conjugate 2 i | 4.6 | 0.2 ± 0.1 | 11.7 ± 11.2 | 1.6 ± 1.2 | NS | 311.0 → 135.0 |
| Hippuric acid conjugate 3 i | 8.8 | 0.3 ± 0.3 | Not detected | 0.4 ± 0.2 | N/A | 311.0 → 135.0 |
| Hippuric acid conjugate 4 i | 13.6 | Not detected | Not detected | 0.4 ± 0.3 | N/A | 311.0 → 135.0 |
| Hippuric acid sulfate isomer 1 i | 2.1 | 6.9 ± 2.9 | 1.9 ± 0.8 | 4.9 ± 2.8 | NS | 258.0 → 178.0 |
| Hippuric acid sulfate isomer 2 i | 3.5 | 135.0 ± 100.0 | 71.0 ± 47.5 | 53.6 ± 26.3 | NS | 258.0 → 178.0 |
| Hippuric acid sulfate isomer 3 i | 5.2 | 59.5 ± 22.1 | 39.9 ± 13.5 | 20.4 ± 6.9 | NS | 258.0 → 178.0 |
| Hippuric acid sulfate isomer 4 i | 6.3 | 31.5 ± 16.8 | 13.7 ± 7.7 | 15.7 ± 5.4 | NS | 258.0 → 178.0 |
| Hippuric acid sulfate isomer 5 i | 7.3 | Not detected | 1.7 ± 1.2 | 26.1 ± 6.4 | <0.05 | 258.0 → 178.0 |
| Hippuric acid sulfate isomer 6 i | 7.2 | 126.3 ± 71.9 | 36.2 ± 14.9 | 25.7 ± 6.4 | NS | 258.0 → 178.0 |
| Hydroxyhippuric acid isomer 1 i | 3.6 | 180.0 ± 63.2 | 120.3 ± 34.4 | 193.4 ± 36.4 | NS | 194.0 → 93.0 |
| Hydroxyhippuric acid isomer 2 i | 4.0 | 122.3 ± 42.2 | 40.6 ± 11.2 | 159.3 ± 31.1 | <0.05 | 194.0 → 93.0 |
| Hydroxyhippuric acid isomer 3 i | 8.1 | 377.3 ± 180.7 | 262.6 ± 62.5 | 1.2 ± 160/7 | NS | 194.0 → 93.0 |
| * 4-Methylhippuric acid t | 7.9 | 2.0 ± 1.0 | 1.5 ± 0.9 | 1.2 ± 0.4 | NS | 192.0 → 91.0 |
| Methyl hippurate i | 6.6 | 2.8 ± 2.3 | 7.8 ± 2.1 | 6.3 ± 1.7 | NS | 192.1 → 77.0 |
| Total | 3851.3 ± 681.7 | 4316.8 ± 625.7 | 2951.4 ± 306.3 | <0.05 | ||
| Cinnamic acid Derivatives | ||||||
| * Caffeic acid (3’,4’-Dihydroxycinnamic acid) m | 6.6 | 0.1 ± 0.0 | Not detected | 0.1 ± 0.0 | N/A | 179.0 → 135.0 |
| * Caffeic acid isomer m | 4.9 | 1.0 ± 0.2 | 1.4 ± 0.2 | 0.6 ± 0.1 | <0.05 | 179.0 → 135.0 |
| * Ferulic acid (4’-Hydroxy-3’-methoxycinnamic acid) n | 10.2 | 0.5 ± 0.1 | 0.4 ± 0.1 | 0.4 ± 0.1 | NS | 193.1 → 134.0 |
| * Ferulic acid isomer 1 n | 8.4 | 1.4 ± 0.4 | 0.9 ± 0.1 | 2.5 ± 1.0 | NS | 193.1 → 134.0 |
| * Ferulic acid isomer 2 n | 12.2 | 0.5 ± 0.1 | 0.5 ± 0.1 | 0.2 ± 0.0 | <0.05 | 193.1 → 134.0 |
| Methoxycinnamic acid glucuronide isomer 1 n | 5.6 | 4.5 ± 1.7 | 3.7 ± 0.9 | 7.6 ± 3.4 | NS | 369.1 → 193.0 |
| Methoxycinnamic acid glucuronide isomer 2 n | 6.9 | 3.3 ± 1.1 | 2.4 ± 0.4 | 5.5 ± 3.0 | NS | 369.1 → 193.0 |
| Methoxycinnamic acid glucuronide isomer 3 n | 7.5 | 0.4 ± 0.1 | 0.5 ± 0.1 | 0.3 ± 0.1 | NS | 369.1 → 193.0 |
| Methoxycinnamic acid glucuronide isomer 4 n | 8.6 | 1.0 ± 0.3 | 0.4 ± 0.2 | 0.7 ± 0.3 | NS | 369.1 → 193.0 |
| Methoxycinnamic acid glucuronide isomer 5 n | 9.6 | 0.7 ± 0.2 | 0.5 ± 0.1 | 1.0 ± 0.4 | NS | 369.1 → 193.0 |
| Methoxycinnamic acid sulfate isomer 1 n | 11.0 | 2.9 ± 1.4 | 1.0 ± 0.3 | 9.3 ± 7.3 | NS | 273.0 → 193.0 |
| Methoxycinnamic acid sulfate isomer 2 n | 11.9 | 3.7 ± 0.9 | 1.2 ± 0.4 | 3.6 ± 1.5 | NS | 273.0 → 193.0 |
| Ferulic acid hexoside isomer 1 n | 4.7 | 0.7 ± 0.1 | 0.6 ± 0.1 | 0.6 ± 0.1 | NS | 355.1 → 135.0 |
| Ferulic acid hexoside isomer 2 n | 5.8 | 1.4 ± 0.3 | 1.9 ± 0.7 | 5.2 ± 2.9 | NS | 355.1 → 135.0 |
| Ferulic acid hexoside isomer 3 n | 6.1 | 0.6 ± 0.3 | 1.1 ± 0.6 | 2.2 ± 1.4 | NS | 355.1 → 135.0 |
| Ferulic acid hexoside isomer 4 n | 8.5 | 0.4 ± 0.1 | 0.3 ± 0.1 | 0.3 ± 0.1 | NS | 355.1 → 135.0 |
| Ferulic acid hexoside isomer 5 n | 12.5 | 0.9 ± 0.2 | 0.8 ± 0.3 | 1.5 ± 0.8 | NS | 355.1 → 135.0 |
| Ferulic acid derivative isomer 1 n | 4.0 | 11.7 ± 2.6 | 7.1 ± 1.7 | 9.9 ± 2.5 | NS | 211.1 → 136.0 |
| Ferulic acid derivative isomer 2 n | 4.6 | 6.2 ± 2.3 | 2.0 ± 0.4 | 17.3 ± 14.3 | NS | 211.1 → 136.0 |
| * p-Coumaric acid (4’-Hydroxycinnamic acid) j | 8.8 | 0.5 ± 0.1 | 0.4 ± 0.1 | 0.3 ± 0.0 | <0.05 | 163.0 → 119.0 |
| * m-Coumaric acid (3’-Hydroxycinnamic acid) k | 10.0 | 0.8 ± 0.1 | 0.7 ± 0.1 | 0.7 ± 0.1 | NS | 163.0 → 119.0 |
| * o-Coumaric acid (2’-Hydroxycinnamic acid) l | 11.5 | 0.9 ± 0.1 | 0.9 ± 0.0 | 0.5 ± 0.1 | <0.05 | 163.0 → 119.0 |
| * Coumaric acid isomer 1 j | 8.2 | 3.4 ± 2.7 | 1.4 ± 0.8 | 0.6 ± 0.1 | NS | 163.0 → 119.0 |
| Total | 47.3 ± 9.2 | 30.2 ± 3.3 | 70.9 ± 27.8 | NS | ||
| Valerolactone Derivatives | ||||||
| Trihydroxyphenyl-γ-valerolactone sulfate isomer 1 p | 5.7 | Not detected | Not detected | 0.3 ± 0.2 | N/A | 303.0 → 223.1 |
| Trihydroxyphenyl-γ-valerolactone sulfate isomer 2 p | 12.0 | 0.05 ± 0.04 | 0.03 ± 0.02 | 0.03 ± 0.01 | NS | 303.0 → 223.1 |
| Dihydroxyphenyl-γ-valerolactone glucuronide isomer 1 p | 4.5 | Not detected | Not detected | 0.1 ± 0.1 | N/A | 383.1 → 207.1 |
| Dihydroxyphenyl-γ-valerolactone glucuronide isomer 2 p | 5.9 | 0.1 ± 0.1 | 0.01 ± 0.01 | 0.2 ± 0.1 | NS | 383.1 → 207.1 |
| Dihydroxyphenyl-γ-valerolactone glucuronide isomer 3 p | 6.2 | 0.6 ± 0.3 | 0.02 ± 0.01 | 1.3 ± 0.5 | <0.05 | 383.1 → 207.1 |
| Dihydroxyphenyl-γ-valerolactone sulfate isomer 1 o | 6.3 | 1.1 ± 0.6 | 0.7 ± 0.7 | 3.8 ± 2.6 | NS | 287.0 → 207.0 |
| Dihydroxyphenyl-γ-valerolactone sulfate isomer 2 o | 7.8 | 62.3 ± 20.5 | 13.3 ± 4.5 | 68.7 ± 21.8 | <0.05 | 287.0 → 207.0 |
| Total | 64.1 ± 20.7 | 14.1 ± 4.7 | 74.4 ± 24.1 | <0.05 | ||
| Others | ||||||
| Abscisic acid hexoside p | 13.0 | 0.7 ± 0.2 | 0.5 ± 0.1 | 0.3 ± 0.1 | NS | 425.2 → 219.0 |
| Abscisic acid sulfate isomer 1 p | 1.6 | 13.4 ± 3.4 | 9.4 ± 1.3 | 8.2 ± 1.3 | NS | 255.0 → 115.0 |
| Abscisic acid sulfate isomer 2 p | 1.9 | Not detected | Not detected | 10.7 ± 2.8 | N/A | 255.0 → 115.0 |
| Total | 14.1 ± 3.5 | 9.9 ± 1.4 | 19.1 ± 2.8 | <0.05 | ||
| Total for all compounds | 62,787.4 ± 31135.4 | 43,170.7 ± 7939.3 | 57,412.7 ± 12010.0 | NS | ||
| Item Name | Quantity | Measure | Wgt (g) | Cals (kcal) | FatCals (kcal) | Prot (g) | Carb (g) | TotFib (g) | Sugar (g) | SugAdd (g) | Fat (g) |
|---|---|---|---|---|---|---|---|---|---|---|---|
| Test beverage—MP | 600.0 | 321.4 | 0 | 0 | 85.7 | 7.1 | 75.0 | 0 | 0 | ||
| Water, tap | 100 | Gram | 100.0 | 0 | 0 | 0 | 0 | 0 | 0 | 0 | 0 |
| Mango, frozen | 500 | Gram | 500.0 | 321.4 | 0 | 0 | 85.7 | 7.1 | 75.0 | -- | 0 |
| Test beverage—MP + VC | 600.1 | 321.4 | 0 | 0 | 85.7 | 7.1 | 75.0 | 0 | 0 | ||
| Mango, frozen | 500 | Gram | 500.0 | 321.4 | 0 | 0 | 85.7 | 7.1 | 75.0 | -- | 0 |
| Ascorbic acid, VC, food grade | 100 | Milligram | 0.1 | 0 | 0 | 0 | 0 | 0 | 0 | -- | 0 |
| Water, tap | 100 | Gram | 100.0 | 0 | 0 | 0 | 0 | 0 | 0 | 0 | 0 |
| Test beverage—VC | 600.1 | 286.9 | 0 | 0 | 75.0 | 0 | 73.1 | 61.6 | 0 | ||
| Sugar, white, granulated | 38 | Gram | 38.0 | 147.1 | 0 | 0 | 38.0 | 0 | 37.9 | 37.9 | 0 |
| Fructose, powder | 25.5 | Gram | 25.5 | 93.8 | 0 | 0 | 25.5 | 0 | 23.6 | 23.6 | 0 |
| Dextrose | 11.5 | Gram | 11.5 | 46 | -- | 0 | 11.5 | 0 | 11.5 | -- | -- |
| Ascorbic acid, VC, food grade | 100 | Milligram | 0.1 | 0 | 0 | 0 | 0 | 0 | 0 | -- | 0 |
| Water, tap | 525 | Gram | 525.0 | 0 | 0 | 0 | 0 | 0 | 0 | 0 | 0 |
| Breakfast | 247.0 | 568.2 | 216.1 | 16.7 | 74.6 | 0 | 32.1 | 0 | 24.0 | ||
| Biscuits, buttermilk, frozen | 2 | Each | 118.0 | 340.0 | 144.0 | 8.0 | 44.0 | -- | 4.0 | -- | 16.0 |
| Butter, unsalted, sweet cream | 8 | Gram | 8.0 | 57.1 | 56.6 | 0 | -- | 0 | 0 | -- | 6.3 |
| Jelly, apple | 46 | Gram | 46.0 | 115.0 | 0 | 0 | 29.9 | 0 | 27.6 | -- | 0 |
| Egg white, raw | 70 | Gram | 70.0 | 36.4 | 1.1 | 7.6 | 0.5 | 0 | 0.5 | 0 | 0.1 |
| Cheese, cheddar, sharp, finely shredded | 5 | Gram | 5.0 | 19.6 | 14.5 | 1.1 | 0.2 | 0 | 0 | 0 | 1.6 |
| Lunch | 243.0 | 244.0 | 173.9 | 8.2 | 10.3 | 3.4 | 4.3 | 0 | 19.3 | ||
| Cucumber, fresh, without skin, sliced | 200 | Gram | 200.0 | 24.0 | 2.9 | 1.2 | 4.3 | 1.4 | 2.8 | 0 | 0.3 |
| Dressing, cucumber ranch, Hidden valley | 15 | Gram | 15.0 | 50.0 | 45.0 | 0 | 1.0 | -- | 0.5 | -- | 5.0 |
| Peanuts, cocktail, lightly salted | 28 | Gram | 28.0 | 170.0 | 126.0 | 7.0 | 5.0 | 2.0 | 1.0 | -- | 14.0 |
| Standard | LOQ (nmol/L) | Compounds Quantified |
|---|---|---|
| 2,3-Dihydroxybenzoic acid | 20.3 | 2,3-Dihydroxybenzoic acid |
| 2,5-Dihydroxybenzoic acid | 81.2 | 2,5-Dihydroxybenzoic acid |
| 4-Methylhippuric acid | 64.8 | 4-Methylhippuric acid, dihydroxybenzoic acid sulfate isomers |
| 3,4-Dihydroxybenzoic acid | 20.3 | 3,4-Dihydroxybenzoic acid |
| 3,4-Dihydroxyphenylacetic acid | 74.4 | 3,4-Dihydroxyphenylacetic acid, dihydroxyphenylacetic acid isomers, methoxybenzoic acid glucuronide isomers, methoxybenzoic acid sulfate isomers |
| 3-Hydroxyphenylpropanoic acid | 602.0 | 3-Hydroxyphenylpropanoic acid, hydroxyphenylpropanoic acid isomers, methoxyphenylpropanoic acid glucuronide isomers, methoxyphenylpropanoic acid sulfate isomers, hydroxyphenylpropanoic acid sulfate isomers |
| 4-Hydroxybenzaldehyde | 102.5 | 4-Hydroxybenzaldehyde |
| 4-Hydroxyphenylacetic acid | 10.3 | 4-Hydroxyphenylacetic acid, hydroxyphenylacetic acid isomer, methylphenylacetic acid sulfate isomers, methylphenylacetic acid glucuronide isomers |
| Caffeic acid | 69.4 | Caffeic acid isomers, dihydroxyphenylpropanoic acid isomers, hydroxyphenylpropanoic glucuronide isomers, syringic acid |
| Catechin | 86.2 | Dihydroxyphenyl-γ-valerolactone sulfate isomers |
| Catechol | 14.2 | Catechol, catechol methyl sulfate isomers, catechol sulfate isomers, dicatechol sulfate isomers, catechol glucuronide isomers, pyrogallol sulfate isomers, methylpyrogallol sulfate isomers, methylpyrogallol glucuronide isomers |
| Chlorogenic acid | 4.4 | Trihydroxyphenyl-r-valerolactone sulfate isomers, dihydroxyphenyl-γ-valerolactone glucuronide isomers, dihydroxyphenyl-r-valerolactone sulfate isomers, abscisic acid hexoside, abscisic acid sulfate isomers |
| Ferulic acid | 8.0 | Ferulic acid isomers, methoxycinnamic acid glucuronide isomers, ferulic acid hexoside isomers, ferulic acid derivative isomers, methoxycinnamic acid sulfate isomers, hydroxymethoxyphenylpropanoic acid isomers |
| Gallic acid | 36.8 | Gallic acid, gallic acid derivative isomers, galloylshikimic acid isomers, galloyl glucose isomers, methyl gallate isomers, methylgallic acid sulfate isomers |
| Hippuric acid | 34.9 | Hippuric acid, hippuric acid conjugates, methyl hippurate, hippuric acid sulfate isomers, hydroxyhippuric acid isomers |
| 4-Hydroxybenzoic acid | 90.6 | 4-Hydroxybenzoic acid, hydroxybenzoic acid isomers, hydroxybenzoic acid hexoside, hydroxybenzoic acid sulfate isomers, benzoic acid glucuronide isomers |
| Mangiferin | 5.2 | Mangiferin |
| m-Coumaric acid | 38.1 | m-Coumaric acid |
| o-Coumaric acid | 38.1 | o-Coumaric acid |
| p-Coumaric acid | 9.5 | p-Coumaric acid, coumaric acid isomer |
| Vanillic acid | 148.8 | Iso/vanillic acid isomers, hydroxymethoxyphenylacetic acid sulfate isomers |
References
- Palafox-Carlos, H.; Yahia, E.; González-Aguilar, G. Identification and quantification of major phenolic compounds from mango (Mangifera indica, cv. Ataulfo) fruit by HPLC-DAD-MS/MS-ESI and their individual contribution to the antioxidant activity during ripening. Food Chem. 2012, 135, 105–111. [Google Scholar] [CrossRef]
- Barnes, R.; Krenek, K.; Talcott, S.; Talcott, S. Profile of Gallic Acid Metabolites in Urine After the Intake of Mango (Mangifera indica, L.) cv. Keitt in Humans. FASEB J. 2015, 29, 606.13. [Google Scholar]
- Masibo, M.; He, Q. Major Mango Polyphenols and Their Potential Significance to Human Health. Compr. Rev. Food Sci. Food Saf. 2008, 7, 309–319. [Google Scholar] [CrossRef]
- Fang, C.; Kim, H.; Barnes, R.C.; Talcott, S.T.; Mertens-Talcott, S.U. Obesity-Associated Diseases Biomarkers Are Differently Modulated in Lean and Obese Individuals and Inversely Correlated to Plasma Polyphenolic Metabolites After 6 Weeks of Mango (Mangifera indica L.) Consumption. Mol. Nutr. Food Res. 2018, 62, 1800129. [Google Scholar] [CrossRef] [PubMed]
- Burton-Freeman, B.M.; Sandhu, A.K.; Edirisinghe, I. Mangos and their bioactive components: Adding variety to the fruit plate for health. Food Funct. 2017, 8, 3010–3032. [Google Scholar] [CrossRef] [PubMed]
- Aderibigbe, A.O.; Emudianughe, T.S.; Lawal, B.A.S. Antihyperglycaemic effect of Mangifera indica in rat. Phytother. Res. 1999, 13, 504–507. [Google Scholar] [CrossRef]
- Miura, T.; Ichiki, H.; Hashimoto, I.; Iwamoto, N.; Kao, M.; Kubo, M.; Ishihara, E.; Komatsu, Y.; Okada, M.; Ishida, T.; et al. Antidiabetic activity of a xanthone compound, mangiferin. Phytomedicine 2001, 8, 85–87. [Google Scholar] [CrossRef] [PubMed]
- Noratto, G.D.; Bertoldi, M.C.; Krenek, K.; Talcott, S.T.; Stringheta, P.C.; Mertens-Talcott, S.U. Anticarcinogenic Effects of Polyphenolics from Mango (Mangifera indica) Varieties. J. Agric. Food Chem. 2010, 58, 4104–4112. [Google Scholar] [CrossRef]
- Percival, S.S.; Talcott, S.T.; Chin, S.T.; Mallak, A.C.; Lounds-Singleton, A.; Pettit-Moore, J. Neoplastic Transformation of BALB/3T3 Cells and Cell Cycle of HL-60 Cells are Inhibited by Mango (Mangifera indica L.) Juice and Mango Juice Extracts. J. Nutr. 2006, 136, 1300–1304. [Google Scholar] [CrossRef] [Green Version]
- Garrido, G.; González, D.; Delporte, C.; Backhouse, N.; Quintero, G.; Núñez-Sellés, A.J.; Morales, M.A. Analgesic and anti-inflammatory effects of Mangifera indica L. extract (Vimang). Phytother. Res. 2001, 15, 18–21. [Google Scholar] [CrossRef]
- Garrido, G.; González, D.; Lemus, Y.; Delporte, C.; Delgado, R. Protective effects of a standard extract of Mangifera indica L. (VIMANG®) against mouse ear edemas and its inhibition of eicosanoid production in J774 murine macrophages. Phytomedicine 2006, 13, 412–418. [Google Scholar] [CrossRef] [PubMed]
- Kim, H.; Moon, J.Y.; Kim, H.; Lee, D.-S.; Cho, M.; Choi, H.-K.; Kim, Y.S.; Mosaddik, A.; Cho, S.K. Antioxidant and antiproliferative activities of mango (Mangifera indica L.) flesh and peel. Food Chem. 2010, 121, 429–436. [Google Scholar] [CrossRef]
- Rocha Ribeiro, S.M.; Queiroz, J.H.; Lopes Ribeiro de Queiroz, M.E.; Campos, F.M.; Pinheiro Sant’ana, H.M. Antioxidant in mango (Mangifera indica L.) pulp. Plant Foods Hum. Nutr. 2007, 62, 13–17. [Google Scholar] [CrossRef]
- Kaur, J.; Rathinam, X.; Kasi, M.; Leng, K.M.; Ayyalu, R.; Kathiresan, S.; Subramaniam, S. Preliminary investigation on the antibacterial activity of mango (Mangifera indica L: Anacardiaceae) seed kernel. Asian Pac. J. Trop. Med. 2010, 3, 707–710. [Google Scholar] [CrossRef] [Green Version]
- Blancas-Benitez, F.J.; Mercado-Mercado, G.; Quiros-Sauceda, A.E.; Montalvo-Gonzalez, E.; Gonzalez-Aguilar, G.A.; Sayago-Ayerdi, S.G. Bioaccessibility of polyphenols associated with dietary fiber and in vitro kinetics release of polyphenols in Mexican ‘Ataulfo’ mango (Mangifera indica L.) by-products. Food Funct. 2015, 6, 859–868. [Google Scholar] [CrossRef] [PubMed]
- Jiamboonsri, P.; Pithayanukul, P.; Bavovada, R.; Leanpolchareanchai, J.; Yin, T.; Gao, S.; Hu, M. Factors Influencing Oral Bioavailability of Thai Mango Seed Kernel Extract and Its Key Phenolic Principles. Molecules 2015, 20, 21254–21273. [Google Scholar] [CrossRef] [Green Version]
- Liu, H.; Wu, B.; Pan, G.; He, L.; Li, Z.; Fan, M.; Jian, L.; Chen, M.; Wang, K.; Huang, C. Metabolism and Pharmacokinetics of Mangiferin in Conventional Rats, Pseudo-Germ-Free Rats, and Streptozotocin-Induced Diabetic Rats. Drug Metab. Dispos. 2012, 40, 2109–2118. [Google Scholar] [CrossRef] [Green Version]
- Quiros-Sauceda, A.; Ayala-Zavala, J.F.; Astiazaran-Garcia, H.; Ornelas-Paz, J.; Wall-Medrano, A.; Alvarez-Parrilla, E.; Gonzalez-Aguilar, G. Bioaccessibility, Bioavailability and Antioxidant Stability of Phenolic Compounds Present in Mango (cv. ‘Ataulfo’) Following an in Vitro Digestion and Microbial Fermentation. FASEB J. 2015, 29, 606.604. [Google Scholar]
- Velderrain-Rodríguez, G.; Quirós-Sauceda, A.; Mercado-Mercado, G.; Ayala-Zavala, J.F.; Astiazarán-García, H.; Robles-Sánchez, R.M.; Wall-Medrano, A.; Sayago-Ayerdi, S.; González-Aguilar, G.A. Effect of dietary fiber on the bioaccessibility of phenolic compounds of mango, papaya and pineapple fruits by an in vitro digestion model. Food Sci. Technol. 2016, 36, 188–194. [Google Scholar] [CrossRef] [Green Version]
- Barnes, R.C.; Krenek, K.A.; Meibohm, B.; Mertens-Talcott, S.U.; Talcott, S.T. Urinary metabolites from mango (Mangifera indica L. cv. Keitt) galloyl derivatives and in vitro hydrolysis of gallotannins in physiological conditions. Mol. Nutr. Food Res. 2016, 60, 542–550. [Google Scholar] [CrossRef]
- Quirós-Sauceda, A.E.; Chen, C.-Y.O.; Blumberg, J.B.; Astiazaran-Garcia, H.; Wall-Medrano, A.; González-Aguilar, G.A. Processing ‘Ataulfo’ Mango into Juice Preserves the Bioavailability and Antioxidant Capacity of Its Phenolic Compounds. Nutrients 2017, 9, 1082. [Google Scholar] [CrossRef] [PubMed]
- Lambert, J.D.; Hong, J.; Kim, D.H.; Mishin, V.M.; Yang, C.S. Piperine enhances the bioavailability of the tea polyphenol (−)-epigallocatechin-3-gallate in mice. J. Nutr. 2004, 134, 1948–1952. [Google Scholar] [CrossRef] [PubMed] [Green Version]
- Bohn, T. Dietary factors affecting polyphenol bioavailability. Nutr. Rev. 2014, 72, 429–452. [Google Scholar] [CrossRef] [PubMed]
- Shim, S.-M.; Yoo, S.-H.; Ra, C.-S.; Kim, Y.-K.; Chung, J.-O.; Lee, S.-J. Digestive stability and absorption of green tea polyphenols: Influence of acid and xylitol addition. Food Res. Int. 2012, 45, 204–210. [Google Scholar] [CrossRef]
- Chen, C.-Y.; Milbury, P.E.; Kwak, H.-K.; Collins, F.W.; Samuel, P.; Blumberg, J.B. Avenanthramides and Phenolic Acids from Oats Are Bioavailable and Act Synergistically with Vitamin C to Enhance Hamster and Human LDL Resistance to Oxidation. J. Nutr. 2004, 134, 1459–1466. [Google Scholar] [CrossRef] [PubMed] [Green Version]
- Chen, C.-Y.; Milbury, P.E.; Lapsley, K.; Blumberg, J.B. Flavonoids from Almond Skins Are Bioavailable and Act Synergistically with Vitamins C and E to Enhance Hamster and Human LDL Resistance to Oxidation. J. Nutr. 2005, 135, 1366–1373. [Google Scholar] [CrossRef]
- Sandhu, A.; Miller, M.G.; Shukitt-Hale, B.; Edirisinghe, I.; Burton-Freeman, B. Metabolic Fate of Blueberry Anthocyanins after Chronic Supplementation in Healthy Older Adults. FASEB J. 2017, 31, 646.20. [Google Scholar]
- Sandhu, A.K.; Huang, Y.; Xiao, D.; Park, E.; Edirisinghe, I.; Burton-Freeman, B. Pharmacokinetic characterization and bioavailability of strawberry anthocyanins relative to meal intake. J. Agric. Food Chem. 2016, 64, 4891–4899. [Google Scholar] [CrossRef]
- Zhang, X.; Sandhu, A.; Edirisinghe, I.; Burton-Freeman, B. An exploratory study of red raspberry (Rubus idaeus L.) (poly) phenols/metabolites in human biological samples. Food Funct. 2018, 9, 806–818. [Google Scholar] [CrossRef]
- Zhong, S.; Sandhu, A.; Edirisinghe, I.; Burton-Freeman, B. Characterization of wild blueberry polyphenols bioavailability and kinetic profile in plasma over 24-h period in human subjects. Mol. Nutr. Food Res. 2017, 61, 1700405. [Google Scholar] [CrossRef]
- Barreto, J.C.; Trevisan, M.T.; Hull, W.E.; Erben, G.; De Brito, E.S.; Pfundstein, B.; Würtele, G.; Spiegelhalder, B.; Owen, R.W. Characterization and quantitation of polyphenolic compounds in bark, kernel, leaves, and peel of mango (Mangifera indica L.). J. Agric. Food Chem. 2008, 56, 5599–5610. [Google Scholar] [CrossRef] [PubMed]
- Schieber, A.; Ullrich, W.; Carle, R. Characterization of polyphenols in mango puree concentrate by HPLC with diode array and mass spectrometric detection. Food Sci. Emerg. Technol. 2000, 1, 161–166. [Google Scholar] [CrossRef]
- Fang, C.; Kim, H.; Yanagisawa, L.; Bennett, W.; Sirven, M.A.; Alaniz, R.C.; Talcott, S.T.; Mertens-Talcott, S.U. Gallotannins and Lactobacillus plantarum WCFS1 Mitigate High-Fat Diet-Induced Inflammation and Induce Biomarkers for Thermogenesis in Adipose Tissue in Gnotobiotic Mice. Mol. Nutr. Food Res. 2019, 63, e1800937. [Google Scholar] [CrossRef] [PubMed]
- Aguilar-Galvez, A.; Noratto, G.; Chambi, F.; Debaste, F.; Campos, D. Potential of tara (Caesalpinia spinosa) gallotannins and hydrolysates as natural antibacterial compounds. Food Chem. 2014, 156, 301–304. [Google Scholar] [CrossRef] [PubMed]
- Engels, C.; Schieber, A.; Gänzle, M.G. Inhibitory Spectra and Modes of Antimicrobial Action of Gallotannins from Mango Kernels (Mangifera indica L.). Appl. Environ. Microbiol. 2011, 77, 2215–2223. [Google Scholar] [CrossRef] [PubMed] [Green Version]
- Stalmach, A.; Steiling, H.; Williamson, G.; Crozier, A. Bioavailability of chlorogenic acids following acute ingestion of coffee by humans with an ileostomy. Arch. Biochem. Biophys. 2010, 501, 98–105. [Google Scholar] [CrossRef]
- Escudero-López, B.; Calani, L.; Fernández-Pachón, M.-S.; Ortega, Á.; Brighenti, F.; Crozier, A.; Del Rio, D. Absorption, metabolism, and excretion of fermented orange juice (poly)phenols in rats. Biofactors 2014, 40, 327–335. [Google Scholar] [CrossRef]
- Felgines, C.; Talavera, S.; Texier, O.; Gil-Izquierdo, A.; Lamaison, J.-L.; Remesy, C. Blackberry anthocyanins are mainly recovered from urine as methylated and glucuronidated conjugates in humans. J. Agric. Food Chem. 2005, 53, 7721–7727. [Google Scholar] [CrossRef]
- Van Duynhoven, J.; Vaughan, E.E.; Jacobs, D.M.; Kemperman, R.A.; Van Velzen, E.J.; Gross, G.; Roger, L.C.; Possemiers, S.; Smilde, A.K.; Doré, J. Metabolic fate of polyphenols in the human superorganism. Proc. Natl. Acad. Sci. USA 2011, 108, 4531–4538. [Google Scholar] [CrossRef] [Green Version]
- Del Rio, D.; Rodriguez-Mateos, A.; Spencer, J.P.; Tognolini, M.; Borges, G.; Crozier, A. Dietary (poly)phenolics in human health: Structures, bioavailability, and evidence of protective effects against chronic diseases. Antioxid. Redox Signal. 2013, 18, 1818–1892. [Google Scholar] [CrossRef] [Green Version]
- D’Archivio, M.; Filesi, C.; Varì, R.; Scazzocchio, B.; Masella, R. Bioavailability of the Polyphenols: Status and Controversies. Int. J. Mol. Sci. 2010, 11, 1321–1342. [Google Scholar] [CrossRef] [PubMed]
- Nemec, M.J.; Kim, H.; Marciante, A.B.; Barnes, R.C.; Talcott, S.T.; Mertens-Talcott, S.U. Pyrogallol, an absorbable microbial gallotannins-metabolite and mango polyphenols (Mangifera Indica L.) suppress breast cancer ductal carcinoma in situ proliferation in vitro. Food Funct. 2016, 7, 3825–3833. [Google Scholar] [CrossRef] [PubMed]
- Selma, M.V.; Espín, J.C.; Tomás-Barberán, F.A. Interaction between Phenolics and Gut Microbiota: Role in Human Health. J. Agric. Food Chem. 2009, 57, 6485–6501. [Google Scholar] [CrossRef] [PubMed]
- Stalmach, A.; Edwards, C.A.; Wightman, J.D.; Crozier, A. Colonic catabolism of dietary phenolic and polyphenolic compounds from Concord grape juice. Food Funct. 2013, 4, 52–62. [Google Scholar] [CrossRef]
- Pimpão, R.C.; Dew, T.; Figueira, M.E.; McDougall, G.J.; Stewart, D.; Ferreira, R.B.; Santos, C.N.; Williamson, G. Urinary metabolite profiling identifies novel colonic metabolites and conjugates of phenolics in healthy volunteers. Mol. Nutr. Food Res. 2014, 58, 1414–1425. [Google Scholar] [CrossRef]
- Williamson, G.; Clifford, M.N. Role of the small intestine, colon and microbiota in determining the metabolic fate of polyphenols. Biochem. Pharmacol. 2017, 139, 24–39. [Google Scholar] [CrossRef]
- Kim, H.; Barnes, R.; Fang, C.; Talcott, S.; Mertens-Talcott, S. Intestinal Microbiota and Host Metabolism Respond Differentially in Lean and Obese Individuals Following Six-Week Consumption of Galloyl Derivatives from Mango (Mangifera Indica L.) Pulp. FASEB J. 2017, 31, 166.8. [Google Scholar]
- Ferruzzi, M.G. The influence of beverage composition on delivery of phenolic compounds from coffee and tea. Physiol. Behav. 2010, 100, 33–41. [Google Scholar] [CrossRef]
- Green, R.J.; Murphy, A.S.; Schulz, B.; Watkins, B.A.; Ferruzzi, M.G. Common tea formulations modulate in vitro digestive recovery of green tea catechins. Mol. Nutr. Food Res. 2007, 51, 1152–1162. [Google Scholar] [CrossRef]
- Peters, C.M.; Green, R.J.; Janle, E.M.; Ferruzzi, M.G. Formulation with ascorbic acid and sucrose modulates catechin bioavailability from green tea. Food Res. Int. 2010, 43, 95–102. [Google Scholar] [CrossRef] [Green Version]
- Gawande, S.; Kale, A.; Kotwal, S. Effect of nutrient mixture and black grapes on the pharmacokinetics of orally administered (-) epigallocatechin-3-gallate from green tea extract: A human study. Phytother. Res. 2008, 22, 802–808. [Google Scholar] [CrossRef] [PubMed]
- Mertens-Talcott, S.U.; Kim, H.; Talcott, S.T.; Barnes, R. Adaptation of Galloyl Derivatives Metabolism and Excretion After 42 Days of Mango (Mangifera indica L.) Consumption. FASEB J. 2017, 31, 646.14. [Google Scholar]
- Barnes, R.C.; Kim, H.; Fang, C.; Bennett, W.; Nemec, M.; Sirven, M.A.; Suchodolski, J.S.; Deutz, N.; Britton, R.A.; Mertens-Talcott, S.U.; et al. Body Mass Index as a Determinant of Systemic Exposure to Gallotannin Metabolites during 6-Week Consumption of Mango (Mangifera indica L.) and Modulation of Intestinal Microbiota in Lean and Obese Individuals. Mol. Nutr. Food Res. 2019, 63, 1800512. [Google Scholar] [CrossRef] [PubMed]
- Fang, C.; Kim, H.; Barnes, R.; Talcott, S.T.; Mertens-Talcott, S.U. Daily Mango (Mangifera Indica L.) Consumption for 42 Days Differentially Modulates Metabolism and Inflammation in Lean and Obese Individuals. FASEB J. 2017, 31, 431.433. [Google Scholar]
- López de Felipe, F.; de Las Rivas, B.; Muñoz, R. Bioactive compounds produced by gut microbial tannase: Implications for colorectal cancer development. Front. Microbiol. 2014, 5, 684. [Google Scholar] [CrossRef]
- Chung, K.T.; Lu, Z.; Chou, M.W. Mechanism of inhibition of tannic acid and related compounds on the growth of intestinal bacteria. Food Chem. Toxicol. 1998, 36, 1053–1060. [Google Scholar] [CrossRef]
- Feliciano, R.; Istas, G.; Heiss, C.; Rodriguez-Mateos, A. Plasma and urinary phenolic profiles after acute and repetitive intake of wild blueberry. Molecules 2016, 21, 1120. [Google Scholar] [CrossRef]
- Agatonovic-Kustrin, S.; Kustrin, E.; Morton, D. Phenolic acids contribution to antioxidant activities and comparative assessment of phenolic content in mango pulp and peel. South Afr. J. Bot. 2018, 116, 158–163. [Google Scholar] [CrossRef]
- Lee, M.-J.; Maliakal, P.; Chen, L.; Meng, X.; Bondoc, F.Y.; Prabhu, S.; Lambert, G.; Mohr, S.; Yang, C.S. Pharmacokinetics of tea catechins after ingestion of green tea and (−)-epigallocatechin-3-gallate by humans: Formation of different metabolites and individual variability. Cancer Epidemiol. Prev. Biomark. 2002, 11, 1025–1032. [Google Scholar]
- Pimpao, R.C.; Ventura, M.R.; Ferreira, R.B.; Williamson, G.; Santos, C.N. Phenolic sulfates as new and highly abundant metabolites in human plasma after ingestion of a mixed berry fruit purée. Br. J. Nutr. 2015, 113, 454–463. [Google Scholar] [CrossRef] [Green Version]
- Queipo-Ortuño, M.I.; Boto-Ordóñez, M.; Murri, M.; Gomez-Zumaquero, J.M.; Clemente-Postigo, M.; Estruch, R.; Cardona Diaz, F.; Andres-Lacueva, C.; Tinahones, F.J. Influence of red wine polyphenols and ethanol on the gut microbiota ecology and biochemical biomarkers. Am. J. Clin. Nutr. 2012, 95, 1323–1334. [Google Scholar] [CrossRef] [PubMed]
- Hodges, R.E.; Minich, D.M. Modulation of metabolic detoxification pathways using foods and food-derived components: A scientific review with clinical application. Nutr. Metab. 2015, 2015, 1–23. [Google Scholar] [CrossRef] [PubMed]
- Cheung, B.W.; Cartier, L.L.; Russlie, H.Q.; Sawchuk, R.J. The application of sample pooling methods for determining AUC, AUMC and mean residence times in pharmacokinetic studies. Fundam. Clin. Pharmacol. 2005, 19, 347–354. [Google Scholar] [CrossRef] [PubMed]


| Compound Number | Retention Time (min) | Observed Ion (m/z) | Calculated (m/z) | Mass Error | Molecular Formula | Tentative Compound Identification | |
|---|---|---|---|---|---|---|---|
| 2 h | 1 | 1.2 | 367.10464 | 367.10287 | 4.8 | C17H20O9 | Feruloylquinic acid |
| 2 | 4.5 | 183.02976 | 183.02937 | 2.1 | C8H8O5 | Methylgallic acid | |
| 3 | 4.7 | 167.03452 | 167.03447 | 0.3 | C8H8O4 | Vanillic acid | |
| 4 | 6.5 | 285.06163 | 285.06107 | 2.0 | C12H14O8 | Catechol glucuronide | |
| 5 | 9.2 | 299.07736 | 299.07667 | 2.3 | C13H16O8 | Hydroxybenzoic acid glucoside | |
| 6 | 14.2 | 471.18600 | 471.18667 | −1.4 | C22H32O11 | Abscisic acid glucose ester (formate adduct) | |
| 7 | 14.4 | 192.06678 | 192.06607 | 3.7 | C10H11NO3 | Methylhippuric acid | |
| 8 h | 1 | 4.5 | 315.07213 | 315.07157 | 1.8 | C13H16O9 | Methylpyrogallol glucuronide |
| 2 | 5.3 | 371.09754 | 371.09787 | −0.9 | C16H20O10 | Methoxyphenylpropanoic acid glucuronide | |
| 3 | 6.0 | 204.98140 | 204.98067 | 3.6 | C6H6O6S | Pyrogallol sulfate | |
| 4 | 8.9 | 218.99631 | 218.99637 | −0.3 | C7H8O6S | Methylpyrogallol sulfate | |
| 5 | 9.3 | 299.07739 | 299.07667 | 2.4 | C13H16O8 | Hydroxybenzoic acid glucoside | |
| 6 | 22.1 | 331.0668 | 331.06657 | 3.7 | C13H16O10 | Galloyl glucose | |
| 24 h | 1 | 5.3 | 194.04533 | 194.04537 | −0.2 | C9H9NO4 | Hydroxyhippuric acid |
| 2 | 6.4 | 341.08881 | 341.08727 | 4.5 | C15H18O9 | Hydroxyphenylproanoic acid glucuronide | |
| 3 | 7.9 | 218.99631 | 218.99637 | −0.3 | C7H8O6S | Methylpyrogallol sulfate | |
| 4 | 15.9 | 194.04602 | 194.04537 | 3.3 | C9H9NO4 | Hydroxyhippuric acid isomer | |
| 5 | 20.7 | 597.10752 | 597.10917 | −2.8 | C25H26O17 | Iso/mangiferin glucuronide |
| Compound Names (Number) | Pharmacokinetic Parameters | MP (A) | MP + VC (B) | VC (C) | p Value | |||
|---|---|---|---|---|---|---|---|---|
| Tx | A vs. B | A vs. C | B vs. C | |||||
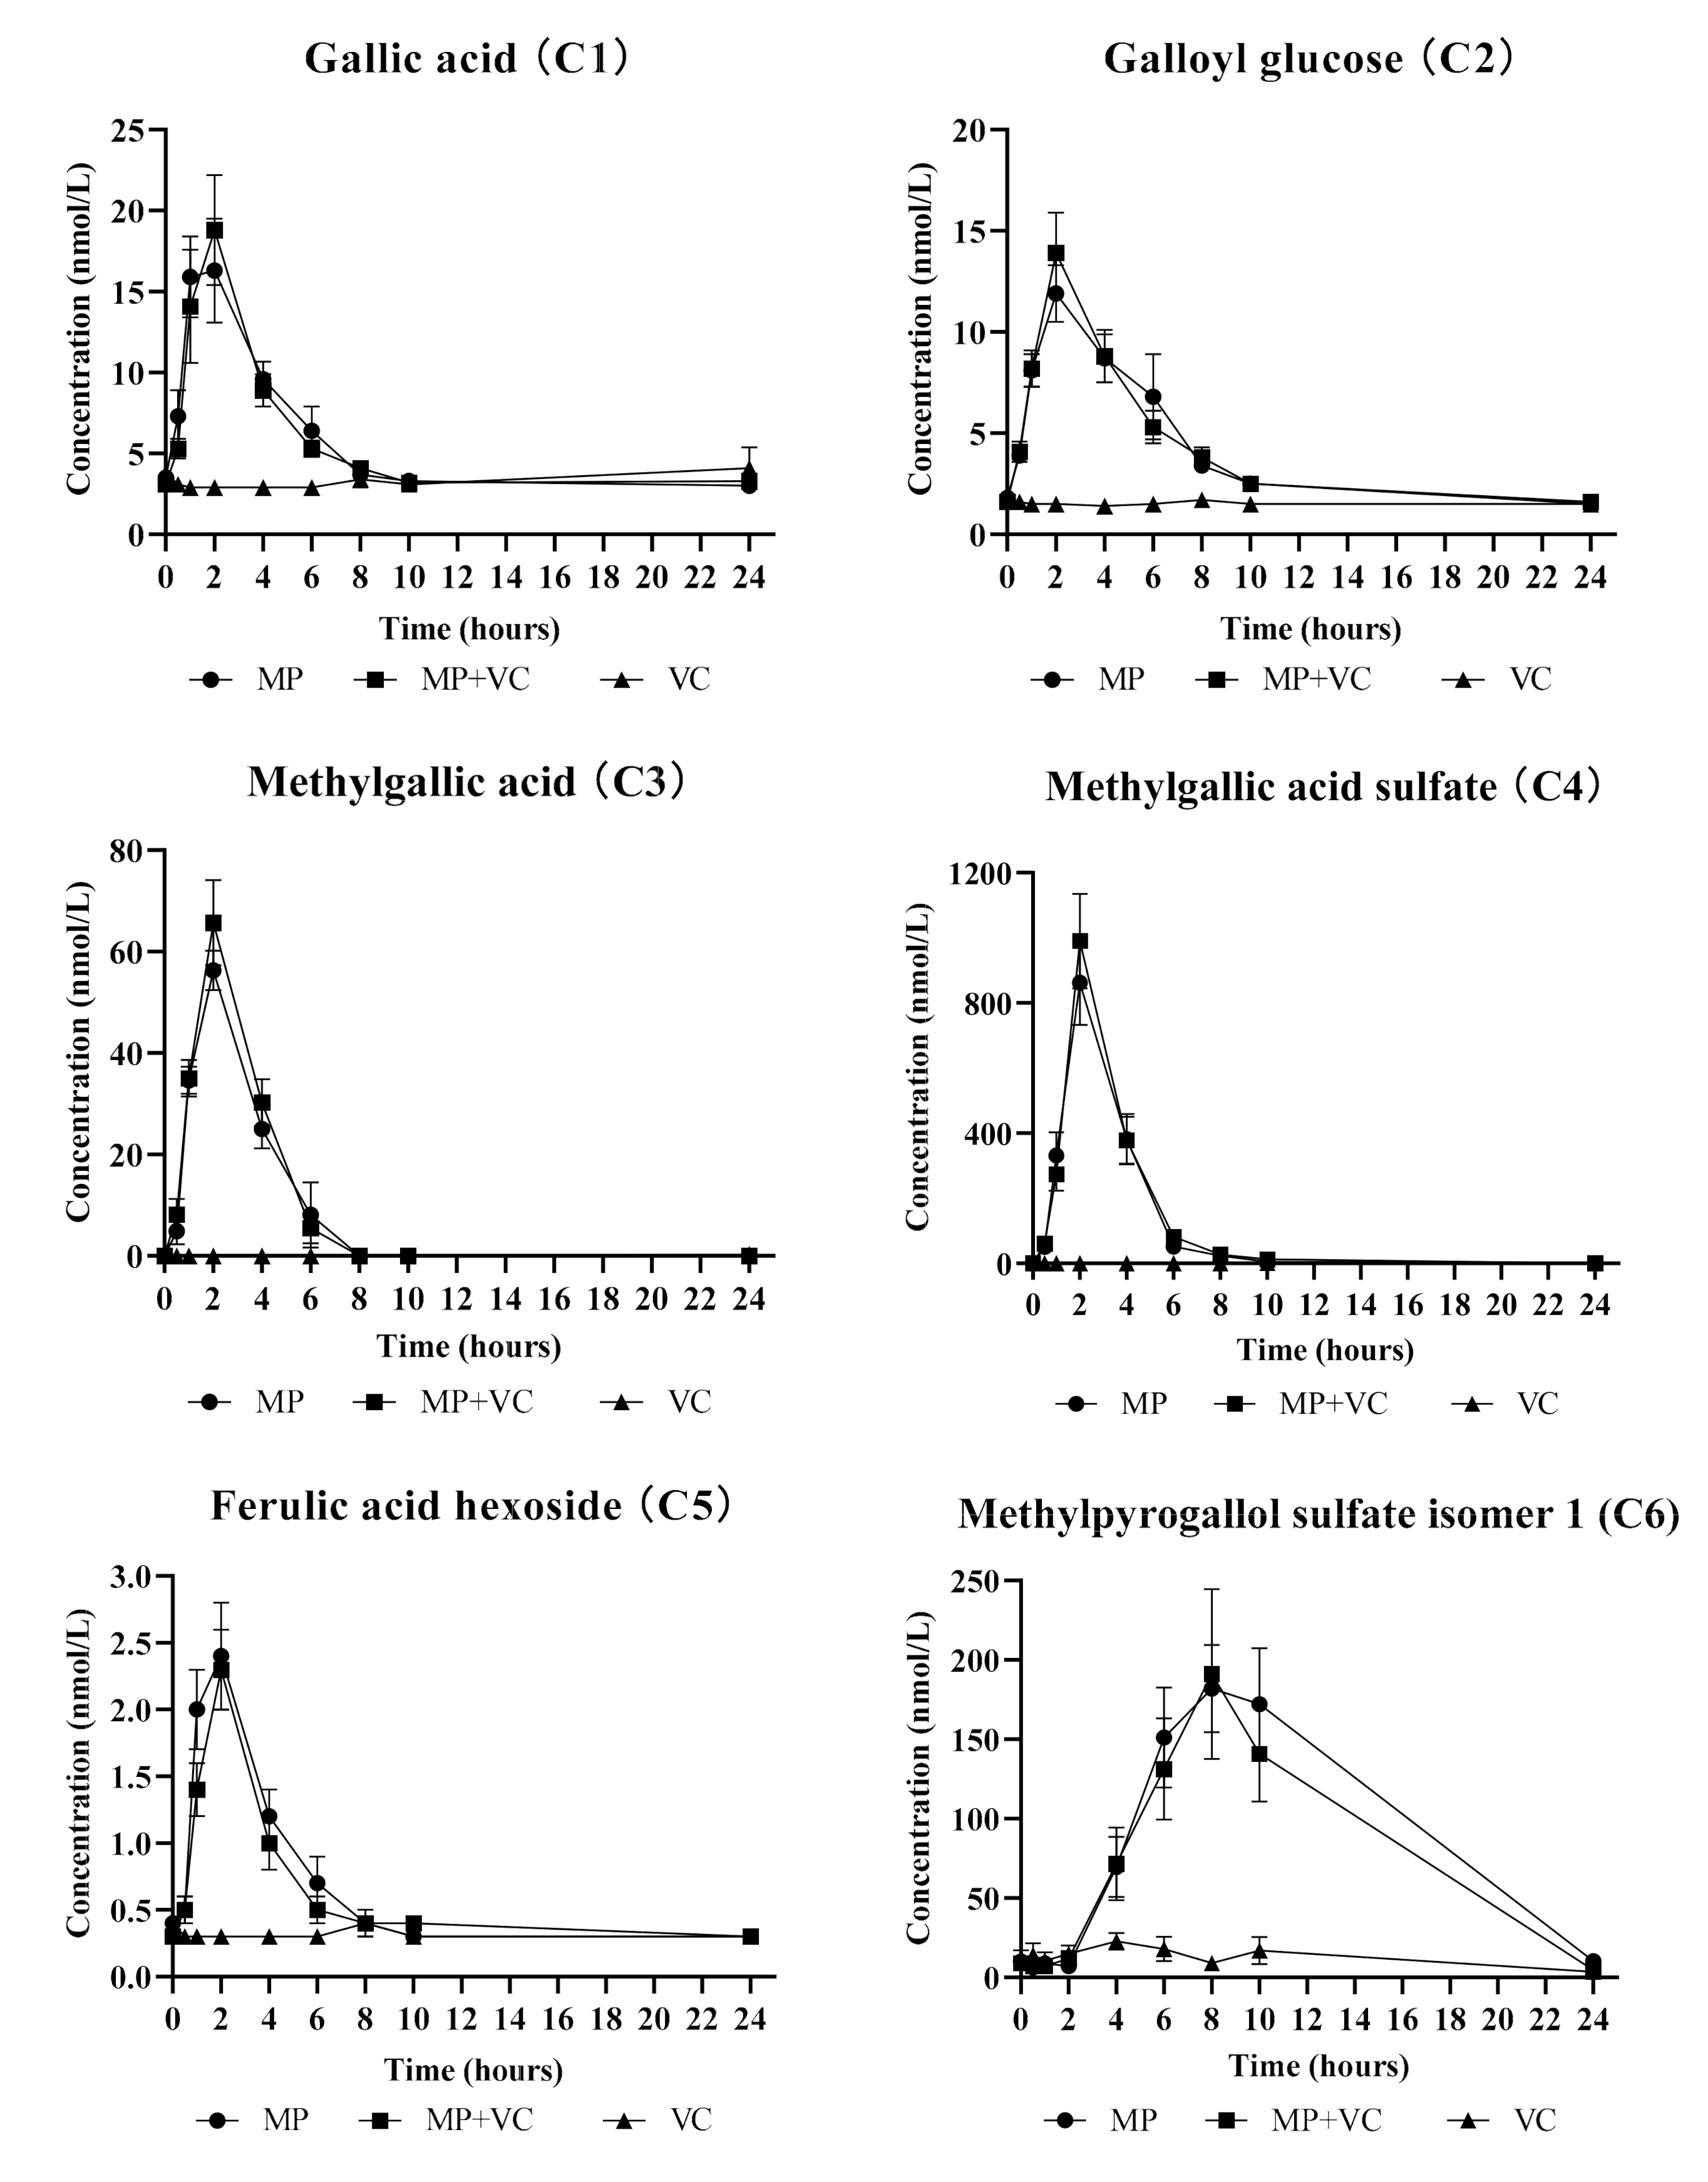
| Gallic acid (C1) | Cmax (nmol/L) | 20.4 ± 3.1 | 21.1 ± 3.9 | 5.3 ± 1.3 | <0.0001 | NS | <0.0001 | <0.0001 |
| Tmax (h) | 2.2 ± 0.4 | 2.0 ± 0.3 | N/A | NS | N/A | N/A | ||
| AUC0–24h (nmol·h/L) | 64.5 ± 7.8 | 62.8 ± 6.9 | 24.9 ± 1.9 | <0.0001 | NS | <0.0001 | <0.0001 | |
| Galloyl glucose (C2) | Cmax (nmol/L) | 13.4 ± 1.9 | 14.0 ± 2.0 | 2.1 ± 0.3 | <0.0001 | NS | <0.0001 | <0.0001 |
| Tmax (h) | 2.4 ± 0.3 | 2.2 ± 0.2 | N/A | NS | N/A | N/A | ||
| AUC0–24h (nmol·h/L) | 46.1 ± 5.0 | 48.0 ± 5.6 | 12.3 ± 0.7 | <0.0001 | NS | <0.0001 | <0.0001 | |
| Methylgallic acid (C3) | Cmax (nmol/L) | 54.5 ± 4.9 | 65.7 ± 8.4 | 4.8 ± 0.7 | <0.0001 | NS | <0.0001 | <0.0001 |
| Tmax (h) | 2.2 ± 0.3 | 2.0 ± 0.0 | N/A | NS | N/A | N/A | ||
| AUC0–24h (nmol·h/L) | 161.1 ± 13.6 | 178.7 ± 17.5 | 25.9 ± 1.9 | <0.0001 | NS | <0.0001 | <0.0001 | |
| Methylgallic acid sulfate (C4) | Cmax (nmol/L) | 824.2 ± 130.8 | 990.8 ± 145.0 | 6.3 ± 1.6 | <0.0001 | NS | <0.0001 | <0.0001 |
| Tmax (h) | 2.2 ± 0.2 | 2.0 ± 0.0 | N/A | NS | N/A | N/A | ||
| AUC0–24h (nmol·h/L) | 1655.8 ± 274.0 | 1837.1 ± 258.3 | 24.7 ± 3.0 | <0.0001 | NS | <0.0001 | <0.0001 | |
| Ferulic acid hexoside (C5) | Cmax (nmol/L) | 2.3 ± 0.4 | 2.4 ± 0.3 | 0.5 ± 0.1 | <0.0001 | NS | <0.0001 | <0.0001 |
| Tmax (h) | 1.8 ± 0.2 | 1.8 ± 0.1 | N/A | NS | N/A | N/A | ||
| AUC0–24h (nmol·h/L) | 7.7 ± 1.2 | 6.8 ± 0.7 | 2.5 ± 0.1 | <0.0001 | NS | <0.0001 | <0.0001 | |
| Methylpyrogallol sulfate isomer (C6) | Cmax (nmol/L) | 230.2 ± 32.3 | 224.9 ± 50.3 | 35.8 ± 9.5 | <0.0001 | NS | <0.0001 | <0.0001 |
| Tmax (h) | 8.6 ± 0.5 | 7.7 ± 0.6 | N/A | NS | N/A | N/A | ||
| AUC0–24h (nmol·h/L) | 616.9 ± 83.7 | 578.1 ± 103.7 | 129.5 ± 36.0 | <0.0001 | NS | <0.0001 | <0.0001 | |
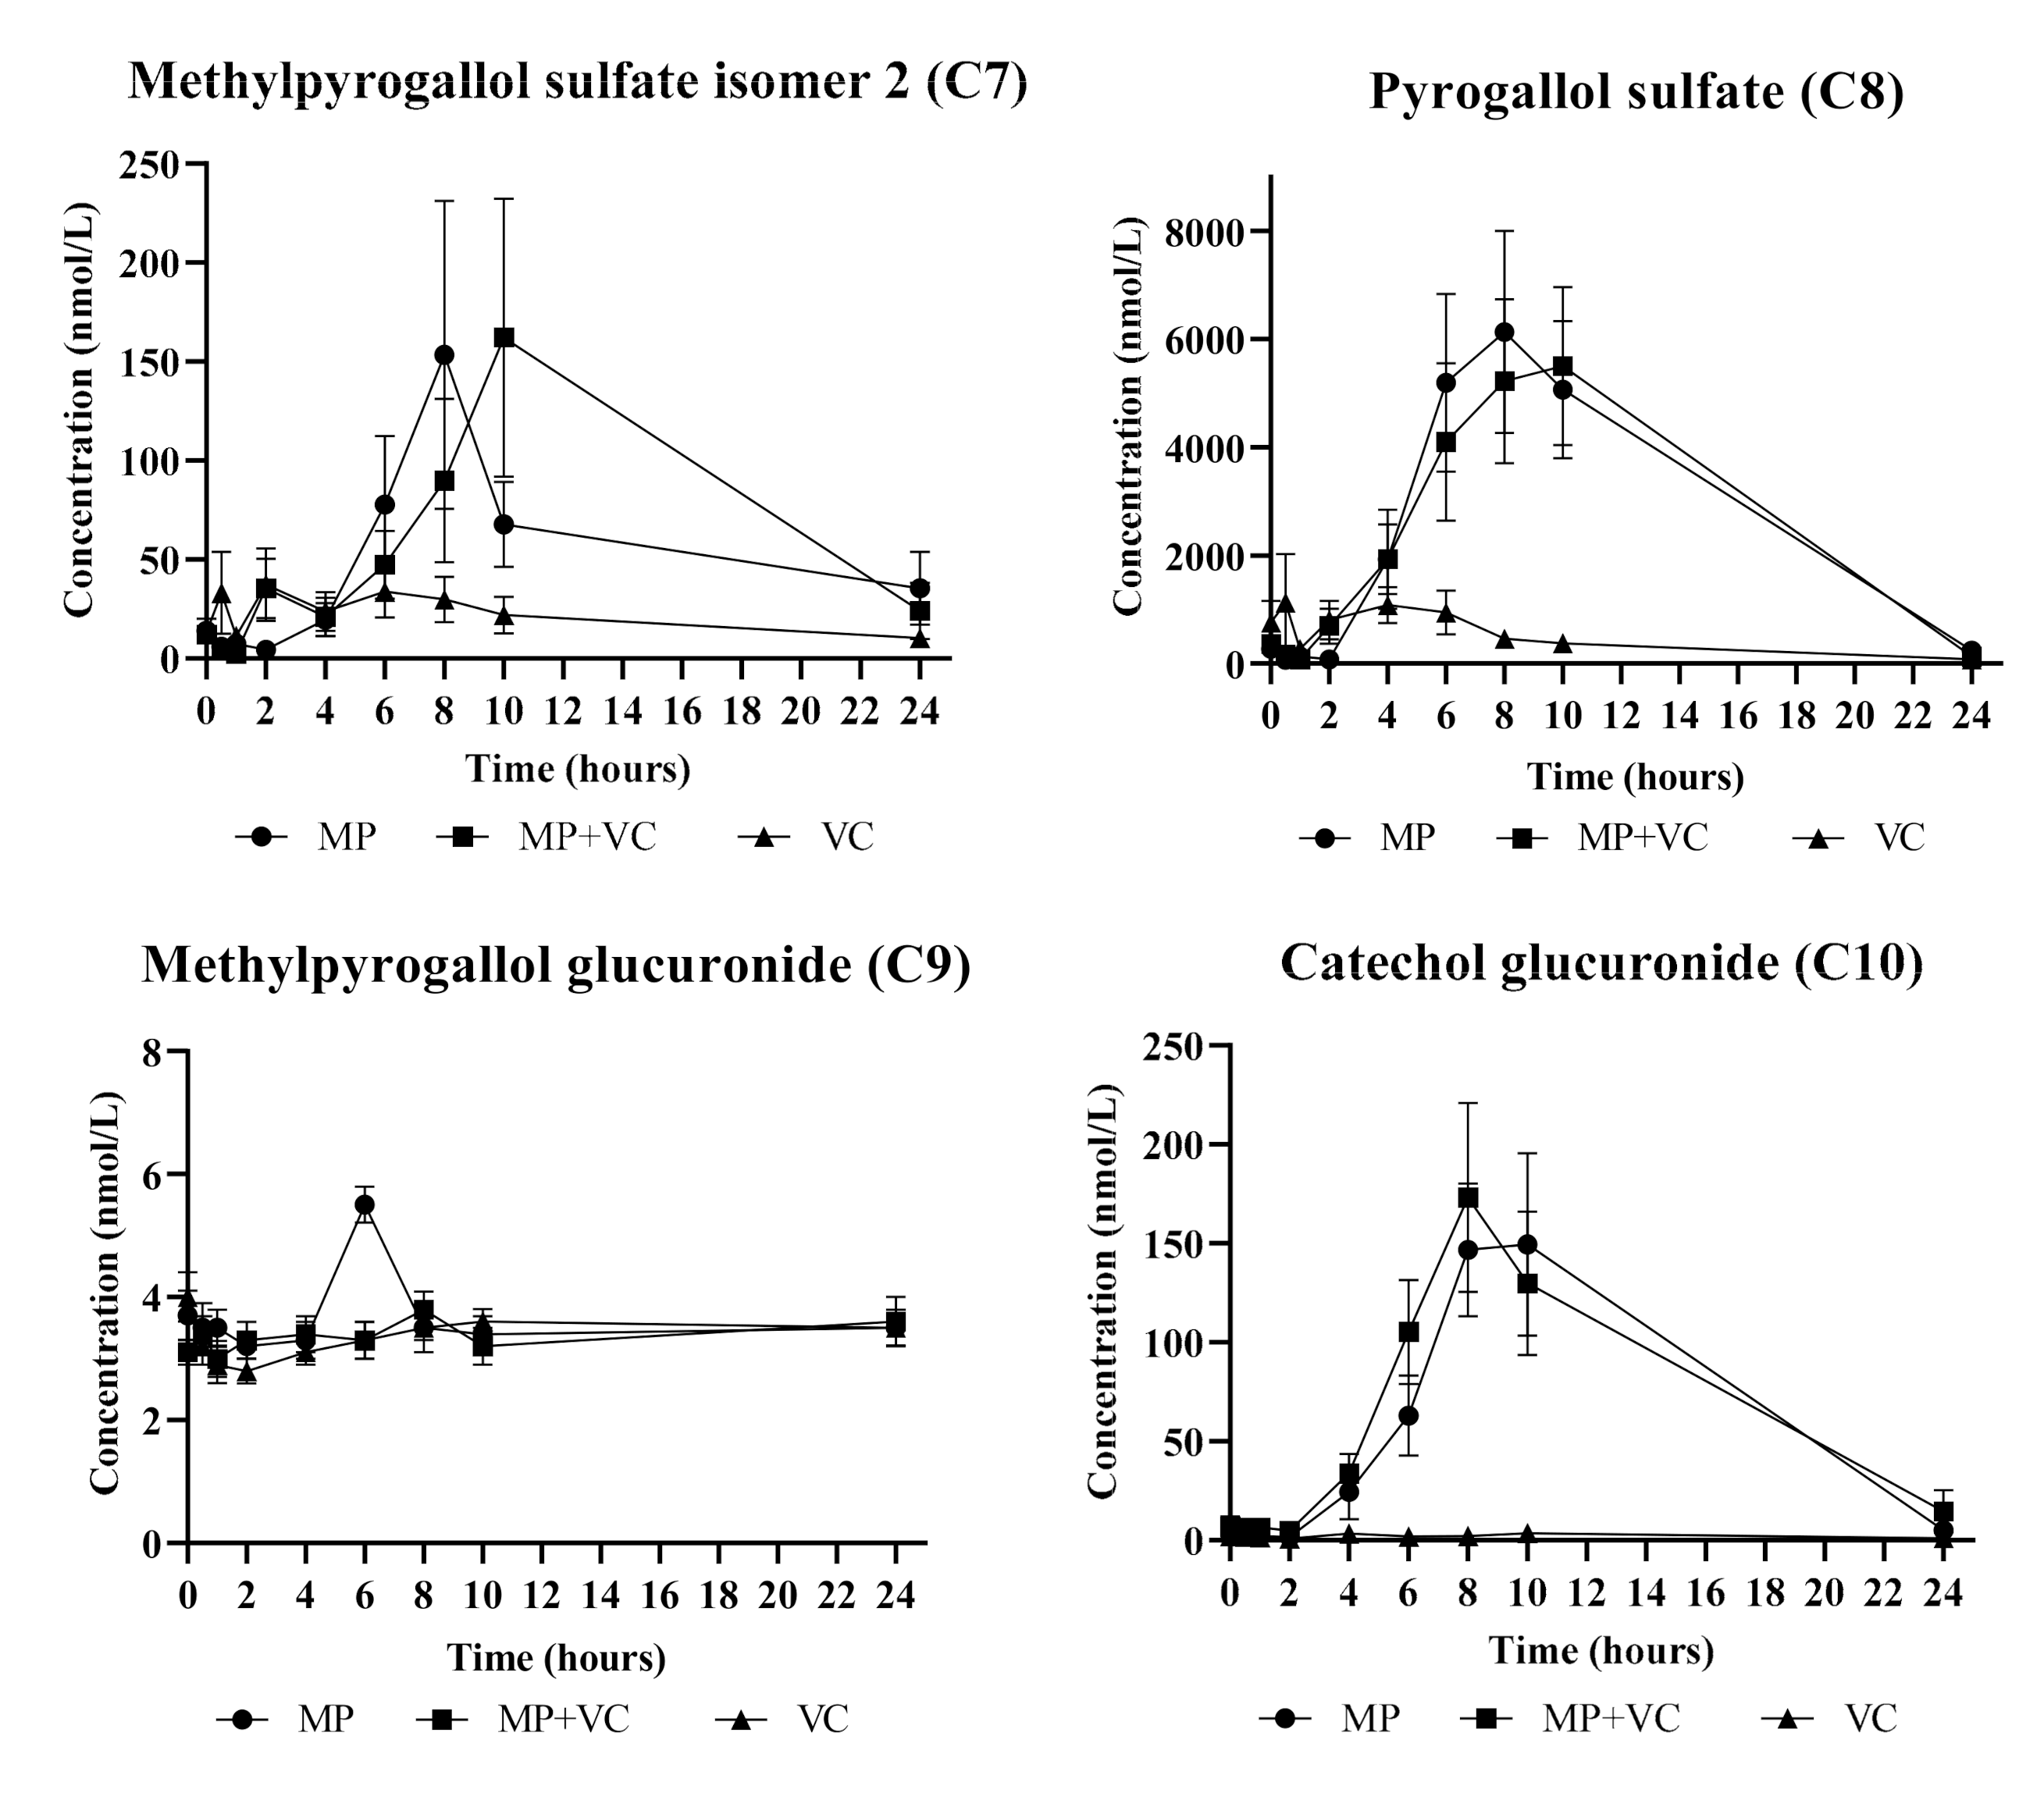
| Methylpyrogallol sulfate isomer (C7) | Cmax (nmol/L) | 243.5 ± 71.8 | 232.8 ± 69.8 | 76.6 ± 24.9 | <0.05 | NS | <0.05 | <0.05 |
| Tmax (h) | 9.8 ± 1.8 | 6.3 ± 1.0 | N/A | NS | N/A | N/A | ||
| AUC0–24h (nmol·h/L) | 375.4 ± 94.3 | 394.6 ± 89.1 | 216.6 ± 54.5 | <0.05 | NS | <0.05 | <0.05 | |
| Pyrogallol sulfate (C8) | Cmax (nmol/L) | 10023.8 ± 1781.1 | 8823.4 ± 1767.4 | 2564.2 ± 893.5 | <0.05 | NS | <0.05 | <0.05 |
| Tmax (h) | 7.3 ± 0.6 | 7.3 ± 0.7 | N/A | NS | N/A | N/A | ||
| AUC0–24h (nmol·h/L) | 18852.1 ± 3491.6 | 17956.9 ± 3093.6 | 5504.9 ± 1763.4 | <0.05 | NS | <0.05 | <0.05 | |
| Methylpyrogallol glucuronide (C9) | Cmax (nmol/L) | 6.7 ± 2.3 | 4.5 ± 0.3 | 4.8 ± 0.3 | F | F | F | F |
| Tmax (h) | 7.2 ± 2.4 | 9.7 ± 2.4 | 8.0 ± 2.3 | NS | N/A | N/A | ||
| AUC0–24h (nmol·h/L) | 29.1 ± 3.0 | 26.7 ± 1.8 | 26.1 ± 1.7 | NS | NS | NS | NS | |
| Catechol glucuronide (C10) | Cmax (nmol/L) | 471.7 ± 270.2 | 185.8 ± 45.8 | 10.6 ± 3.2 | <0.0001 | NS | <0.0001 | <0.0001 |
| Tmax (h) | 8.0 ± 0.6 | 8.3 ± 0.4 | N/A | NS | N/A | N/A | ||
| AUC0–24h (nmol·h/L) | 1830.9 ± 1391.0 | 483.3 ± 108.0 | 44.8 ± 5.1 | <0.0001 | NS | <0.0001 | <0.0001 | |
| 0 h | 24 h | Day 15 | |
|---|---|---|---|
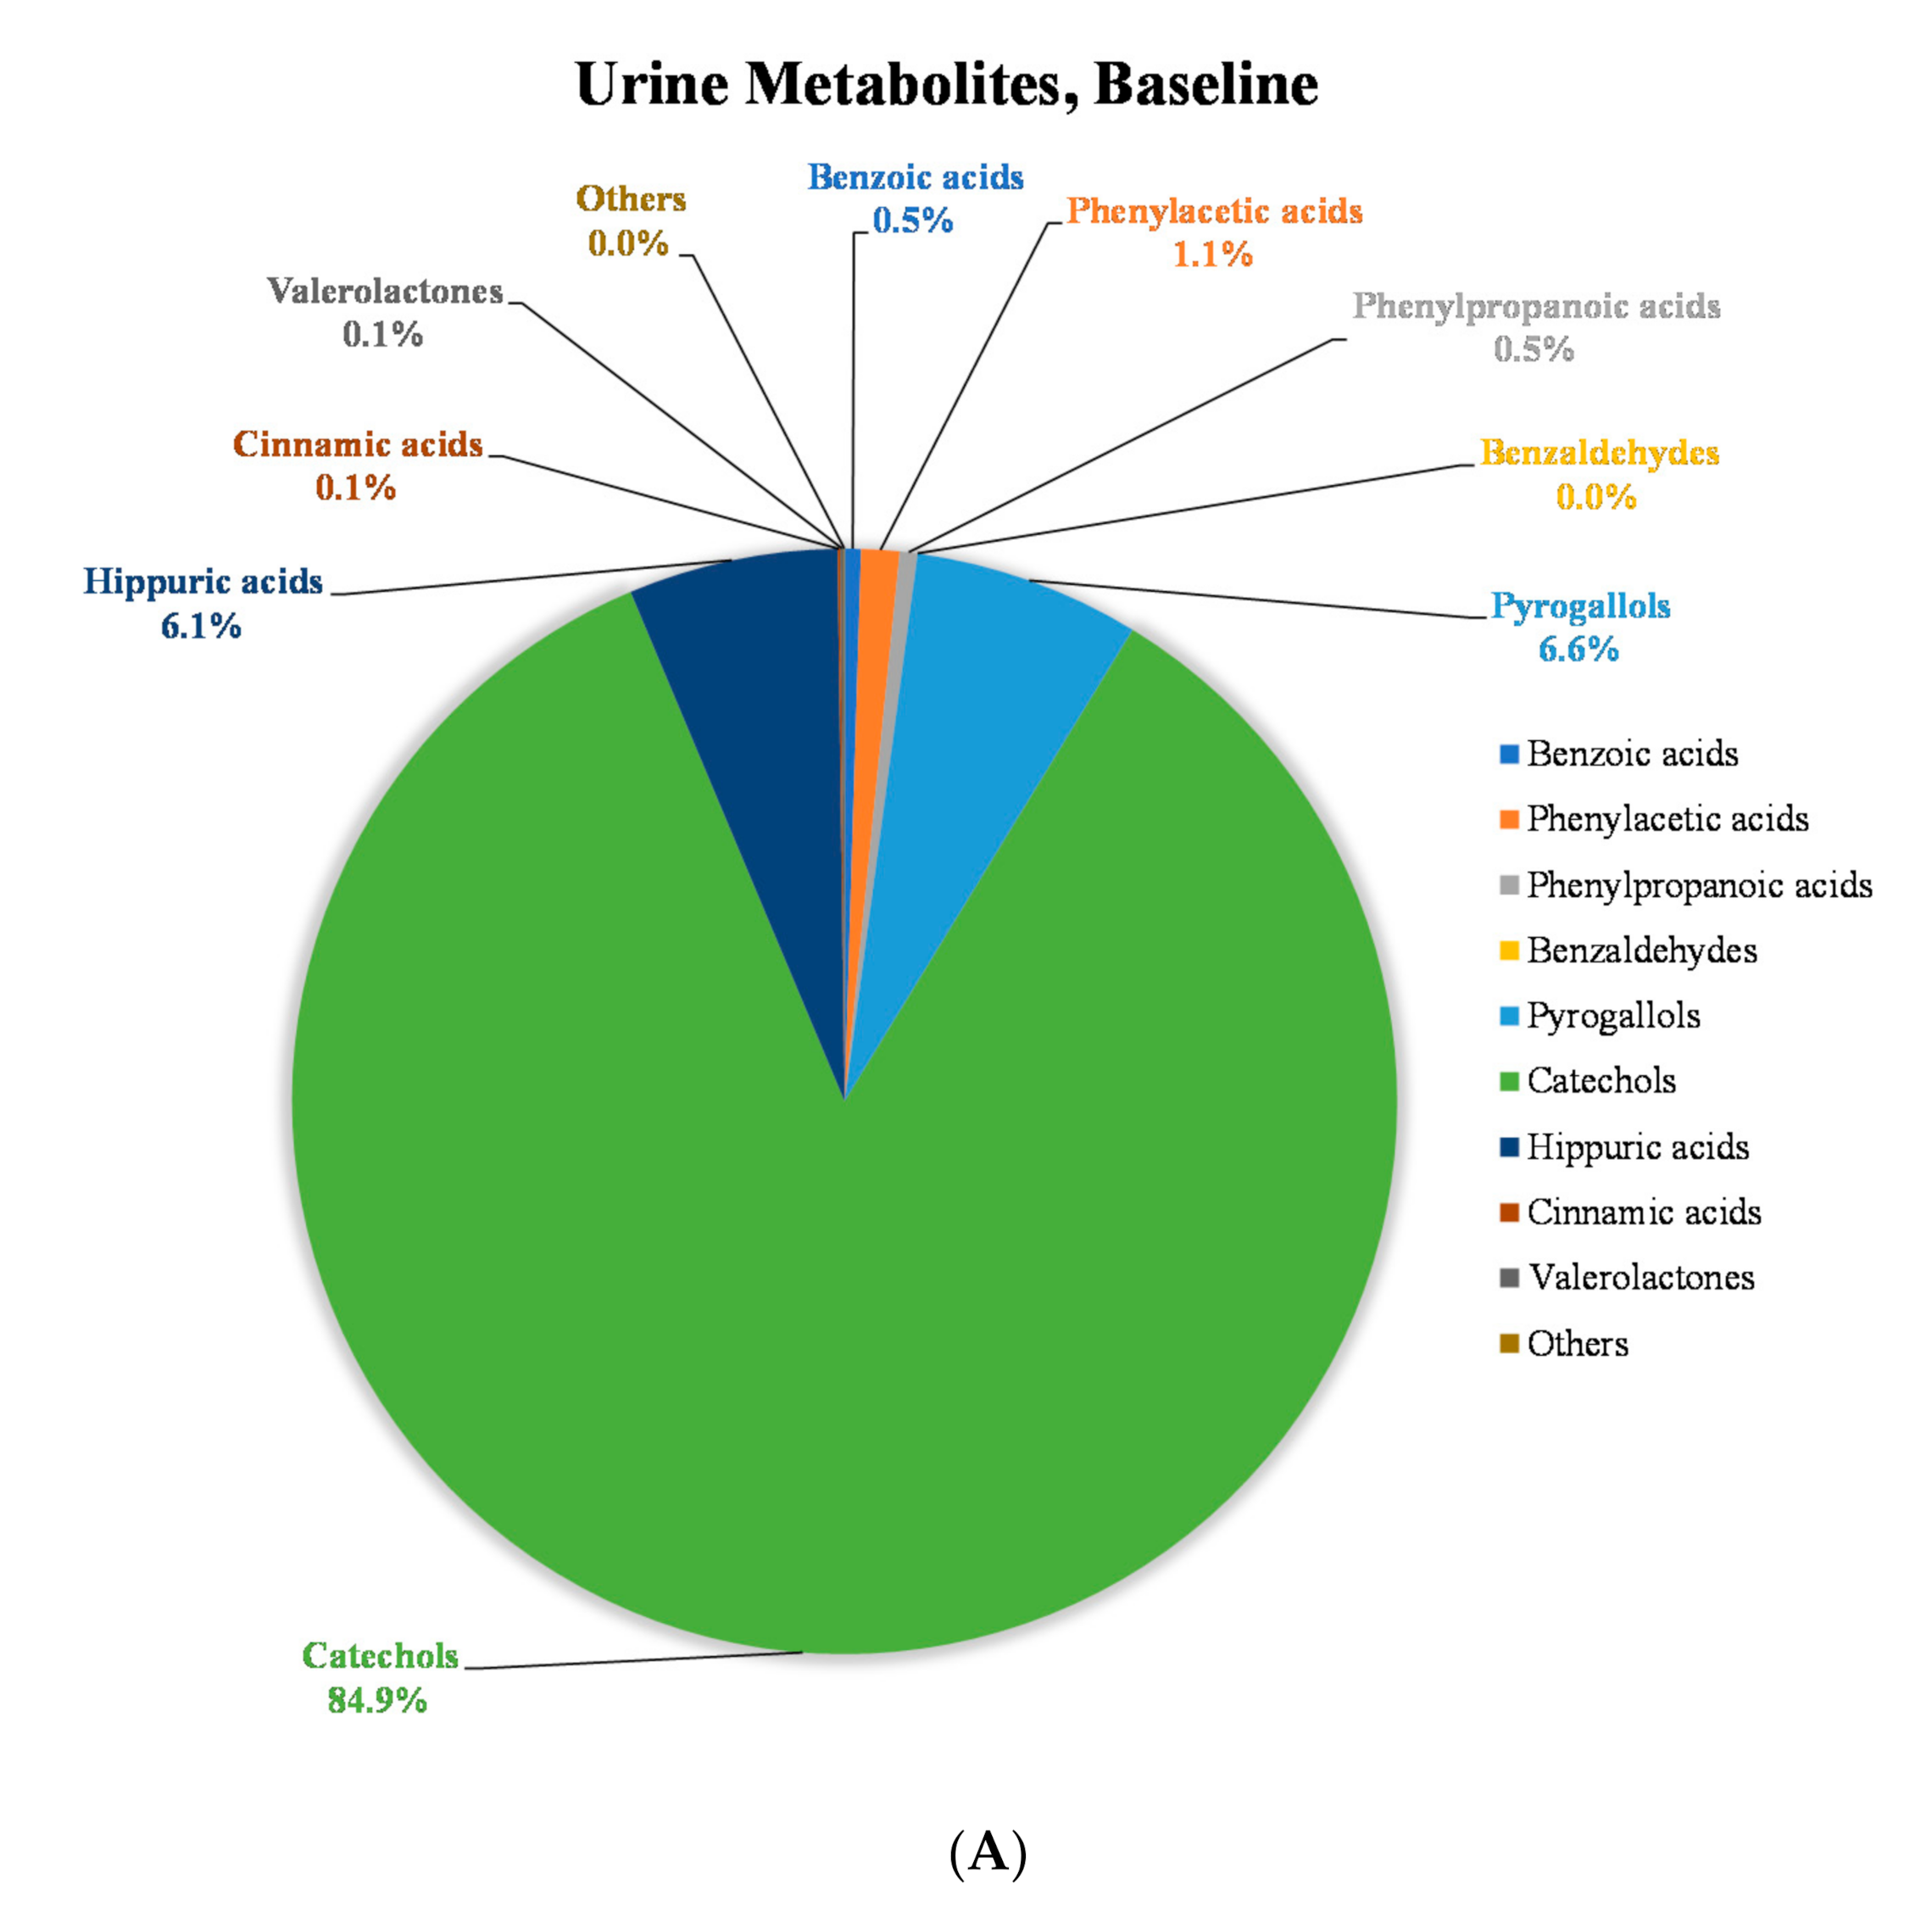
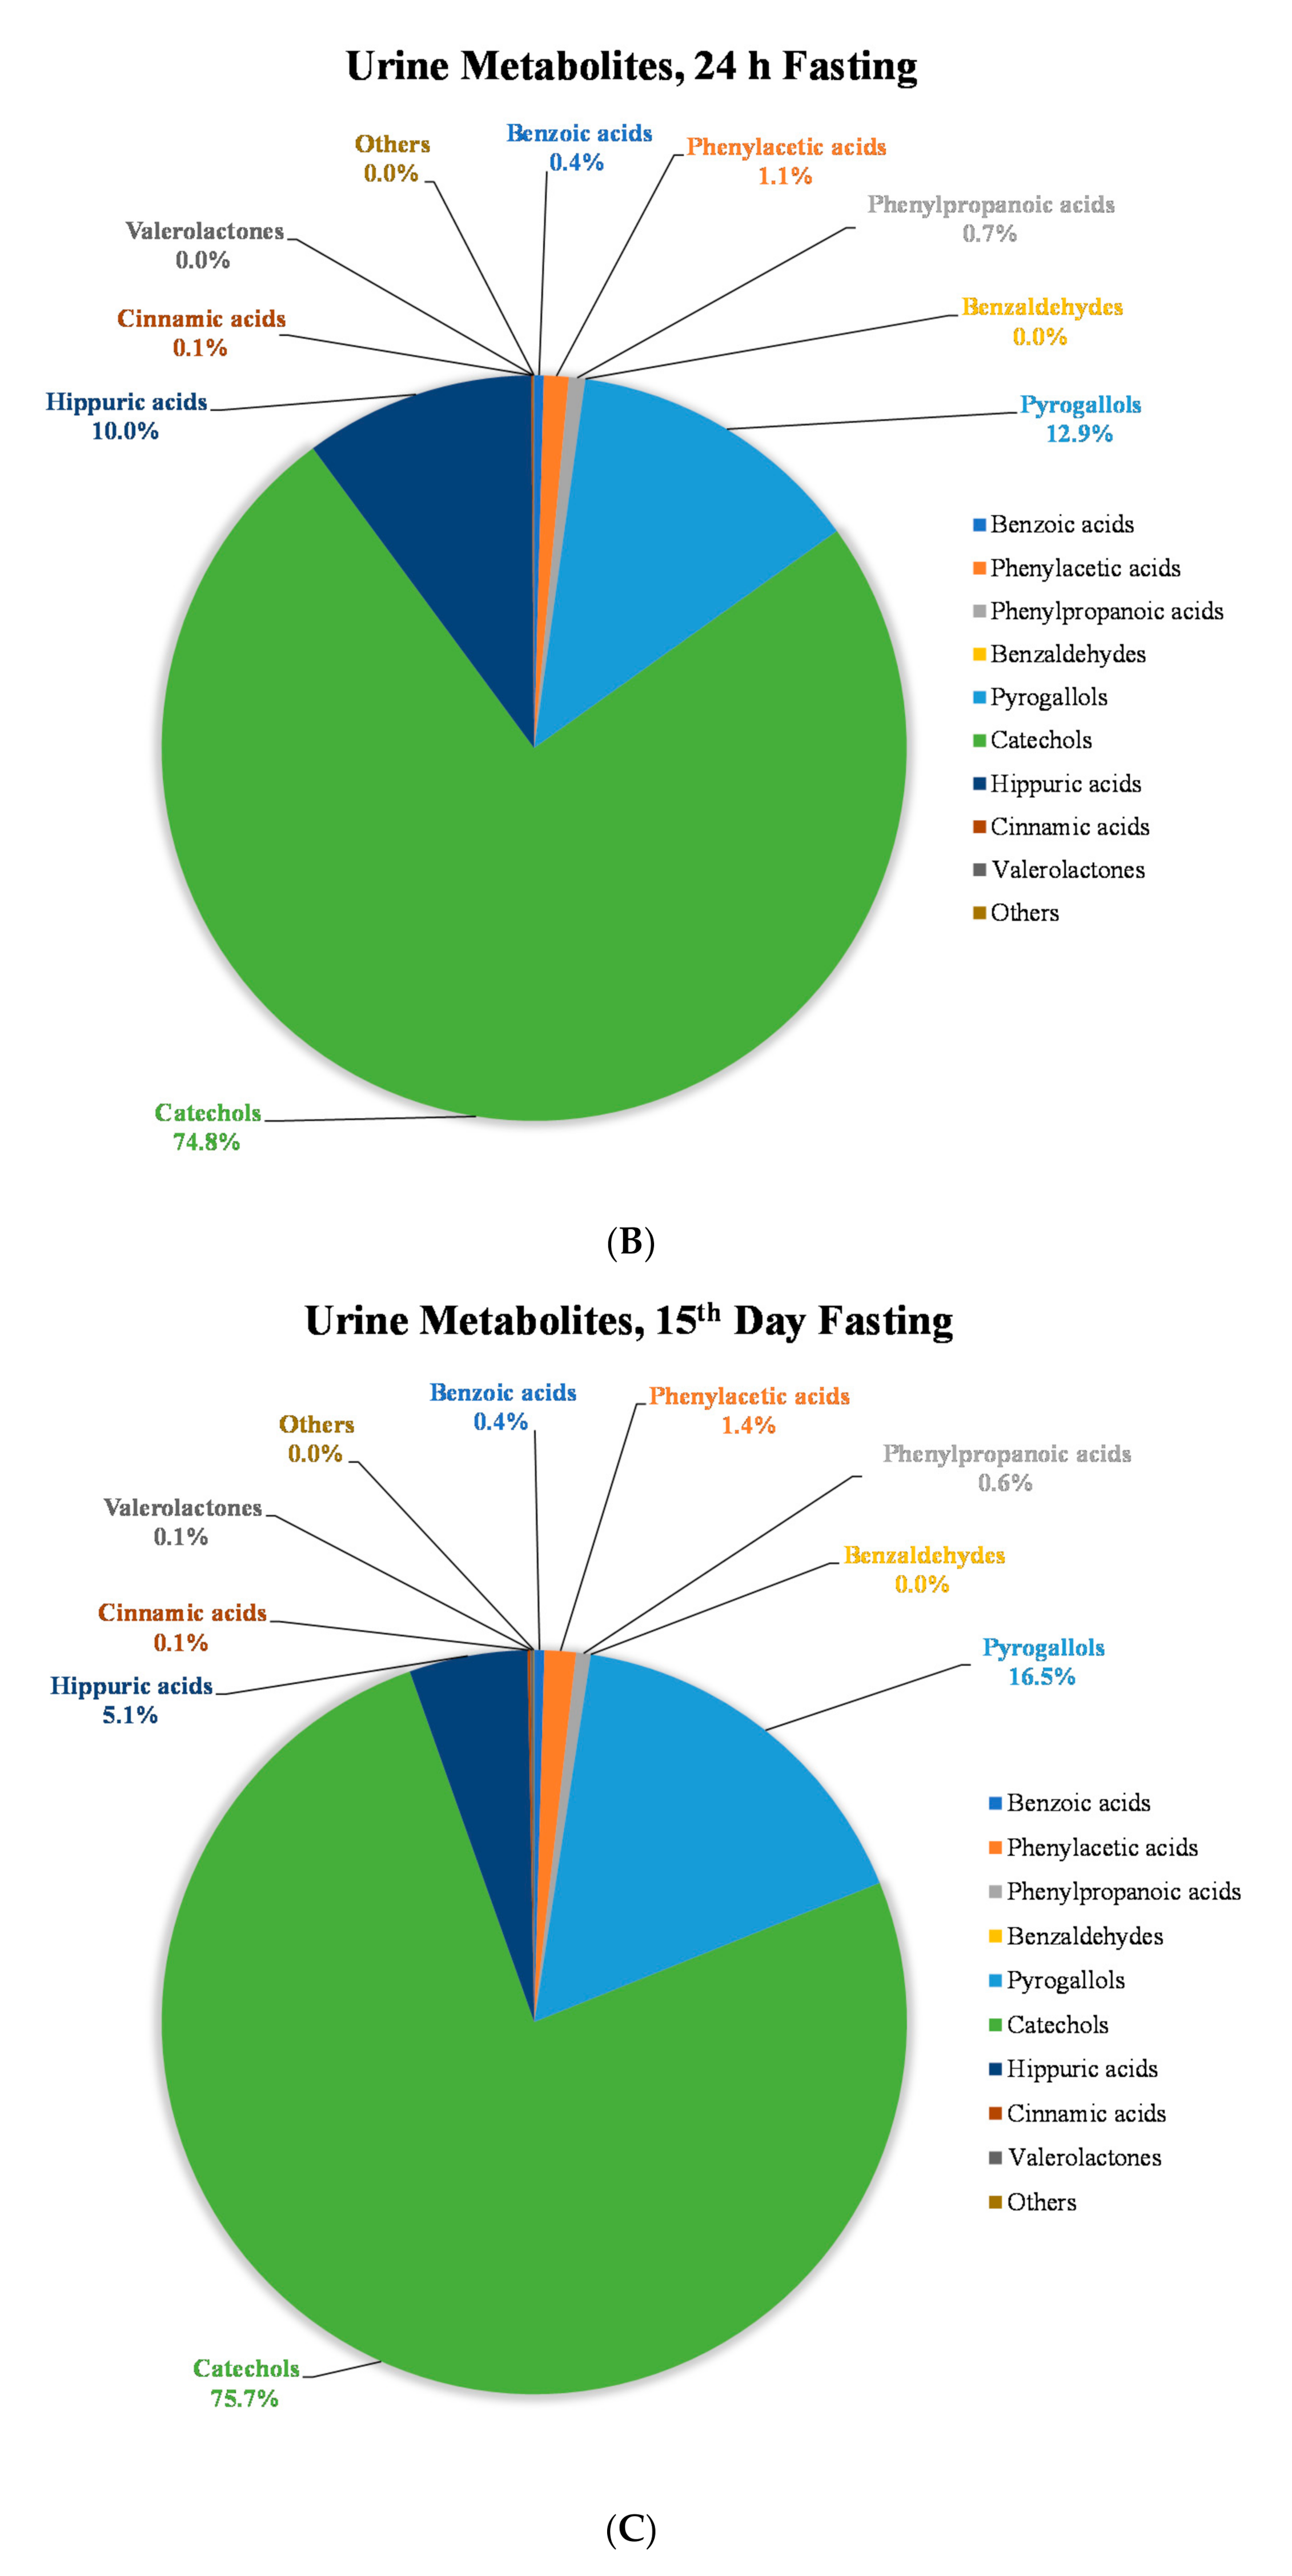
| Benzoic acid derivatives | 47 | 49 | 65 |
| Phenylacetic acid derivatives | 59 | 51 | 71 |
| Phenylpropanoic acid derivatives | 48 | 57 | 76 |
| Benzaldehyde derivatives | 217 | 98 | 57 |
| Pyrogallol derivatives | 179 | 74 | 81 |
| Catechol derivatives | 182 | 64 | 73 |
| Hippuric acid derivatives | 61 | 50 | 36 |
| Cinnamic acid derivatives | 68 | 38 | 136 |
| Valerolactone derivatives | 112 | 117 | 112 |
| Others | 85 | 47 | 51 |
| Total polyphenols | 172 | 64 | 72 |
| Variable | Acute Trial (n = 13) | 14-Day Feeding Trial (n = 12) |
|---|---|---|
| Age (year) | 30 ± 2 | 31 ± 2 |
| Height (cm) | 169.5 ± 2.1 | 169.4 ± 2.2 |
| Weight (kg) | 64.9 ± 1.9 | 65.0 ± 2.0 |
| BMI (kgm−2) | 22.7 ± 0.4 | 22.7 ± 0.5 |
| Heart rate (beats per minute) | 68 ± 2 | 69 ± 2 |
| Systolic blood pressure (mmHg) | 115 ± 2 | 115 ± 2 |
| Diastolic blood pressure (mmHg) | 73 ± 2 | 74 ± 2 |
| Mid-point waist circumference (cm) | 78.8 ± 1.1 | 78.8 ± 1.2 |
| Male:Female | 7:6 | 6:6 |
Publisher’s Note: MDPI stays neutral with regard to jurisdictional claims in published maps and institutional affiliations. |
© 2020 by the authors. Licensee MDPI, Basel, Switzerland. This article is an open access article distributed under the terms and conditions of the Creative Commons Attribution (CC BY) license (http://creativecommons.org/licenses/by/4.0/).
Share and Cite
Fan, J.; Xiao, D.; Zhang, L.; Edirisinghe, I.; Burton-Freeman, B.; Sandhu, A.K. Pharmacokinetic Characterization of (Poly)phenolic Metabolites in Human Plasma and Urine after Acute and Short-Term Daily Consumption of Mango Pulp. Molecules 2020, 25, 5522. https://doi.org/10.3390/molecules25235522
Fan J, Xiao D, Zhang L, Edirisinghe I, Burton-Freeman B, Sandhu AK. Pharmacokinetic Characterization of (Poly)phenolic Metabolites in Human Plasma and Urine after Acute and Short-Term Daily Consumption of Mango Pulp. Molecules. 2020; 25(23):5522. https://doi.org/10.3390/molecules25235522
Chicago/Turabian StyleFan, Jiayi, Di Xiao, Liyun Zhang, Indika Edirisinghe, Britt Burton-Freeman, and Amandeep K. Sandhu. 2020. "Pharmacokinetic Characterization of (Poly)phenolic Metabolites in Human Plasma and Urine after Acute and Short-Term Daily Consumption of Mango Pulp" Molecules 25, no. 23: 5522. https://doi.org/10.3390/molecules25235522