How Different Substitution Positions of F, Cl Atoms in Benzene Ring of 5-Methylpyrimidine Pyridine Derivatives Affect the Inhibition Ability of EGFRL858R/T790M/C797S Inhibitors: A Molecular Dynamics Simulation Study

 ,
,
Abstract
:1. Introduction
2. Results and Discussion
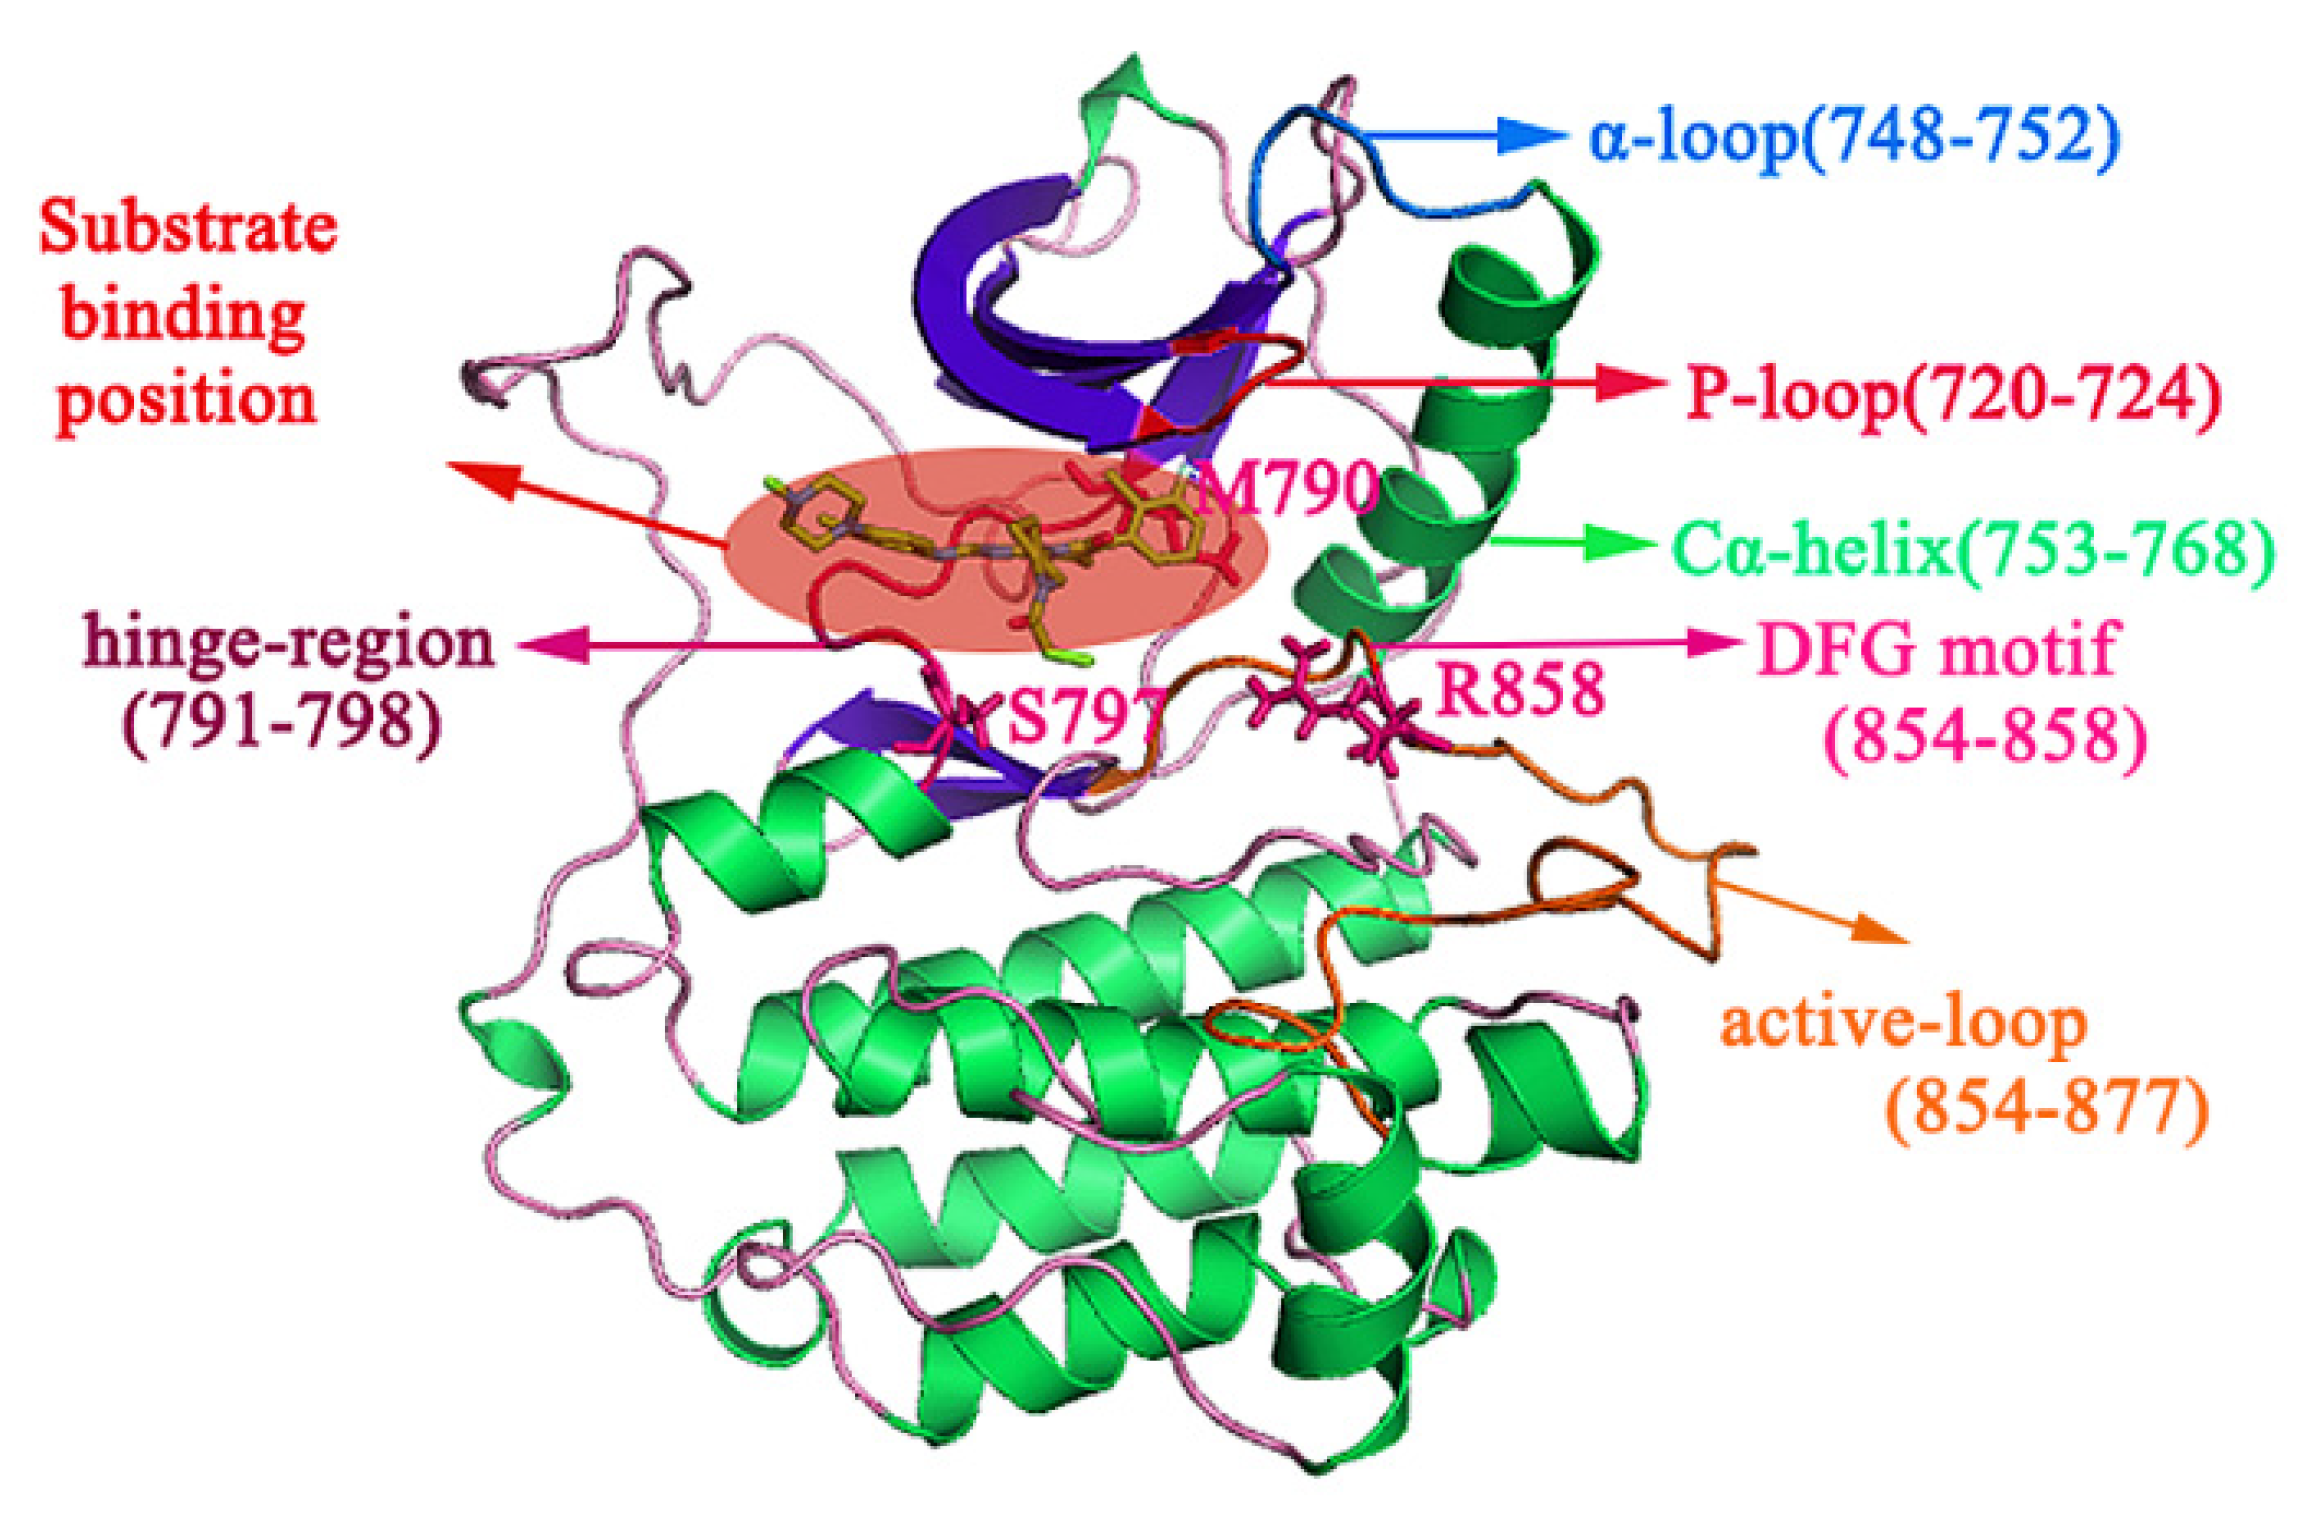
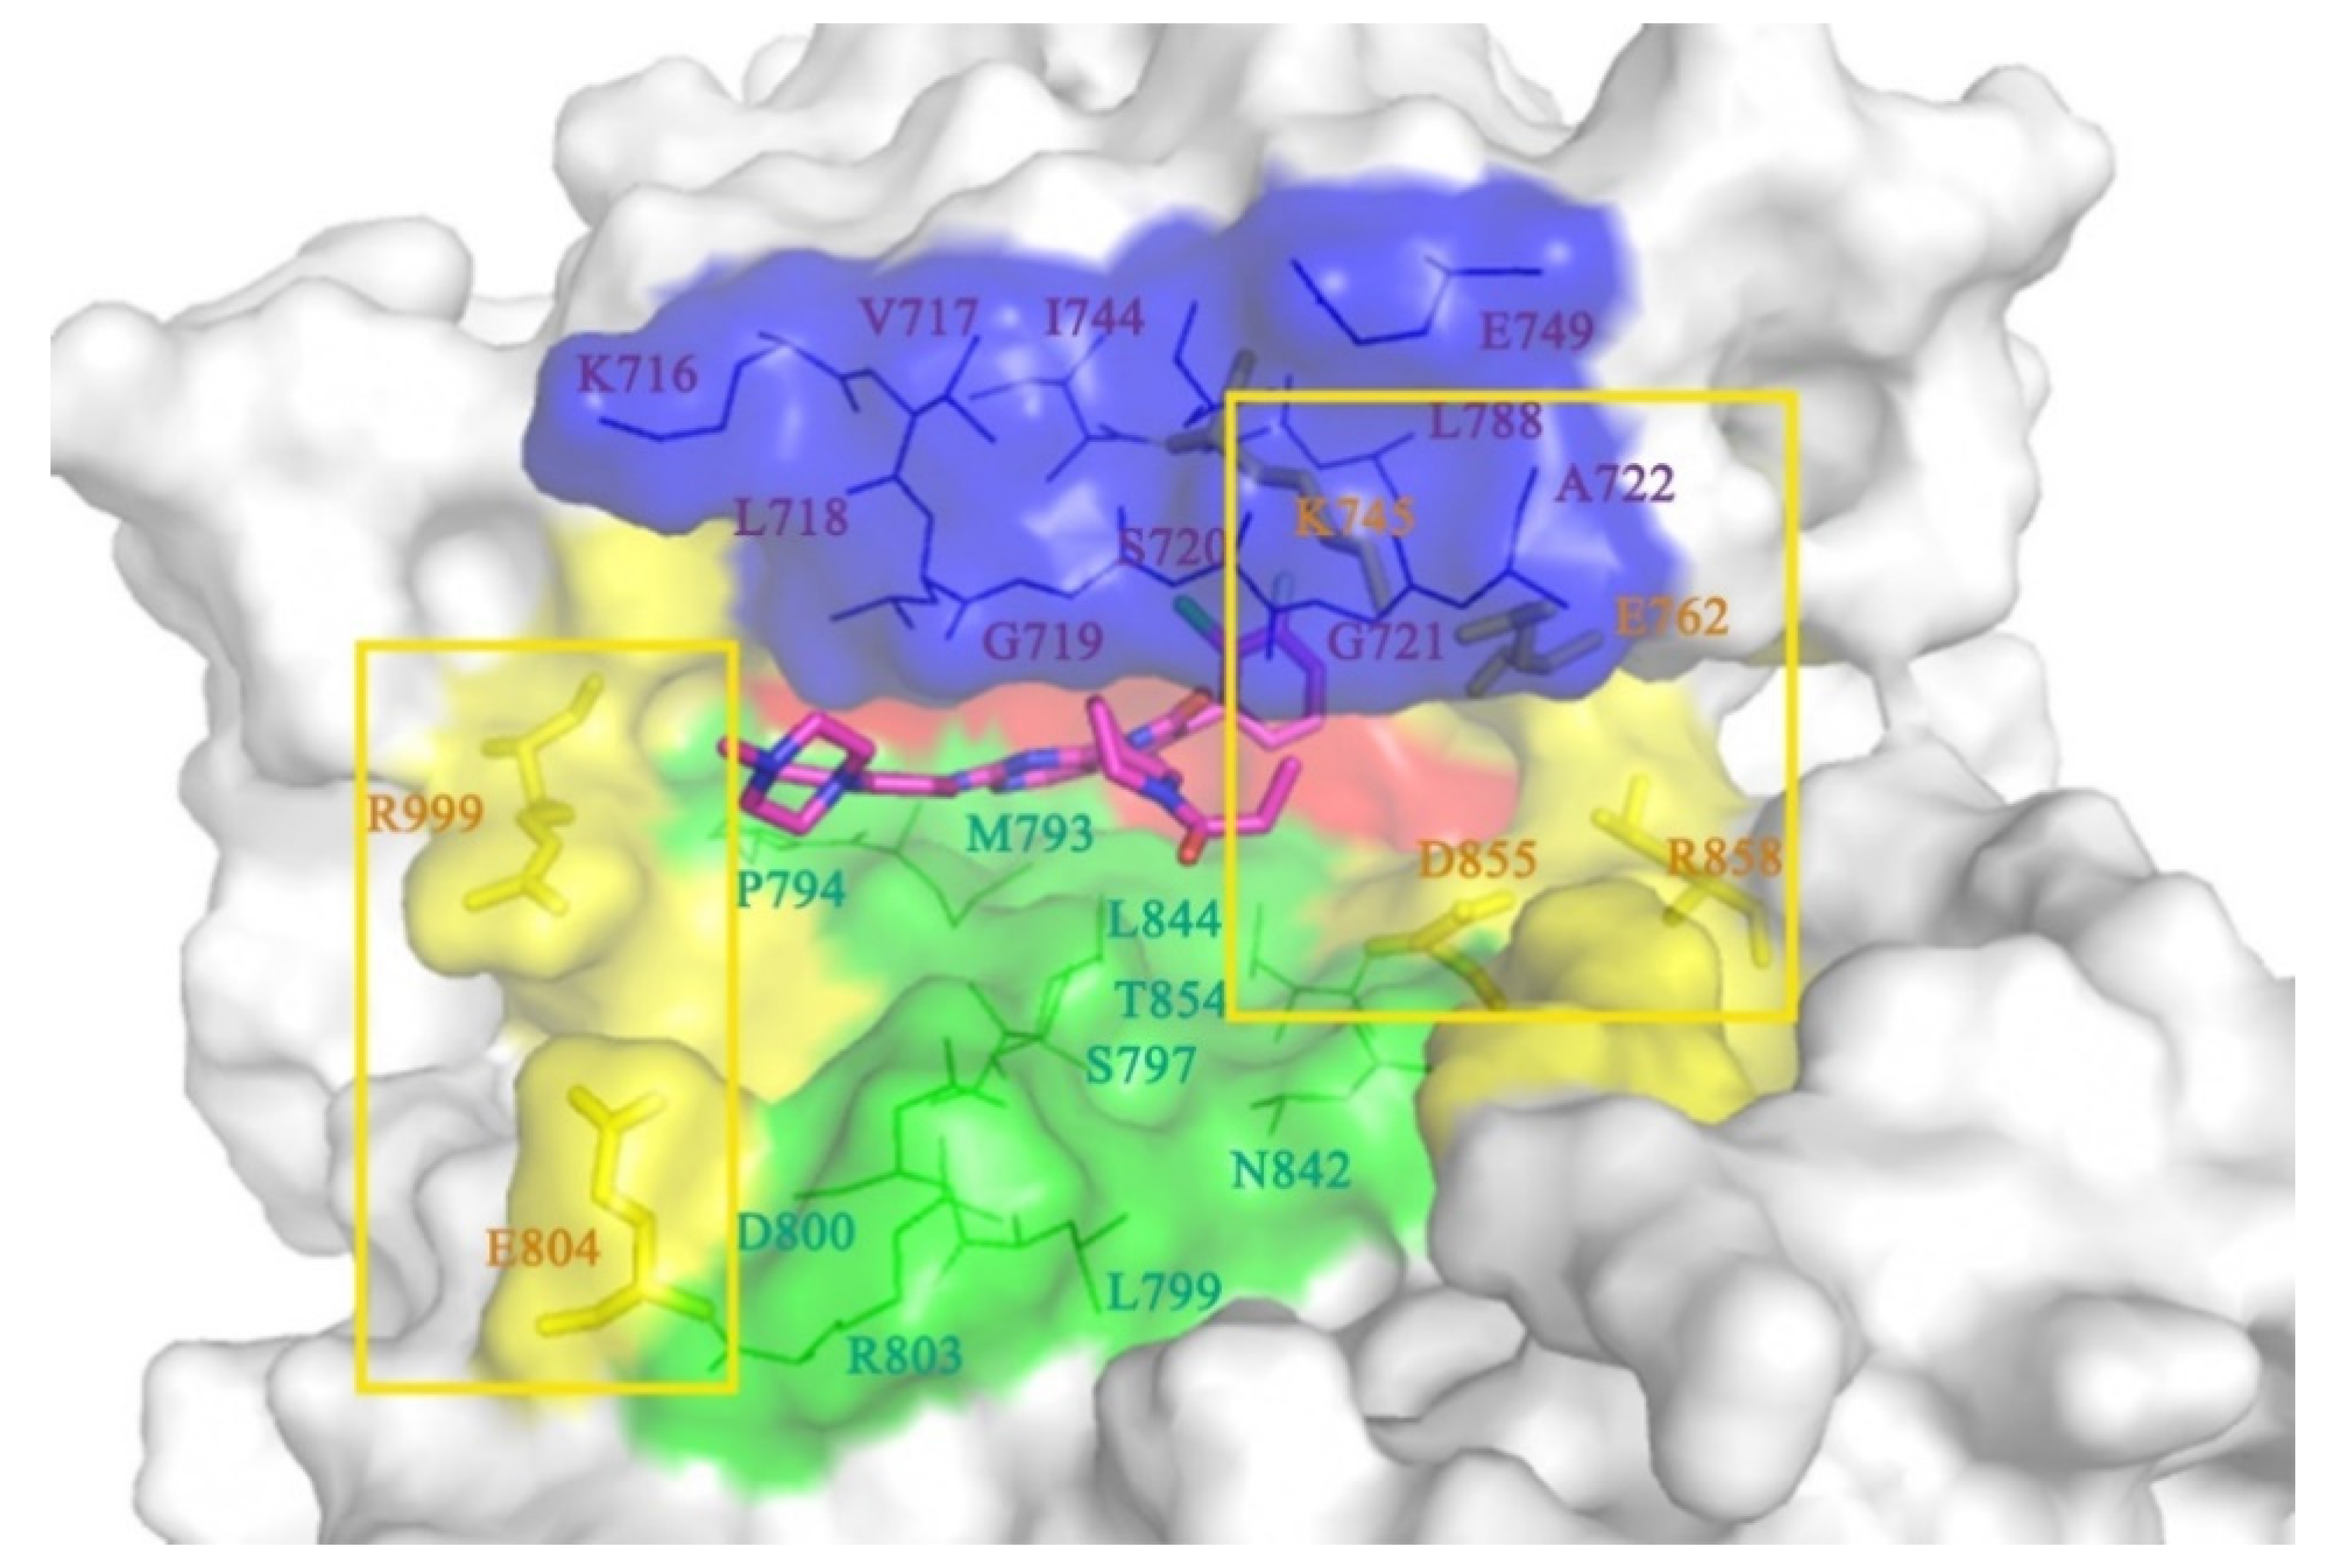
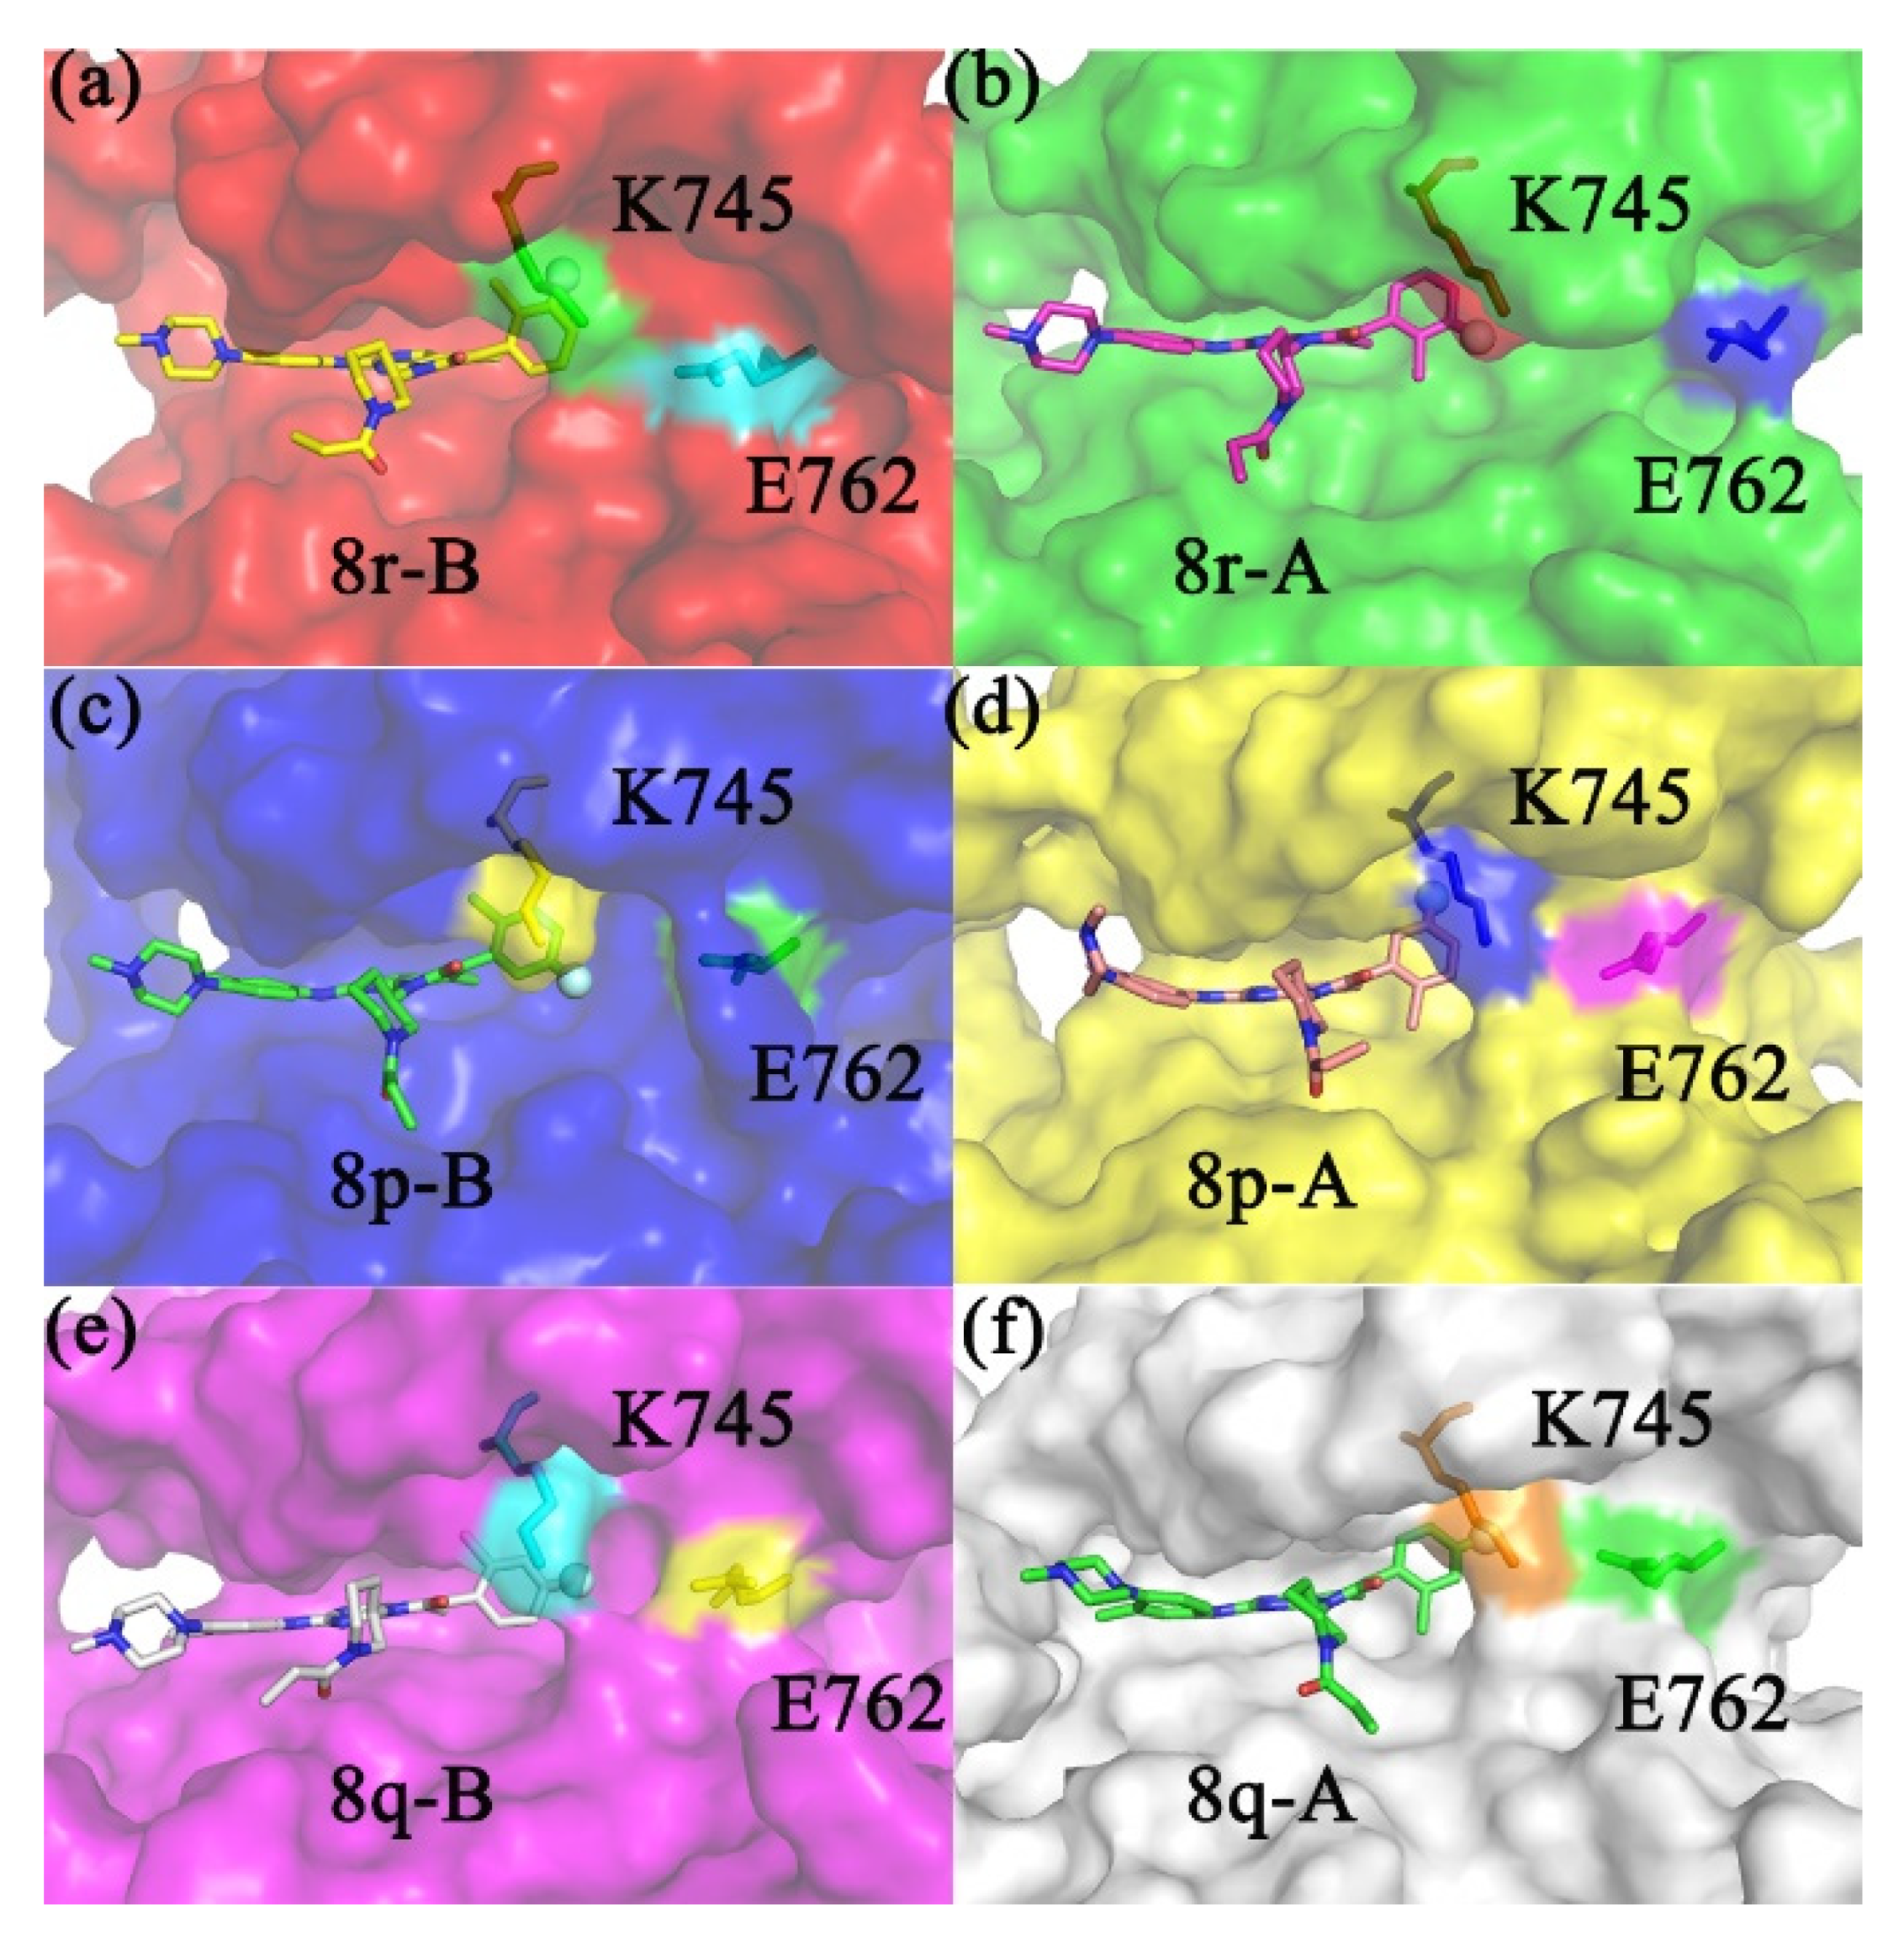
2.1. The Binding Conformations Analysis
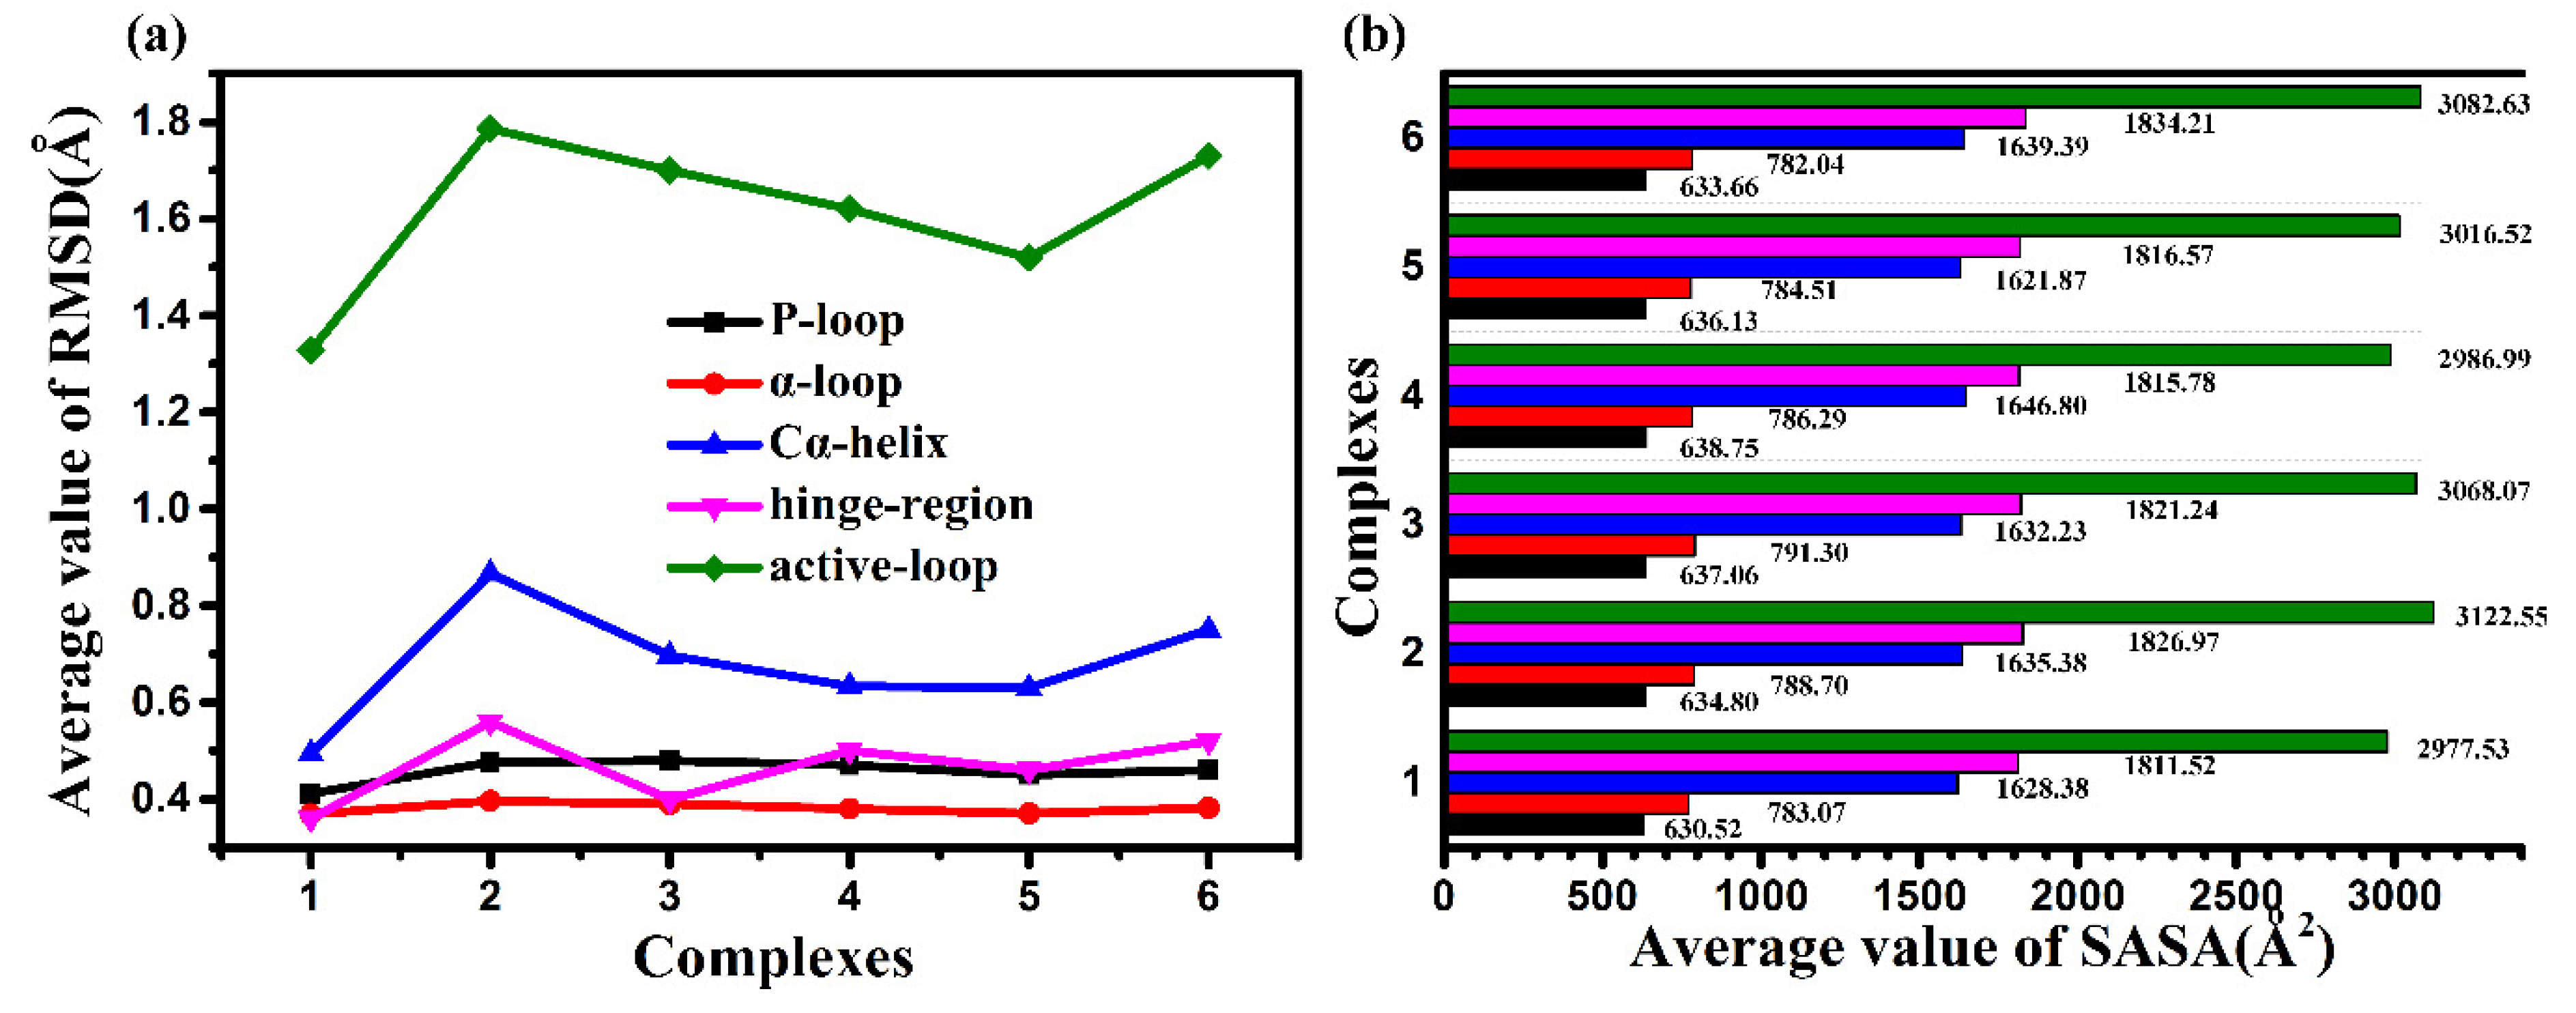
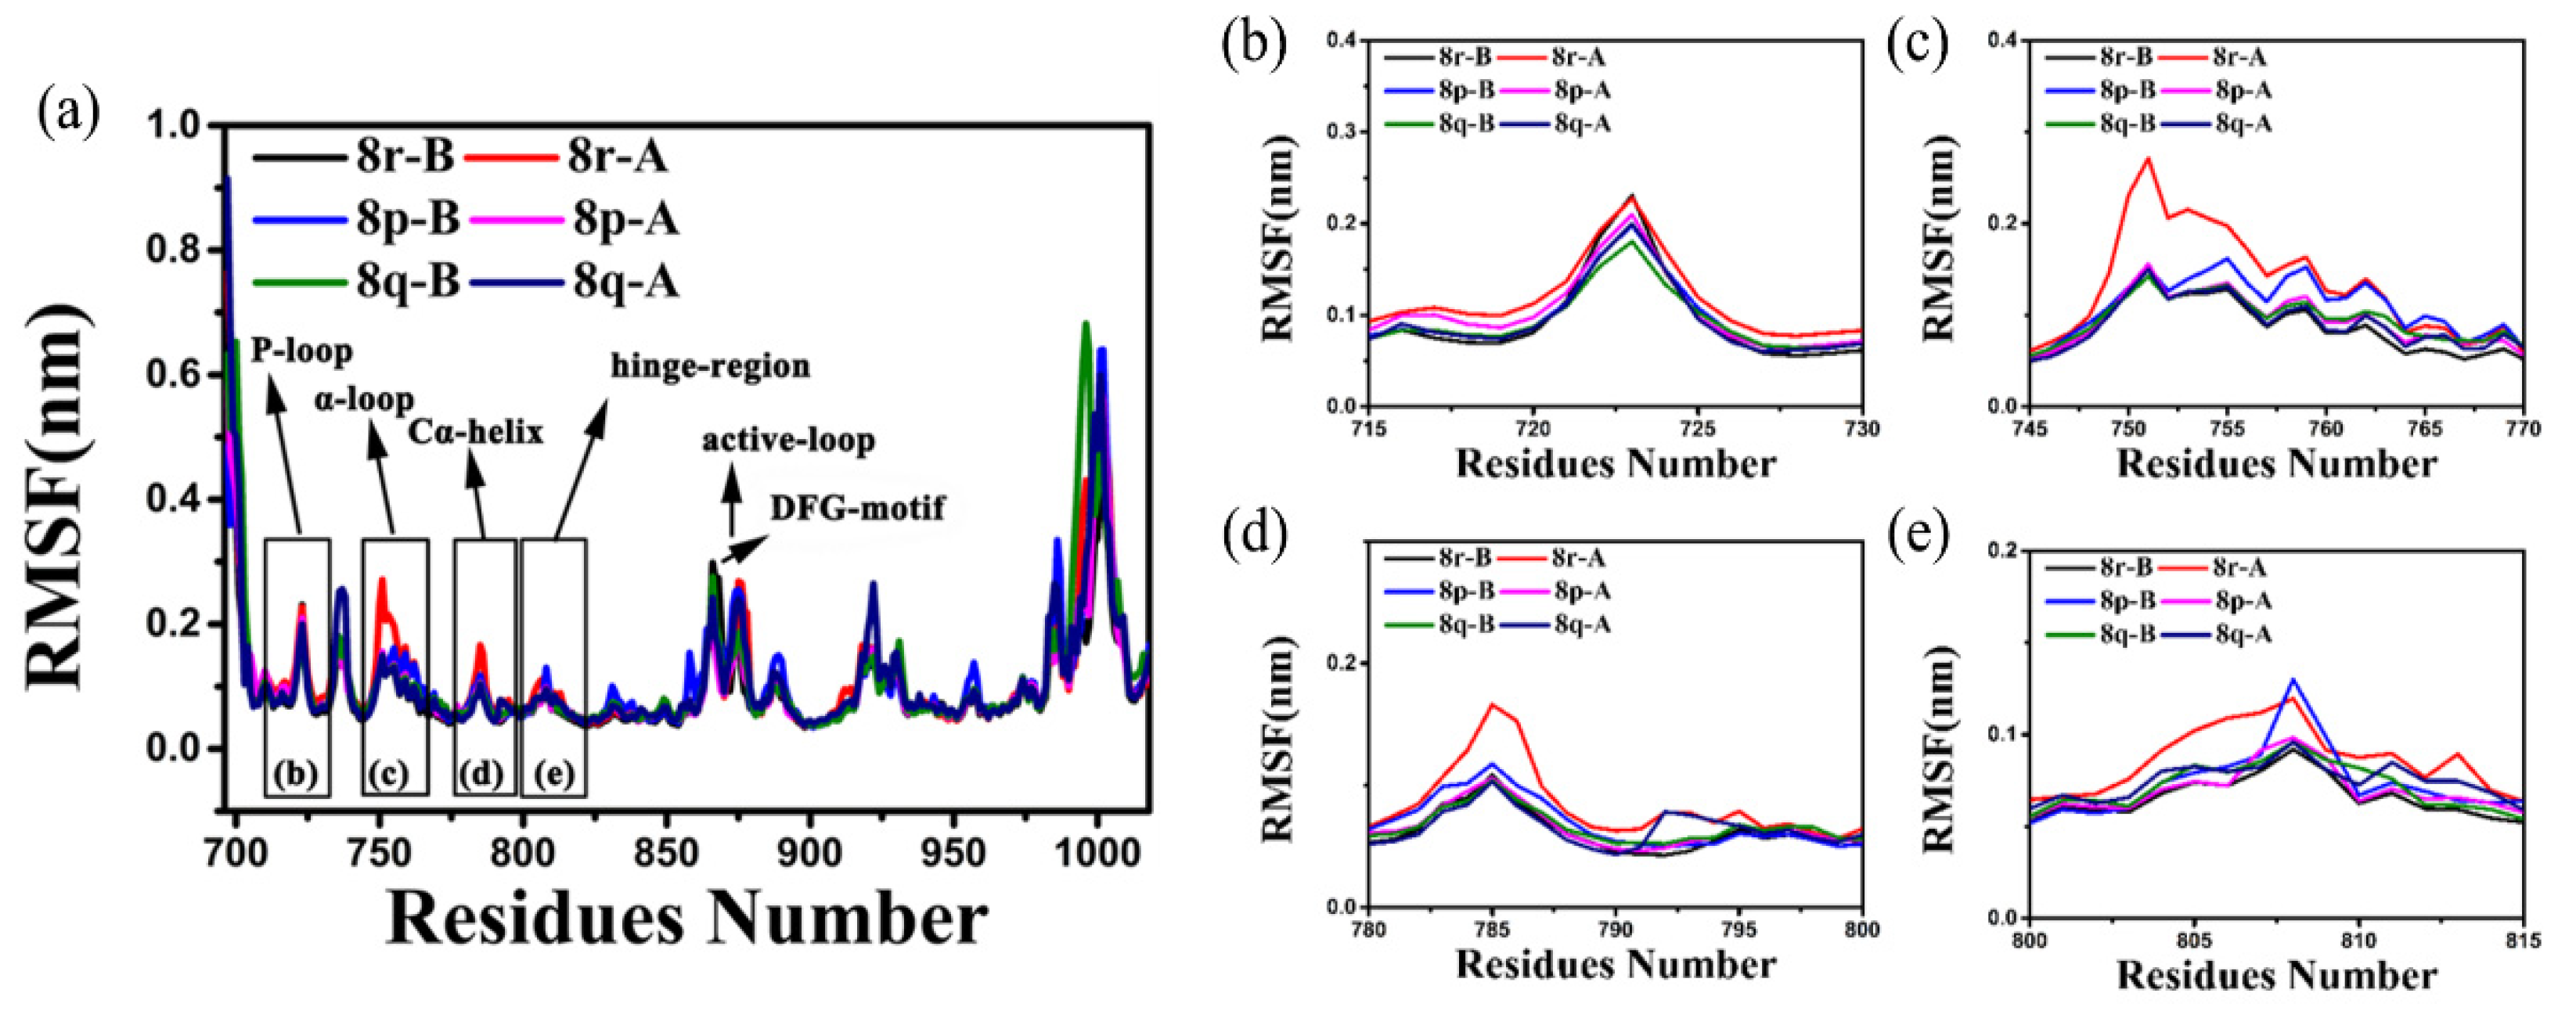
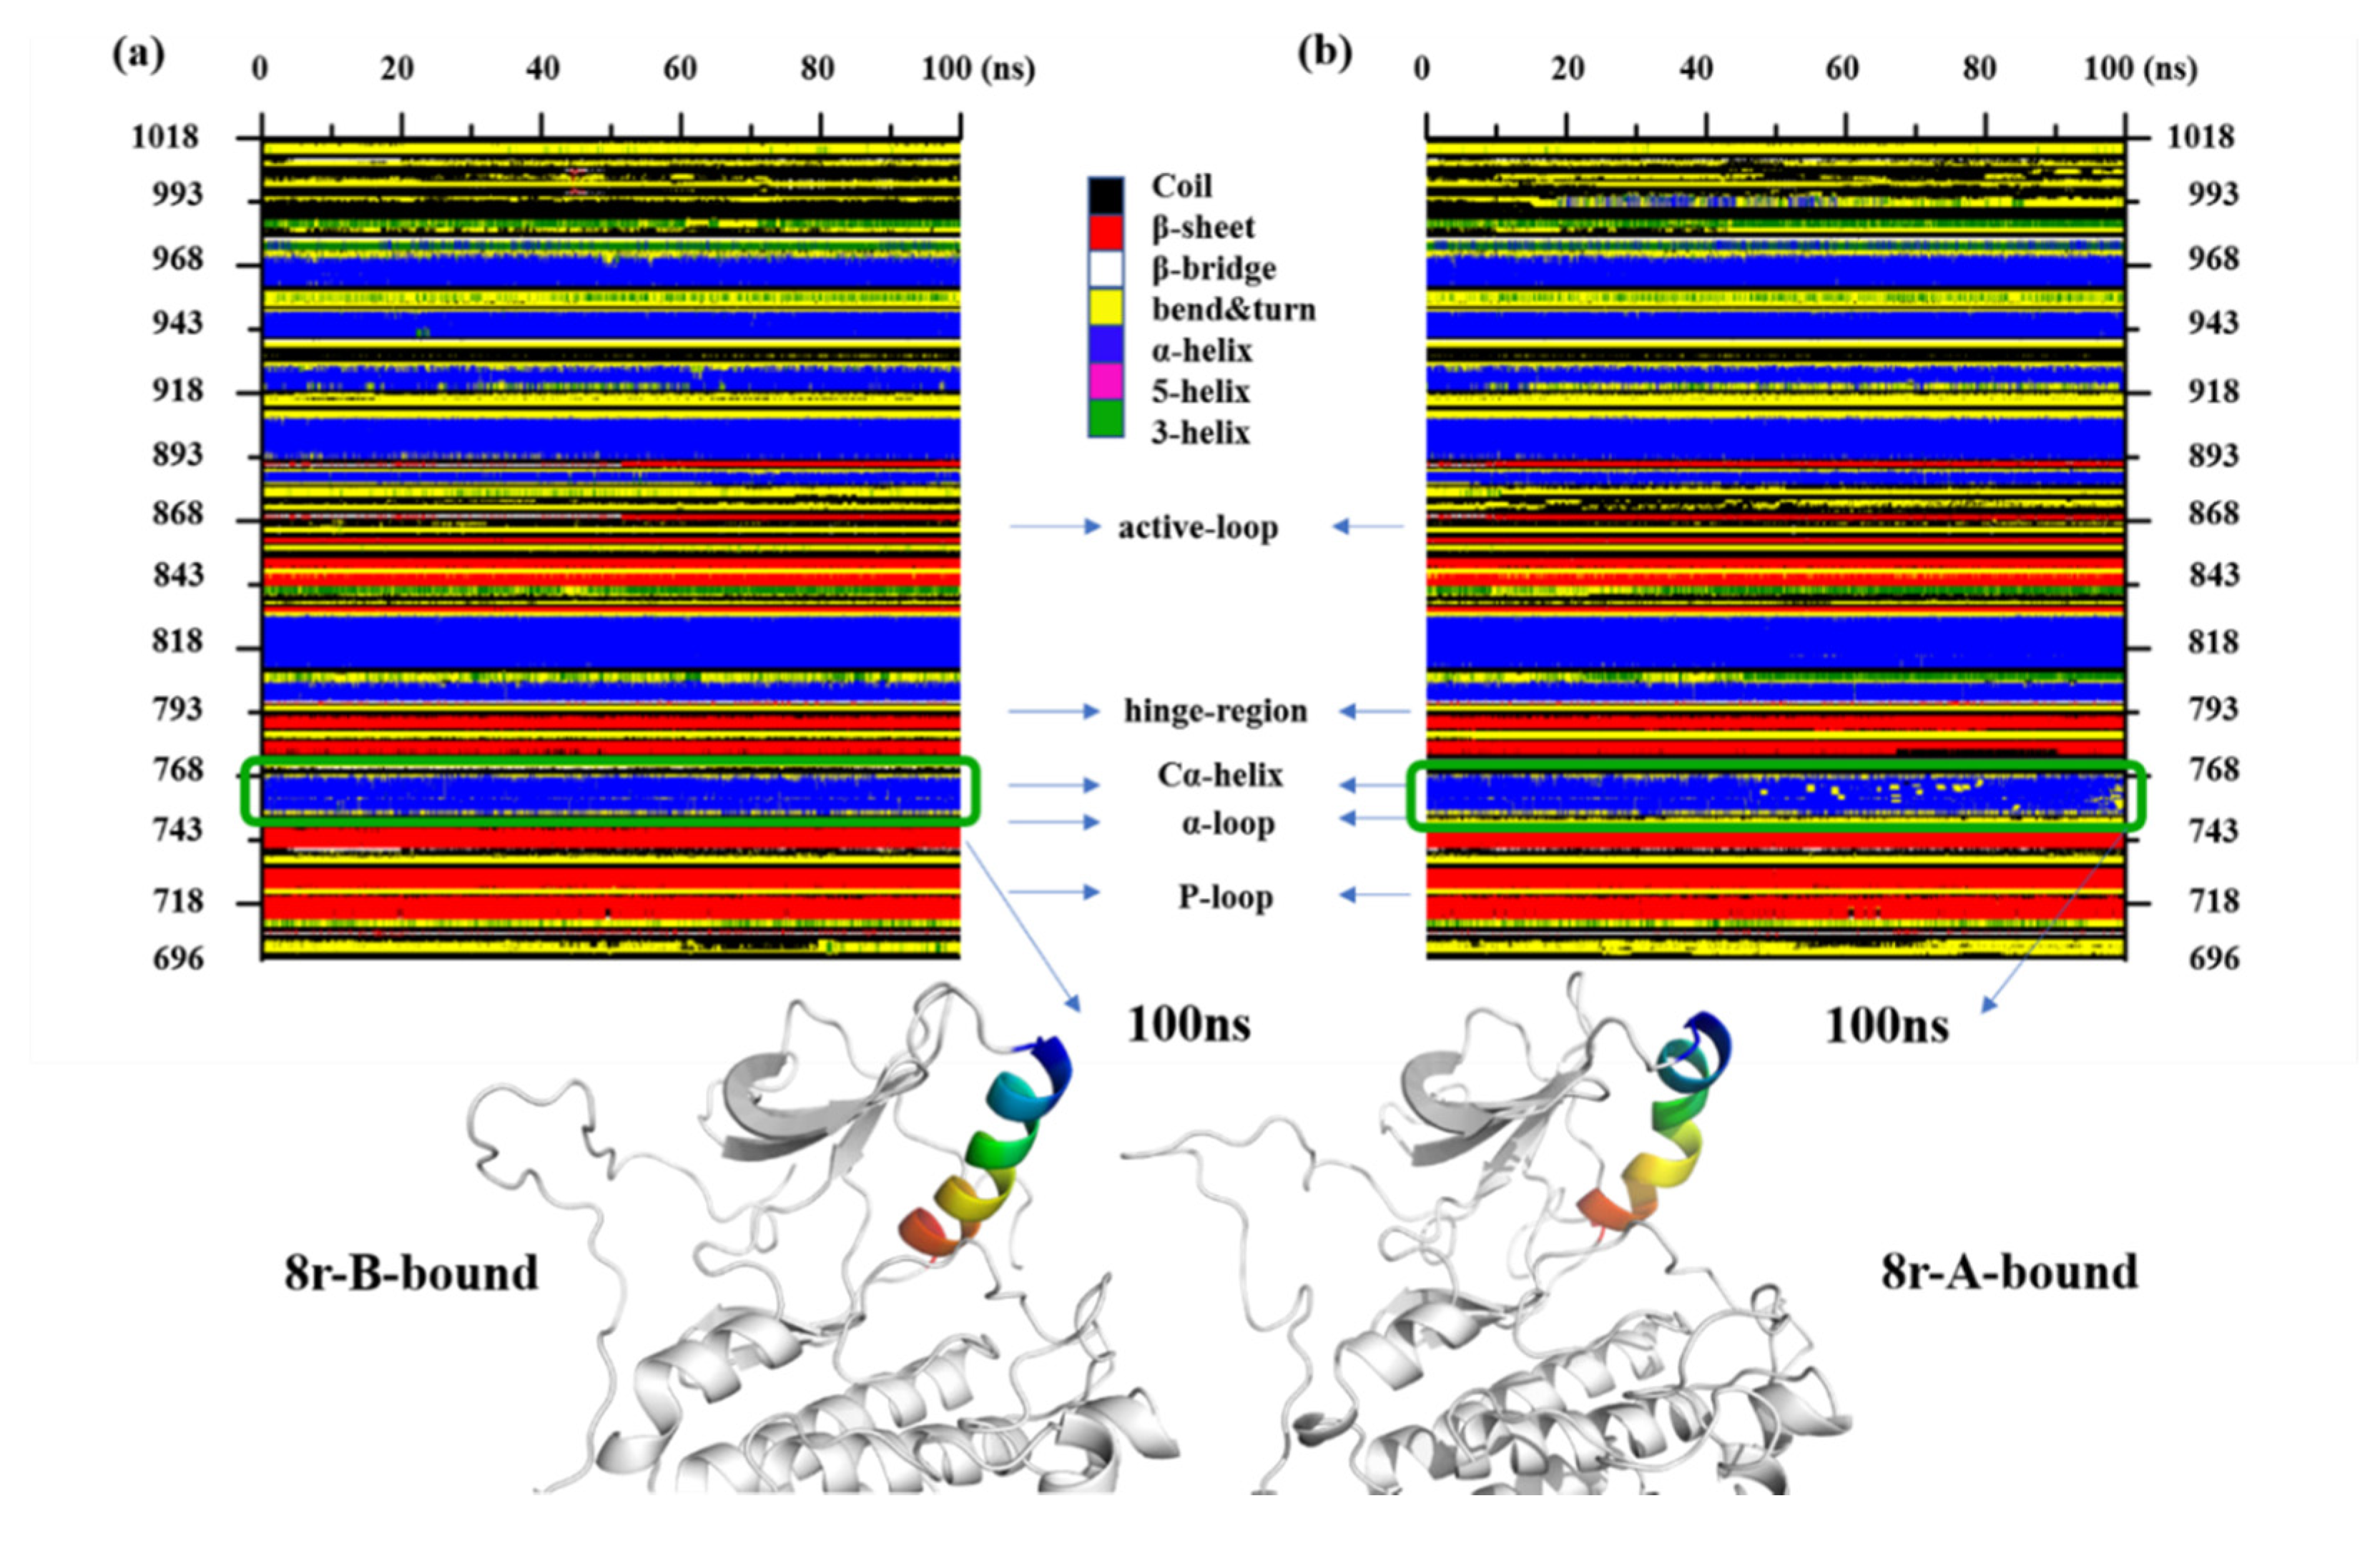
2.2. Molecular Dynamics Trajectory Stability and Flexibility Analysis
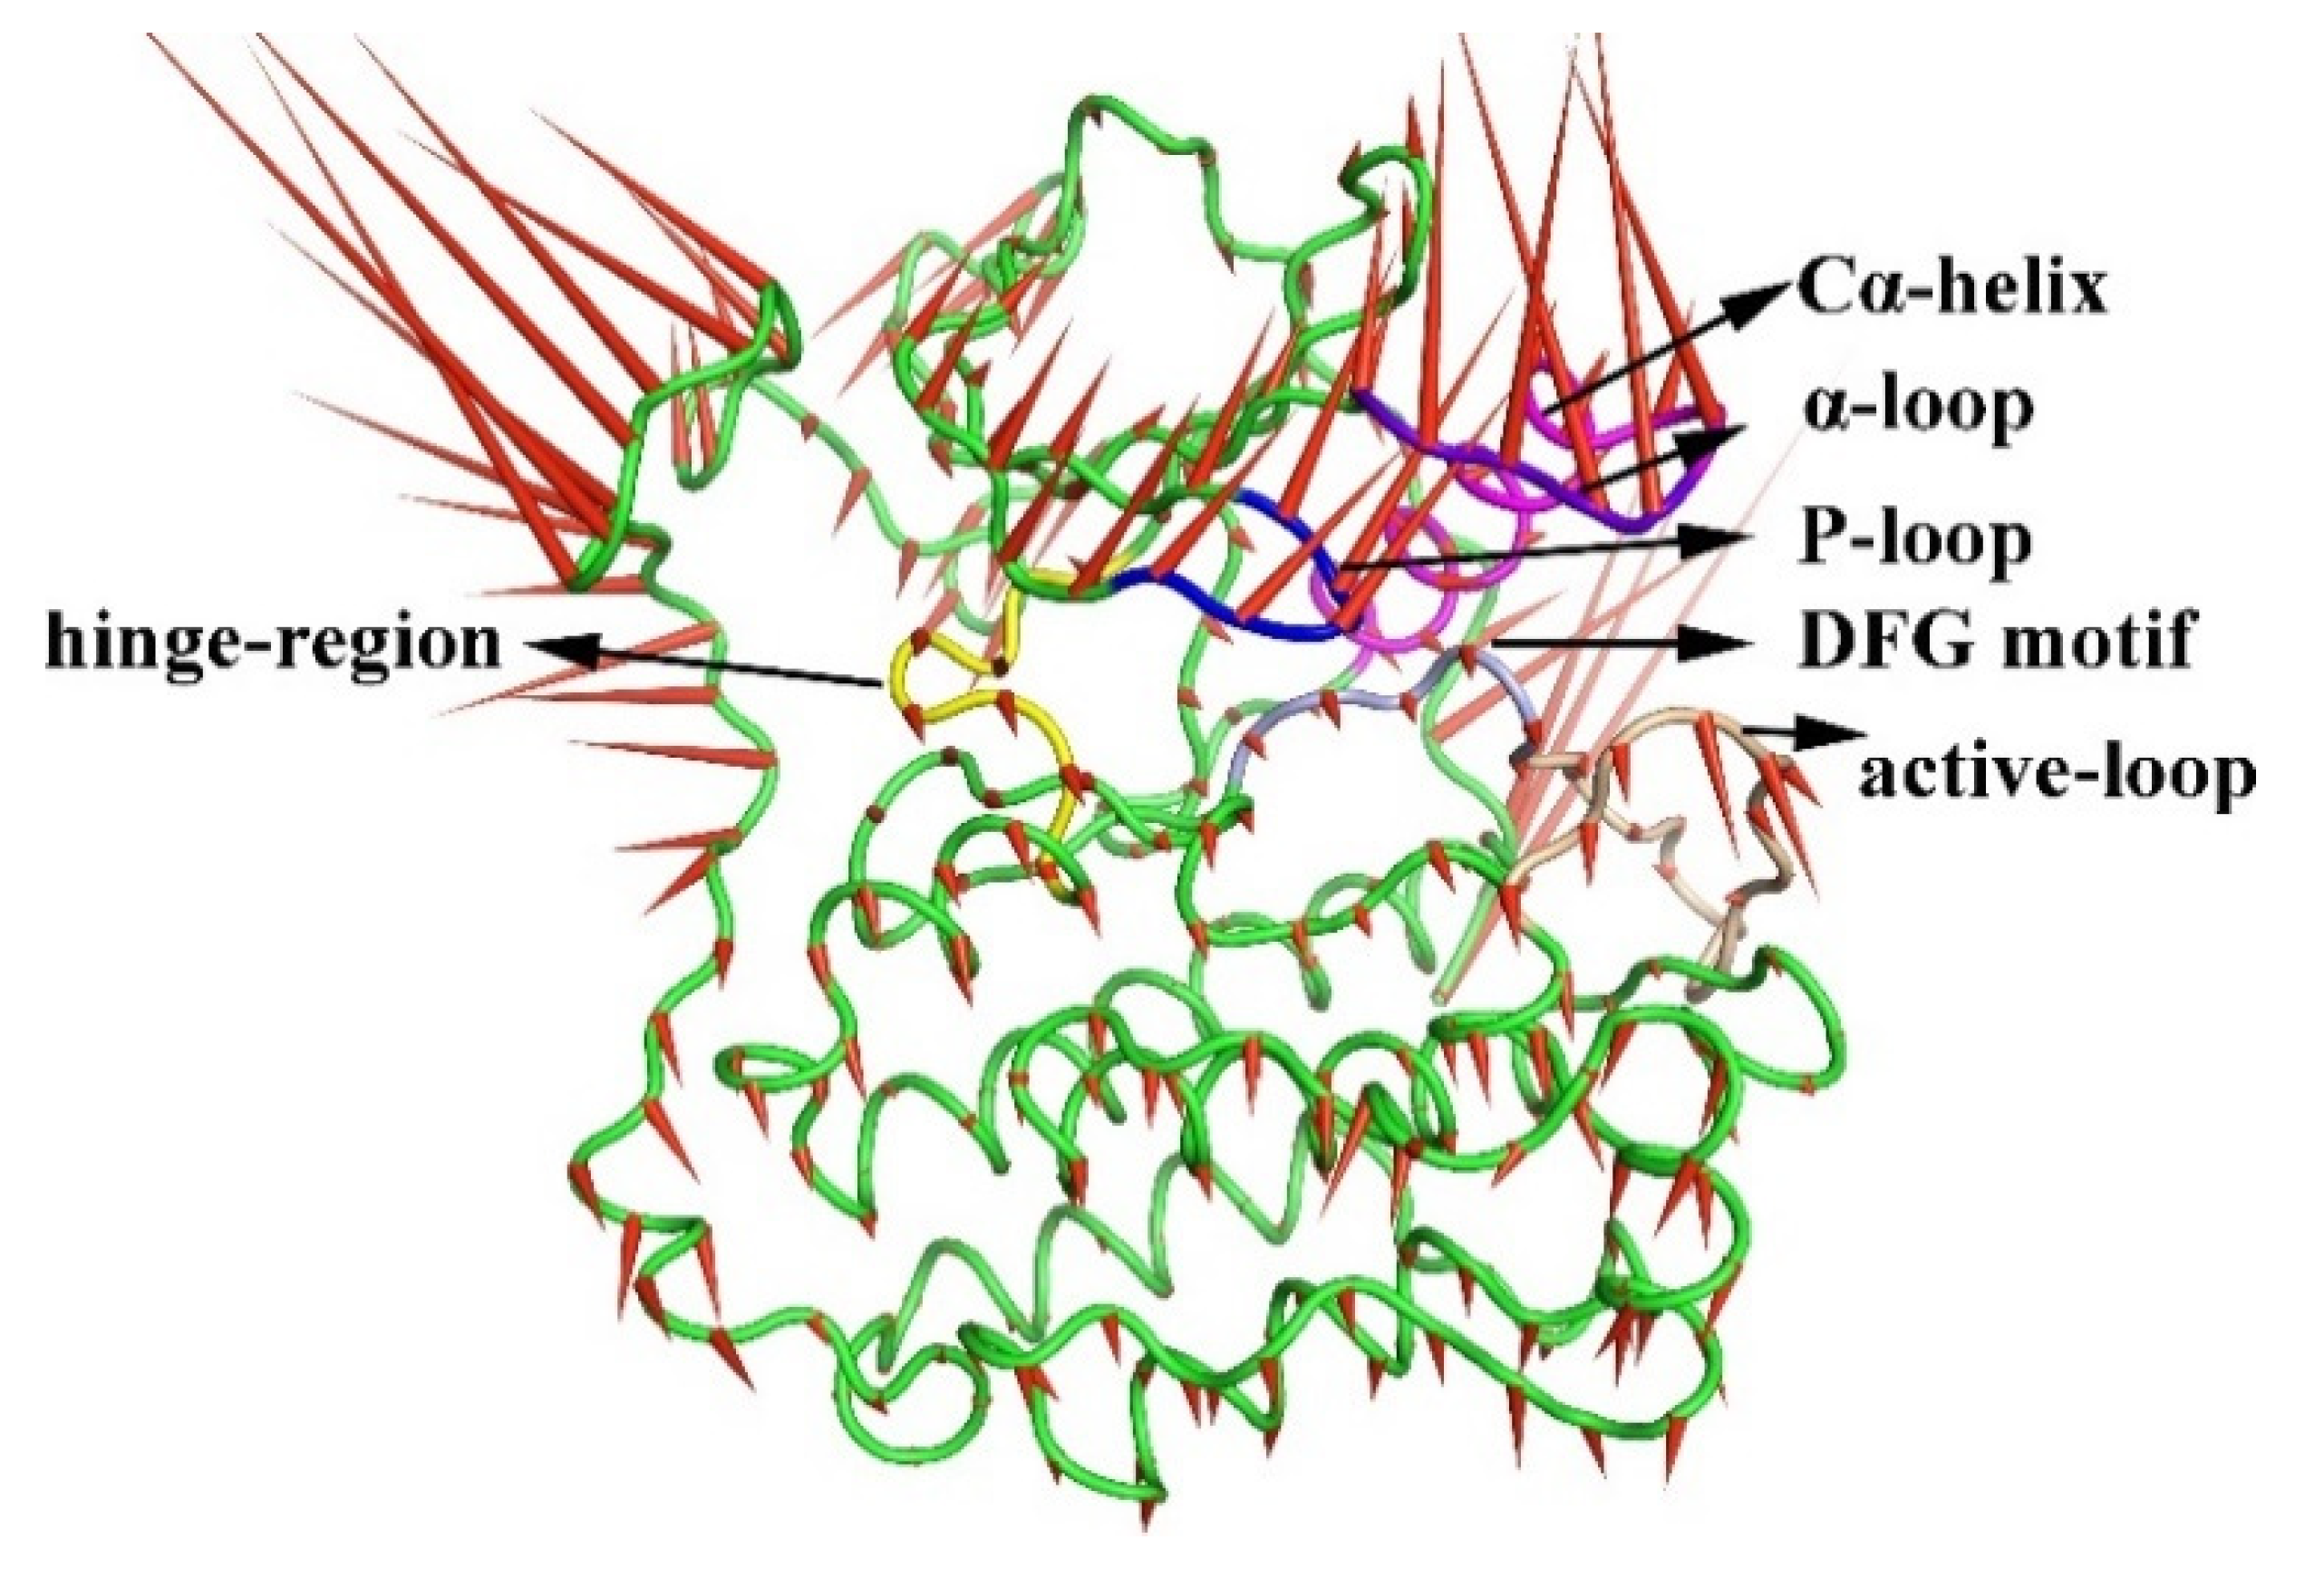
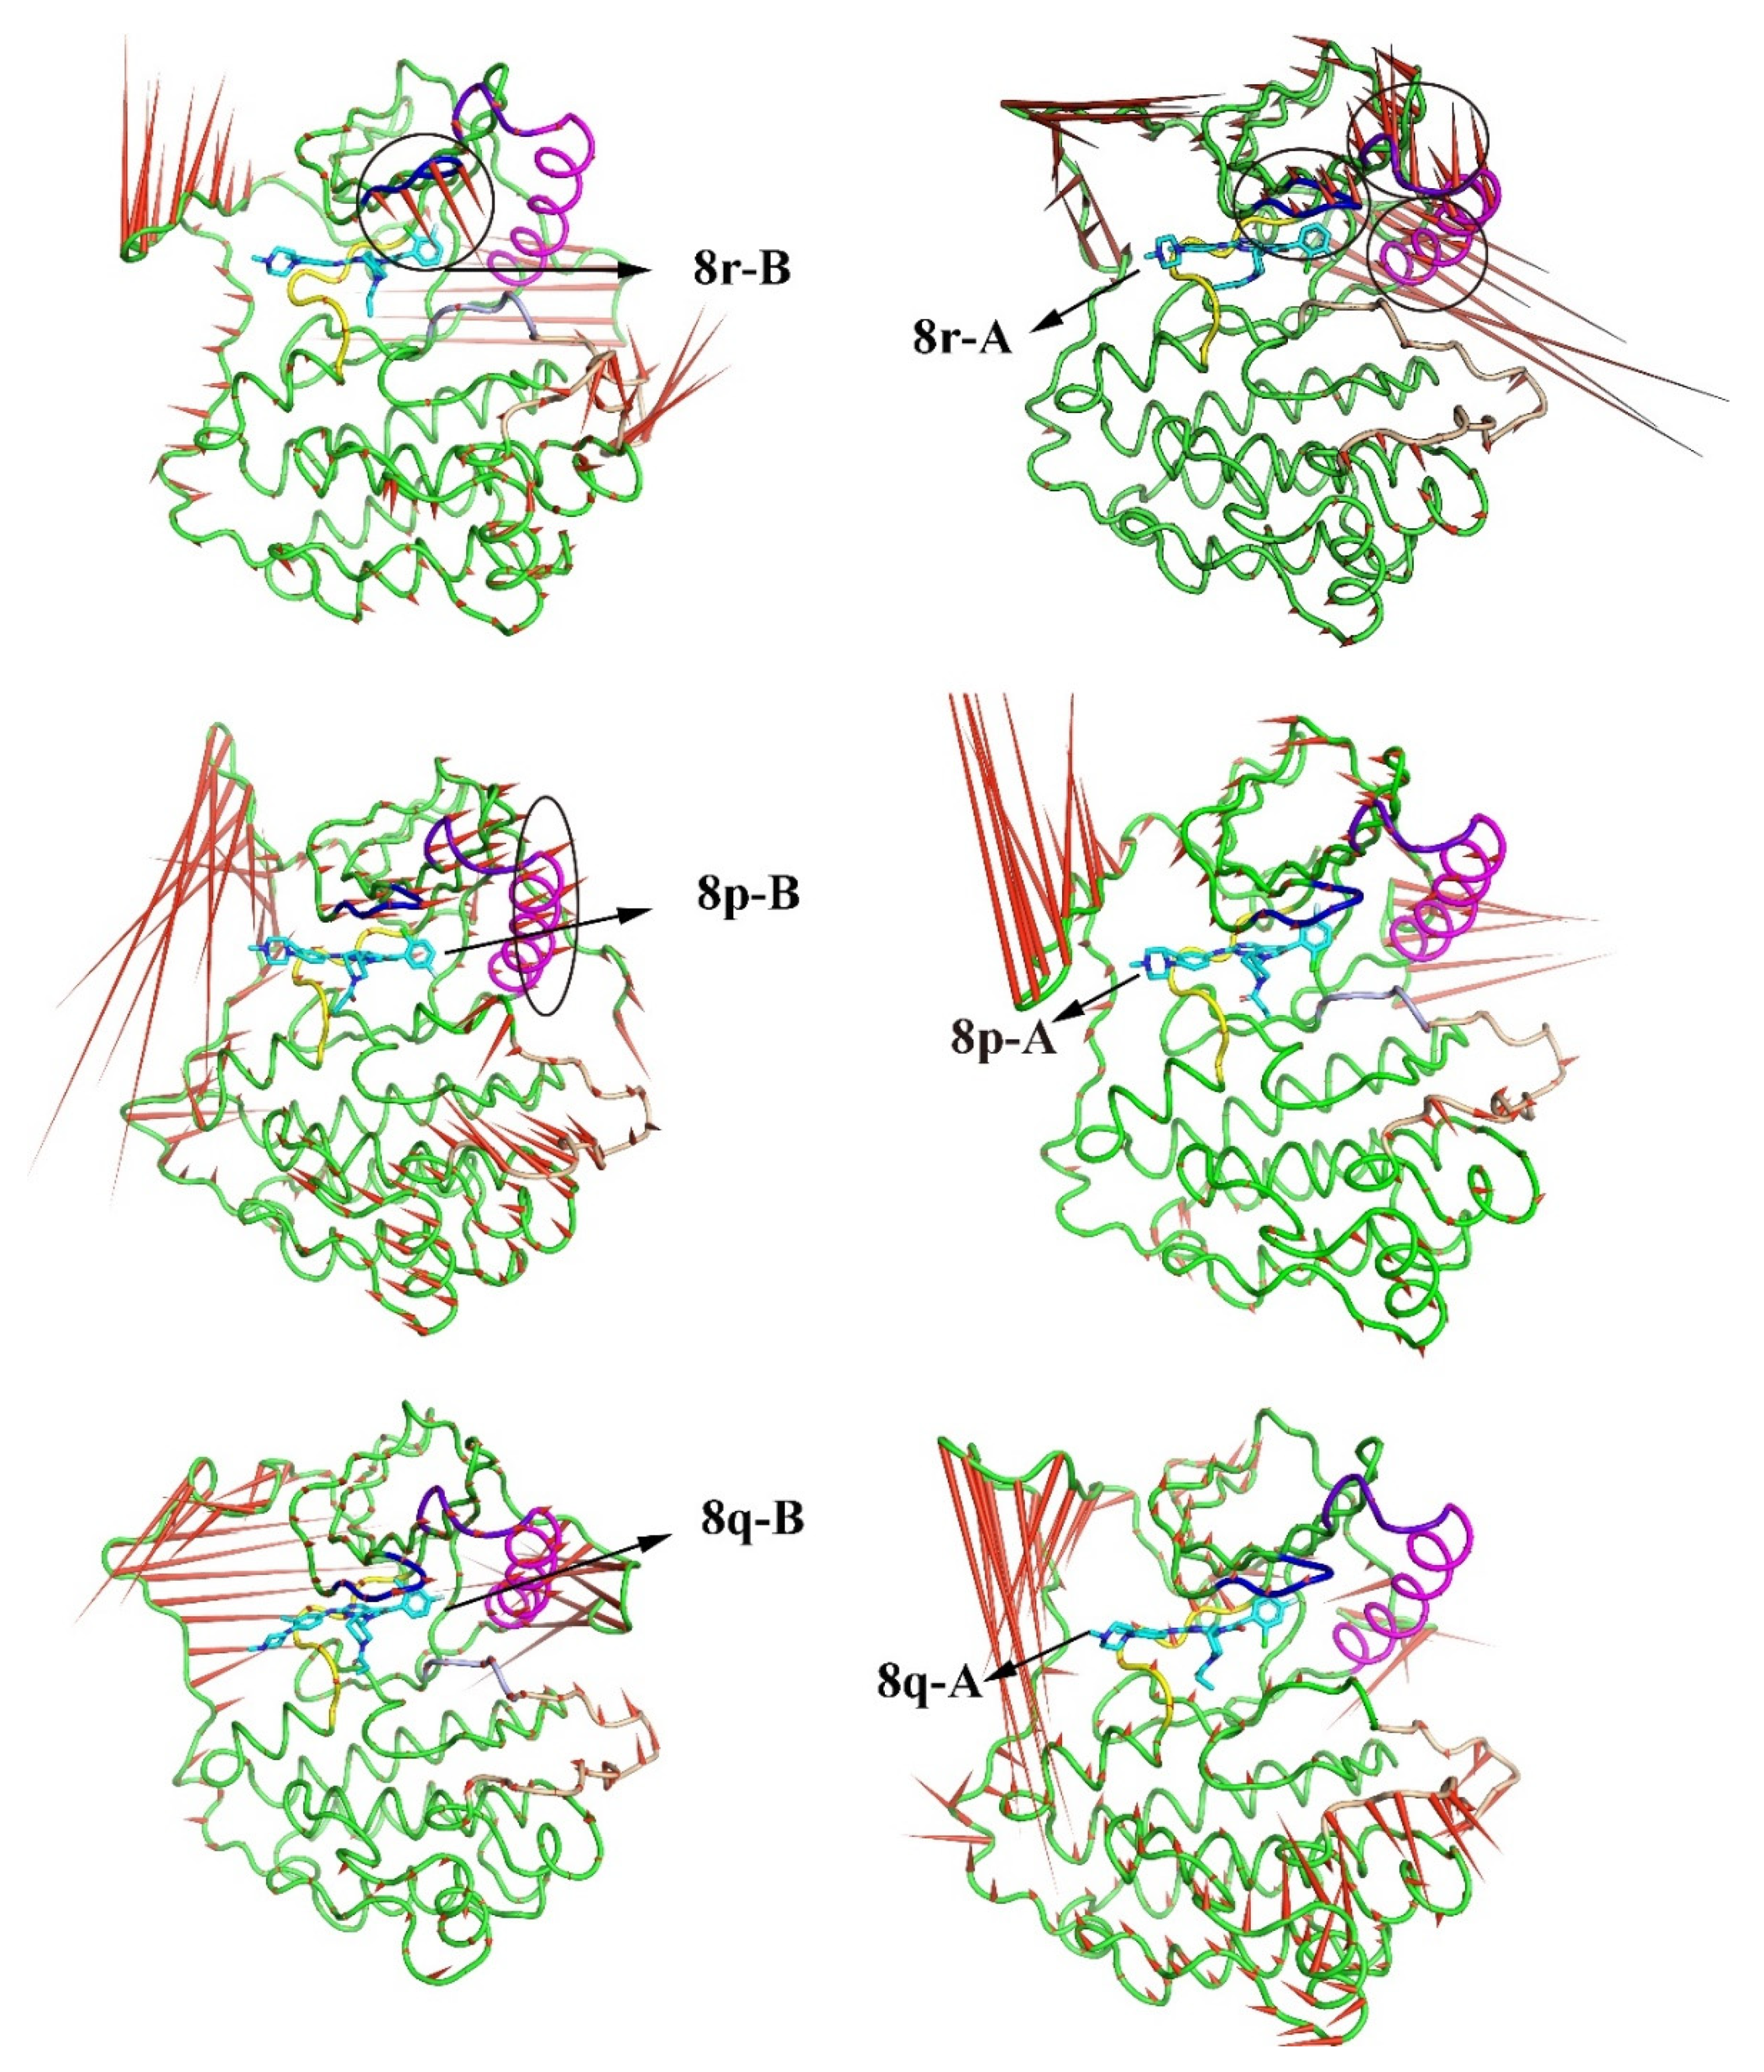
2.3. The Porcupine Plot for the Principal Component Analysis of the Six Complexes
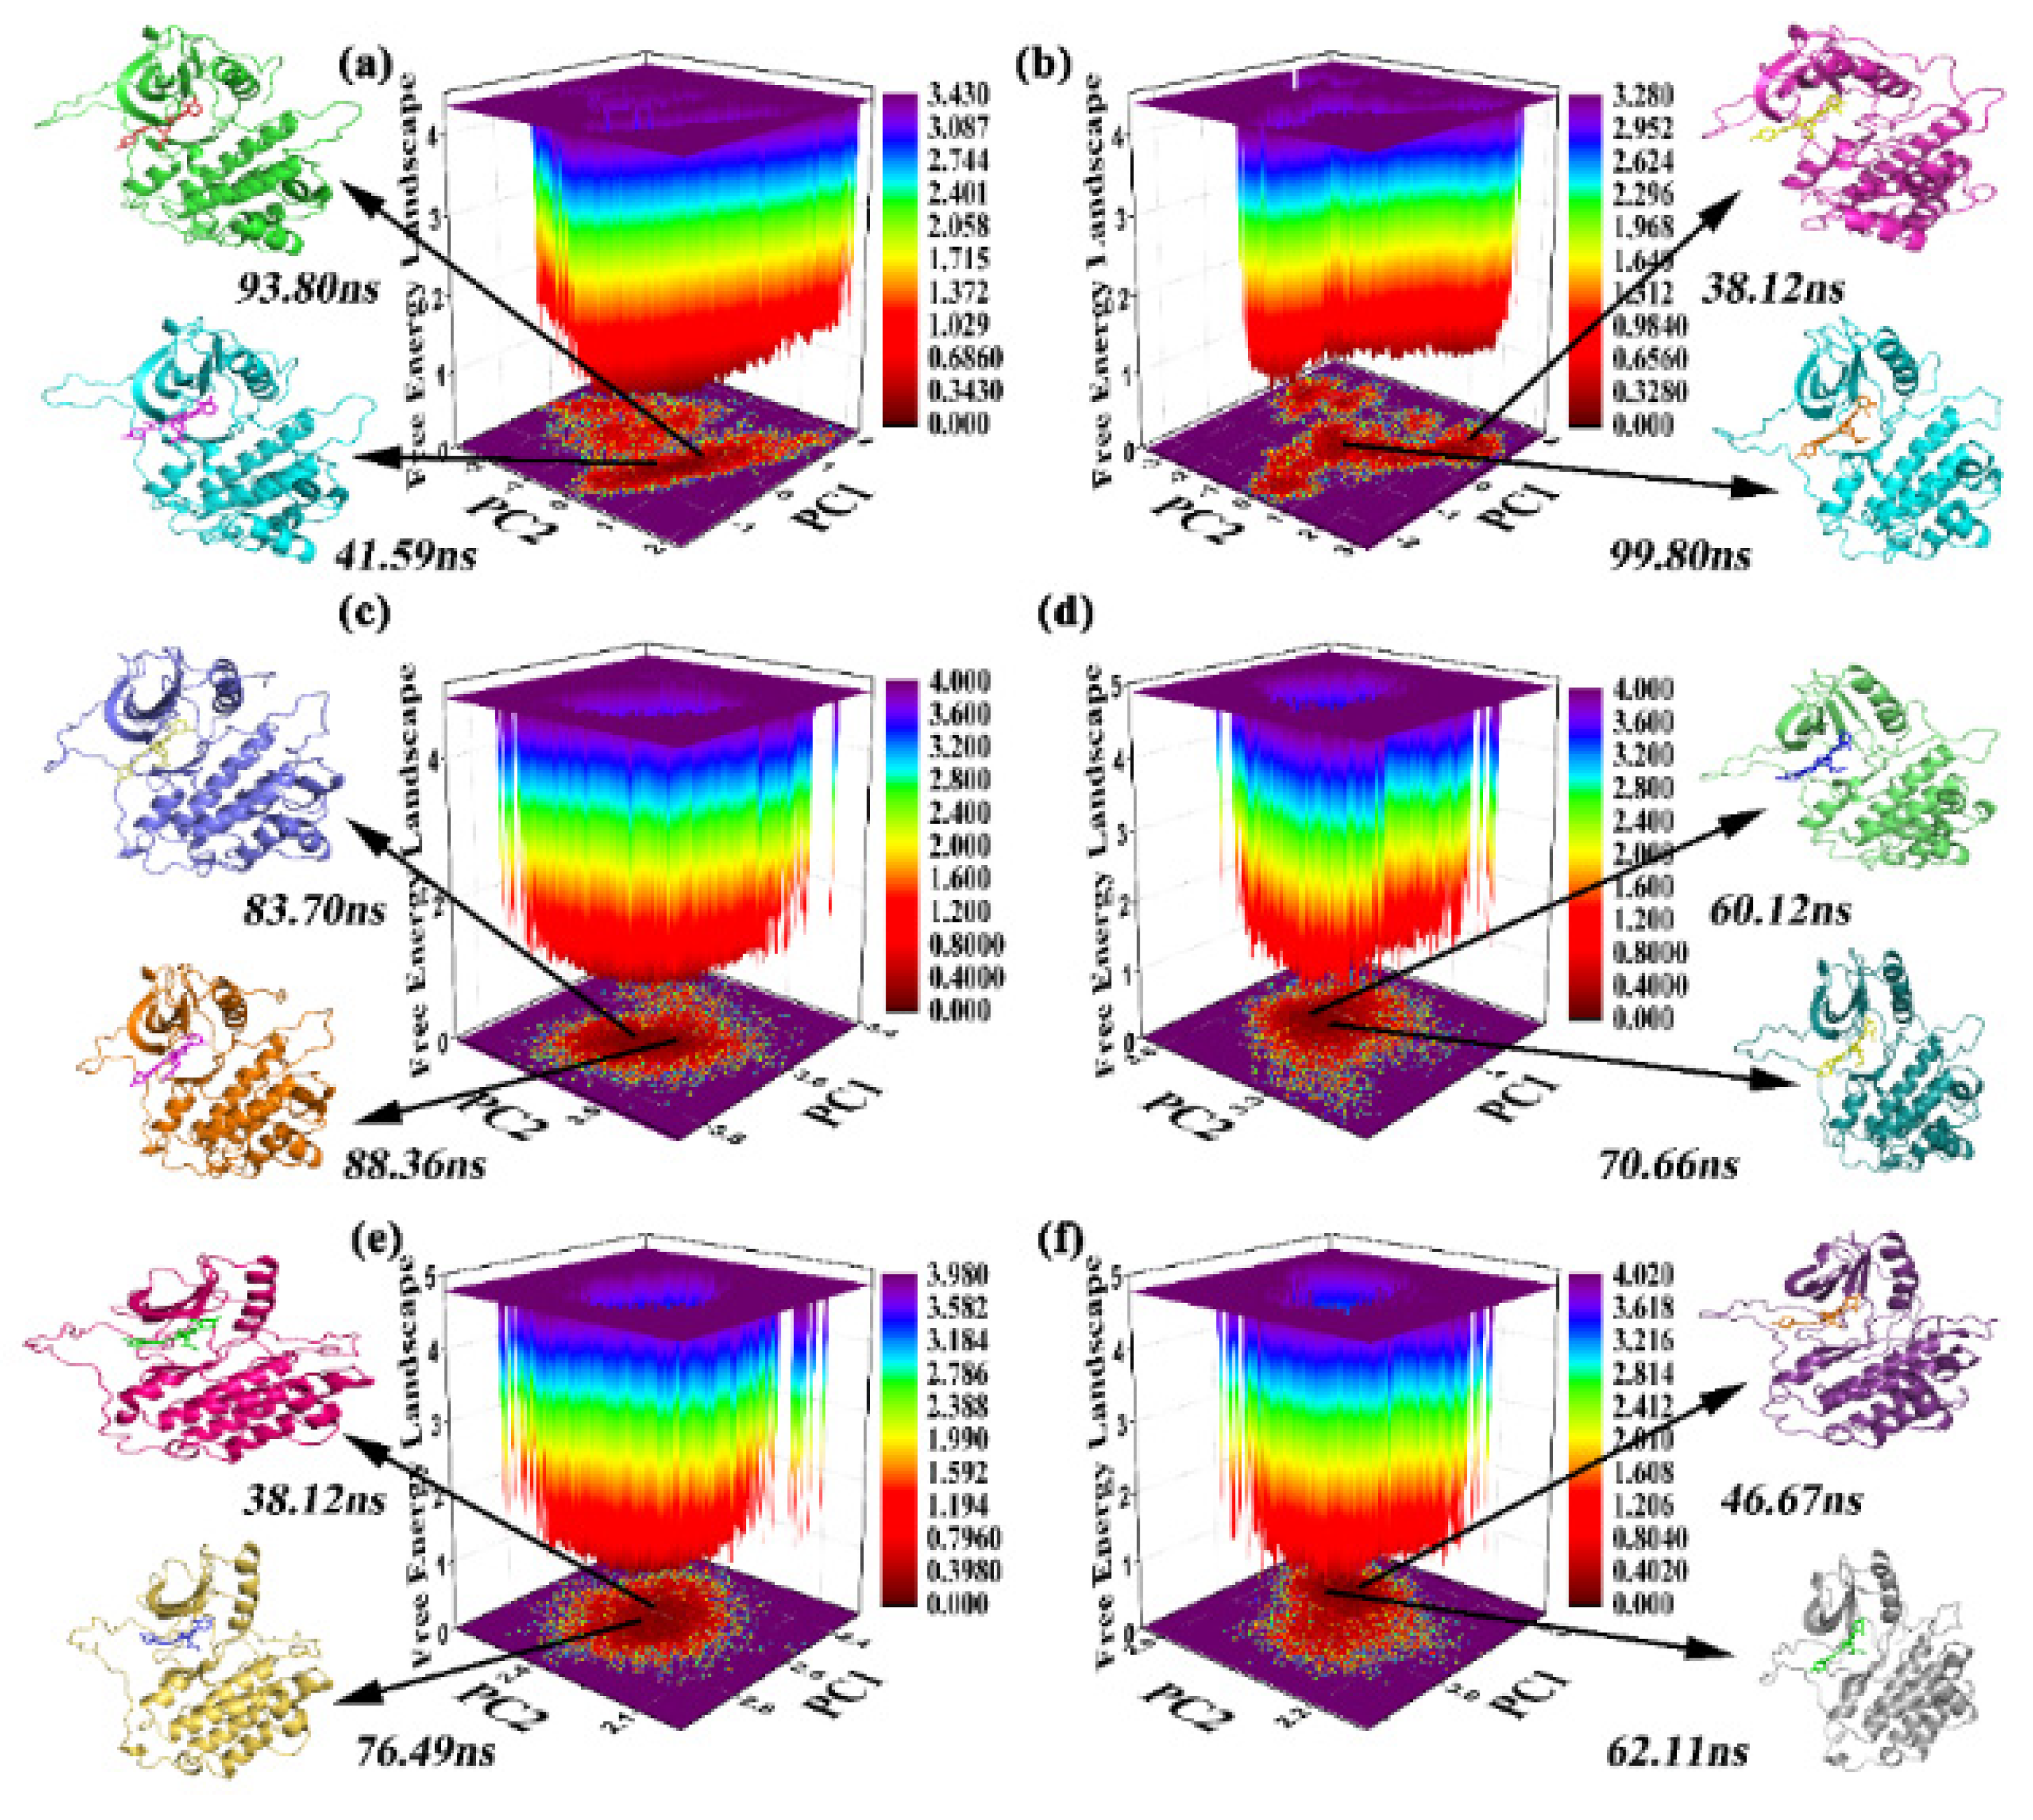
2.4. FEL and Clustering of the Sampling
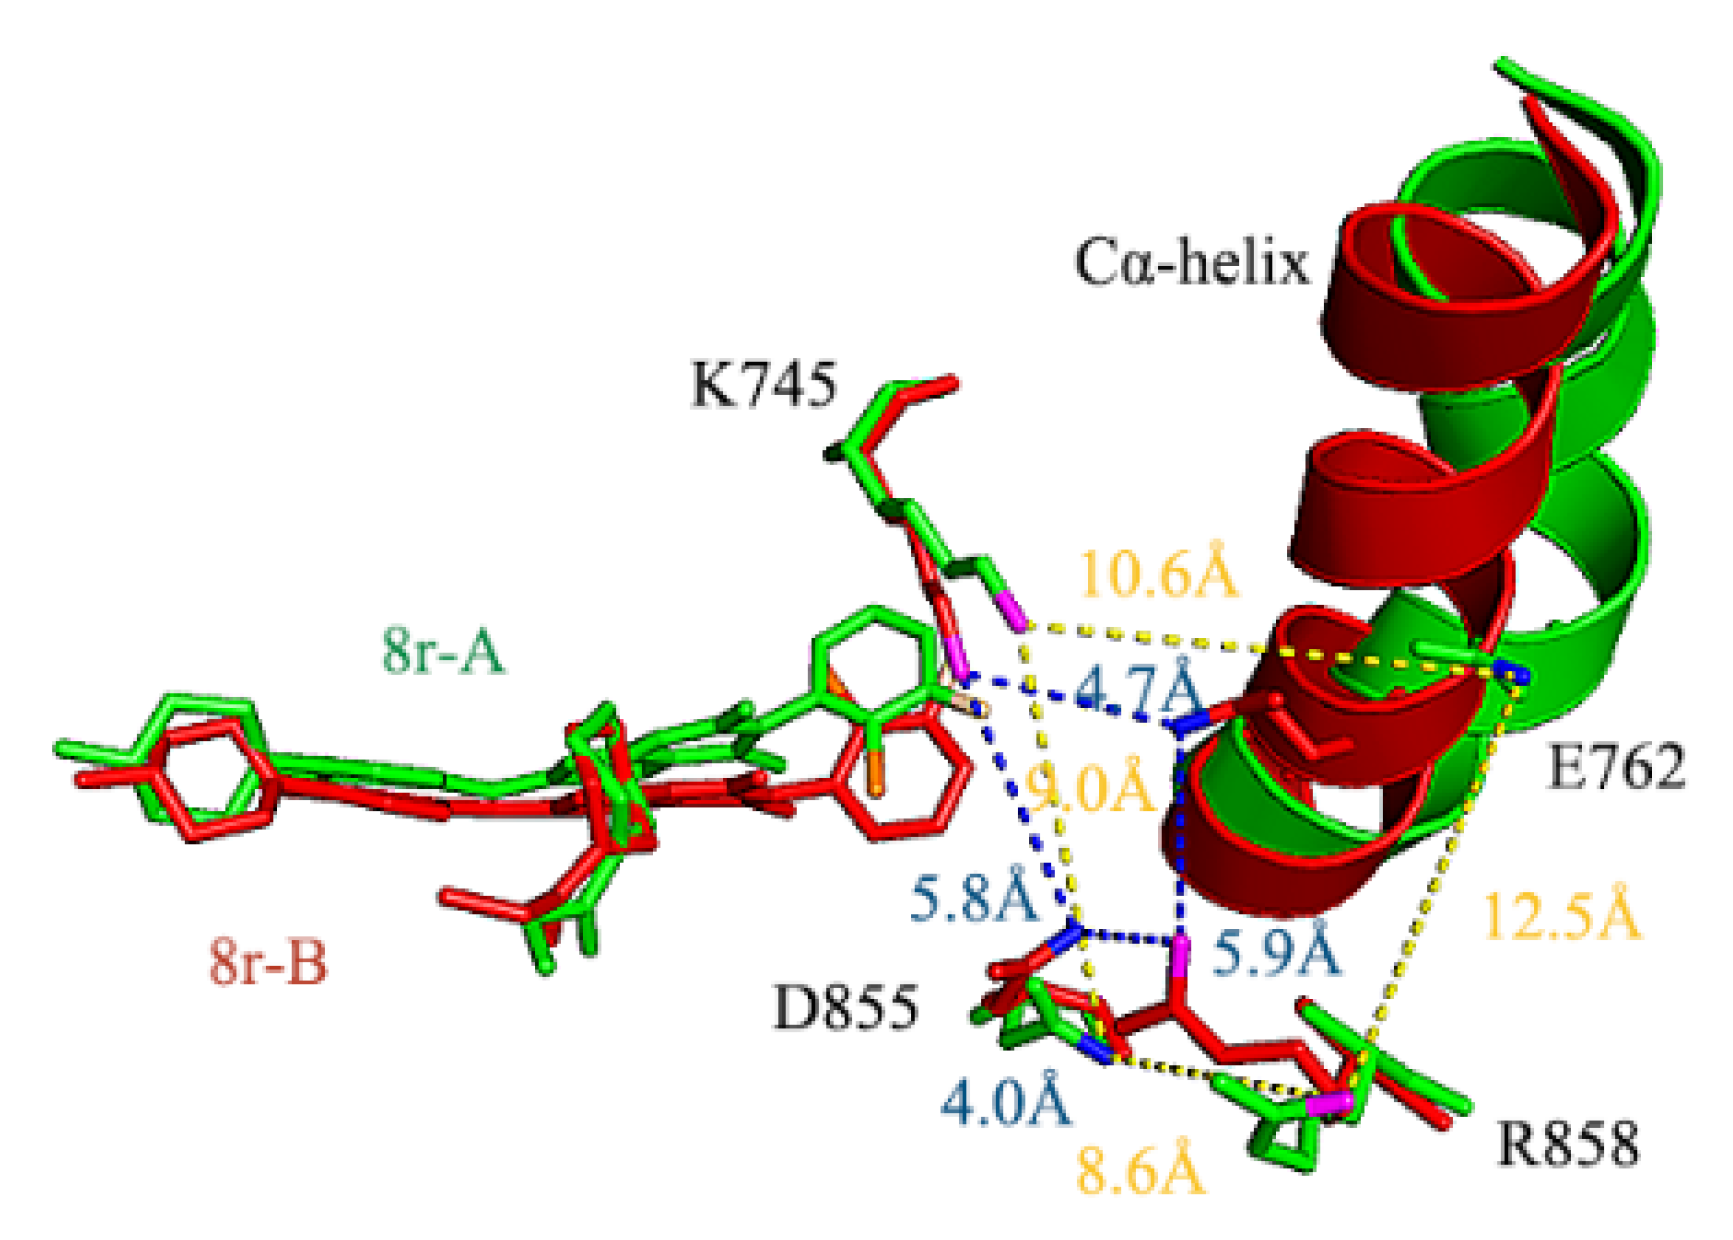
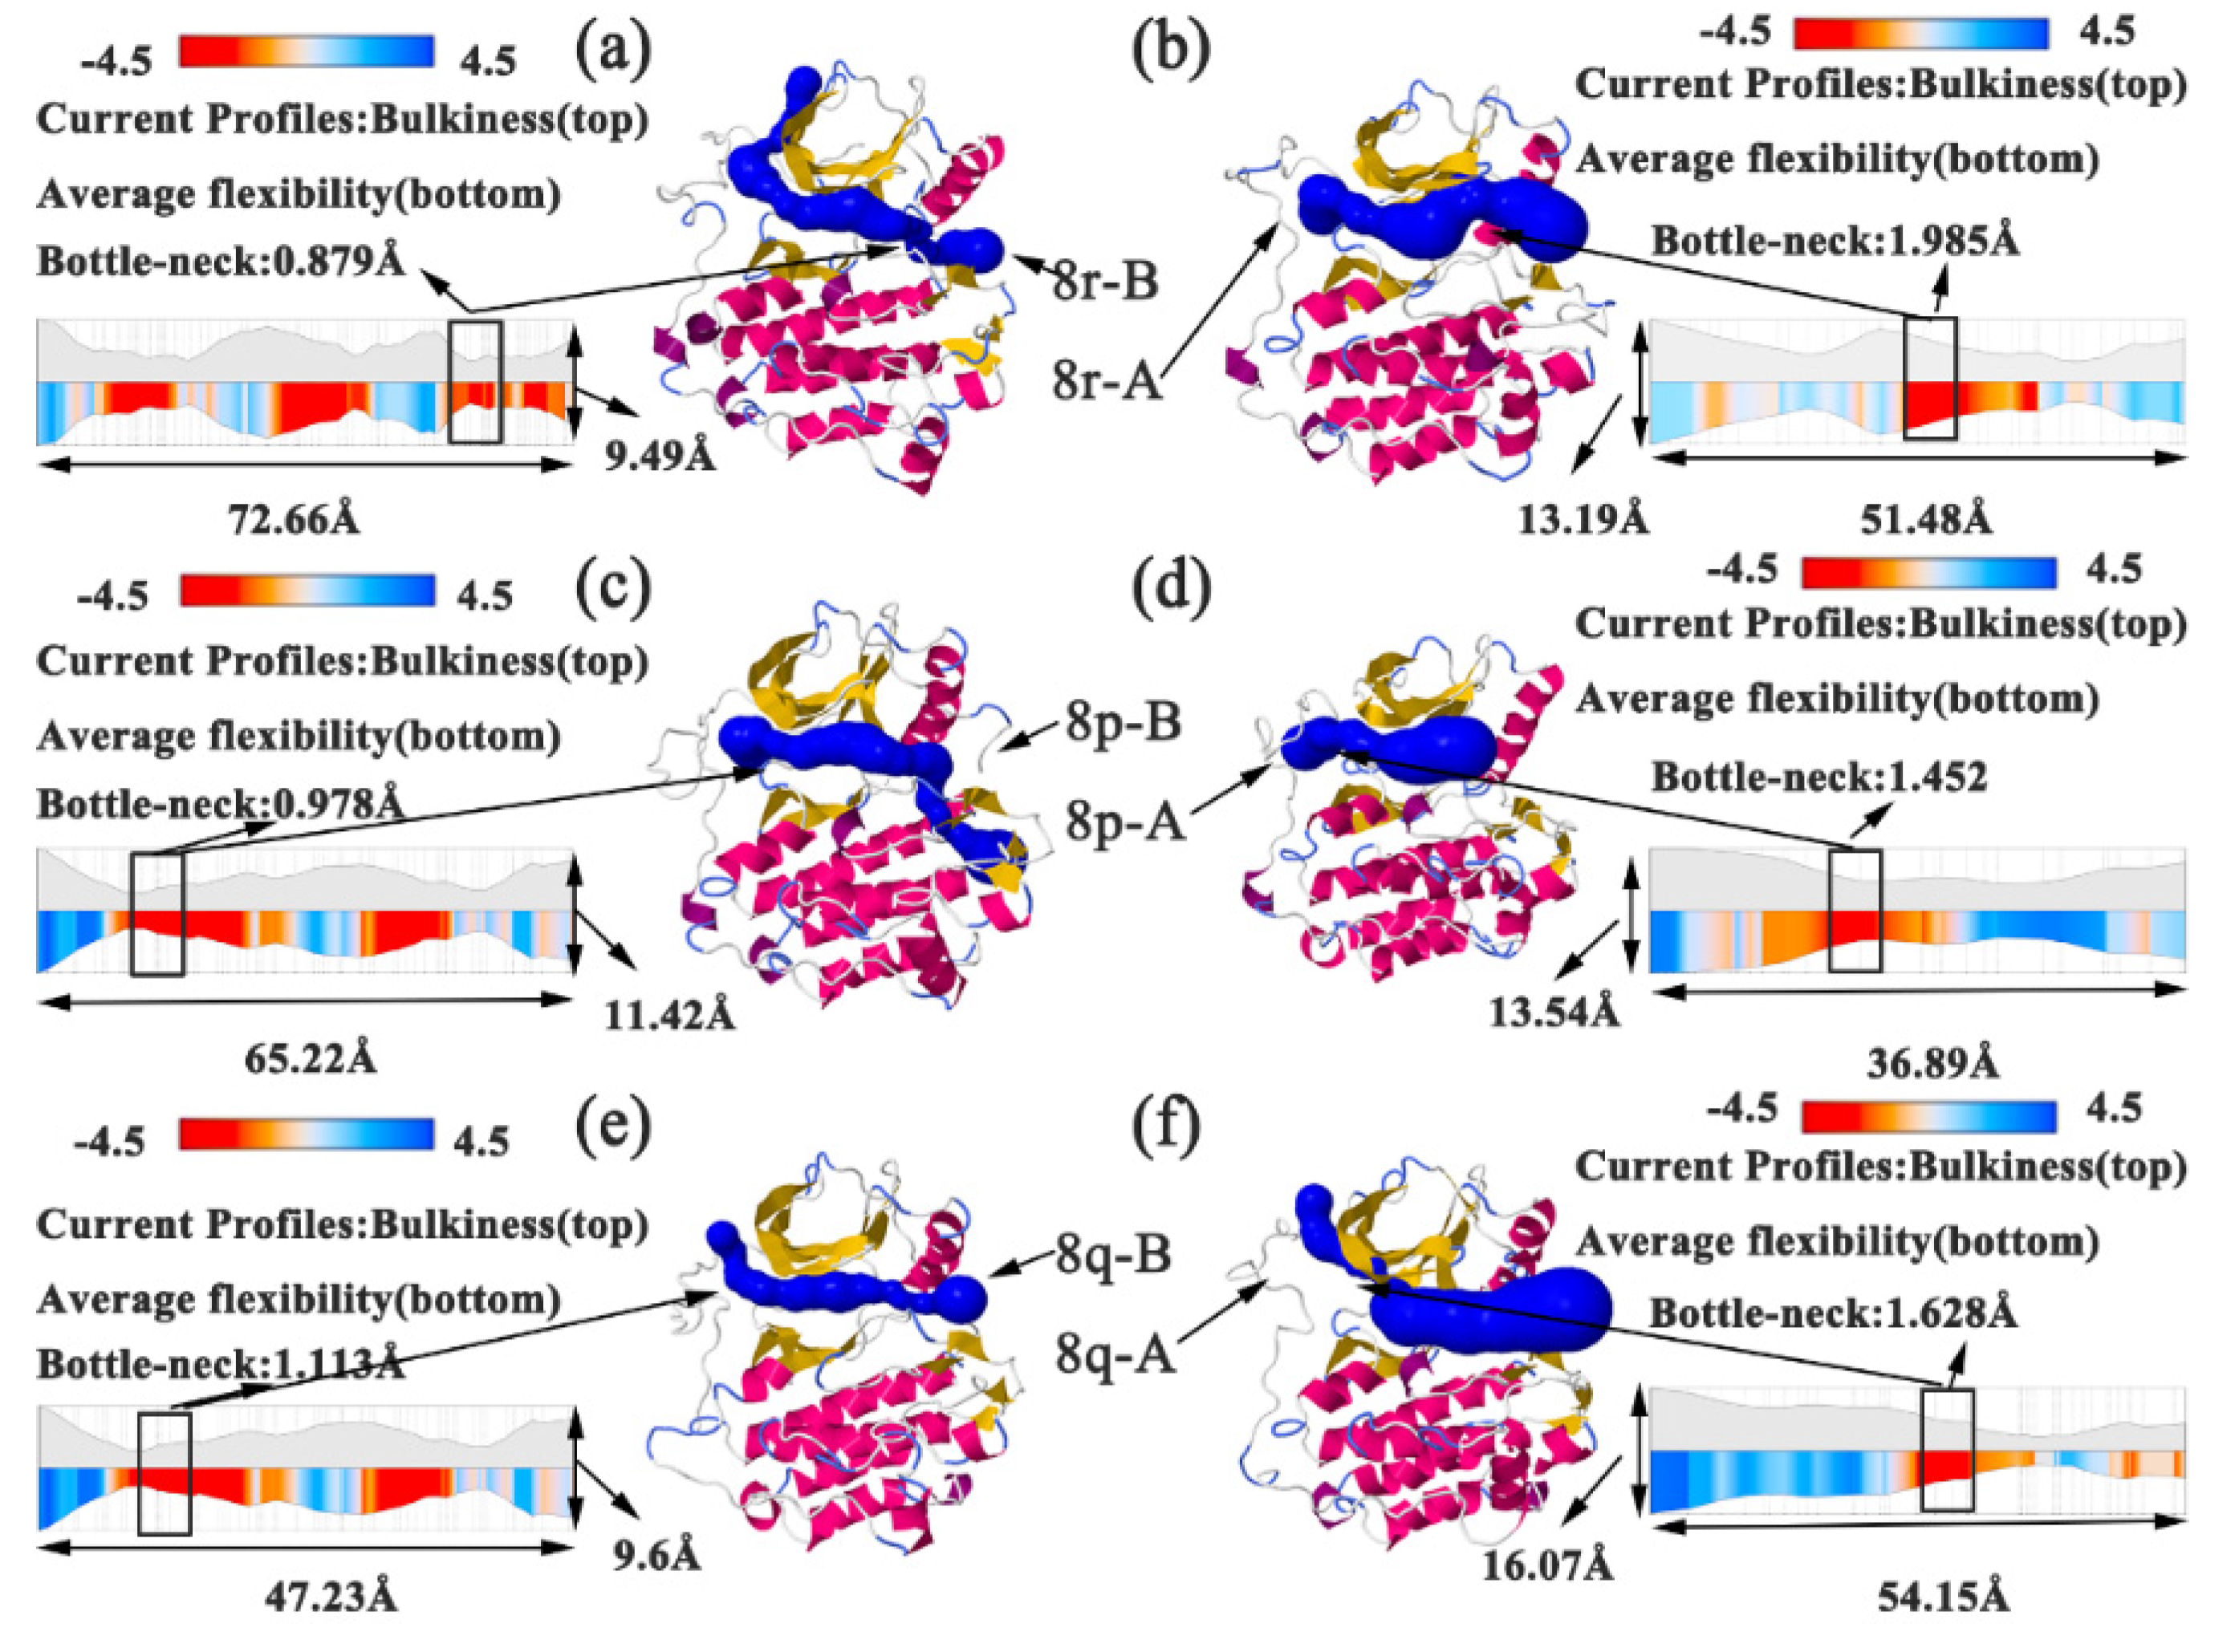
2.5. Conformational Analysis of Factors Influencing Inhibition Ability
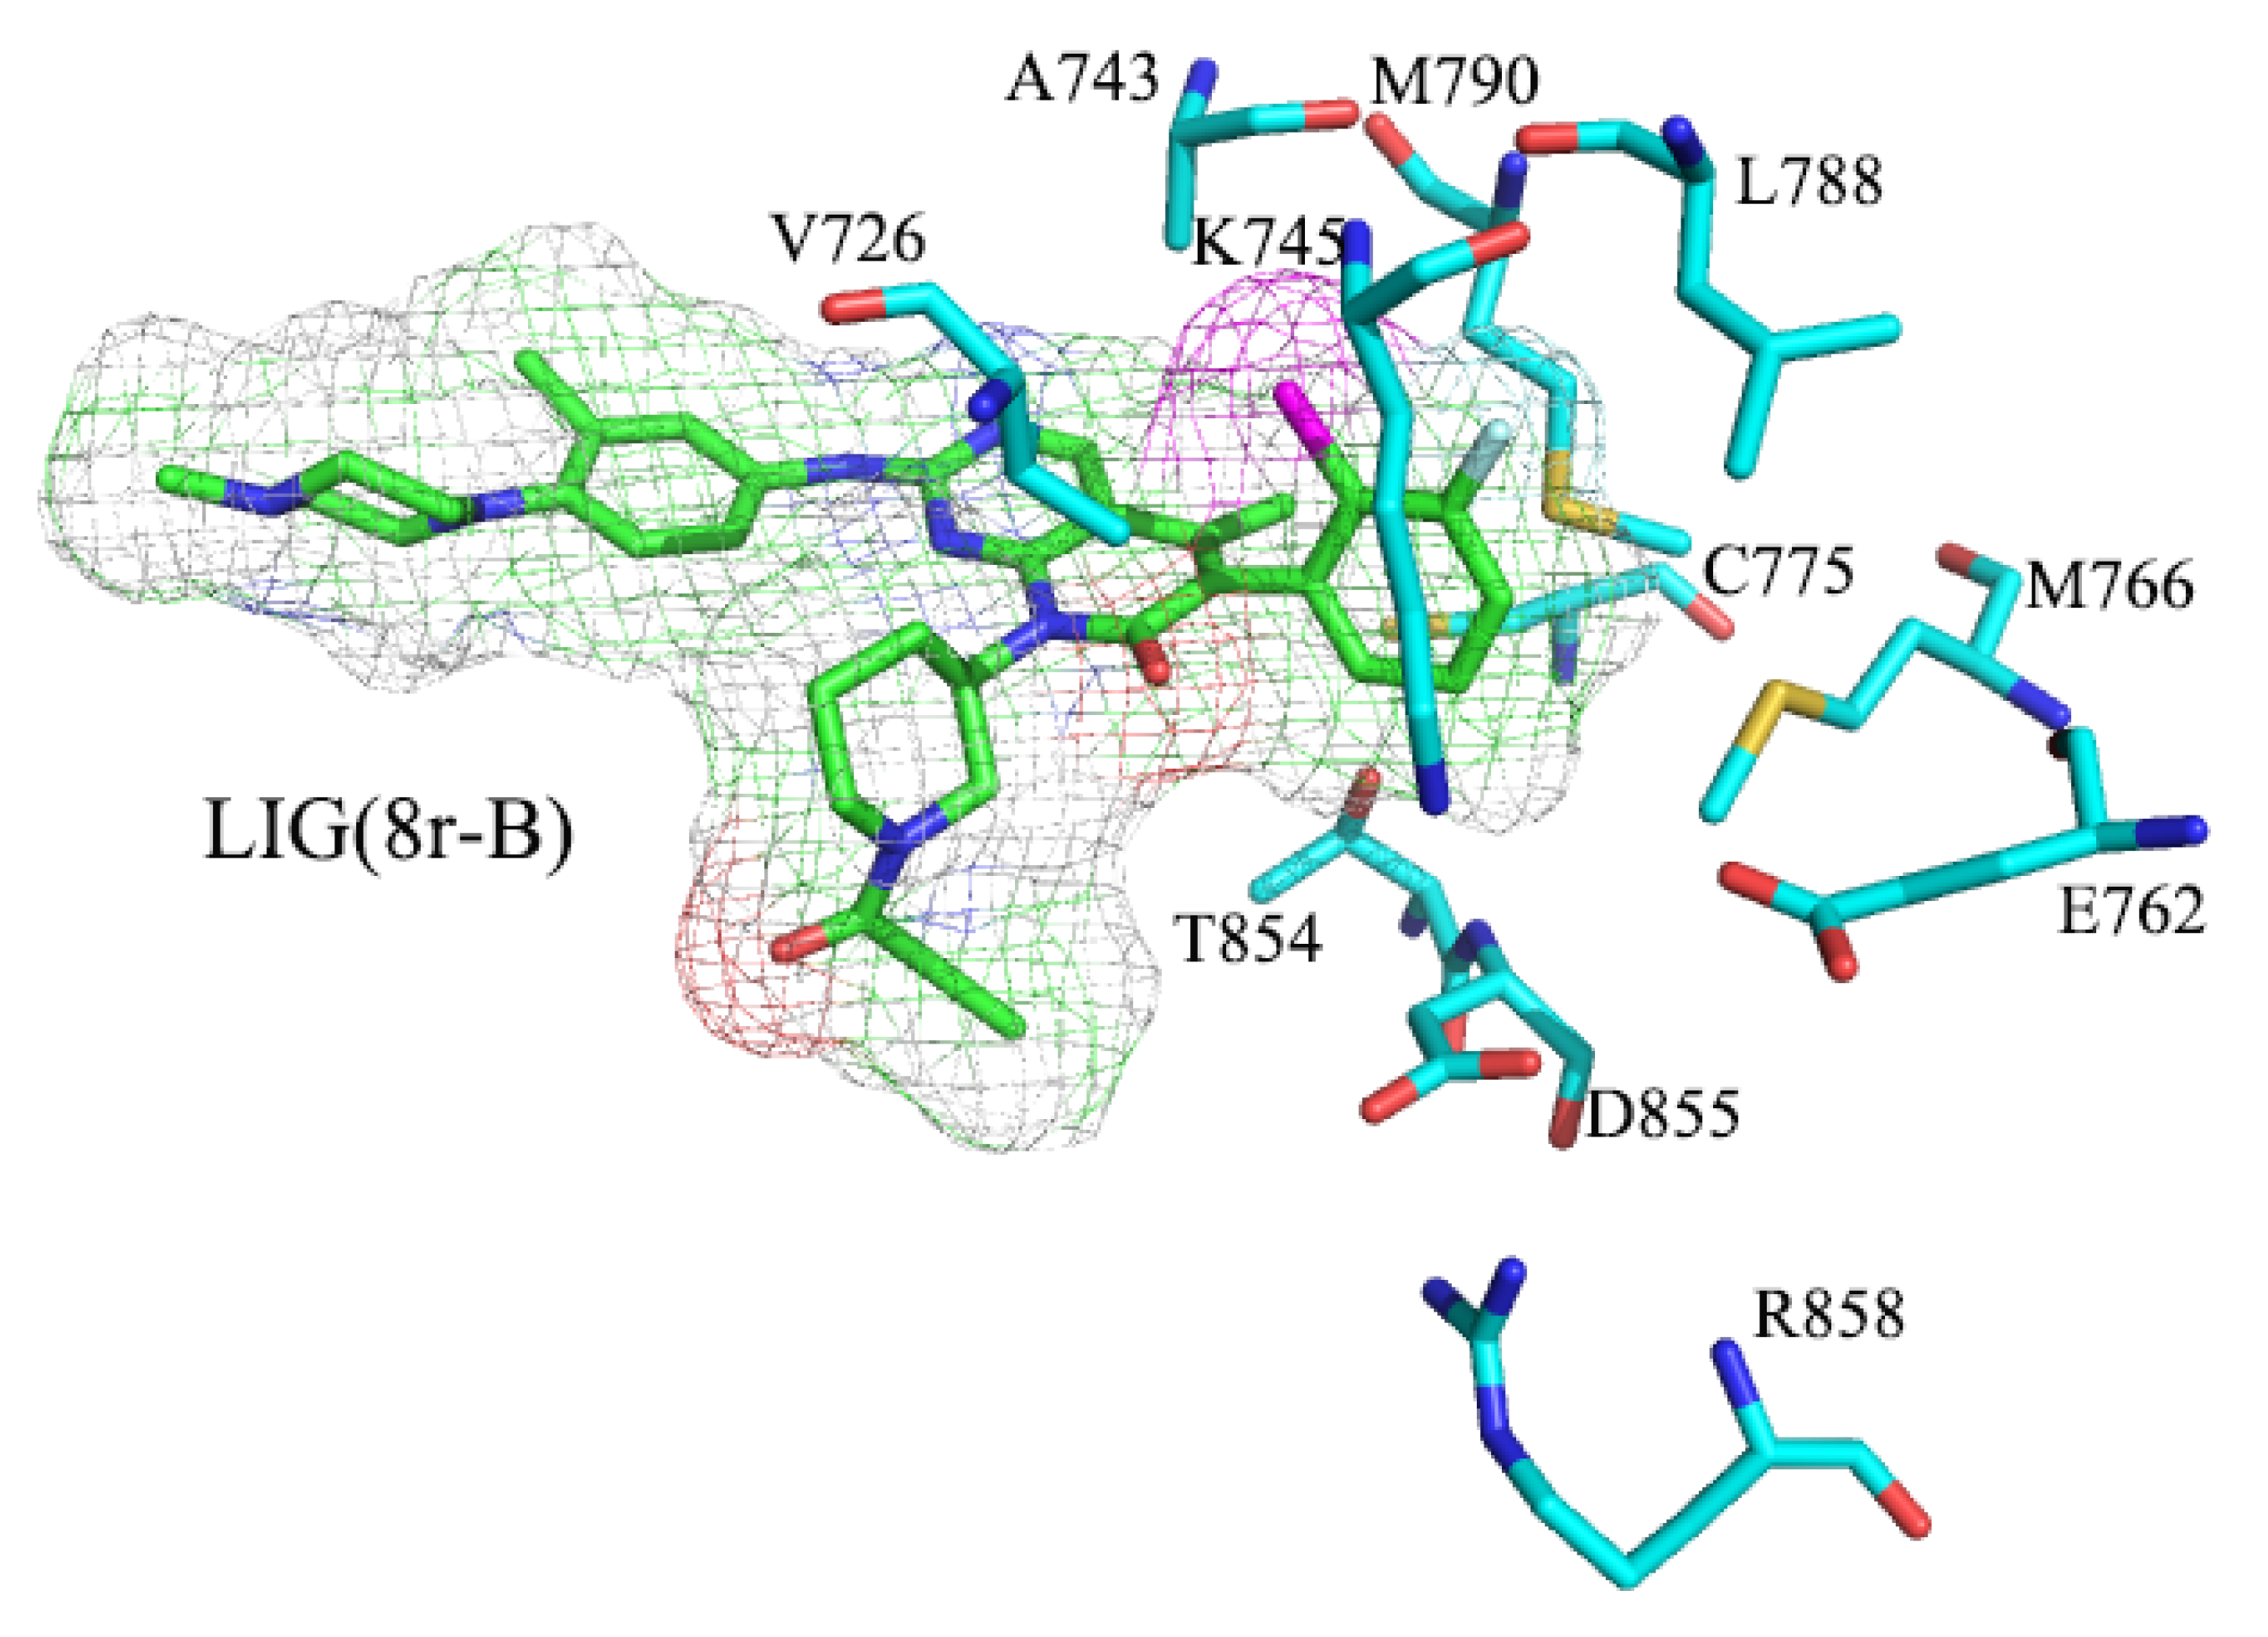
2.6. Binding Energy Calculations
3. Conclusions
4. Materials and Methods
4.1. Initial Structure Preparation
4.2. Molecular Docking Calculations
4.3. Molecular Dynamics (MD) Simulations
4.4. Cross-Correlation Analysis.
4.5. Principal Component Analysis and Free Energy Landscape
4.6. Cluster Analysis
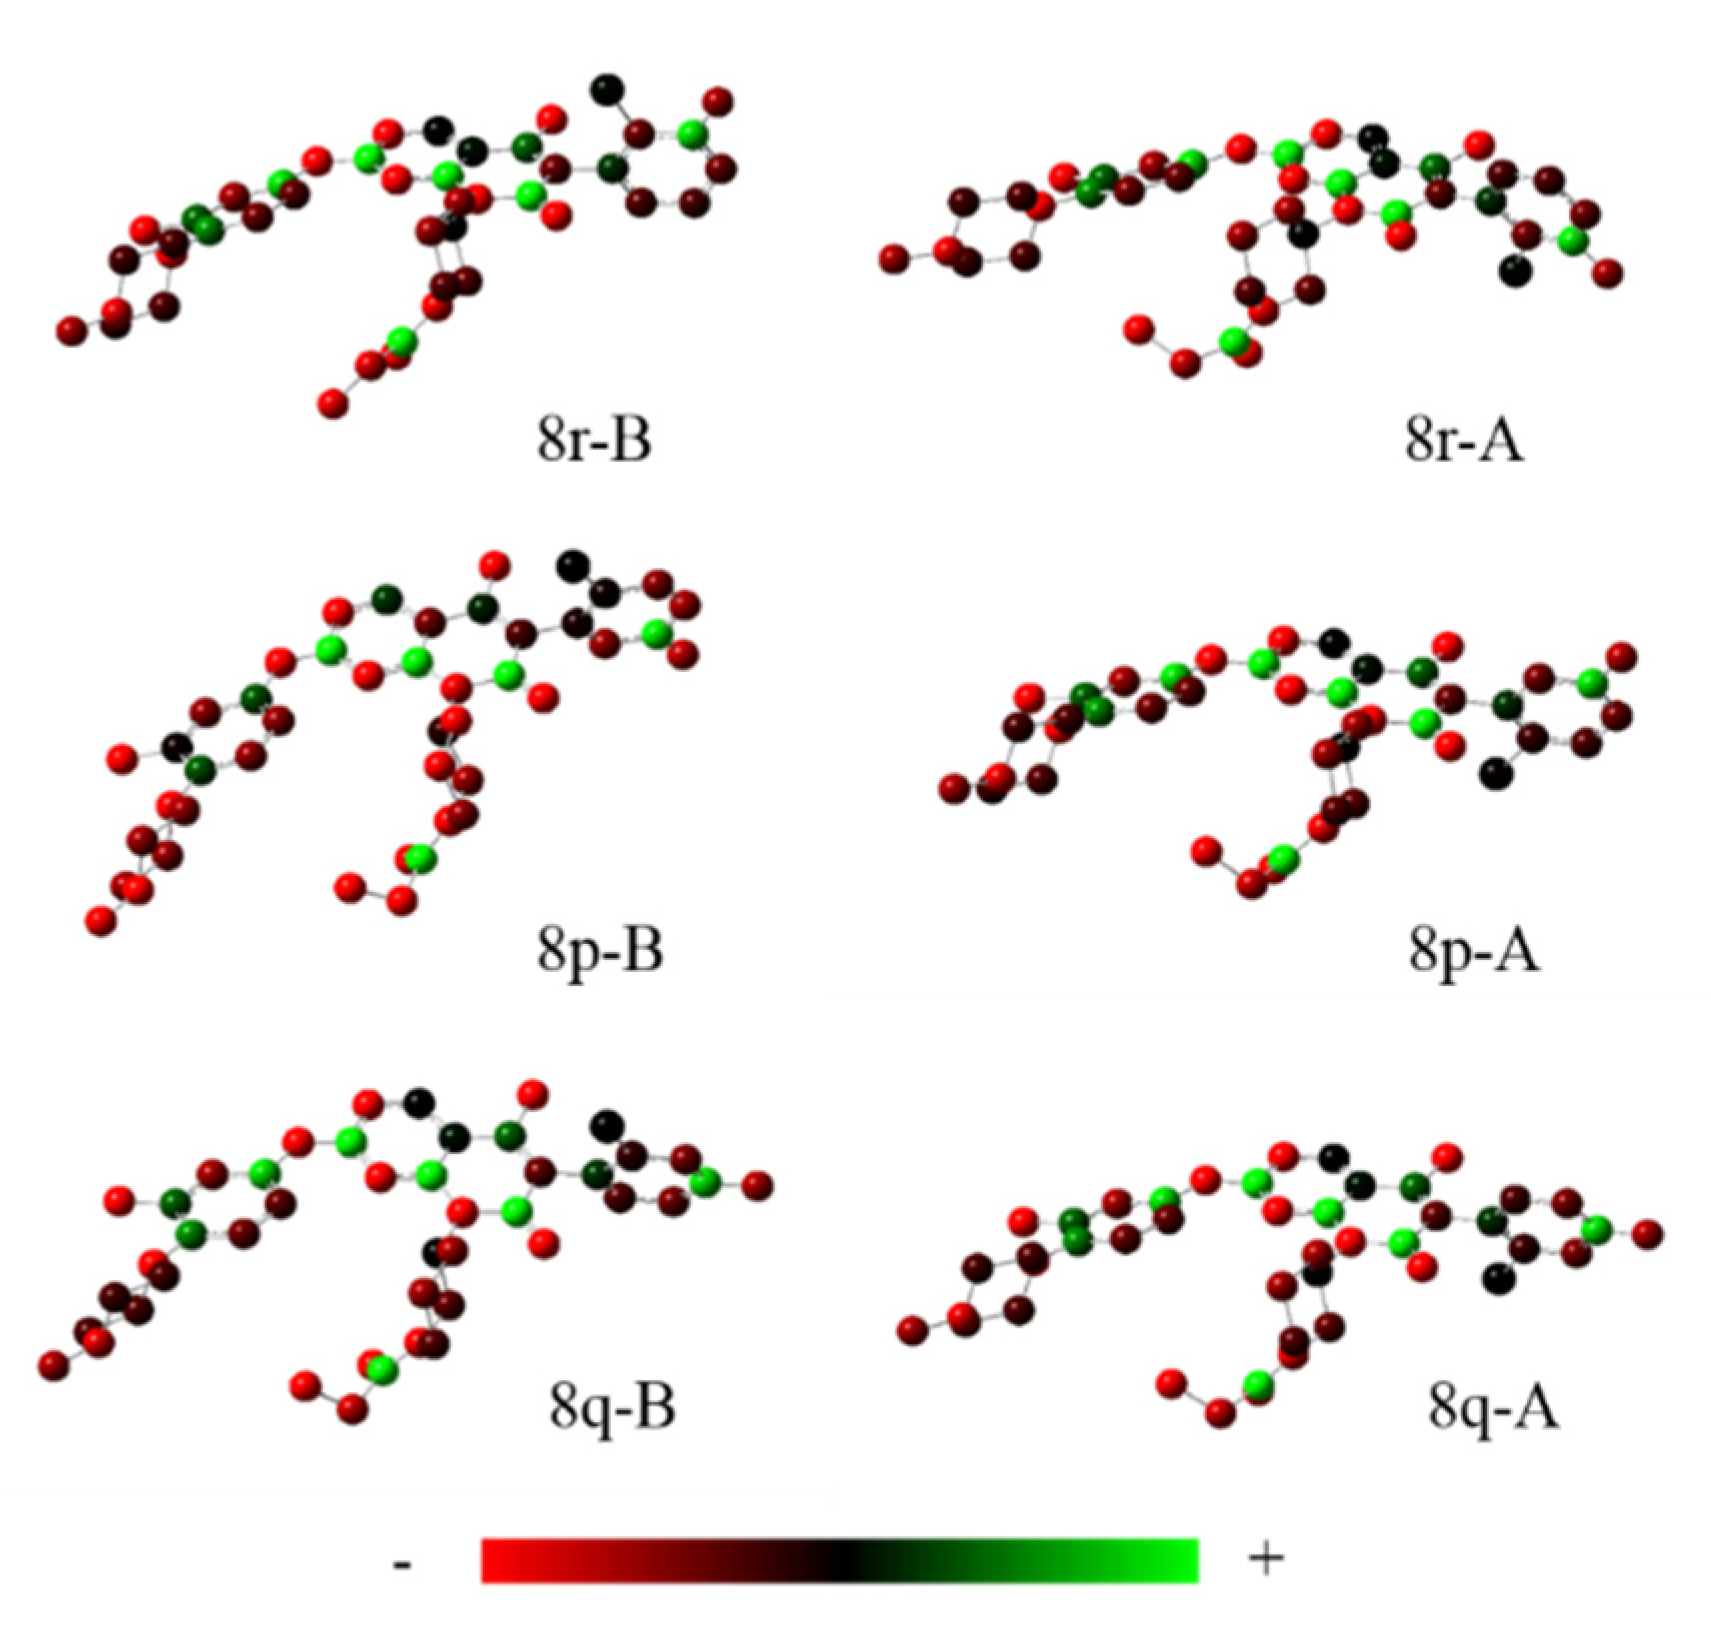
4.7. The Charge Distribution Analysis
4.8. Binding Free Energy Calculation
Supplementary Materials
Author Contributions
Funding
Conflicts of Interest
Abbreviations
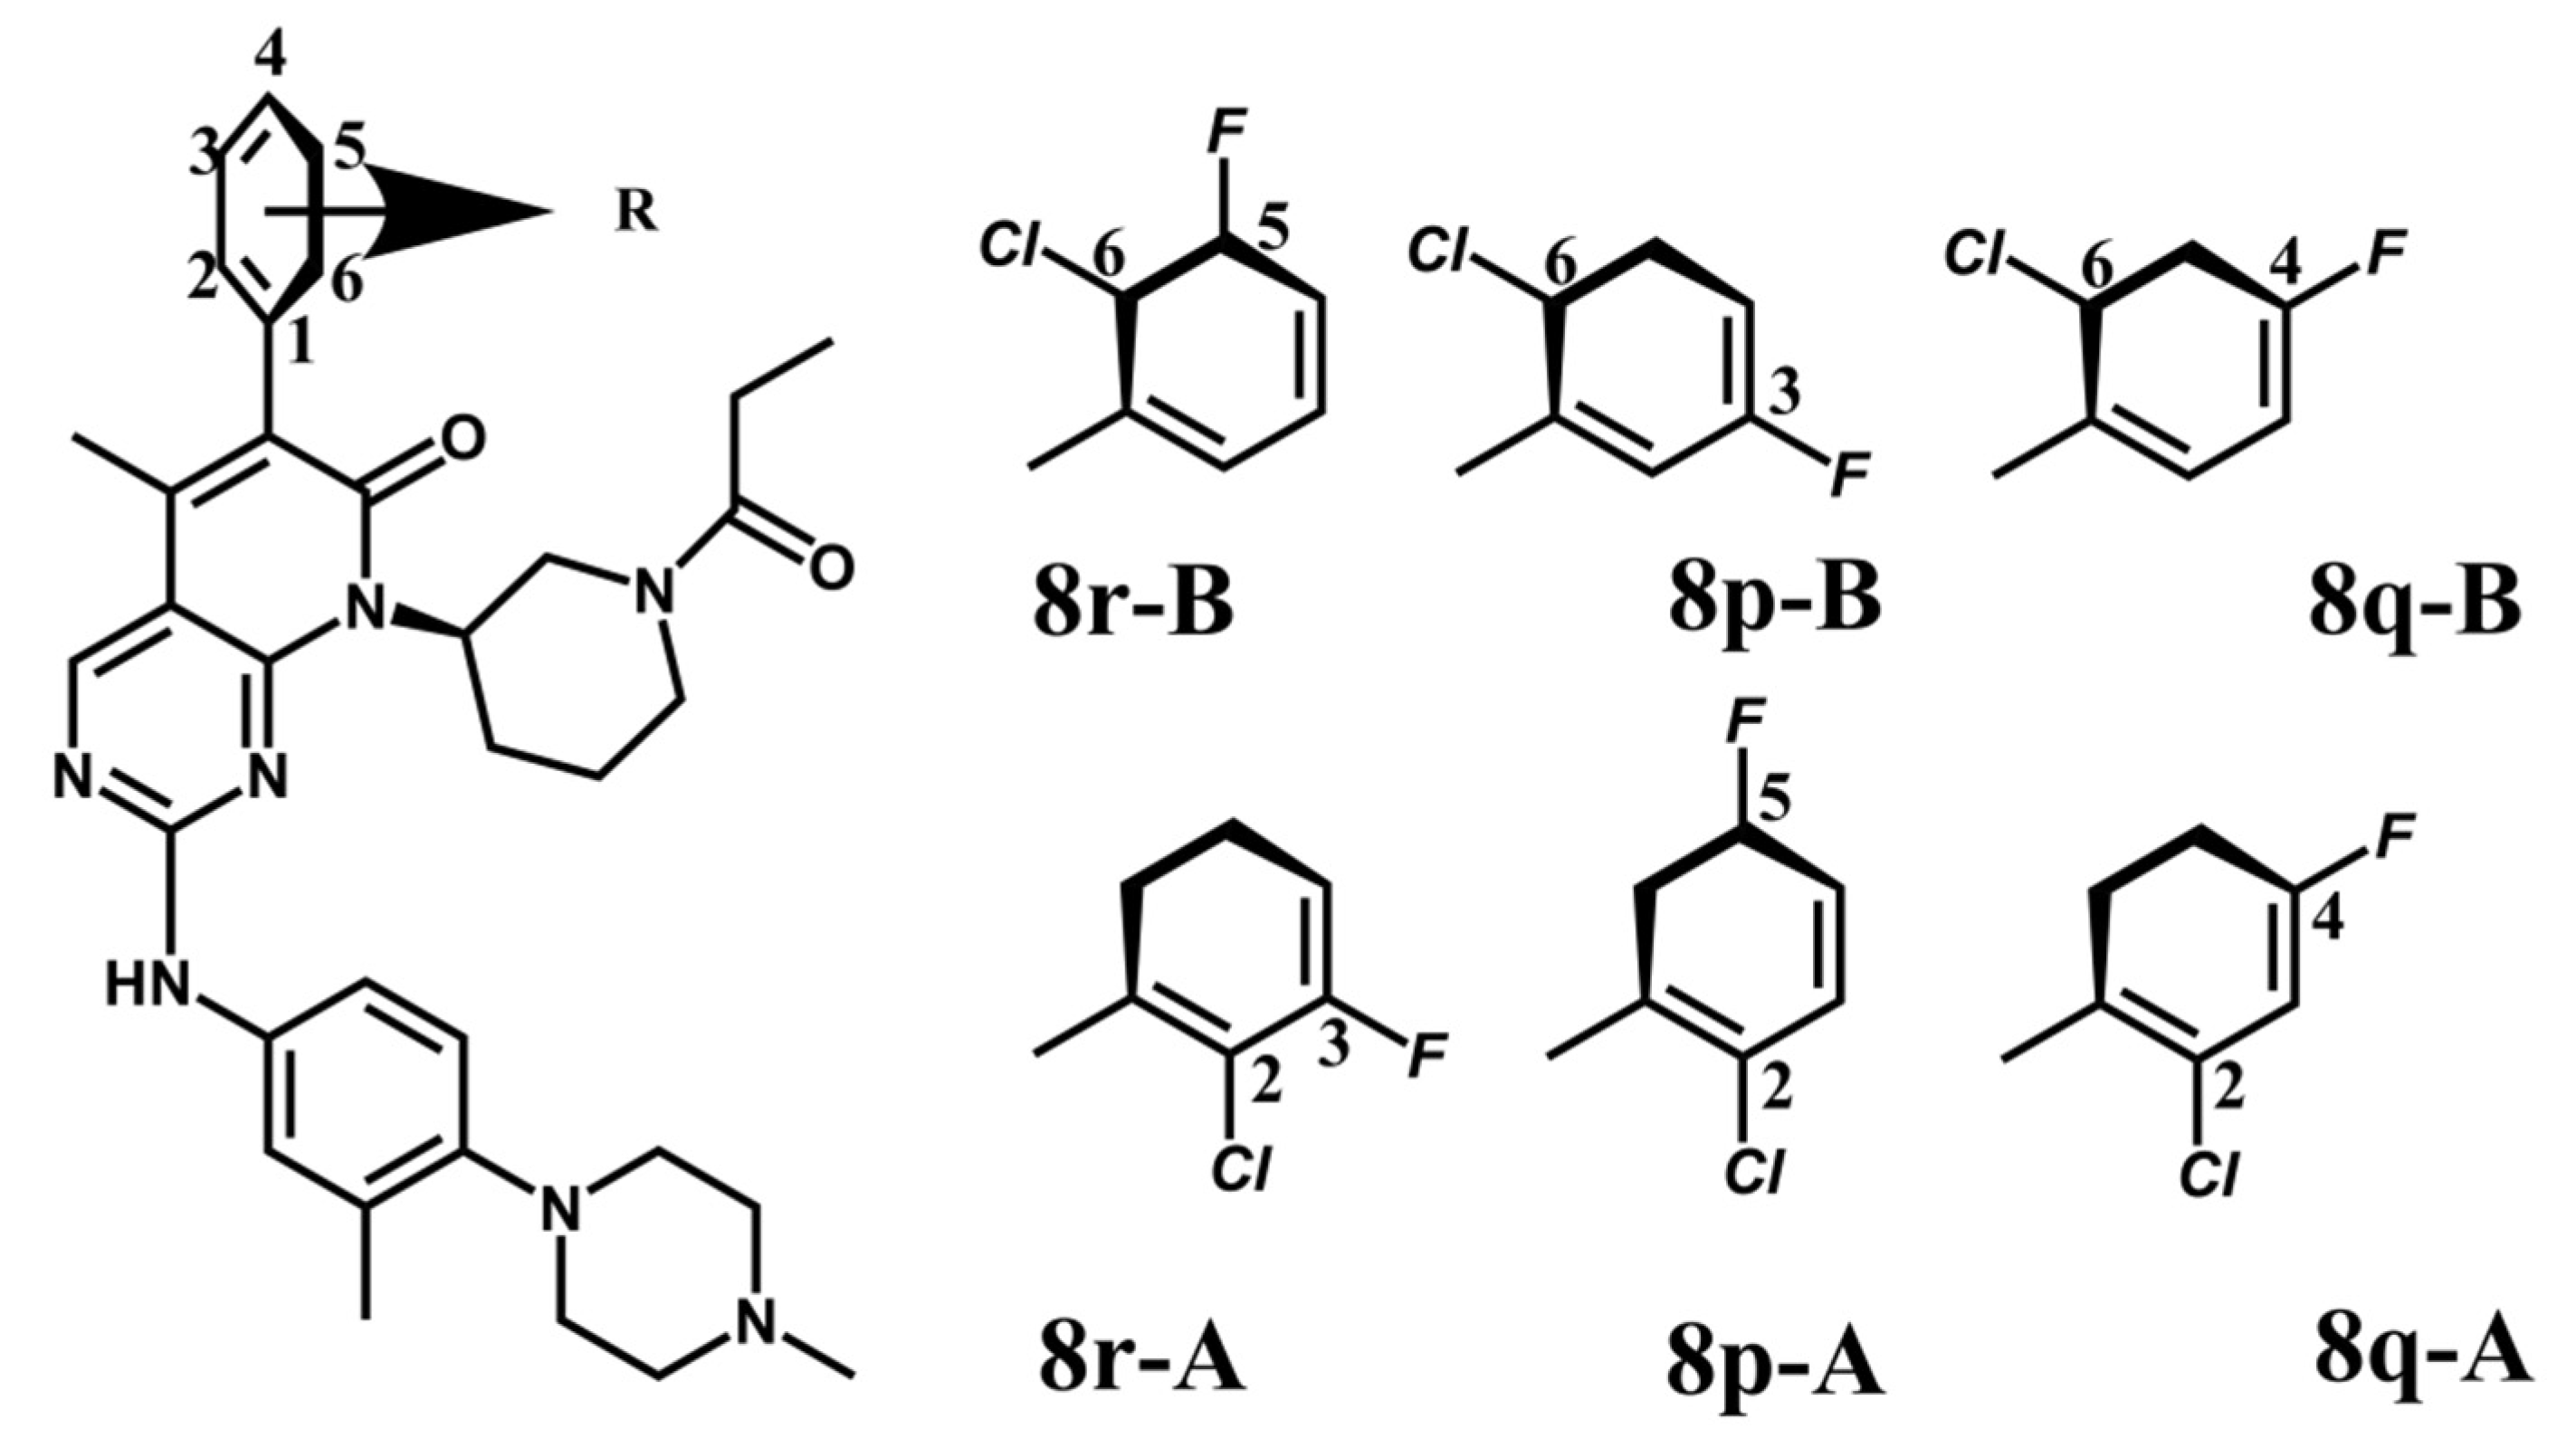
| 8p-A | (R)-6-(2-chloro-5-fluorophenyl)-5-methyl-2-((3-methyl-4-(4-methylpiperazin-1-yl)-phenyl)-amino)- 8-(1-propionylpiperidin-3-yl)-pyrido[2 ,3-d]-pyrimidin-7(8H)-one |
| 8p-B | (R)-6-(6-chloro-3-fluorophenyl)-5-methyl-2-((3-methyl-4-(4-methylpiperazin-1-yl)-phenyl)- amino)-8-(1-propionylpiperidin-3-yl)-pyrido[2,3-d]-pyrimidin-7(8H)-one |
| 8q-A | (R)-6-(2-chloro-4-fluorophenyl)-5-methyl-2-((3-methyl-4-(4-methylpiperazin-1-yl)-phenyl)- amino)-8-(1-propionylpiperidin-3-yl)-pyrido[2,3-d] pyrimidin-7(8H)-one |
| 8q-B | (R)-6-(6-chloro-4-fluorophenyl)-5-methyl-2-((3-methyl-4-(4-methylpiperazin-1-yl)-phenyl)- amino)-8-(1-propionylpiperidin-3-yl)-pyrido[2,3-d]-pyrimidin-7(8H)-one |
| 8r-A | (R)-6-(2-chloro-3-fluorophenyl)-5-methyl-2-((3-methyl-4-(4-methylpiperazin-1-yl)-phenyl)- amino)-8-(1-propionylpiperidin-3-yl)-pyrido[2,3-d]-pyrimidin-7(8H)-one |
| 8r-B | (R)-6-(6-chloro-5-fluorophenyl)-5-methyl-2-((3-methyl-4-(4-methylpiperazin-1-yl)-phenyl)- amino)-8-(1-propionylpiperidin-3-yl)pyrido[2,3-d]-pyrimidin-7(8H)-one |
References
- Mitchell, H.D.; Eisfeld, A.J.; Stratton, K.G.; Heller, N.C.; Bramer, L.M.; Wen, J.; McDermott, J.E.; Gralinski, L.E.; Sims, A.C.; Le, M.Q.; et al. The Role of EGFR in Influenza Pathogenicity: Multiple Network-Based Approaches to Identify a Key Regulator of Non-lethal Infections. Front. Cell Dev. Biol. 2019, 7, 200. [Google Scholar] [CrossRef] [PubMed]
- Shtivelman, E.; Hensing, T.; Simon, G.R.; Dennis, P.A.; Otterson, G.A.; Bueno, R.; Salgia, R. Molecular pathways and therapeutic targets in lung cancer. Oncotarget 2014, 5, 1392–1433. [Google Scholar] [CrossRef] [PubMed] [Green Version]
- Arteaga, C.L.; Engelman, J.A. ERBB receptors: From oncogene discovery to basic science to mechanism-based cancer therapeutics. Cancer Cell 2014, 25, 282–303. [Google Scholar] [CrossRef] [PubMed] [Green Version]
- Petit, A.; Rak, J.; Hung, M.-C.; Rockwell, P.; Goldstein, N.; Fendly, B.; Kerbel, R.S. Neutralizing antibodies against epidermal growth factor and ErbB-2/neu receptor tyrosine kinases down-regulate vascular endothelial growth factor production by tumor cells in vitro and in vivo: Angiogenic implications for signal transduction therapy of solid tumors. Am. J. Pathol. 1997, 151, 1523. [Google Scholar] [PubMed]
- Menezes, S.V.; Sahni, S.; Kovacevic, Z.; Richardson, D.R. Interplay of the iron-regulated metastasis suppressor NDRG1 with epidermal growth factor receptor (EGFR) and oncogenic signaling. J. Biol. Chem. 2017, 292, 12772–12782. [Google Scholar] [CrossRef] [PubMed] [Green Version]
- Hopper-Borge, E.A.; Nasto, R.E.; Ratushny, V.; Weiner, L.M.; Golemis, E.A.; Astsaturov, I. Mechanisms of tumor resistance to EGFR-targeted therapies. Expert Opin. Ther. Targets 2009, 13, 339–362. [Google Scholar] [CrossRef] [Green Version]
- Kharitonenkov, A.; Chen, Z.; Sures, I.; Wang, H.; Schilling, J.; Ullrich, A. A family of proteins that inhibit signalling through tyrosine kinase receptors. Nature 1997, 386, 181. [Google Scholar] [CrossRef]
- Sternberg, M.J.; Gullick, W.J. A sequence motif in the transmembrane region of growth factor receptors with tyrosine kinase activity mediates dimerization. Protein Eng. Design Select. 1990, 3, 245–248. [Google Scholar] [CrossRef]
- Jurisic, V.; Obradovic, J.; Pavlovic, S.; Djordjevic, N. Epidermal Growth Factor Receptor Gene in Non-Small-Cell Lung Cancer: The Importance of Promoter Polymorphism Investigation. Anal. Cell Pathol. 2018, 2018, 6192187. [Google Scholar] [CrossRef] [Green Version]
- Bhargava, R.; Gerald, W.L.; Li, A.R.; Pan, Q.; Lal, P.; Ladanyi, M.; Chen, B. EGFR gene amplification in breast cancer: correlation with epidermal growth factor receptor mRNA and protein expression and HER-2 status and absence of EGFR-activating mutations. Modern Pathol. 2005, 18, 1027. [Google Scholar] [CrossRef]
- Huang, L.; Fu, L. Mechanisms of resistance to EGFR tyrosine kinase inhibitors. Acta Pharm. Sinica B 2015, 5, 390–401. [Google Scholar] [CrossRef] [PubMed] [Green Version]
- Kennett, R.H.; MacKearn, T.J. Monoclonal Antibodies; Springer: New York, NY, USA, 1982. [Google Scholar]
- Adams, G.P.; Weiner, L.M. Monoclonal antibody therapy of cancer. Nature Biotechnol. 2005, 23, 1147. [Google Scholar] [CrossRef] [PubMed]
- Raymond, E.; Faivre, S.; Armand, J.P. Epidermal growth factor receptor tyrosine kinase as a target for anticancer therapy. Drugs 2000, 60, 15–23. [Google Scholar] [CrossRef] [PubMed]
- An, Z.; Aksoy, O.; Zheng, T.; Fan, Q.W.; Weiss, W.A. Epidermal growth factor receptor and EGFRvIII in glioblastoma: signaling pathways and targeted therapies. Oncogene 2018, 37, 1561–1575. [Google Scholar] [CrossRef]
- Seshacharyulu, P.; Ponnusamy, M.P.; Haridas, D.; Jain, M.; Ganti, A.K.; Batra, S.K. Targeting the EGFR signaling pathway in cancer therapy. Expert Opin. Ther. Targets 2012, 16, 15–31. [Google Scholar] [CrossRef] [Green Version]
- Yun, C.H.; Boggon, T.J.; Li, Y.; Woo, M.S.; Greulich, H.; Meyerson, M.; Eck, M.J. Structures of lung cancer-derived EGFR mutants and inhibitor complexes: mechanism of activation and insights into differential inhibitor sensitivity. Cancer Cell 2007, 11, 217–227. [Google Scholar] [CrossRef] [Green Version]
- Zhu, S.J.; Zhao, P.; Yang, J.; Ma, R.; Yan, X.E.; Yang, S.Y.; Yang, J.W.; Yun, C.H. Structural insights into drug development strategy targeting EGFR T790M/C797S. Oncotarget 2018, 9, 13652–13665. [Google Scholar] [CrossRef] [Green Version]
- Yun, C.H.; Mengwasser, K.E.; Toms, A.V.; Woo, M.S.; Greulich, H.; Wong, K.K.; Meyerson, M.; Eck, M.J. The T790M mutation in EGFR kinase causes drug resistance by increasing the affinity for ATP. Proc. Natl. Acad. Sci. USA 2008, 105, 2070–2075. [Google Scholar] [CrossRef] [Green Version]
- Sim, E.H.; Yang, I.A.; Wood-Baker, R.; Bowman, R.V.; Fong, K.M. Gefitinib for advanced non-small cell lung cancer. Cochrane Datab. Syst. Rev. 2018, 1, CD006847. [Google Scholar] [CrossRef] [Green Version]
- Masuda, C.; Yanagisawa, M.; Yorozu, K.; Kurasawa, M.; Furugaki, K.; Ishikura, N.; Iwai, T.; Sugimoto, M.; Yamamoto, K. Bevacizumab counteracts VEGF-dependent resistance to erlotinib in an EGFR-mutated NSCLC xenograft model. Int. J. Oncol. 2017, 51, 425–434. [Google Scholar] [CrossRef] [Green Version]
- Shi, Y.; Sun, Y.; Ding, C.; Wang, Z.; Wang, C.; Wang, Z.; Bai, C.; Bai, C.; Feng, J.; Liu, X.; et al. China experts consensus on icotinib for non-small cell lung cancer treatment (2015 version). J. Thorac. Dis. 2015, 7, E468–E472. [Google Scholar] [PubMed]
- Modjtahedi, H.; Cho, B.C.; Michel, M.C.; Solca, F. A comprehensive review of the preclinical efficacy profile of the ErbB family blocker afatinib in cancer. Naunyn Schmiedebergs Arch. Pharmacol. 2014, 387, 505–521. [Google Scholar] [CrossRef] [PubMed] [Green Version]
- Williams, J.P.; Kim, I.; Ito, E.; Shi, W.; Yue, S.; Siu, L.L.; Waldron, J.; O’Sullivan, B.; Yip, K.W.; Liu, F.F. Pre-clinical characterization of Dacomitinib (PF-00299804), an irreversible pan-ErbB inhibitor, combined with ionizing radiation for head and neck squamous cell carcinoma. PLoS ONE 2014, 9, e98557. [Google Scholar] [CrossRef] [PubMed]
- Zhao, X.Q.; Xie, J.D.; Chen, X.G.; Sim, H.M.; Zhang, X.; Liang, Y.J.; Singh, S.; Talele, T.T.; Sun, Y.; Ambudkar, S.V.; et al. Neratinib reverses ATP-binding cassette B1-mediated chemotherapeutic drug resistance in vitro, in vivo, and ex vivo. Mol. Pharmacol. 2012, 82, 47–58. [Google Scholar] [CrossRef] [Green Version]
- Wang, S.; Song, Y.; Liu, D. EAI045: The fourth-generation EGFR inhibitor overcoming T790M and C797S resistance. Cancer Lett. 2017, 385, 51–54. [Google Scholar] [CrossRef]
- Patel, H.; Pawara, R.; Ansari, A.; Surana, S. Recent updates on third generation EGFR inhibitors and emergence of fourth generation EGFR inhibitors to combat C797S resistance. Eur. J. Med. Chem. 2017, 142, 32–47. [Google Scholar] [CrossRef]
- Jia, Y.; Yun, C.H.; Park, E.; Ercan, D.; Manuia, M.; Juarez, J.; Xu, C.; Rhee, K.; Chen, T.; Zhang, H.; et al. Overcoming EGFR(T790M) and EGFR(C797S) resistance with mutant-selective allosteric inhibitors. Nature 2016, 534, 129–132. [Google Scholar] [CrossRef] [Green Version]
- Uchibori, K.; Inase, N.; Araki, M.; Kamada, M.; Sato, S.; Okuno, Y.; Fujita, N.; Katayama, R. Brigatinib combined with anti-EGFR antibody overcomes osimertinib resistance in EGFR-mutated non-small-cell lung cancer. Nat. Commun. 2017, 8, 14768. [Google Scholar] [CrossRef] [Green Version]
- Shen, J.; Zhang, T.; Zhu, S.J.; Sun, M.; Tong, L.; Lai, M.; Zhang, R.; Xu, W.; Wu, R.; Ding, J.; et al. Structure-Based Design of 5-Methylpyrimidopyridone Derivatives as New Wild-Type Sparing Inhibitors of the Epidermal Growth Factor Receptor Triple Mutant (EGFR(L858R/T790M/C797S)). J. Med. Chem. 2019, 62, 7302–7308. [Google Scholar] [CrossRef]
- Yamaoka, T.; Kusumoto, S.; Ando, K.; Ohba, M.; Ohmori, T. Receptor Tyrosine Kinase-Targeted Cancer Therapy. Int J. Mol. Sci. 2018, 19, 3491. [Google Scholar] [CrossRef] [Green Version]
- Jang, J.; Son, J.; Park, E.; Kosaka, T.; Saxon, J.A.; De Clercq, D.J.H.; Choi, H.G.; Tanizaki, J.; Eck, M.J.; Janne, P.A.; et al. Discovery of a Highly Potent and Broadly Effective Epidermal Growth Factor Receptor and HER2 Exon 20 Insertion Mutant Inhibitor. Angew. Chem. Int. Ed. 2018, 57, 11629–11633. [Google Scholar] [CrossRef] [PubMed]
- Cuneo, K.C.; Nyati, M.K.; Ray, D.; Lawrence, T.S. EGFR targeted therapies and radiation: Optimizing efficacy by appropriate drug scheduling and patient selection. Pharmacol. Ther. 2015, 154, 67–77. [Google Scholar] [CrossRef] [PubMed] [Green Version]
- Yan, X.E.; Zhu, S.J.; Liang, L.; Zhao, P.; Choi, H.G.; Yun, C.H. Structural basis of mutant-selectivity and drug-resistance related to CO-1686. Oncotarget 2017, 8, 53508–53517. [Google Scholar] [CrossRef] [PubMed] [Green Version]
- Callegari, D.; Ranaghan, K.E.; Woods, C.J.; Minari, R.; Tiseo, M.; Mor, M.; Mulholland, A.J.; Lodola, A. L718Q mutant EGFR escapes covalent inhibition by stabilizing a non-reactive conformation of the lung cancer drug osimertinib. Chem. Sci. 2018, 9, 2740–2749. [Google Scholar] [CrossRef] [Green Version]
- Cross, D.A.; Ashton, S.E.; Ghiorghiu, S.; Eberlein, C.; Nebhan, C.A.; Spitzler, P.J.; Orme, J.P.; Finlay, M.R.; Ward, R.A.; Mellor, M.J.; et al. AZD9291, an irreversible EGFR TKI, overcomes T790M-mediated resistance to EGFR inhibitors in lung cancer. Cancer Discov. 2014, 4, 1046–1061. [Google Scholar] [CrossRef] [Green Version]
- Costa, D.B.; Kobayashi, S.S. Whacking a mole-cule: clinical activity and mechanisms of resistance to third generation EGFR inhibitors in EGFR mutated lung cancers with EGFR-T790M. Transl. Lung Cancer Res. 2015, 4, 809–815. [Google Scholar]
- Park, H.; Jung, H.-Y.; Mah, S.; Hong, S. Discovery of EGF Receptor Inhibitors That Are Selective for the d746-750/T790M/C797S Mutant through Structure-Based de Novo Design. Angew. Chem. Int. Ed. 2017, 56, 7634–7638. [Google Scholar] [CrossRef]
- Yu, L.; Huang, M.; Xu, T.; Tong, L.; Yan, X.E.; Zhang, Z.; Xu, Y.; Yun, C.; Xie, H.; Ding, K.; et al. A structure-guided optimization of pyrido[2,3-d]pyrimidin-7-ones as selective inhibitors of EGFR(L858R/T790M) mutant with improved pharmacokinetic properties. Eur. J. Med. Chem. 2017, 126, 1107–1117. [Google Scholar] [CrossRef]
- To, C.; Jang, J.; Chen, T.; Park, E.; Mushajiang, M.; De Clercq, D.J.H.; Xu, M.; Wang, S.; Cameron, M.D.; Heppner, D.E.; et al. Single and Dual Targeting of Mutant EGFR with an Allosteric Inhibitor. Cancer Discov. 2019, 9, 926–943. [Google Scholar] [CrossRef] [Green Version]
- Wan, S.; Yan, R.; Jiang, Y.; Li, Z.; Zhang, J.; Wu, X. Insight into binding mechanisms of EGFR allosteric inhibitors using molecular dynamics simulations and free energy calculations. J. Biomol. Struct. Dyn. 2019, 37, 4384–4394. [Google Scholar] [CrossRef]
- Akher, F.B.; Farrokhzadeh, A.; Soliman, M.E.S. Noteworthy effect of slight variation in aliphatic chain length of trisubstituted imidazole inhibitors against epidermal growth factor receptor L858R/T790M/C797S mutant in cancer therapy. Chem. Biol. Drug Des. 2019, 93, 798–810. [Google Scholar] [CrossRef] [PubMed]
- Li, Q.; Zhang, T.; Li, S.; Tong, L.; Li, J.; Su, Z.; Feng, F.; Sun, D.; Tong, Y.; Wang, X.; et al. Discovery of Potent and Noncovalent Reversible EGFR Kinase Inhibitors of EGFR(L858R/T790M/C797S). ACS Med. Chem. Lett. 2019, 10, 869–873. [Google Scholar] [CrossRef] [PubMed]
- Mitra, A.; Sept, D. Taxol allosterically alters the dynamics of the tubulin dimer and increases the flexibility of microtubules. Biophys. J. 2008, 95, 3252–3258. [Google Scholar] [CrossRef] [PubMed] [Green Version]
- Zhan, D.; Guan, S.; Jin, H.; Han, W.; Wang, S. Stereoselectivity of phosphotriesterase with paraoxon derivatives: a computational study. J. Biomol. Struct. Dynam. 2016, 34, 600–611. [Google Scholar] [CrossRef]
- Jain, A.K. Data clustering: 50 years beyond K-means. Pattern Recogn. Lett. 2010, 31, 651–666. [Google Scholar] [CrossRef]
- Dixit, A.; Verkhivker, G.M. Hierarchical modeling of activation mechanisms in the ABL and EGFR kinase domains: Thermodynamic and mechanistic catalysts of kinase activation by cancer mutations. PLoS Comput. Biol. 2009, 5, e1000487. [Google Scholar] [CrossRef]
- Ju, Y.; Wu, J.; Yuan, X.; Zhao, L.; Zhang, G.; Li, C.; Qiao, R. Design and Evaluation of Potent EGFR Inhibitors through the Incorporation of Macrocyclic Polyamine Moieties into the 4-Anilinoquinazoline Scaffold. J. Med. Chem. 2018, 61, 11372–11383. [Google Scholar] [CrossRef]
- Pauling, L. General Chemistry; Courier Corporation: North Chelmsford, MA, USA, 1988. [Google Scholar]
- Chovancova, E.; Pavelka, A.; Benes, P.; Strnad, O.; Brezovsky, J.; Kozlikova, B.; Gora, A.; Sustr, V.; Klvana, M.; Medek, P.; et al. CAVER 3.0: A tool for the analysis of transport pathways in dynamic protein structures. PLoS Comput. Biol. 2012, 8, e1002708. [Google Scholar] [CrossRef] [Green Version]
- Maisuradze, G.G.; Liwo, A.; Scheraga, H.A. Relation between free energy landscapes of proteins and dynamics. J. Chem. Theory Comput. 2010, 6, 583–595. [Google Scholar] [CrossRef] [Green Version]
- Pavelka, A.; Sebestova, E.; Kozlikova, B.; Brezovsky, J.; Sochor, J.; Damborsky, J. CAVER: Algorithms for Analyzing Dynamics of Tunnels in Macromolecules. IEEE/ACM Trans. Comput. Biol. Bioinform. 2016, 13, 505–517. [Google Scholar] [CrossRef]
- Liu, Y.; Wan, Y.; Zhu, J.; Li, M.; Yu, Z.; Han, J.; Zhang, Z.; Han, W. Exploration of Catalytic Selectivity for Aminotransferase (BtrR) Based on Multiple Molecular Dynamics Simulations. Int. J. Mol. Sci. 2019, 20, 1188. [Google Scholar] [CrossRef] [PubMed] [Green Version]
- Liu, Y.; Yu, Z.; Zhu, J.; Wang, S.; Xu, D.; Han, W. Why Is a High Temperature Needed by Thermus thermophilus Argonaute During mRNA Silencing: A Theoretical Study. Front. Chem. 2018, 6, 223. [Google Scholar] [CrossRef] [PubMed] [Green Version]
- Hou, T.; Li, N.; Li, Y.; Wang, W. Characterization of domain-peptide interaction interface: prediction of SH3 domain-mediated protein-protein interaction network in yeast by generic structure-based models. J. Proteome Res. 2012, 11, 2982–2995. [Google Scholar] [CrossRef] [PubMed]
- Hou, T.; Wang, J.; Li, Y.; Wang, W. Assessing the performance of the molecular mechanics/Poisson Boltzmann surface area and molecular mechanics/generalized Born surface area methods. II. The accuracy of ranking poses generated from docking. J. Comput. Chem. 2011, 32, 866–877. [Google Scholar] [CrossRef] [Green Version]
- Xu, L.; Sun, H.; Li, Y.; Wang, J.; Hou, T. Assessing the performance of MM/PBSA and MM/GBSA methods. 3. The impact of force fields and ligand charge models. J. Phys. Chem. B 2013, 117, 8408–8421. [Google Scholar] [CrossRef]
- Studio, D. 4.0 Tutorials. In Receptor-Ligand Interaction; Accelrys Inc.: San Diego, CA, USA, 2013. [Google Scholar]
- Hess, B.; Kutzner, C.; van der Spoel, D.; Lindahl, E. GROMACS 4: Algorithms for Highly Efficient, Load-Balanced, and Scalable Molecular Simulation. J. Chem. Theory Comput. 2008, 4, 435–447. [Google Scholar] [CrossRef] [Green Version]
- Ahmad, G.; Rasool, N.; Ikram, H.; Gul Khan, S.; Mahmood, T.; Ayub, K.; Zubair, M.; Al-Zahrani, E.; Ali Rana, U.; Akhtar, M. Efficient synthesis of novel pyridine-based derivatives via Suzuki cross-coupling reaction of commercially available 5-Bromo-2-methylpyridin-3-amine: quantum mechanical investigations and biological activities. Molecules 2017, 22, 190. [Google Scholar] [CrossRef] [Green Version]
- Rizvi, S.M.D.; Shakil, S.; Haneef, M. A simple click by click protocol to perform docking: AutoDock 4.2 made easy for non-bioinformaticians. EXCLI J. 2013, 12, 831. [Google Scholar]
- Wang, R.; Lai, L.; Wang, S. Further development and validation of empirical scoring functions for structure-based binding affinity prediction. J. Comput. Aid. Mol. Des. 2002, 16, 11–26. [Google Scholar] [CrossRef]
- Trott, O.; Olson, A.J. AutoDock Vina: Improving the speed and accuracy of docking with a new scoring function, efficient optimization, and multithreading. J. Comput. Chem. 2010, 31, 455–461. [Google Scholar] [CrossRef] [Green Version]
- Quiroga, R.; Villarreal, M.A. Vinardo: A scoring function based on autodock vina improves scoring, docking, and virtual screening. PLoS ONE 2016, 11, e0155183. [Google Scholar] [CrossRef] [PubMed] [Green Version]
- Lindorff-Larsen, K.; Piana, S.; Palmo, K.; Maragakis, P.; Klepeis, J.L.; Dror, R.O.; Shaw, D.E. Improved side-chain torsion potentials for the Amber ff99SB protein force field. Proteins Struct. Funct. Bioinform. 2010, 78, 1950–1958. [Google Scholar] [CrossRef] [PubMed] [Green Version]
- Case, D.A.; Babin, V.; Berryman, J.; Betz, R.; Cai, Q.; Cerutti, D.; Cheatham Iii, T.; Darden, T.; Duke, R.; Gohlke, H. Amber 14; University of California: San Francisco, CA, USA, 2014. [Google Scholar]
- Dickson, C.J.; Rosso, L.; Betz, R.M.; Walker, R.C.; Gould, I.R. GAFFlipid: A General Amber Force Field for the accurate molecular dynamics simulation of phospholipid. Soft Matter 2012, 8, 9617–9627. [Google Scholar] [CrossRef]
- Hess, B.; van der Vegt, N.F. Hydration thermodynamic properties of amino acid analogues: A systematic comparison of biomolecular force fields and water models. J. Phys. Chem. B 2006, 110, 17616–17626. [Google Scholar] [CrossRef]
- Qian, M.; Guan, S.; Shan, Y.; Zhang, H.; Wang, S. Structural and molecular basis of cellulase Cel48F by computational modeling: Insight into catalytic and product release mechanism. J. Struct. Biol. 2016, 194, 347–356. [Google Scholar] [CrossRef]
- Sun, X.; Qian, M.D.; Guan, S.S.; Shan, Y.M.; Dong, Y.; Zhang, H.; Wang, S.; Han, W.W. Investigation of an “alternate water supply system” in enzymatic hydrolysis in the processive endocellulase Cel7A from Rasamsonia emersonii by molecular dynamics simulation. Biopolymers 2017, 107, 46–60. [Google Scholar] [CrossRef]
- Zhang, H.; Zhang, J.L.; Sun, L.; Niu, X.D.; Wang, S.; Shan, Y.M. Molecular dynamics simulation of the processive endocellulase Cel48F from Clostridium cellulolyticum: A novel “water-control mechanism” in enzymatic hydrolysis of cellulose. J. Mol. Recognit. 2014, 27, 438–447. [Google Scholar] [CrossRef]
- Grant, B.J.; Rodrigues, A.P.; ElSawy, K.M.; McCammon, J.A.; Caves, L.S. Bio3d: An R package for the comparative analysis of protein structures. Bioinformatics 2006, 22, 2695–2696. [Google Scholar] [CrossRef] [Green Version]
- Skjærven, L.; Yao, X.-Q.; Scarabelli, G.; Grant, B.J. Integrating protein structural dynamics and evolutionary analysis with Bio3D. BMC Bioinform. 2014, 15, 399. [Google Scholar] [CrossRef] [Green Version]
- Hünenberger, P.; Mark, A.; Van Gunsteren, W. Fluctuation and cross-correlation analysis of protein motions observed in nanosecond molecular dynamics simulations. J. Mol. Biol. 1995, 252, 492–503. [Google Scholar] [CrossRef] [Green Version]
- Liu, Y.; Wan, Y.; Zhu, J.; Yu, Z.; Tian, X.; Han, J.; Zhang, Z.; Han, W. Theoretical Study on Zearalenol Compounds Binding with Wild Type Zearalenone Hydrolase and V153H Mutant. Int. J. Mol. Sci. 2018, 19, 2808. [Google Scholar] [CrossRef] [PubMed] [Green Version]
- Han, F.; Liu, Y.; E, J.; Guan, S.; Han, W.; Shan, Y.; Wang, S.; Zhang, H. Effects of Tyr555 and Trp678 on the processivity of cellobiohydrolase A from Ruminiclostridium thermocellum: A simulation study. Biopolymers 2018, 109, e23238. [Google Scholar] [CrossRef] [PubMed]
- Huang, H.; Han, F.; Guan, S.; Qian, M.; Wan, Y.; Shan, Y.; Zhang, H.; Wang, S. Insight into the process of product expulsion in cellobiohydrolase Cel6A from Trichoderma reesei by computational modeling. J. Biomol. Struct. Dyn. 2019, 37, 1360–1374. [Google Scholar] [CrossRef]
- Jain, A.K.; Murty, M.N.; Flynn, P.J. Data clustering: a review. ACM Comput. Surv. 1999, 31, 264–323. [Google Scholar] [CrossRef]
- Fukuzumi, S.; Wong, C.; Kochi, J. Unified view of Marcus electron transfer and Mulliken charge transfer theories in organometallic chemistry. Steric effects in alkylmetals as quantitative probes for outer-sphere and inner-sphere mechanisms. J. Am. Chem. Soc. 1980, 102, 2928–2939. [Google Scholar] [CrossRef]
- Zhong, R.L.; Xu, H.L.; Sun, S.L.; Qiu, Y.Q.; Su, Z.M. The excess electron in a boron nitride nanotube: pyramidal NBO charge distribution and remarkable first hyperpolarizability. Chemistry 2012, 18, 11350–11355. [Google Scholar] [CrossRef]
- Dupradeau, F.-Y.; Pigache, A.; Zaffran, T.; Savineau, C.; Lelong, R.; Grivel, N.; Lelong, D.; Rosanski, W.; Cieplak, P. The REd. Tools: Advances in RESP and ESP charge derivation and force field library building. Phys. Chem. Chem. Phys. 2010, 12, 7821–7839. [Google Scholar] [CrossRef] [Green Version]
- Lu, T.; Chen, F. Multiwfn: a multifunctional wavefunction analyzer. J. Comput. Chem. 2012, 33, 580–592. [Google Scholar] [CrossRef]
- Guan, S.S.; Han, W.W.; Zhang, H.; Wang, S.; Shan, Y.M. Insight into the interactive residues between two domains of human somatic Angiotensin-converting enzyme and Angiotensin II by MM-PBSA calculation and steered molecular dynamics simulation. J. Biomol. Struct. Dyn. 2016, 34, 15–28. [Google Scholar] [CrossRef]
- Sun, H.; Li, Y.; Shen, M.; Tian, S.; Xu, L.; Pan, P.; Guan, Y.; Hou, T. Assessing the performance of MM/PBSA and MM/GBSA methods. 5. Improved docking performance using high solute dielectric constant MM/GBSA and MM/PBSA rescoring. Phys. Chem. Chem. Phys. 2014, 16, 22035–22045. [Google Scholar] [CrossRef]
- Sun, H.; Li, Y.; Tian, S.; Xu, L.; Hou, T. Assessing the performance of MM/PBSA and MM/GBSA methods. 4. Accuracies of MM/PBSA and MM/GBSA methodologies evaluated by various simulation protocols using PDBbind data set. Phys. Chem. Chem. Phys. 2014, 16, 16719–16729. [Google Scholar] [CrossRef] [PubMed]
Sample Availability: Date are available from the corresponding authors upon reasonable request. |


| Generations of Inhibitors | Name | Research and Development Status | Primary Treatment | Key Achievements | Drawbacks |
|---|---|---|---|---|---|
| First | Iressa  | approved in 2003 | Deletion in exon 19 (62.2%) and L858R (37.8%) [31,32] | Reversible bind to the mutated substrate pocket, competitive ATP catalytic region of EGFR-TK on binding cell surface | Focused on combining with other therapies [33], easy to occur secondary acquired drug resistance mutations, such as T790M. The incidence of side effects such as rash and diarrhea is high. |
Taeceva  | approved in 2004 | ||||
Conmana  | approved in 2011 | ||||
| Second | Giotrif  | approved in 2013 | Approximately 60% of the EGFR gene undergoes a secondary mutation T790M in exon 20 | Electrophilic Michael receptor radical group irreversible bind to the mutated substrate pocket with the nucleophilic Cys797, which leads to inhibition of ATP binding | Lack of selectivity for mutant and wild type, the incidence of side effects such as rash and diarrhea, nausea, fatigue. |
Dacomitibib  | phase Ⅲ | ||||
Neratinib  | phase Ⅲ | ||||
| Third | Rociletinib  | phase I/II | L858R/T790M [34,35,36,37] | The inhibition of mutant protein was higher than that of wild-type protein | Easy to cause hyperglycemia (53%) |
Osimertinib  | phase I/II | Side effects include diarrhea (47%), nausea (22%), rash, and hemorrhoids (40%) | |||
| Fourth | EAI045  | designed in 2016, under clinical test | L858R/T790M/C797S | Allosteric noncompetitive inhibitors | Needs to be combined with EGFR monoclonal antibody |
Brigatinib  | designed in 2017, under clinical test | Belongs to double-target reversible small molecule inhibitor | Dual-target combination therapy, not easy to control |
| Complex | EGFRTM_8r-B | EGFRTM_8r-A | EGFRTM_8p-B | EGFRTM_8p-A | EGFRTM_8q-B | EGFRTM_8q-A |
|---|---|---|---|---|---|---|
| RMSD (nm) | 0.14 | 0.29 | 0.24 | 0.20 | 0.21 | 0.23 |
| Affinity(kcal/mol) | −10.9 | −8.0 | −10.2 | −8.7 | −10.7 | −8.8 |
| Donor | Acceptor | 8r-B | 8r-A | 8p-B | 8p-A | 8q-B | 8q-A |
|---|---|---|---|---|---|---|---|
| Met793@N | lig@N4 | 75.53% | 66.53% | 75.32% | 76.12% | 73.53% | 72.43% |
| lig@N11 | Met793@O | 76.32% | 62.44% | 72.43% | 69.93% | 74.23% | 68.03% |
| average hydrogen bond number | 2.05 | 1.99 | 2.09 | 1.95 | 1.89 | 2.00 | |
| Inhibitors | 8r-B | 8r-A | 8p-B | 8p-A | 8q-B | 8q-A | |
|---|---|---|---|---|---|---|---|
| RESP charge (e) | F | −0.278 | −0.282 | −0.276 | −0.279 | −0.273 | −0.270 |
| Cl | −0.072 | −0.066 | −0.108 | −0.102 | −0.100 | −0.095 | |
| Mulliken charge (e) | F | −0.277 | −0.277 | −0.295 | −0.296 | −0.293 | −0.293 |
| Cl | +0.014 | +0.014 | −0.012 | −0.012 | −0.004 | −0.006 | |
| NBO charge (e) | F | −0.322 | −0.322 | −0.331 | −0.331 | −0.329 | −0.329 |
| Cl | 0.021 | +0.019 | −0.002 | −0.004 | +0.005 | +0.002 | |
| Atom | C | Cl | F | H |
|---|---|---|---|---|
| RvdW (Å) | 1.72 | 1.80 | 1.35 | 1.10 |
| EGFRTM | 8r-B | 8r-A | 8p-B | 8p-A | 8q-B | 8q-A |
|---|---|---|---|---|---|---|
| K745@NZ-L762@OE2 | 5.52 | 7.15 | 6.53 | 5.75 | 5.85 | 5.93 |
| K745@NZ-ligand@F | 4.20 | 4.63 | 5.03 | 5.20 | 4.91 | 5.21 |
| Energy Term | 8r-B | 8r-A | 8p-B | 8p-A | 8q-B | 8q-A |
|---|---|---|---|---|---|---|
| IC50 (nM) | 27.5 ± 11.6 | >1000 | 37.1 ± 1.2 | 207.0 ± 135.0 | 88.6 ± 13.3 | 224.1 ± 6.7 |
| ΔGvdW | −285.88 ± 3.47 | −260.23 ± 1.69 | −279.78 ± 0.96 | −261.40 ± 1.96 | −258.41 ± 1.72 | −254.67 ± 1.59 |
| ΔGelec | −107.63 ± 1.70 | −99.30 ± 2.93 | −93.06 ± 1.28 | −102.59 ± 2.85 | −85.20 ± 2.55 | −91.48 ± 2.10 |
| ΔGPB | 177.89 ± 1.94 | 180.51 ± 3.31 | 177.06 ± 1.18 | 177.34 ± 2.88 | 151.13 ± 2.05 | 161.00 ± 2.16 |
| ΔGnp | −26.26 ± 0.31 | −24.99 ± 0.19 | −25.80 ± 0.08 | −24.57 ± 0.14 | −24.40 ± 0.14 | −24.12 ± 0.16 |
| ΔGpolar a | 70.26 ± 3.64 | 81.21 ± 6.24 | 84.00 ± 2.46 | 74.75 ± 5.73 | 65.94 ± 4.60 | 69.52 ± 4.26 |
| ΔGnonpolar b | −312.14 ± 3.78 | −285.23 ± 1.88 | −305.58 ± 1.04 | −285.97 ± 2.1 | −282.81 ± 1.86 | −278.79 ± 1.75 |
| ΔGbind c | −241.80 ± 3.44 | −203.63 ± 3.57 | −221.46 ± 1.41 | −210.81 ± 2.56 | −216.94 ± 2.42 | −208.93 ± 2.75 |
| Energy Term | 8r-B | 8r-A | 8p-B | 8p-A | 8q-B | 8q-A |
|---|---|---|---|---|---|---|
| IC50 (nM) | 27.5 ± 11.6 | >1000 | 37.1 ± 1.2 | 207.0 ± 135.0 | 88.6 ± 13.3 | 224.1 ± 6.7 |
| Val726 | −10.27 a | −7.90 | −9.54 | −8.21 | −9.61 | −7.98 |
| 1.48 b | 1.47 | 1.41 | 1.68 | 1.52 | 1.42 | |
| −9.61 c | −7.2 | −9.02 | −7.39 | −8.93 | −7.44 | |
| Ala743 | −5.77 | −7.63 | −6.59 | −5.06 | −6.64 | −6.41 |
| 2.35 | 3.65 | 2.50 | 3.06 | 2.31 | 3.02 | |
| −3.72 | −4.33 | −4.43 | −2.41 | −4.66 | −3.74 | |
| Lys745 | −27.25 | −22.15 | −23.20 | −22.34 | −20.19 | −19.68 |
| 26.15 | 28.72 | 23.27 | 32.03 | 21.12 | 20.67 | |
| −2.05 | 5.83 | −0.88 | 9.07 | 0.34 | 0.36 | |
| Glu762 | −2.19 | 6.68 | 3.40 | −2.18 | 3.05 | 2.28 |
| 6.45 | 3.57 | 1.32 | 2.77 | 0.63 | −0.44 | |
| 4.22 | 10.27 | 4.70 | 0.56 | 3.66 | 1.82 | |
| Met766 | −3.41 | −1.79 | −3.83 | −2.98 | −2.43 | −2.31 |
| 1.97 | 1.28 | 1.34 | 1.81 | 1.02 | 1.56 | |
| −1.66 | −0.73 | −2.72 | −1.38 | −1.64 | −0.95 | |
| Cys775 | −1.92 | −2.12 | −2.25 | −2.42 | −1.77 | −2.09 |
| 0.60 | 0.91 | 0.81 | 1.02 | 0.61 | 0.82 | |
| −1.40 | −1.26 | −1.47 | −1.46 | −1.17 | −1.32 | |
| Leu788 | −1.47 | −4.96 | −1.47 | −1.86 | −2.20 | −5.04 |
| 0.80 | 1.40 | 0.05 | 0.90 | 0.72 | 1.33 | |
| −0.77 | −3.65 | −1.50 | −1.07 | −1.58 | −3.80 | |
| Met790 | −6.45 | −5.96 | −7.32 | −6.18 | −6.53 | −5.78 |
| 1.15 | 1.68 | 0.84 | 1.97 | 1.23 | 1.83 | |
| −5.96 | −4.88 | −7.08 | −4.92 | −5.94 | −4.64 | |
| Thr854 | −1.92 | −4.86 | −3.41 | −3.51 | −3.77 | −4.28 |
| 2.32 | 3.74 | 5.44 | 3.93 | 0.43 | 4.45 | |
| 0.05 | −1.52 | 1.58 | 0.13 | −3.78 | −0.15 | |
| Asp855 | −0.73 | 6.02 | 6.52 | −0.83 | −3.22 | −0.10 |
| 4.55 | 8.48 | 1.84 | 4.56 | 8.83 | 3.38 | |
| 3.55 | 14.00 | 8.21 | 3.33 | 5.18 | 2.86 | |
| Arg858 | −0.79 | −4.02 | −3.83 | −1.38 | −0.97 | 2.26 |
| −0.65 | 0.23 | −0.10 | −0.34 | −0.73 | 0.04 | |
| −1.44 | −3.78 | −3.94 | −1.74 | −1.70 | −2.22 |
© 2020 by the authors. Licensee MDPI, Basel, Switzerland. This article is an open access article distributed under the terms and conditions of the Creative Commons Attribution (CC BY) license (http://creativecommons.org/licenses/by/4.0/).
Share and Cite
E, J.; Liu, Y.; Guan, S.; Luo, Z.; Han, F.; Han, W.; Wang, S.; Zhang, H. How Different Substitution Positions of F, Cl Atoms in Benzene Ring of 5-Methylpyrimidine Pyridine Derivatives Affect the Inhibition Ability of EGFRL858R/T790M/C797S Inhibitors: A Molecular Dynamics Simulation Study. Molecules 2020, 25, 895. https://doi.org/10.3390/molecules25040895
E J, Liu Y, Guan S, Luo Z, Han F, Han W, Wang S, Zhang H. How Different Substitution Positions of F, Cl Atoms in Benzene Ring of 5-Methylpyrimidine Pyridine Derivatives Affect the Inhibition Ability of EGFRL858R/T790M/C797S Inhibitors: A Molecular Dynamics Simulation Study. Molecules. 2020; 25(4):895. https://doi.org/10.3390/molecules25040895
Chicago/Turabian StyleE, Jingwen, Ye Liu, Shanshan Guan, Zhijian Luo, Fei Han, Weiwei Han, Song Wang, and Hao Zhang. 2020. "How Different Substitution Positions of F, Cl Atoms in Benzene Ring of 5-Methylpyrimidine Pyridine Derivatives Affect the Inhibition Ability of EGFRL858R/T790M/C797S Inhibitors: A Molecular Dynamics Simulation Study" Molecules 25, no. 4: 895. https://doi.org/10.3390/molecules25040895